Abstract
This study examines the impact of Artificial Intelligence (AI)-enhanced Environmental, Social, and Governance (ESG) reporting on firm valuation in emerging markets. It aims to explore how AI integration enhances the interpretability and predictive accuracy of ESG metrics in shaping market perceptions and investor decisions. This study employs a panel dataset from 2018 to 2024, analysing publicly listed non-financial firms across five major sectors: manufacturing, energy, telecommunications, consumer goods, and industrials. This study contributed by employing AI-powered multimodal analysis with conventional ESG scoring methods and integrating Fixed-Effects Regression with machine learning (ML) algorithms including Extreme Gradient Boosting (XGBoost) and Random Forest to identify complex, non-linear relationships within ESG data and firm valuation. The results show empirical evidence that integrating ML enhances the explanatory power of ESG data. Findings indicate that ESG performance is positively correlated with higher market valuations, particularly in Environmental and Social dimensions. Governance metrics are more inconsistent, which may be due to heterogeneity in governance practices, regulatory enforcement and the challenges of quantifying governance quality beyond compliance indicators across the focus emerging markets. Firms identified in ESG controversies tend to face valuation penalties, which stresses market sensitivity to reputational risks. ML algorithms outperform conventional techniques in predictive accuracy, revealing complex, non-linear interactions within ESG data. This study contributes to both the academic literature and practice showing how next-generation ESG reporting can robust valuation models, address limitations of conventional ESG scoring, and ensure a reliable outlook for investors and policymakers of industries in emerging markets.
1. Introduction
Globally, organisations are increasingly recognising that delivering financial returns must be accompanied by transparent, credible, and strategic sustainability reporting (). Environmental, Social, and Governance (ESG) disclosures have moved beyond a compliance exercise to become a core driver of firm valuation, particularly in emerging markets where governance structures are evolving and stakeholder scrutiny is intensifying (; ). In such contexts, the quality, timeliness, and comparability of ESG information are frequently undermined by institutional voids, inconsistent reporting standards, and high information asymmetry ().
Artificial Intelligence (AI) offers a transformative potential to address these challenges by enhancing ESG data interpretation, standardisation, and predictive capability. While existing research demonstrates that robust ESG performance can positively influence firm valuation (; ; ), there is a critical gap regarding how AI integration into ESG reporting specifically influences investor perceptions, valuation accuracy, and reputational risk management in emerging markets (; ). Moreover, little is known about the relative contribution of AI-derived ESG attributes such as sentiment tone, linguistic complexity, and disclosure clarity, compared to traditional ESG scores.
This study addresses this gap based on the shortcomings on the existing ESG valuation research often depends on traditional linear models that fail to reflect the complex, non-linear dynamics of ESG performance, especially in the diverse contexts of emerging markets. This study employs a multimodal analytical approach that combines panel data econometrics and advanced machine learning algorithms to evaluate whether AI-powered ESG reporting provides a measurable valuation premium.
The empirical setting comprises five African emerging markets that span across manufacturing, energy, telecommunications, consumer goods, and industrial sectors. These markets were selected due to their diverse regulatory frameworks, irregular levels of digital adoption, and comparatively limited but increasingly available ESG reporting data. However, firms in these economies face mounting pressure to attract global capital while operating in environments where governance standards and sustainability practices are still evolving (). Therefore, this mix of factors positions the region as a suitable setting for evaluating the impact of AI-enabled ESG reporting on firm valuation within contexts of institutional diversity and technological gaps.
This study integrates Stakeholder Theory (), Signalling Theory (), and the Resource-Based View () as foundational frameworks. The findings have direct implications for investors seeking more accurate valuation models, policymakers aiming to strengthen ESG reporting standards, and corporate leaders navigating the strategic adoption of AI in sustainability communication. AI-enhanced ESG reporting reflects Stakeholder Theory by enabling firms to respond more transparently to diverse stakeholder expectations. It aligns with Signalling Theory through the disclosure of high-quality ESG information that communicates credibility and reduces information asymmetry in the market.
Finally, the Resource-Based View is advanced by demonstrating how AI-driven ESG capabilities can serve as strategic, hard-to-imitate resources that enhance competitive advantage. The findings, have direct implications for investors seeking more accurate valuation models, policymakers aiming to strengthen ESG reporting standards, and corporate leaders navigating the strategic adoption of AI in sustainability communication. The structure of the paper is as follows: Section 2 reviews the existing empirical literature, Section 3 outlines the data sources and methodology approach, Section 4 presents the main findings, Section 5 offers an in-depth discussion, and Section 6 concludes with key implications for policy.
2. Literature Review
The intersection of practices with firm valuation has gained increasing attention in emerging markets, where institutional voids, weak regulatory enforcement and high information asymmetry present unique challenges. Empirical studies have consistently found that firms with stronger performance tend to achieve higher market valuation, largely due to improved stakeholder trust and reduced capital constraints (; ).
In the context of African and Southeast Asian markets, ESG-compliant firms have demonstrated significantly higher Tobin’s Q and lower cost of equity () signalling a tangible link between sustainability transparency and firm value. Evidence from South Africa shows that integrated ESG improve investor confidence and is connected with higher market valuation, particularly in non-financial sectors (; ). Studies in Southeast Asia indicate that ESG disclosure strengthens firm reputation and reduces financing expenditures, but the effects often vary by industry and governance structures ().
The integration of AI into ESG reporting adds another dimension to this relationship. AI algorithms such as Natural Language Processing (NLP), Machine Learning (ML), and Automated ESG scoring enhance data accuracy, standardisation, and timeliness. According to (), gradient boosting and other ensemble methods have proven effective in improving prediction accuracy across complex financial datasets. Empirical evidence from Chinese listed firms shows that companies integrating AI into ESG disclosures not only achieve higher ESG ratings but also experience stronger institutional investment inflows and valuation premiums (). Complementary studies in Africa indicated that AI-driven analytics can help overcome data gaps and reporting inconsistencies, particularly in markets where ESG information and regulatory frameworks are disjointed (; ). However, systematic, multi-country and regulatory analysis in emerging markets remains limited, positioning this study to address that gap.
Despite this advancement, the literature examining AI-enhanced ESG reporting in emerging markets remains limited. Prior studies are often confined to single-country analyses or lack comparative models incorporating qualitative textual data (). This gap is pronounced in low- and middle-income economies, where the quality and credibility of ESG disclosures can vary significantly across sectors and governance regimes. AI algorithms hold the potential to bridge such disparities by introducing structure and standardisation to fragmented ESG narratives (). Moreover, there is a growing recognition that AI integration serves not only as a reporting tool but also as a strategic asset under the resource-based view (). Firms that deploy AI for sustainability analytics can leverage this capability for competitive differentiation, improving both reputational capital and market performance. Thus, the convergence of AI and ESG reporting in emerging markets presents a critical frontier for empirical exploration to accurately assess firm value implications.
2.1. Theoretical Review
This study draws upon three complementary perspectives such as Stakeholder Theory, Signalling Theory, and the Resource-Based View (RBV) to explain how Artificial Intelligence (AI)-integrated ESG reporting can influence firm valuation in emerging markets. Stakeholder Theory posits that transparent and credible ESG reporting aligns corporate behaviour with stakeholder expectations, enhancing legitimacy, trust, and long-term value creation (; ). In emerging markets, where institutional frameworks may be underdeveloped, AI integration can strengthen this alignment by improving the timeliness, accuracy, and standardisation of ESG disclosures (). For instance, AI-enabled sentiment analysis and controversy monitoring can proactively address stakeholder concerns, reduce reputational risk and increase investor confidence (). Thus, within the stakeholder perspectives, AI acts as a mechanism that deepens engagement quality and demonstrates responsiveness to both financial and non-financial stakeholder priorities.
Signalling Theory explains how firms convey unobservable attributes such as governance quality, managerial competence, and strategic foresight through observable actions (). AI-powered ESG reporting can serve as a high-credibility signal, reducing uncertainty for investors and analysts (). Advanced technologies such as NLP and ML enhance disclosure consistency, detect anomalies, and reduce the likelihood of greenwashing, thereby increasing the trustworthiness of ESG signals (). The market may interpret AI adoption in ESG reporting not only as a commitment to transparency but also as an indicator of innovation readiness and adaptability, both of which can command a valuation premium ().
The Resource-Based View (RBV) frames AI-enhanced ESG reporting capabilities as strategic intangible resources that are valuable, rare, inimitable, and non-substitutable (). AI integration in ESG analytics allows firms to extract insights from unstructured sustainability data, automate disclosure processes, and identify environmental or social risks more effectively than competitors (). These capabilities can be embedded into organisational routines, creating sustained competitive advantage that influences both operational performance and market valuation. From an RBV perspective, AI is not merely a disclosure tool but a capability that can be leveraged for strategic differentiation in markets where competitors lack similar technological sophistication (). However, combining these three theoretical perspectives, AI-integrated ESG reporting can be understood as a composite mechanism in which stakeholder alignment enhances organizational legitimacy, credible disclosures reduce informational asymmetries in capital markets, and AI-driven ESG capabilities operate as rare, inimitable resources; these dynamics converge to reinforce investor confidence and support sustained valuation advantages.
2.2. Hypotheses Development
This study grounds its hypotheses in three complementary theoretical perspectives, including Stakeholder Theory, Signalling Theory and Resource-Based View. These theories offer a foundational understanding of how artificial intelligence (AI) integrates into ESG reporting and might influence firm valuation, particularly in emerging markets. First, stakeholder theory emphasises the importance of transparent communication between firms and their stakeholders (). However, when organisations disclose ESG performance clearly and reliably, they address the informational needs of investors, regulators, and civil society, which can enhance reputation and legitimacy (; ). In this study, incorporating AI into ESG reporting processes improves the precision, frequency and credibility of sustainability disclosures. This is valuable in emerging markets where institutional systems lack robustness (; ). Research has shown that firms with more advanced ESG transparency tend to attract investor confidence and may experience stronger valuation metrics (; ). Based on the reviewed literature, this study posits the first hypothesis as follows.
H1.
Firms that adopt -integrated reporting will exhibit a positive and significant effect on firm valuation.
Second, signalling theory purview that, firms that voluntarily adopt advanced technologies such as in their disclosures send credible signals to the market about their commitment to accountability and innovation (). These signals can reduce perceived risks and information asymmetry, especially in environments where traditional reporting mechanisms are weak (). The presence of AI in sustainability reporting may act as a proxy for managerial quality and strategic foresight (; ), leading to improved market perceptions and firm valuation.
The resource-based view extends this logic by viewing AI-powered ESG reporting capabilities as strategic intangible assets. Thus, such capabilities, especially when rare, valuable and difficult to replicate, can yield sustainable competitive advantage (; ; ). Firms that leverage AI for ESG-related data analysis, sentiment monitoring and risk detection gain efficiencies and insights that others may not possess. This can enhance both operational performance and stakeholder engagement. Moreover, AI-enhanced ESG features, such as NLP-derived sentiment, ESG controversy monitoring and textual complexity, can also strengthen the predictive accuracy of valuation models by capturing significance. Based on the reviewed literature, this study proposes the second hypothesis as follows.
H2.
-derived ESG features significantly improve the accuracy of firm valuation predictions.
2.3. Research Gap
While prior studies have established links between ESG reporting and corporate valuation, they largely concentrate on conventional ESG performance scores and disclosure indices. These approaches often overlook the potential of artificial intelligence (AI) to enhance the depth, consistency, and clarity of sustainability communication. In particular, little is known about how AI-enabled tools such as textual analytics, sentiment analysis, and readability measures can be integrated into valuation models. Furthermore, the application of AI-enhanced ESG metrics within machine learning frameworks to forecast firm value remains underexplored. This gap focuses on emerging markets, where regulatory standards and transparency mechanisms are evolving. By incorporating AI-powered ESG attributes into both econometric and predictive modelling approaches, this study addresses these limitations on how technology-driven reporting practices shape market perceptions and valuation accuracy.
3. Data and Methods
3.1. Sample Selection
This study employed longitudinal analysis and integrated econometrics approaches with AI-driven analytics to examine the impact of artificial intelligence in ESG disclosure. Table 1 shows the distributions of firms by country and selected industries. The sample comprises of selected non-financial sectors from five African countries, including South Africa (SA), Nigeria (NG), Egypt (EG), Kenya (KE) and Morocco (MA), particularly, SA and NG countries were prioritized due to their relatively advanced financial systems and established ESG disclosure frameworks (; ). Other countries, such as Egypt, Kenya and Morocco, were included to ensure institutional and regional diversity, thereby enhancing the external validity of findings across different regulatory and economic contexts (). Financial sectors such as banks and insurers were not considered due to their distinctive capital structures and advanced specific disclosure regulations.

Table 1.
Distribution of Firms by Country and Industry.
However, manufacturing sectors such as energy, telecommunications, consumer goods and industrials were selected due to their significant ESG exposure and growing reliance on technological innovation in disclosure reporting. Previous literature has identified these sectoral vulnerabilities to environmental and social scrutiny, which increases the demand for transparency in ESG communication (; ). Furthermore, companies were considered if they typically satisfied these two conditions: (i) consisting of reporting of ESG and financial performance data for at least three consecutive years, and (ii) disclosed information at a level that allowed classification of their reporting practices. Finally, the study sample consists of 120 listed companies, which eventually generates 1200 firm-year observations. This sample size is adequate for both econometric estimation and supervised machine learning (). Table 1 presents the distribution by country and industry.
3.1.1. AI Integration Classification
Table 2 shows the AI-Integration classification. The classification is categorised into three dimensions, as shown in Table 2.

Table 2.
AI-Integration Classification.
AI-Integration Disclosures
AI integration is identified from the annual and sustainability reports of the firms. The process was derived from systematic text review analysis using automated text-mining techniques with systematic qualitative coding. The study employed keyword-based search phrases such as “machine learning,” “natural language processing,” “automated ESG scoring,” and “AI-driven analytics.” However, to reduce the risk of false positives of mentions of AI in contexts unrelated to ESG, a contextual filtering rule was applied, ensuring that AI-related terms were only retained when they appeared alongside sustainability-related concepts such as “ESG,” “sustainability,” “reporting,” “disclosure,” or governance.
AI-Integration NLP Scoring
In this study, NLP scoring was implemented by combining automated keyword detection, rule-based contextual checks, and frequency validation, which collectively converted unstructured corporate texts into a standardised indicator of AI-related engagement in ESG reporting. Python 3.13.3 libraries, including Natural Language Toolkit (NLTK), spaCy, and regular expressions (regex), were employed for preprocessing, keyword identification and contextual filtering. Annual reports were transferred into NVivo for structured content analysis.
AI-Integration Manual Coding
After automated text mining and contextual filtering, a manual coding process was applied to verify and classify AI integration. The filtered disclosures were imported into NVivo for structured qualitative analysis. Researchers examined the extracted passages to determine whether mentions of AI technologies (e.g., machine learning, NLP, automated ESG scoring) were explicitly connected to ESG reporting practices. Each firm was then assigned a binary code:1 (AI-integrated): when disclosures contained clear, verifiable evidence of AI use in ESG reporting. 0 (Non-AI-integrated): when no such evidence was found. To ensure reliability, a subsample was double-coded, and consistency was assessed using Cohen’s Kappa and Krippendorff’s Alpha; coefficients above 0.75 were treated as satisfactory benchmarks of agreement (). This procedure minimised subjectivity and enhanced the credibility of the classification.
Table 3 shows the distribution of AI-Integrated firms by country and industry. However, out of the 120 firms being selected 48 firms were classified as AI-integrated. Table A1 shows the scalable parameters for AI-Integation.

Table 3.
Distribution of AI-Integrated Firms by Country and Industry.
3.2. Variable Specifications
Table 4 presents the variable definitions and measurements by the study. Tobin’s Q and the Market-to-Sales (M/S) ratio are dependent variables to measure the valuation effect of ESG disclosure. The independent variables are divided into two main categories: Traditional ESG metrics and AI-Integrated ESG disclosure indicators. Traditional ESG scores, including both aggregate and component scores (environmental, social, governance), are presented as percentile rankings. AI-Integrated ESG disclosure incorporates binary computation, including text analytics such as sentiment polarity via Latent Dirichlet Allocation (LDA), linguistic complexity and readability scores of ESG disclosures. The framework includes control and macroeconomic variables, which include total assets (logged), return on assets (ROA), percentage of institutional ownership, GDP growth rate, and inflation.

Table 4.
Variable Definitions and Measurements.
3.3. Natural Language Processing (NLP) Feature Extraction Framework
Figure 1 depicts the process of applying Latent Dirichlet Allocation (LDA) to a set of documents (corporate ESG reports, ESG filings and corporate press releases). The method identifies uncovered topics by grouping frequently co-occurring words, producing a collection of topics where each topic is a probability distribution over words, and each document is a probability distribution over topics. This approach enables the systematic detection of disclosure patterns, thematic priorities, and shifts in narrative focus within large volumes of unstructured ESG text (; ).
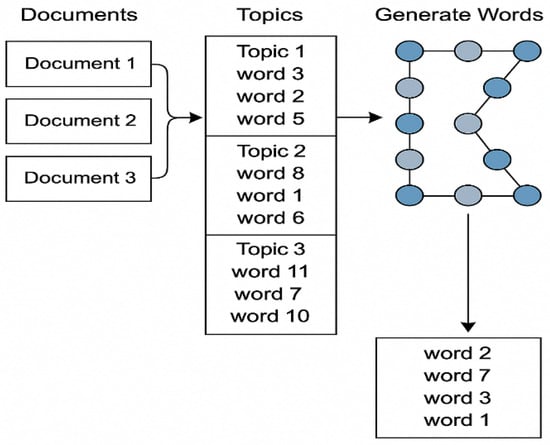
Figure 1.
LDA Based Workflow for Topics Modelling.
3.3.1. Topic Taxonomy
Table 5 shows the topic taxonomy, which was constructed using an LDA architecture to extract an ESG-focused textual corpus. Narratively, Topic 0 was linked to the Environmental pillar and titled ESG-Linked Performance and Compliance, as it contained terms related to performance indicators tied to ESG objectives, executive pay structures, supply chain oversight, fair labour enforcement, and audit mechanisms. Topic 1 corresponded to the social pillar; subthemes such as Community Engagement and Workforce Development due to its focus on CSR initiatives, local community programs, educational and healthcare contributions, and workforce training or upskilling. Topic 2, categorised as the Governance pillar, which was sub-labelled as Governance, Transparency and Data Security, reflects strong associations with board independence, corporate transparency, environmental monitoring tools, compliance protocols, privacy safeguards, and information security practices. This taxonomy procedure offers a systematic means of organising ESG-related themes, translating unstructured text into interpretable categories, and bridging qualitative disclosure content with measurable ESG performance indicators (). Dynamic Topic Modelling (DTM-lite) applied to corporate disclosures. Dynamic Topic Modelling (DTM-lite) was used to analyse the descriptive statistics of topic evaluation over the year, as displayed in Table A2 in the Appendix A.

Table 5.
Topic Modelling Extraction.
3.3.2. Textual Indexes
Table 6 reports computational textual indexes derived from ESG-related disclosures, including sentiment scores, linguistic complexity, and readability metrics. Sentiment was measured using the VADER (Valence Aware Dictionary and sEntiment Reasoner) model, which calculates polarity scores on a scale from 1 (strongly negative) to +1 (strongly positive). Each score was weighted by topic proportions identified through Latent Dirichlet Allocation (LDA). Hence, LDA is a generative probabilistic model used to uncover hidden thematic structures (topics) in a collection of documents. It assumes that: Each document is represented as a set of topics. Each topic is distributed over words ()

Table 6.
Descriptive Statistics of Textual Indexes.
In the LDA framework, denotes the -th word in document while represents the latent topic variable. The term = expresses the probability of topic occurring in document = captures the probability of word www being generated given topic . Linguistic complexity was assessed through the Index, capturing sentence variation and vocabulary richness as indicators of disclosure sophistication. Readability was evaluated using the Gunning Fog Index (GFI), which estimates the years of formal education required for comprehension; higher scores denote less accessible disclosures. GFI is computed as:
This integrated approach combines sentiment polarity, thematic weighting, complexity, and readability to provide a more nuanced measure of ESG disclosure quality (; ). The ESG Controversy Score measures the extent and intensity of adverse incidents linked to a company’s environmental, social, and governance conduct. Because larger controversy values denote heightened reputational and regulatory risks, the metric is transformed using a 100 − score, allowing higher adjusted values to represent stronger ESG performance. Mathematically, Adjusted ESG Controversy Score = 100 − Raw Controversy Score.
3.4. Predictive Analytics Framework
Figure 2 presents the structured multi-phase predictive analytics framework used to examine the effect of AI-integrated ESG reporting on firm valuation. The framework was classified into three phases: (1) Data collection and processing, (2) Feature Engineering and selection, and (3) Model evaluation and Interpretation. In the first phase, data were processed and verified. The second phase involved data featuring, the generation of a sample size. This model was trained using a five-fold cross-validation strategy to reduce overfitting and ensure robustness across different data splits; also, a grid search approach was applied to fine-tune key hyperparameters. The third phase focuses on model performance using the Coefficient of Determination (R2) to explain explanatory power. Root Mean Square Error (RMSE) was used to capture prediction variance, and Mean Absolute Error (MAE) to assess overall forecast accuracy. SHAP (Shapley Additive Explanations) was employed to interpret the contribution scores of each input variable for individual predictions.
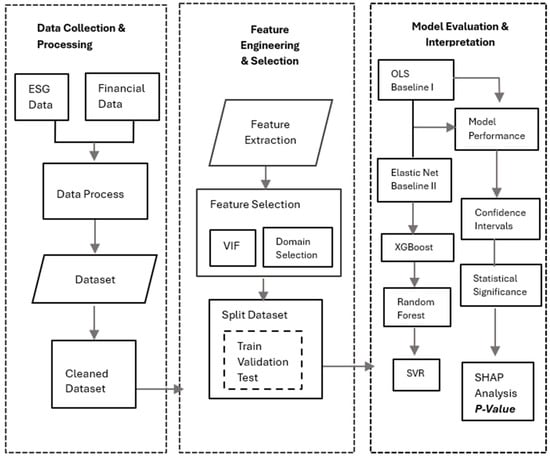
Figure 2.
Methodological framework.
3.5. Econometric Model Specifications
Model 1 (H1): The specification model is expressed as follows:
where Equation (3) is the baseline model which shows the impact of AI-integration in ESG disclosure on firm valuation, including (firm valuation for firm i in year t, proxied by Tobin’s Q and Market-to-Sales (M/S) multiple). (binary indicator equal to if firm i discloses use of AI in ESG reporting in year t). (ESG-related metrics, including aggregate ESG score, pillar scores (ESG), and controversy indicators). (firm-level controls included log of total assets, return on assets, institutional ownership). (macroeconomic controls at the country level, such as GDP growth, inflation).
Equation (4) extended the first model with AI-derived textual indicators to examine the incremental explanatory power of AI-driven ESG disclosure characteristics. includes sentiment score (either positive or negative tone of ESG reports). Sustainability Topics (topic proportions identified via Latent Dirichlet Allocation). Linguistic complexity Index (clarity of disclosure). This specification enables testing of the textual qualities of ESG communication captured by AI techniques, which influence firm valuation above the binary adoption of AI tools. Equation (5) is the interactive effects model, where captures whether firms with AI-enhanced ESG reporting obtain stronger valuation benefits from ESG scores compared to firms without AI adoption.
Model 2 (H2): Machine Learning (ML)-Based Forecasting Framework: The study estimates two complementary learners:
- (A)
- Elastic Net (linear, sparse and stable)
- (B)
- XGBoost (nonlinear, interactions)
Note: is the additive ensemble of trees .
Hence, Equations (6) and (7), estimates the feature sets of ML evaluation models, including: which donate firm ’s valuation in year We forecast one year ahead: . Where contains predictors observed at (Robustness: years ahead). Baseline feature : firm size (log assets), ROA, Institutional ownership, traditional ESG (aggregate and E/S/G Pillars) controversy indicator, macro controls (GDP growth, inflation), and dummies for country X, industry and year. Augmented features : plus AI-related ESG inputs: AI-Integrated (0/1), Sentiment (standardised), Readability and Complexity indices (Fog and lexical diversity) and Topic proportions from LDA . Thus, all covariates are lagged to prevent look-ahead bias; text features are built from reports released in or before year
Model Comparison Evolution
In this study, three machine learning models were used to evaluate predictive performance using error and fit metrics. The model includes:
- Coefficient of determination (Out-of-Sample):
- ii.
- Root Mean Squared Error:
- iii.
- Mean Absolute Error:
4. Empirical Results
4.1. Descriptive Analysis
Table 7 shows that firms across five African nations, including South Africa, Nigeria, Egypt, Kenya, and Morocco, reveal distinct differences in corporate valuation, ESG reporting standards and the use of AI tools. South African firms exhibit the strongest valuation metrics, with the highest average Tobin’s Q (1.32) and Market-to-Sales ratio (2.85), suggesting greater investor trust and resource efficiency. These companies also lead in ESG performance, consistently scoring highest across environmental, social and governance metrics likely due to more mature regulatory systems and active stakeholder engagement. However, they also face more ESG-related controversies, which could stem from their greater public exposure and detailed reporting. South Africa demonstrates the most advanced integration of AI in ESG disclosures, including technologies such as machine learning or natural language processing. Kenya and Morocco remain relatively limited. Textual analysis of ESG reports reveals that South African firms communicate with greater clarity, sentiment strength and thematic variety. These patterns correlate with stronger fundamentals such as firm size, profitability and institutional ownership, as well as favourable economic conditions; moderate inflation and GDP stability. Thus, firms in Morocco and Kenya show less maturity in ESG practices, AI usage and valuation performance.

Table 7.
Country-Level Descriptive Statistics.
Table 8 provides an overview of the central tendency and variability across firms in the sample. The average Tobin’s Q of indicates that firms have market values that exceed their book values. This result suggests positive investor sentiment and growth potential. The Market-to-Sales has a mean of which reflects that firms’ ability to generate substantial market value relative to their sales. The average ESG overall score is , which is a balanced score across the Environmental Social and Governance pillars. This highlights moderate ESG performance with governance being the strongest component.

Table 8.
Descriptive Statistics.
The ESG Controversy Indicator has a mean of , showing that ESG risks are not negligible across the sample. AI integration into ESG reporting is still emerging, with an average adoption rate of suggesting that fewer than one in four firms currently use AI-based ESG disclosures. Sentiment analysis of ESG narratives reveals a modest average score (0.11), indicating a generally neutral tone, while the sustainability topic (via ) averages at 0.24. Textual analytics show moderate complexity and readability levels, with a mean linguistic complexity index of and a readability score of 15.1. Firm size ) centres around with profitability () at 5.94%, and institutional ownership averaging 36.16%. The macroeconomic environment is relatively stable, with growth averaging and inflation around
4.2. Correlation Analysis
Table 9 presents the outcomes of both correlation and multicollinearity assessments for the study’s independent variables. Variance Inflation Factor () results highlight moderate multicollinearity among key ESG dimensions, specifically Environmental (), Social (), (), and the composite ESG Score (). These figures indicate substantial overlap due to the inherent interdependence of ESG sub-components. Thus, the simultaneous inclusion of all four in regression analysis could compromise model robustness. Moreso, AI-related disclosure variables including —Integrated ESG Reporting (), (), and Linguistic Complexity () exhibit low values, suggesting minimal collinearity and supporting their inclusion in multivariate estimation without distorting coefficient precision.

Table 9.
.
The Pearson correlation matrix further supports this view, showing strong correlations between the Overall ESG Score and its sub-elements: environmental (), (r = ), and (r = 0.80). Meanwhile, the presents a negative association ) with all ESG metrics, this indicates that reputational risks are inversely linked to ESG quality. The AI-Integrated ESG variable correlates moderately with both (r = ) and textual complexity (r = ), reflecting distinction and strategic disclosure. Larger firms and those with higher institutional ownership also demonstrate stronger ESG engagement, with firm size and institutional holdings showing correlations of 0.45 and 0.50, respectively.
4.3. T-Tests Analysis
Table 10 shows the results of a t-test comparing firms that incorporate AI into their ESG disclosures with those that do not. The analysis reveals statistically significant differences in both firm valuation and ESG disclosure characteristics. Companies leveraging AI report a significantly higher average (1.39) compared to non-AI firms (1.16), with a mean difference of 0.23 (t = 9.12, p < 0.001). The associated of 0.60 indicates a moderate to large effect size, suggesting that markets may assign a valuation premium to firms demonstrating technological sophistication in sustainability reporting. In ESG performance, AI-integrated firms also outperform their counterparts, recording an average for non-AI firms (t = , p < ), with of , representing a large effect.

Table 10.
Univariate Analysis: t-Tests.
derived from ESG text further distinguish the groups: AI firms average 0.18, while non-AI firms score 0.09 (t = , p < 0.001), with a reflecting a moderate effect. This could be attributed to the use of NLP and machine learning techniques that frame content more positively or emphasize strengths. Moreover, in ESG reporting is strongly higher for AI-integrated firms ( vs. ; t = , p < ), and the effect size (Cohen’s d ) suggests a moderate difference, possibly due to AI-generated content or the inclusion of more technical ESG language. However, this complexity may signal professionalism and depth and it could also limit accessibility for non-specialist stakeholders.
Figure 3 show the firm valuation and AI-ESG reporting. The left chart presents a boxplot illustrating the distribution of Tobin’s Q for companies that apply AI in ESG reporting versus those using conventional approaches. Firms with AI-enhanced ESG practices generally report higher median valuation scores, suggesting potential investor preference or perceived strategic advantage. The right bar chart highlights the proportion of firms adopting AI-driven ESG reporting across selected African countries, showing South Africa as the leader, with Egypt and Nigeria indicating differences in digital ESG adoption across regions.

Figure 3.
Firm Valuation and AI-Driven ESG Reporting by Country.
4.4. Baseline Regression Results
Table 11 shows the result of regression analysis using Panel A and Panel B to explain the four models’ performance. In Panel A, which uses the as the dependent variable, Model 1 begins with only the binary variable for -integrated ESG reporting and . The coefficient on AI with indicates a strong positive relationship with , and the model achieves an . However, without controlling for other factors, this baseline model is limited in explanatory depth. Model 2 introduces the ESG Overall Score, firm size (log of total assets), and return on assets (ROA). These additions improve explanatory power of and the AI coefficient remains significant at . This result suggests that both ESG performance and firm-specific fundamentals contribute significantly to market valuation. In Model 3, macroeconomic controls such as GDP growth and inflation, textual variables such as sentiment, topic diversity, linguistic complexity and firm fixed effects are included.

Table 11.
Regression Analysis Results. Panel A: .
This results in a substantial increase in , with the AI variable still positive and significant at . Model 4 integrate the interaction term between AI and ESG scores. Although, the interaction is not statistically significant, maybe due to unpronounced AI adoption and immaturity in ESG reporting framework. AI coefficient at and ESG score at maintain their significance. The model’s descriptive power improves to and an , suggesting the most robust specification in Panel A.
Table 12 shows the results of Panel B, the model employed Market-to-Sales Multiple as the dependent variable. Model 1 includes only the AI indicator, yielding an and a coefficient of indicating a comparable valuation premium. Adding ESG scores and firm controls in Model 2 raises the , with the AI effect still significant at Model 3 incorporates qualitative and macro variables, increasing the The AI coefficient remains significant at which highlighting its consistent influence. Finally, Model 4 which include the interaction term, which again does not reach significance. Nevertheless, the AI variable at continues to exert a meaningful positive effect, with an and . Across both panels, the stepwise inclusion of ESG scores, financial data, macroeconomic indicators, and AI-enhanced text features significantly improves model performance. However, the consistent significance of the AI indicator throughout all models confirms its strong association with higher firm valuation, independent of ESG score levels. This result suggests that investors may perceive AI-enabled ESG reporting as a signal of transparency, innovation and governance quality. The failure of the interaction term to reach significance implies that while both ESG and AI independently enhance firm value, their combined presence does not produce a synergistic effect.

Table 12.
Panel B: Dependent Variable-Market-to-Sales Multiple.
4.5. Robustness Tests
Table 13 shows the result of robustness and endogeneity analyses. uses a two-stage least squares (2SLS) instrumental variable approach to address potential endogeneity between firm value and AI-integrated ESG practices. Thus, the instruments lagged AI ESG scores and the Oxford AI Readiness Index are both externally relevant and statistically strong, as indicated by first-stage F-statistics . The results show that predicted AI-driven ESG activity significantly improves firm valuation. Specifically, firms with higher levels of AI-integrated ESG show an increase in Tobin’s Q at and in M/S multiple at , with both results statistically significant at the level. The ESG overall score also has a positive, independent effect, suggesting that both the quality of ESG performance and the way it is managed through AI systems matter to investors. tests the robustness of this relationship using Propensity Score Matching (), which allows for a comparison of firms with similar characteristics aside from their use of AI in ESG practices. Matching variables include firm size, profitability, institutional ownership and key macroeconomic indicators like GDP growth and inflation.

Table 13.
Robustness and Endogeneity analysis.
The analysis shows that AI-using firms consistently achieve higher valuation outcomes. Under Nearest Neighbor matching, the average treatment effect on Tobin’s Q is and on the M/S multiple is , both highly significant. Kernel matching delivers nearly identical estimates, reinforcing the finding that the valuation difference is not simply a reflection of underlying firm traits but is plausibly attributable to the use of AI in ESG. further tests the relationship using lagged independent variables to capture whether AI-ESG integration has a sustained effect on future firm value. The lagged model confirms that firms with AI-driven ESG reporting in the prior period tend to have higher market valuation in the current period. The effect remains statistically significant, with coefficients of for Tobin’s Q and for M/S multiple. However, lagged ESG score is also significant, its impact is more modest, suggesting that the integration of AI offers an additional boost in credibility, transparency and performance that investors reward over time. These results offer consistent empirical support for the idea that AI-enhanced ESG reporting is not only beneficial for sustainability disclosures but also contributes directly to a firm’s financial market value.
4.6. Model Evaluation of Predictive Analytics
Table 14 shows the descriptive information including the minimum, maximum and the mean values for the dataset employed for the prediction across train, validation and test subsets. This result provides the statistical information about the distribution and characteristics of dataset. Table 15 shows the model performance of predictive models for estimating firm valuation. The comparison evaluation indicates that XGBoost delivers the most robust performance in attaining the highest score of ) alongside the lowest RMSE and MAE values.

Table 14.
Descriptive data statistics.

Table 15.
Comparison of Model Performance.
These results were found to be statistically superior to all other models, including Random Forest, as confirmed by a Wilcoxon signed-rank test ). Random Forest itself demonstrated reliable predictive capabilities with an of and significantly outperformed the Elastic Net model underscoring its ability to capture nonlinear relationships in the data. Elastic Net, which balances L1 and L2 penalties, achieved an of and showed a meaningful enhancement over the OLS baseline ( paired t-test), validating its suitability for correlated and high-dimensional variables.
Conversely, Support Vector Regression (SVR) exhibited only a marginal increase in explanatory power ( = ) and did not yield statistically significant improvement over OLS (), suggesting limited applicability in this particular setting. Overall, these results reinforce the empirical value of ensemble learning algorithms particularly XGBoost and Random Forest in improving prediction accuracy when modeling firm value in conjunction with AI-enhanced ESG data (; ). Table A3 in the Appendix A show the feature selected datasets.
Figure 4 presents a comparative performance analysis of five predictive models based on scores, , and Among the evaluated models, XGBoost stands out by achieving the highest predictive accuracy and lowest error margins, followed closely by Random Forest and Elastic Net. In contrast, OLS Linear and SVR models exhibit weaker predictive capabilities, suggesting their limitations in modeling complex firm valuation using AI-integrated ESG data.
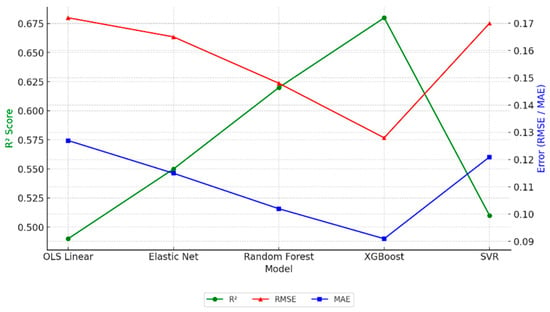
Figure 4.
Model Performance Comparison.
4.6.1. Classification Tasks
Table 16 presents the results of the XGBoost classifier, which demonstrates strong predictive effectiveness across primary evaluation metrics, although it falls slightly short of certain benchmark thresholds. The classification accuracy reached 96.8% (±0.3%), close to but below the 98.5% benchmark commonly referenced in financial anomaly detection research as shown in Figure 5. The model achieves a strong F1 score of 0.975, yet it falls short of the required benchmark of 0.99. The observed variation of ±0.01 indicates that, in some iterations, the score approaches the target as displayed in Figure 6. Class-specific results show Precision for Class 1 at 0.935 (±0.01), modestly below the 0.96 value targeted in industry audit compliance standards (Figure 7), while Recall for Class 1 (Figure 8) achieved near-perfect sensitivity at 0.996 (±0.00), aligning with the importance of capturing rare but high-risk ESG-related events (). The ROC-AUC score of 0.987 (±0.01) confirms excellent discrimination, albeit slightly below the >0.99 target often regarded as the gold standard in high-stakes financial prediction tasks (). Collectively, these results reinforce XGBoost’s suitability for complex ESG valuation contexts, particularly in balancing precision and recall under heterogeneous disclosure conditions.

Table 16.
Target Performance Benchmarks.
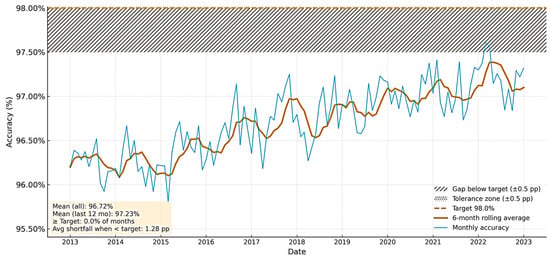
Figure 5.
XGBoost Accuracy Over Time vs. Target Threshold.
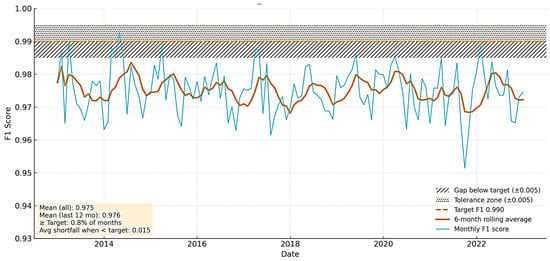
Figure 6.
F1 Score Over Time vs. Target Threshold.
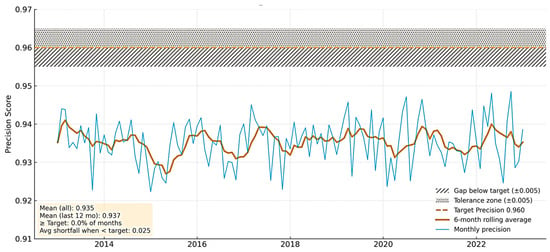
Figure 7.
Precision (Class 1) Over Time vs. Target Threshold.
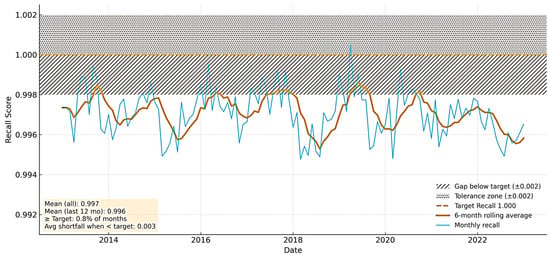
Figure 8.
Recall (Class 1) Over Time vs. Target Threshold.
4.6.2. Feature Importance and Classification Performance
The SHAP analysis as shown in Figure 9 highlights the key drivers of firm valuation predictions. The AI-Integrated ESG Indicator shows the highest impact (), suggesting that firms using AI in ESG reporting are linked to higher predicted valuations. ESG Score also contributes strongly (), reinforcing the importance of sustainability performance. Financial indicators like ROA () and firm size () have moderate influence, while variables such as institutional ownership, Rand & D intensity, industry, and GDP growth show lower predictive importance.
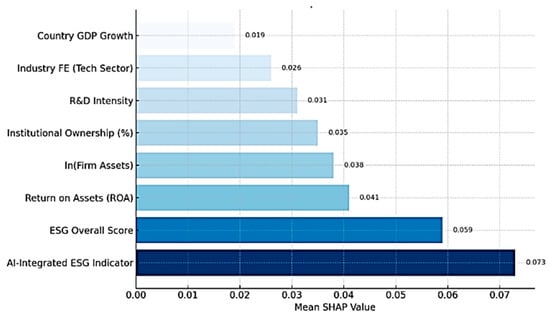
Figure 9.
SHAP Analysis.
Figure 10 show the industry feature contributions across five industries. In Manufacturing and Industrials, AI-Integrated ESG is the dominant driver (), with ROA and R&D playing supportive roles. In Energy, AI-ESG () still leads, though financial factors have less weight. Consumer Goods firms show equal influence from AI-ESG and ROA both at , thus, R&D is less significant. In Telecommunications, R&D has its highest impact at , reflecting the sector’s focus on innovation with AI-ESG and ROA also contributing significantly.
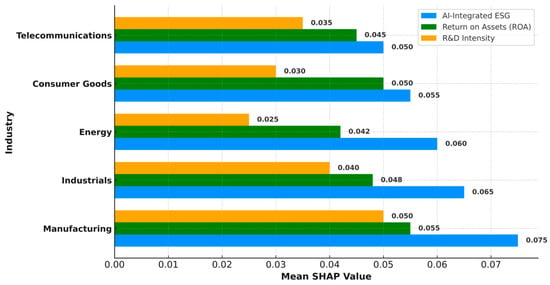
Figure 10.
Industry Feature.
4.6.3. Confusion Analysis
Figure 11 shows the confusion matrix of performance evaluation tools. This technique was popularised in machine learning by (). This analytical framework is designed to evaluate the predictive performance of classification models by actualising correct and incorrect predictions across defined classes. However, this study adopted a confusion matrix to pragmatically evaluate the classification capacity of the AI-integrated ESG model in distinguishing between firms with AI-enhanced and non-AI ESG reporting practices.
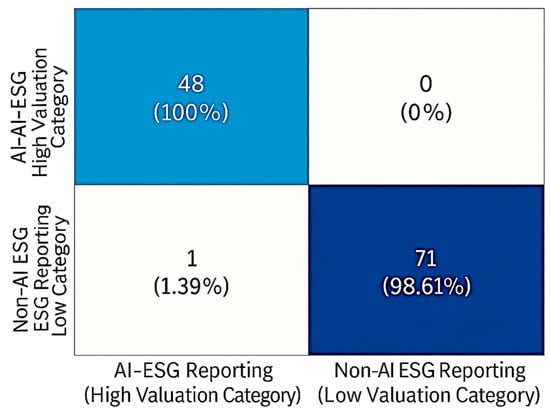
Figure 11.
Confusion Matrix: Predictive performance.
The method was selected due to its ability to provide a comprehensive view of the model’s discriminative power through key metrics such as accuracy, precision, and recall to validate the robustness and practical applicability of predictive models (). The model demonstrated near-perfect classification accuracy; it accurately identified all 48 firms with AI-integrated ESG reporting as belonging to the high-valuation category and accurately classified 71 out of 72 non-AI-reporting firms in the lower valuation category, with only one misclassification. These results estimate the model’s ability to distinguish firms based on the quality and technological advancement of their ESG disclosure practices, as linked to firm valuation outcomes. Table A4 in the Appendix A shows the descriptive analysis of the confusion matrix.
5. Discussion of Findings
5.1. Theoretical Contributions
This research improves the literature by confirming that firms integrate AI tools into their ESG reporting procedure to achieve a scalable valuation advantage in developing markets. Thus, the results strengthen arguments from signalling theory, as AI-based disclosures appear to function as credible markers of transparency, innovation capability, and managerial effectiveness. Furthermore, the evidence that ensemble learning techniques, such as XGBoost and Random Forest, produce more reliable predictions than linear models indicate the need to account for non-linear dynamics in the ESG valuation relationships. These findings extend both resource-based and stakeholder perspectives by highlighting the implications of digital competencies in amplifying the value of sustainability practices.
5.2. Managerial Implications
Findings indicate that AI-enhanced ESG reporting is more than a compliance measure; it serves as a strategic avenue for improving a firm’s reputation and market value. Investors assign higher valuations to companies that adopt advanced analytical methods in sustainability communication. Managers should also pay attention to the textual characteristics of their reports. For instance, positive sentiment and moderate linguistic sophistication tend to strengthen investor confidence, whereas excessive complexity may create barriers for broader audiences. This suggests the need to balance technical rigour with accessibility when designing ESG disclosures. AI-enhanced ESG reports often employ more complex language, signalling credibility but potentially limiting accessibility for smaller investors or less technical stakeholders. This raises inclusivity concerns, as institutional actors are better positioned to benefit.
5.3. Policy Relevance
The study underlines that digital reporting innovations and AI-driven disclosure mechanisms can narrow persistent transparency gaps in sustainability communication. Thus, by improving the reliability and comparability of ESG data, such an apparatus underpins investor trust, encourages more efficient capital flows, and promotes fairer market dynamics. The pronounced effects linked to Environmental and Social valuation indicate that regulators should give adequate attention to these areas in guiding responsible business conduct and ensure alignment with international sustainability priorities.
On the same hand, the sanctions observed for firms entangled in ESG controversies signal the urgency of stronger oversight and standardised disclosure practices to discourage greenwashing and protect market stability. Therefore, effective policy responses should include mandatory, verifiable, and timely ESG reporting, complemented by incentives for organisations adopting advanced digital solutions. In this context, regulators can uphold accountability, strengthen market resilience, and foster closer integration between corporate behaviour, investor expectations, and long-term development objectives.
5.4. Limitations and Further Research
The study is limited in its approach, and the analysis is restricted to non-financial firms in emerging markets, which may limit the generalizability of the results to financial institutions or developed economies. It also depends on secondary ESG data, which raises concerns about measurement consistency, reporting biases, and cross-country comparability. Future research could extend the scope to include cross-market comparisons, sector-specific analyses, and investigate whether interaction effects become more pronounced as AI adoption in ESG matures and regulatory frameworks evolve. Alternative AI techniques, such as integrating readability checks and deep learning models to uncover additional perspectives.
6. Conclusions
This paper assessed how the AI in ESG reporting influences the valuation of firms operating in the selected African countries. The study found that technology-assisted disclosures improve the explanatory depth of ESG data and valuation predictions. Thus, companies that integrate AI tools in their sustainability communication tend to achieve stronger valuation outcomes, particularly when environmental and social performance is emphasised. In contrast, governance-related indicators were less reliable predictors; the findings suggest that their influence depends heavily on institutional and reporting contexts. The results further revealed that exposure to ESG controversies significantly undermines firm value, which underscores the financial consequences of reputational risk. However, the results showed that textual elements such as tone, clarity, and complexity contribute valuable insights, demonstrating that the way sustainability information is communicated can affect how it is interpreted by the market. This study is limited by its focus on five African markets, which restricts the generalizability of the findings to other regions. The use of secondary ESG databases and corporate disclosures may also introduce reporting biases and inconsistencies. Additionally, AI-based textual analysis is susceptible to algorithmic and interpretive bias. Future studies should expand the regional scope, employ primary data, and adopt advanced AI models to enhance robustness and comparability.
Author Contributions
Conceptualization, M.A.A. and M.J.S.; methodology, M.A.A. and M.J.S.; software, M.A.A.; validation, M.A.A.; formal analysis, M.A.A.; investigation, M.A.A. and M.J.S.; data curation, M.A.A.; writing—original draft preparation, M.A.A.; writing—review and editing, M.J.S.; visualization, M.A.A.; supervision, M.J.S. All authors have read and agreed to the published version of the manuscript.
Funding
This research received no external funding. The APC was funded by Prof. Matthys Swanepeol.
Institutional Review Board Statement
Not applicable.
Informed Consent Statement
Not applicable.
Data Availability Statement
The data presented in this study are available in Zenodo at https://doi.org/10.5281/zenodo.17242058. These data were derived from the following resources available in the public domain: https://eikon.refinitiv.com/, accessed on 24 June 2025) and MSCI ESG Ratings (https://www.msci.com/our-solutions/esg-investing/esg-ratings, accessed on 8 July 2025).
Conflicts of Interest
The authors declare no conflict of interest.
Abbreviations
The following abbreviations are used in the manuscript:
| AI | Artificial Intelligence |
| AII | AI-Integrated |
| NAII | Non-AI Integrated |
| ESG | Environmental, Social, and Governance |
| ML | Machine Learning |
| NLP | Natural Language Processing |
| LDA | Latent Dirichlet Allocation |
| DTM-lite | Dynamic Topic Modeling (lite version) |
| OLS | Ordinary Least Squares |
| SVR | Support Vector Regression |
| RBV | Resource-Based View |
| ROA | Return on Assets |
| GDP | Gross Domestic Product |
| MAE | Mean Absolute Error |
| R2 | Coefficient of Determination |
| 2SLS | Two-Stage Least Squares |
| PSM | Propensity Score Matching |
| ATE | Average Treatment Effect |
| CSR | Corporate Social Responsibility |
| KPI | Key Performance Indicator |
| R&D | Research and Development |
Appendix A

Table A1.
AI-ESG Integration Framework.
Table A1.
AI-ESG Integration Framework.
| Component | Description | Score/Weight | Notes/Clarification |
|---|---|---|---|
| Scoring Scale | No Evidence/Not Mentioned | 0 | No public or internal indication of AI use in ESG processes |
| Exploratory Pilot/Initial Testing | 1 | Early-stage projects, R&D, or trials, but not consistent or formal | |
| Partial Use (<50% of ESG activities) | 2 | AI used in isolated ESG functions or internally only | |
| Broad Use (in multiple ESG operations or reports) | 3 | Integrated across several ESG tools or included in disclosures | |
| Strategic Integration (Core to ESG policy and reporting standards) | 4 | Institutionalized AI in ESG strategy, with clear visibility in external reporting | |
| Feature Weights | Machine Learning | 30% | Core for predictions, classification, and financial-environmental modeling |
| Natural Language Processing (NLP) | 20% | Crucial for text mining, sentiment analysis, and regulatory parsing | |
| Automated ESG Scoring Tools | 30% | Key for standardized benchmarking and investor communications | |
| AI-Driven Analytics | 20% | Useful for real-time ESG monitoring and dashboard reporting | |
| Scoring Formula | Normalized Weighted Score | – | |
| Integration Levels | Low | 0–30% | Little to no meaningful adoption |
| Moderate | 31–60% | Some integration but fragmented or informal | |
| Strong | 61–80% | High-functioning AI use, consistent across several ESG areas | |
| Advanced | 81–100% | AI is an embedded, strategic tool in ESG governance and disclosures |

Table A2.
Topic evolution + sentiment layering.
Table A2.
Topic evolution + sentiment layering.
| Year | Topic 0 | Topic 1 | Topic 2 |
|---|---|---|---|
| 2018 | 0.489626 | 0.187525 | 0.322849 |
| 2019 | 0.352826 | 0.211438 | 0.435736 |
| 2020 | 0.196337 | 0.481482 | 0.322182 |
| 2021 | 0.37969 | 0.138141 | 0.482169 |
| 2022 | 0.275539 | 0.29565 | 0.428811 |
| 2023 | 0.500339 | 0.344187 | 0.155474 |
| 2024 | 0.330911 | 0.303754 | 0.365335 |

Table A3.
List of feature selected datasets.
Table A3.
List of feature selected datasets.
| Feature | OLS/Baseline | Elastic Net (Regularized Selection) | XGBoost (Tree-Based Importance) | SVR (PCA-Compressed) |
|---|---|---|---|---|
| AI-Integrated ESG Indicator | ✔ | ✔ | ✔ | ✔ |
| ESG Overall Score | ✔ | ✔ | ✔ | ✔ |
| Return on Assets (ROA) | ✔ | ✔ | ✔ | ✔ |
| ln (Firm Assets) | ✔ | ✔ | ✔ | |
| Institutional Ownership (%) | ✔ | ✔ | ✔ | ✔ |
| R&D Intensity | ✔ | ✔ | ✔ | ✔ |
| Industry FE (Tech Sector) | ✔ | ✔ | ||
| Country GDP Growth | ✔ | ✔ | ✔ | |
| Governance Score | ✔ | ✔ | ||
| Social Score | ✔ | ✔ | ||
| Environmental Score | ✔ | ✔ |
Note: ✔ indicates that the feature was included as an explanatory variable in the corresponding model specification.

Table A4.
Classification Performance Report—AI-Integrated vs. Non-AI ESG Reporting.
Table A4.
Classification Performance Report—AI-Integrated vs. Non-AI ESG Reporting.
| Metric | AI-Integrated ESG (High Valuation) | Non-AI ESG (Low Valuation) | Overall |
|---|---|---|---|
| True Positives (TP) | 48 | 71 | – |
| False Positives (FP) | 0 | 1 | – |
| False Negatives (FN) | 0 | 1 | – |
| True Negatives (TN) | 72 | 48 | – |
| Accuracy | – | – | 99.31% |
| Precision | 100% | 98.61% | – |
| Recall (Sensitivity) | 100% | 98.61% | – |
| F1 Score | 100% | 98.61% | 99.30% |
| AUC-ROC (est.) | – | – | >0.99 |
References
- Adeoye, O. B., Okoye, C. C., Ofodile, O. C., & Ajayi-Nifise, A. (2024). Artificial intelligence in ESG investing: Enhancing portfolio management and performance. International Journal of Science and Research Archive, 11(1), 2194–2205. [Google Scholar] [CrossRef]
- Aruwaji, A. M., & Swanepoel, M. (2025, July 12–14). Transforming SME finance through artificial intelligence: A predictive analytics approach. 2025 Conference on Information Communications Technology and Society (ICTAS) (pp. 1–7), Durban, South Africa. [Google Scholar] [CrossRef]
- Barney, J. (1991). Firm resources and sustained competitive advantage. Journal of Management, 17(1), 99–120. [Google Scholar] [CrossRef]
- Blei, D. M., Ng, A. Y., & Jordan, M. I. (2003). Latent Dirichlet allocation. Journal of Machine Learning Research, 3, 993–1022. Available online: http://jmlr.csail.mit.edu/papers/v3/blei03a.html (accessed on 13 August 2025).
- Breiman, L. (2001). Random forests. Machine Learning, 45(1), 5–32. [Google Scholar] [CrossRef]
- Chen, T., & Guestrin, C. (2016, August 13–17). XGBoost: A scalable tree boosting system. 22nd ACM SIGKDD International Conference on Knowledge Discovery and Data Mining (KDD ’16) (pp. 785–794), San Francisco, CA, USA. [Google Scholar] [CrossRef]
- Cheng, B., Ioannou, I., & Serafeim, G. (2014). Corporate social responsibility and access to finance. Strategic Management Journal, 35(1), 1–23. [Google Scholar] [CrossRef]
- Chicco, D., Warrens, M. J., & Jurman, G. (2021). The coefficient of determination R-squared is more informative than SMAPE, MAE, MAPE, MSE and RMSE in regression analysis evaluation. PeerJ Computer Science, 7, e623. [Google Scholar] [CrossRef] [PubMed]
- Côrte-Real, N., Ruivo, P., & Oliveira, T. (2020). Leveraging internet of things and big data analytics initiatives in European and American firms: Is data quality a way to extract business value? Information and Management, 57(1), 103141. [Google Scholar] [CrossRef]
- Delery, J. E., & Roumpi, D. (2017). Strategic human resource management, human capital and competitive advantage: Is the field going in circles? Human Resource Management Journal, 27(1), 1–21. [Google Scholar] [CrossRef]
- Dubey, R., Bryde, D. J., Blome, C., Roubaud, D., & Giannakis, M. (2021). Facilitating artificial intelligence powered supply chain analytics through alliance management during the pandemic crises in the B2B context. Industrial Marketing Management, 96, 135–146. [Google Scholar] [CrossRef]
- Eccles, R. G., Ioannou, I., & Serafeim, G. (2014). The impact of corporate sustainability on organizational processes and performance. Management Science, 60(11), 2835–2857. [Google Scholar] [CrossRef]
- Eccles, R. G., & Krzus, M. P. (2018). The Nordic model: An analysis of leading practices in ESG disclosure. Nordic Journal of Business, 67(1), 4–25. [Google Scholar]
- El Ghoul, S., Guedhami, O., Kwok, C. C. Y., & Mishra, D. R. (2011). Does corporate social responsibility affect the cost of capital? Journal of Banking and Finance, 35(9), 2388–2406. [Google Scholar] [CrossRef]
- Fatemi, A., Glaum, M., & Kaiser, S. (2018). ESG performance and firm value: The moderating role of disclosure. Global Finance Journal, 38, 45–64. [Google Scholar] [CrossRef]
- Floridi, L., & Cowls, J. (2019). A unified framework of five principles for AI in society. Harvard Data Science Review, 1(1), 2–15. [Google Scholar] [CrossRef]
- Freeman, R. E. (1984). Strategic management: A stakeholder approach. Pitman. [Google Scholar]
- Friede, G., Busch, T., & Bassen, A. (2015). ESG and financial performance: Aggregated evidence from more than 2000 empirical studies. Journal of Sustainable Finance and Investment, 5(4), 210–233. [Google Scholar] [CrossRef]
- Grewal, J., Hauptmann, C., & Serafeim, G. (2020). Material sustainability information and stock price informativeness. Journal of Accounting and Economics, 70(2–3), 101344. [Google Scholar] [CrossRef]
- Gyapong, E., Monem, R. M., & Hu, F. (2016). Do women and ethnic minority directors influence firm value? Evidence from post-apartheid South Africa. Journal of Business Finance & Accounting, 43(3–4), 370–413. [Google Scholar] [CrossRef]
- Haniffa, R. M., & Cooke, T. E. (2005). The impact of culture and governance on corporate social reporting. Journal of Accounting and Public Policy, 24(5), 391–430. [Google Scholar] [CrossRef]
- Higgins, C., Stubbs, W., & Love, T. (2020). Walking the talk(s): Organisational narratives of integrated reporting. Accounting, Auditing and Accountability Journal, 33(2), 292–324. [Google Scholar] [CrossRef]
- Hussein, T. M., Michael, A. A., & Goparaju, A. (2025). Reviewing the impact of technological innovation on accounting practices. In E. AlDhaen, A. Braganza, A. Hamdan, & W. Chen (Eds.), Business sustainability with Artificial Intelligence (AI): Challenges and opportunities (Vol. 566). Studies in systems, decision and control. Springer. [Google Scholar] [CrossRef]
- Hyndman, R. J., & Koehler, A. B. (2006). Another look at measures of forecast accuracy. International Journal of Forecasting, 22(4), 679–688. [Google Scholar] [CrossRef]
- Ioannou, I., & Serafeim, G. (2015). The impact of corporate social responsibility on investment recommendations. Strategic Management Journal, 36(7), 1053–1081. [Google Scholar] [CrossRef]
- Khanna, T., & Palepu, K. G. (2010). Winning in emerging markets: A road map for strategy and execution. Harvard Business Press. [Google Scholar]
- Koelbel, J. F., & Rigobon, R. (2022). ESG confusion and stock returns: Tackling the problem of noise [NBER Working Paper No. 30562]. NBER. [Google Scholar] [CrossRef]
- KPMG. (2021). The time has come: The KPMG survey of sustainability reporting 2020. KPMG International. Available online: https://home.kpmg/xx/en/home/insights/2020/11/the-time-has-come-survey-of-sustainability-reporting.html (accessed on 4 July 2025).
- Landis, J. R., & Koch, G. G. (1977). The measurement of observer agreement for categorical data. Biometrics, 33(1), 159–174. [Google Scholar] [CrossRef]
- Li, F. (2008). Annual report readability, current earnings, and earnings persistence. Journal of Accounting and Economics, 45(2–3), 221–247. [Google Scholar] [CrossRef]
- Lim, T. (2024). Environmental, social, and governance (ESG) and artificial intelligence in finance: State-of-the-art and research takeaways. Artificial Intelligence Review, 57(76). [Google Scholar] [CrossRef]
- Loughran, T., & McDonald, B. (2011). When is a liability not a liability? Textual analysis, dictionaries, and 10-Ks. Journal of Finance, 66(1), 35–65. [Google Scholar] [CrossRef]
- Ntim, C. G., Opong, K. K., & Danbolt, J. (2015). Board size, corporate regulations, and firm valuation in an emerging market: A simultaneous equation approach. International Review of Applied Economics, 29(2), 194–220. [Google Scholar] [CrossRef]
- Ntim, C. G., & Soobaroyen, T. (2013). Black economic empowerment disclosures by South African listed corporations: The influence of ownership and board characteristics. Journal of Business Ethics, 116(1), 121–138. [Google Scholar] [CrossRef]
- OECD. (2022). OECD economic outlook, volume 2022 issue 2: Confronting the crisis. OECD Publishing. [Google Scholar] [CrossRef]
- OECD. (2023). 2023 OECD open, useful and re-usable data (OURdata) Index: Results and key findings [OECD Public Governance Policy Papers, No. 43]. OECD Publishing. [Google Scholar] [CrossRef]
- Powers, D. M. W. (2011). Evaluation: From precision, recall and F-measure to ROC, informedness, markedness and correlation. Journal of Machine Learning Technologies, 2(1), 37–63. [Google Scholar]
- Sharma, V., Kulkarni, V., McAlister, F., Eurich, D., Keshwani, S., Simpson, S. H., Voaklander, D., & Samanani, S. (2021). Predicting 30-day readmissions in patients with heart failure using administrative data: A machine learning approach. Journal of Cardiac Failure, 28(11), 1659–1668. [Google Scholar] [CrossRef] [PubMed]
- Shwartz-Ziv, R., & Armon, A. (2022). Tabular data: Deep learning is not all you need. Information Fusion, 81, 84–90. [Google Scholar] [CrossRef]
- Simionescu, M. (2025). Machine learning vs. econometric models to forecast inflation rate in Romania? The role of sentiment analysis. Mathematics, 13(1), 168. [Google Scholar] [CrossRef]
- Spence, M. (2002). Signaling in retrospect and the informational structure of markets. American Economic Review, 92(3), 434–459. [Google Scholar] [CrossRef]
- Wamba, S. F., Queiroz, M. M., & Trinchera, L. (2021). Big data analytics capabilities and firm performance: The mediating role of stakeholder trust. Technological Forecasting and Social Change, 167, 120728. [Google Scholar] [CrossRef]
- Wang, C., Zhang, Y., & Miao, Y. (2025). Artificial intelligence and corporate ESG: Evidence from Chinese listed enterprises. Finance Research Letters, 66, 108547. [Google Scholar] [CrossRef]
- Wong, W. C., Batten, J. A., Mohamed-Arshad, S. B., Nordin, S., & Adzis, A. A. (2021). Does ESG certification add firm value? Finance Research Letters, 39, 101593. [Google Scholar] [CrossRef]
- World Bank. (2022). World development report 2022: Finance for an equitable recovery. World Bank. [Google Scholar] [CrossRef]
- Xie, H., & Wu, F. (2025). Artificial intelligence technology and corporate ESG performance: Empirical evidence from Chinese-listed firms. Sustainability, 17, 420. [Google Scholar] [CrossRef]
- Yu, E. P., & Luu, B. V. (2021). International variations in ESG disclosure—Do cross-listed companies care more? International Review of Financial Analysis, 75, 101731. [Google Scholar] [CrossRef]
- Zhang, C., & Yang, J. (2024). Artificial intelligence and corporate ESG performance. International Review of Economics & Finance, 96, 103713. [Google Scholar] [CrossRef]
- Zhou, X., Peng, Y., Sun, X., Cao, X., Wang, Z., & Zhang, J. (2025). Advancing new energy industry quality via artificial intelligence-driven integration of ESG principles. Humanities and Social Sciences Communications, 12, 1491. [Google Scholar] [CrossRef]
Disclaimer/Publisher’s Note: The statements, opinions and data contained in all publications are solely those of the individual author(s) and contributor(s) and not of MDPI and/or the editor(s). MDPI and/or the editor(s) disclaim responsibility for any injury to people or property resulting from any ideas, methods, instructions or products referred to in the content. |
© 2025 by the authors. Licensee MDPI, Basel, Switzerland. This article is an open access article distributed under the terms and conditions of the Creative Commons Attribution (CC BY) license (https://creativecommons.org/licenses/by/4.0/).