Abstract
This study aims to monitor the magnitudes, rates, and directions of spatial urban expansions east of Cairo and their interactions with the initial morphologic landscapes. The approach relies on using CORONA satellite images acquired in 1969 with fine spatial resolution and time series images of Landsat and ASTER from 1984 to 2020. The CORONA images enable retrieval of the initial morphologic components, whereas the Landsat and ASTER images enable the spatial urban expansions to be mapped. The magnitudes of spatial urban expansions have been massive, in the order of 165 km2. These expansions have occurred through four main temporal phases with different spatial extents, rates, and directions in response to common urban policies and socioeconomic settings. Assessing the interactions between urban expansions and the morphology of watersheds in the study area indicates that the directions of urban expansion have been opposite to the geospatial orientations of the watersheds. In addition, significant urban areas in the order of ~8 km2 are under the direct threat of flash floods because they are misplaced within the valley floors of the studied watersheds. The study concludes that successful spatial urban expansion should consider the morphologic characteristics of the initial landscape for the purpose of maximizing interests and avoiding or reducing potential hazards against urban settlements.
Keywords:
spatial urban expansion; morphologic landscapes; CORONA; Landsat; ASTER; watersheds; Cairo; Egypt 1. Introduction
Urbanization patterns of residential landscapes have accelerated to ~55% of the world’s population and are expected to increase to 68% by 2050 []. Spatial urban expansion through landscapes occurs in response to many driving forces, such as socioeconomy and population growth [,], gross domestic product [,], transportation [], and land use policy and urban planning []. The conversion of rural areas into urban areas is another reason to shifting residential patterns toward more urbanization [,]. Due to ever-increasing population rates, urban land use has significantly increased by 34% from 1980 to 2000 and is expected to double by 2030 [,]. Aligned with this worldwide trend, the urban population in Egypt is increasing at rates faster than the population of the entire country []. Accordingly, the concept of establishing new towns near the deserts has been a common policy in Egypt since the late 1970s [,].
The desert area east of Cairo has experienced extensive spatial urban expansions over the last six decades. The principal objectives of these expansions into the desert include relieving the high population density in the capital and the central cities of the governorates [,,] and halting aggression against agricultural lands [,]. Three models of new towns—which are autonomous cities, twin cities, and satellite cities—were proposed, planned, and implemented throughout four generations starting in 1978 [,]. The majority of new towns in the area east of Cairo were established through the first, second, and third generations, and they were a mix of autonomous (e.g., the 10th of Ramadan City, 55 km to the northeast of Cairo) and satellite cities (e.g., Al-Obour and Al-Shorouk, 26 km to the northeast of Cairo and 37 km to the east of Cairo, respectively) [,,]. The massive spatial urban expansions of the new towns have clearly occurred at the expense of the initial physiographic desert landscape in the area east of Cairo. These landscapes are basically comprised of fluvial watersheds of different morphologic, hydrologic, ecologic, and topographic characteristics. The effect of urbanization on these characteristics became a prime concern of many scientific disciplines worldwide []. Many environmental consequences could be initiated and propagated in response to spatial urban expansions in watersheds [,] unless these expansions follow sustainable urban planning and environmental policies.
Spatial urban expansions pose potential impacts to many aspects of watersheds, including water quality degradation [,], soil degradation [,,,], and local climate changes [,,,]. These potential impacts also include drastic changes in the ecological settings of watersheds [,,,]. In addition, the magnitude of surface runoff and total discharge within watersheds significantly increases in response to spatial urban expansion [,,]. These hydrologic alterations can be strongly attributed to reducing the soil infiltration capacity within watersheds because increasing impervious urban layers results in an eventual high runoff coefficient []. These changes in hydrologic characteristics could explicitly expose urban areas within watersheds to water-related hazards [,,]. Enormous changes could take place in stream networks and topographic characteristics under spatial urban expansion through watersheds []. The previous effects of spatial urban expansion through watersheds are highly expected to occur in the area east of Cairo. Nevertheless, limited studies have been carried out on the magnitudes, directions, and rates of spatial urban expansion in the area east of Cairo (e.g., [,]) and on the influence of these urban expansions against the morphologic, hydrologic, ecologic, and topographic characteristics of these watersheds (e.g., [,]). Therefore, it is vital that the magnitudes, rates, and directions of spatial urban expansion in the area east of Cairo and their interactions through watersheds be studied using efficient monitoring and analytical techniques, such as remote sensing and GIS.
The long-term and systematic acquisition of satellite images by the scientific community enables the retrieval of initial morphologic settings of landscapes and the monitoring of spatiotemporal changes of dynamic features, such as urban spatial expansion in, on, and/or within these landscapes [,,]. Aerial photographs at appropriate spatial resolution are a potential choice for retrieving the initial settings of a landscape before any urban development. However, the acquisition of aerial photographs with high spatial resolution outside of cities and agricultural areas is rare. In addition, acquiring and processing aerial photographs is expensive and time-consuming. Therefore, CORONA satellite images at a high spatial resolution of up to 0.80 m that were taken in the 1960s and 1970s represent a strong alternative for monitoring the initial morphologic components of landscapes before any anthropogenic interventions. CORONA was a classified United States satellite image system that provided fine spatial resolution images during the 1960s and 1970s. CORONA images were declassified in 1995; since that time, CORONA images have been widely used in many applications [,,,]. Because of the high spatial resolution, CORONA images have recently been used in studies relating to urban expansion [,,]. In addition, Earth observation satellites, such as Landsat, ASTER, and SPOT, allow scientists from many disciplines to manage spatial urban expansion throughout numerous geographic areas worldwide [,,,,,,]. Observing the 1.8 spatial resolution CORONA images acquired in 1969 provides the unprecedented opportunity to explore the initial morphologic features of watersheds east of Cairo, and their spatial characteristics, in fine detail from totally different perspectives. Additionally, the long-term and systematic acquisition of optical images, such as those by the Landsat and ASTER satellites, enabled the monitoring of mass urban growth on an annual basis from 1986 to 2020. Careful investigations of both valuable data sets have allowed for the formulation of key questions. First, what are the magnitudes, rates, and directions of spatial urban expansions east of Cairo? Second, what are the initial morphologic and spatial characteristics of the watersheds where these spatial urban expansions have taken place? Third, did the spatial urban expansions consider the morphologic and spatial characteristics of watersheds in the studied area east of Cairo?
2. Study Area
The study area is located east of Cairo and extends over 300 km2. It is bounded from the east by Cairo Ring Road (CRR), from the north by Cairo Suez Road, from the south by Ain Al Sokhna Road, and from the east by the water divides of Wadi Hamid, Wadi Al Anqabiyah Al Murowyanah, Wadi Al Halazoni and the water divides of a sub-watershed of Wadi Degla (Figure 1). The study area is a significant geographic area of the geologically known Cairo-Suez District (CSD) zone in the north of the eastern desert of Egypt. The long and complex geologic and tectonic history of CSD greatly controls the lithologic composition, structural configuration, and topographic expressions of the study area. The bedrocks of the study area range in age from Upper Eocene to Recent. The Upper Eocene rocks occupy a wide strip to the north of Cairo-Ain As Sokhna road in the study area (Figure 1). The spatial extent of Upper Eocene rock is ~29 km2, representing 9.7% of the entire study area. It is composed basically of marly limestone with detrital interbeds [,,,]. To the north of the Upper Eocene rocks, the Oligocene rock units occupy wide spatial extents of 191.6 km2, representing 64% of the entire study area (Figure 1). The Oligocene surficial rock units occur as wide strips in the middle of the study area and are composed of sand and gravel units with silicified wood in the base and basaltic sheets at the top [,]. To the north of the Oligocene rocks and along the Cairo-Suez Road, the Miocene rock units, with a total of 68 km2 occur, representing 23% of the entire study area (Figure 1). The Miocene rocks are comprised of basal marine units overlayed by nonmarine rock units [,]. Finally, the Pliocene rocks unconformably overlay the Miocene rocks in a considerable area of 11.3 km2 in the northeast reaches of the study area (Figure 1). The Pliocene rocks are comprised of reworked carbonate rock units [,]. Rock formations from the Upper Eocene to the Miocene have experienced multiple tectonic deformations []. These deformations produced different structural ridges and basins with various fault mechanisms and geospatial distribution [,,]. The high topographic representations in the study area occur in association with the Upper Eocene rocks in the south of the study area along Ain As Sokhna Suez road. However, the regional topography of the study area shows a decreasing trend in the north and northwest directions. These regional topographically decreasing trends are interrupted by E–W and WNE–ESE elongated ridges south of Cairo-Suez Road, along with scattered isolated hills. Between the ridges of high topography in the south and middle of the study area, gently sloping lowlands occur. The elevations of the study area range from 139 to 470 m, with an average of 300 m indicating high potential energy for developing mass movements. The geologic and tectonic settings, along with the topography, allow the formation and development of watersheds with mature stream networks in the study area in response to infrequent rainstorms.
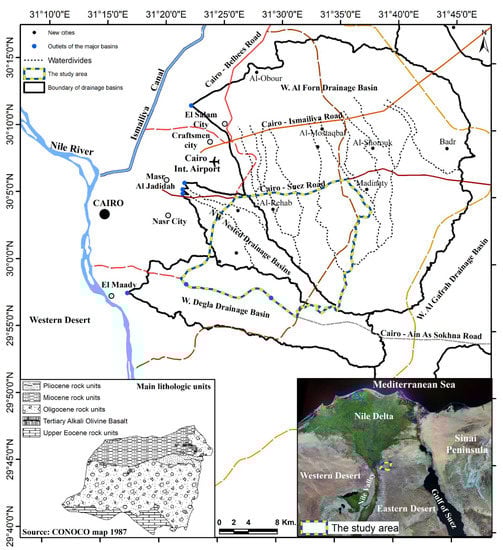
Figure 1.
The location of the study area.
The area located east of Cairo contains drainage basins of different spatial extents and downstream orientations (Figure 1). The Wadi Al-Forn drainage basin (called the W. Heliopolis drainage basin in the literature) is considered one of the largest basins east of Cairo, with a total area of ~960 km2. To the east of the W. Al-Forn drainage basin, the W. Al-Gafra is the largest drainage basin east of Cairo, with a total area of 1466 km2. The outlet of the W. Al-Forn drainage basin heads up to the west at a location northeast of Cairo (Figure 1). The Wadi Degla drainage basin is the third largest drainage basin east of Cairo, with an area of 250 km2. The W. Degla drainage basin is an elongated east-to-west–oriented basin with an outlet heading to the Nile River south of Cairo at Al-Maadi city (Figure 1). Three small, nested watersheds occur southward between the W. Al-Forn drainage basin and the W. Degla drainage basin: the W. Al-Ezzam, W. Al-Halazoni, and W. Al-Wattwatt watersheds (Figure 1). The total area of the three nested watersheds is 118 km2. Each drainage basin hosts whole or significant portions of the new urban settlements east of Cairo. For instance, the W. Al-Forn drainage basin hosts the largest portions of spatial urban expansions of new towns east of Cairo. These include El Shorouq city, Al-Obour city, Badr city, Madinaty, and Al-Mostakbal city (Figure 1). Similarly, the spatial urban expansions of the last decades have occupied entire small, nested watersheds and significant areas of the upstream reaches of the W. Degla drainage basin (Figure 1). These vast spatial urban expansions have also been supported by the establishment of efficient transportation systems.
In the area east of Cairo, powerful radial and ring road networks were established as infrastructure for the new urban settlements. The radial roads include the Cairo to Ain Al-Sokhna road in the south, the Cairo to Suez and Cairo to Ismailia roads in the middle, and the Cairo to Belbees road in the north (Figure 1). These radial roads connect the new urban settlements with Cairo in the west and the major cities and districts of Egypt in the east (Figure 1). To connect the new settlements with each other and with the northern and southern districts of Egypt, a powerful set of ring roads was also established; these include the CRR, the Middle Ring Road, and the Regional Ring Road (Figure 1). The effect of road networks on the magnitudes, rates, and directions of urban growth is remarkable, not only in the area east of Cairo but worldwide as well [,,].
The spatial urban expansion east of Cairo was initiated after the establishment of the CRR in 1986. The landscape of the study area has entirely changed during the 34 years extending from 1986 to 2020 (Figure 2). The 1986 Landsat image shows that the study area was a barren land with primarily well-developed surface stream networks (Figure 2). These networks were organized to form the fundamental landscape morphologic units in the study area comprised of arid watersheds (Figure 2). These watersheds had different directions, shapes, spatial extents, and topographies. For instance, the principal orientations of these watersheds were north–south, northwest–southeast, and northeast–southwest (Figure 2).
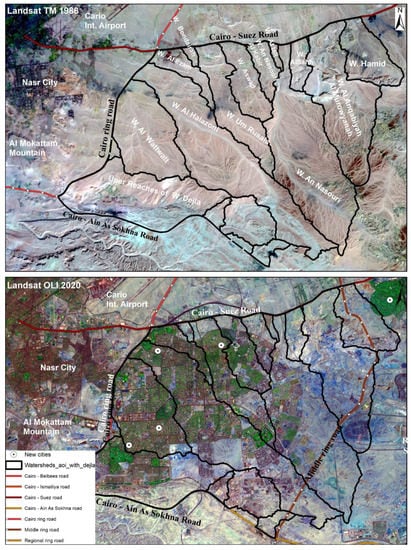
Figure 2.
The spatial pattern of the spatial urban expansion through the time period 1986–2020.
Massive spatial urban expansions have taken place over these watersheds of complex morphologic characteristics over the last 34 years. Monitoring the annual spatial urban expansion in the study area using time series imagery through the time period 1986 to 2020 provides an opportunity to study the temporal and spatial changes in the magnitudes, rates, and directions of the spatial urban expansion. In addition, the study analyzes whether the spatial urban expansions have considered the complex morphological characteristics of watersheds in the study area.
3. Materials and Methods
To achieve the objectives of the research, a reliable research approach was proposed. The approach relied on geospatial and cartographic frameworks based on remote sensing and GIS technologies. In this perspective, time series images from Landsat and ASTER satellites were used to observe, retrieve, and map the spatiotemporal changes in the urban mass of the study area from 1986 to 2020. On the other hand, the CORONA images acquired in 1969 were used to retrieve the initial morphologic features before any spatial urban expansion took place. Various geospatial and cartographic analysis functions and operations were then enforced on the produced GIS layers and digital elevation model (DEM) to characterize and assess the spatial relationships and interactions between spatial urban expansion and the initial morphologic landscape. The overall research design is shown in Figure 3. The following research procedures were followed.
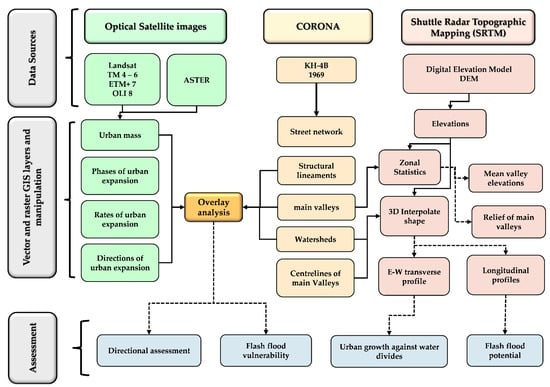
Figure 3.
Flow chart of the research methodology.
3.1. Data Acquisition and Preprocessing
Satellite imagery of Landsat systems, including Thematic Mapper (TM), Enhanced Thematic Mapper Plus (ETM+), and Operational Land Imager (OLI) sensors, were acquired on an annual basis from 1986 to 2020. Two ASTER images from 2007 and 2012 were acquired instead of Landsat images because of the failure in the scan line corrector mechanism of Landsat 7 after 2003 [] (Table 1). Landsat and ASTER images were downloaded from the Earth Explorer (https://earthexplorer.usgs.gov/ [accessed on 15 May 2022]) and Global Visualization Viewer (https://glovis.usgs.gov/app [accessed on 15 May 2022]) websites. The CORONA images had been a potential source of historical data [] since their declassification in 1995.

Table 1.
Technical specifications of remote sensing imagery used in this study.
CORONA was a series of spy satellites equipped with various panoramic cameras designated by keyhole (KH). These camera models included KH-1, KH-2, KH-3, KH-4, KH-4A, and KH-4B. System specifications and camera model characteristics are given in detail in []. The CORONA satellite equipped with KH-4B provided images from September 1967 to May 1972. These images were characterized by fine spatial resolution details in the order of 1.8 m [] for appropriate urban mapping [] and for discrimination between different surface features []. Two CORONA images of frames 014 and 015 were acquired on 9 December 1969, by the CORONA satellite designator KH-4B on mission number 1108-1. Data specifications of Landsat, ASTER, and CORONA images are presented in Table 1. The CORONA images that cover the study area were accurately georeferenced using a reference Landsat TM image acquired in 1984. The Shuttle Radar Topographic Mission (SRTM) DEM with a spatial resolution of 30 m was used to determine various topographic characteristics, such as elevation, slope, and hillshade. The topographic maps of scale 1:50,000 covering the study area were obtained, scanned, and projected to identify various landforms and valleys and to recognize the major landmarks in the study area. A priori-knowledge of Egyptian housing policies was collected from further studies and reports published on the website of the Ministry of Housing, Utilities, and Urban Communities.
3.2. Data Automation, Analysis, and Assessment
Landsat and ASTER images were both subsetted to the boundaries of the study area. Subset images were processed to enhance their visual characteristics. Enhanced images were displayed for on-screen digitization to automate GIS shapefiles of urban mass and road networks on an annual basis from 1986 to 2020. The total annual urban mass was then calculated and graphically represented to define and discriminate the major time phases of spatial urban expansions. Time phases of urban mass growth were then recognized and compared with the urban policies adopted by the Egyptian authorities and other social constraints. The rates of urban growth within each time phase were calculated and discussed. The directions of spatial urban expansions were calculated and plotted using Excel software.
The CORONA images were subsetted to the boundaries of the study area and enhanced visually. The fine spatial 1.8 m resolution of these images qualified them for accurate definition and mapping of the various initial morphologic features in the study area, such as stream networks, watersheds, the centerlines of the major valleys of watersheds, and the boundaries of the main valleys of watersheds. In addition, many other structural origin features were clearly identified and mapped in the study area, such as structural ridges, dip slopes, and scarp slopes. The overlay analysis was used to compare the directions of spatial urban expansion with the geospatial orientation of structural features, water divides of watersheds, and the main valleys. In addition, the overlay analysis helped define urban masses that are directly located within the spatial extents of the valley floors of watersheds in the study area (Figure 3). To assess the possible impacts of the opposite expansion of urban growth against the geospatial orientation of watersheds, an E–W transverse topographic profile was constructed using DEM. To determine the potential of watersheds for producing flash floods, the topographic analysis of the main valleys was conducted using 3D interpolating shapes and zonal statistics. The 3D interpolating shapes of the centerlines of the main valleys enabled the production of longitudinal profiles of these valleys. Zonal statistics helped define the mean elevations and reliefs of the polygons of the main valleys for eventual evaluation of the potential of watersheds for producing significant flash floods. Using the above research design, it was possible to outline, understand, and discuss the interplay between the spatial urban expansion and the initial morphologic features in the study area through critical considerations, such as whether the directions of the spatial urban expansions are aligned with the geospatial orientations of watersheds, whether the watersheds in the study area are capable of producing flash floods, and whether the spatial urban expansions are vulnerable to the hazards of flash floods.
4. Results
4.1. Regional and Morphologic Setting of the Study Area
The acquisition and 1.8 m fine resolution of old CORONA images provided the opportunity to retrieve the initial landscape of a given geographic area in high detail. Using these images, it was possible to accurately determine the boundaries of the major basins east of Cairo. The W. Heliopolis drainage basin is one of the largest basins east of Cairo. The basin has a circular shape, with its main outlet in locations west of the El-Khanka sand accumulations (Figure 4). The basin is comprised of two sets of watersheds—a northern set and a southern set (Figure 4). They have different shapes and orientations. The southern set has watersheds in a longitudinal, snake-like shape, whereas the northern set has a triangular shape (Figure 4). The orientations of the watersheds in the southern set are northwest and north–northwest; the orientations of the northern set are south and southwest (Figure 4). These orientations allow the main valley to deliver masses of water and sediment into two trunk valleys that head west toward Al Salam City (Figure 4). To the southwest of the W. Heliopolis drainage basin, three watersheds occur: the W. Al-Ezam, W. Al-Halazoni, and W. Al-Wattwatt watersheds (Figure 4). These watersheds are longitudinal, have snake-like shapes, and resemble the shape of the southern set of W. Heliopolis’ sub-basins; however, the trend is in a northwest direction (Figure 4). The geospatial configurations of all watersheds and their shapes are direct consequences of long tectonic processes and their related structural manifestations in the CSD in the northeastern desert of Egypt.
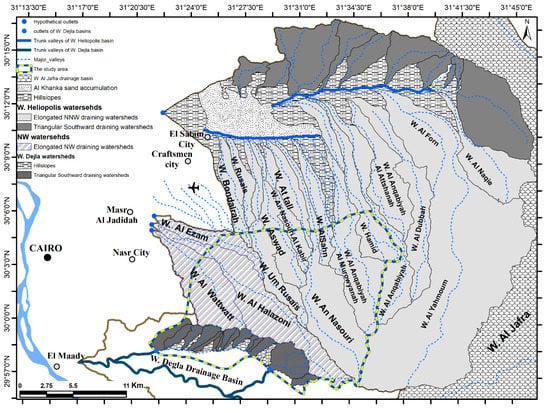
Figure 4.
Regional morphologic and geospatial setting of the major drainage basins and their sub-watersheds in East Cairo.
The CSD has experienced a long tectonic history that has resulted in faulting and folding processes. These processes have produced structural ridges trending east–west, with northward dipping planes and southward scarp slopes (Figure 5). Between these major structural ridges, three tectonic fault trends exist that are north–northwest, northwest, and east–northeast (Figure 5). All of these faults are normal faults, and their faulting criteria include steep dipping planes and high throws [,,], producing structural ridges and basins with distinctive topography throughout the study area (Figure 5). The orientation of normal faults and the geospatial characteristics of their structural ridges and basins represent the principal driving forces that develop watersheds and their associated stream networks (Figure 5). From this perspective, the orientation of the longitudinal, snake-like watersheds is primarily attributed to the influence of the north–northwest and northwest trending faults. In addition, the major valleys of these watersheds follow the original dip slopes of major east–west faults and the structural ridges and basins produced from the north–northwest, northwest, and east–northeast faults. Alternatively, the triangular southward drainage watersheds occur in association with the scarp slopes of the structural ridges produced from the east–west trending faults (Figure 5). The regional setting controls the shape, orientation, and water divides of all watersheds, along with the orientations of their associated main valleys, and also controls the morphologic characteristics inside each watershed in the study area.
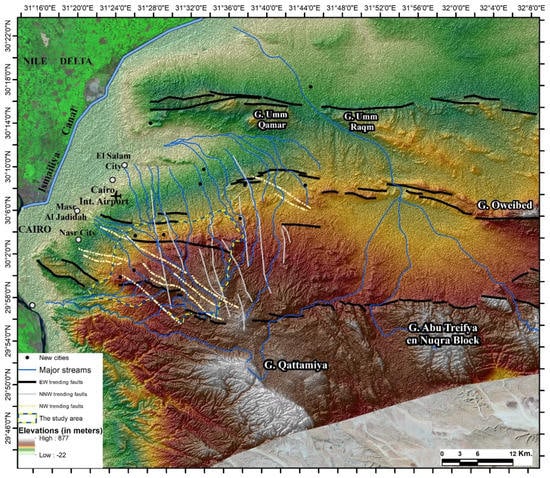
Figure 5.
The major tectonic fault trends in the areas east of Cairo.
The study area comprises the upstream reaches of the north–northwest trending watersheds of W. Heliopolis, the upstream reaches of the nested northwest trending watersheds, and the northern upstream reaches of W. Degla (Figure 6). All the watersheds have trunk valleys defined by a name in the topographic maps of scale 1:50,000 (Figure 6). As the upstream reaches of W. Degla have so many small triangular southward trending watersheds, these watersheds can be categorized into four main watersheds: W. Degla 1 (WDG 1), W. Degla 2 (WDG 2), W. Degla 3 (WDG 3), and W. Degla 4 (WDG 4) (Figure 6). The CORONA images acquired on 9 December 1969, with a 1.8 m spatial resolution, enabled a clear definition of the boundaries of these watersheds (Figure 6). The boundaries of all watersheds are high and connect topographic edges that separate the given watershed from the surrounding watershed(s) (Figure 6). In addition, all boundaries of watersheds are fully and/or partially aligned well with the main east–west, north–northwest, and northwest tectonic fault trends. The foremost and highest topographic boundary in the study area is the east–west topographic boundary that separates both the north–northwest and northwest watersheds from the southward trending watersheds of W. Degla (Figure 6). Maintaining the boundaries of the main watersheds through urban planning is critical for successful watershed hydrological management in the study area. Three major landscape components exist within the topographic boundaries of each watershed that are highly important for successful spatial urban expansion in watershed landscapes; these components include stream networks, hillslopes, and structural lineaments.
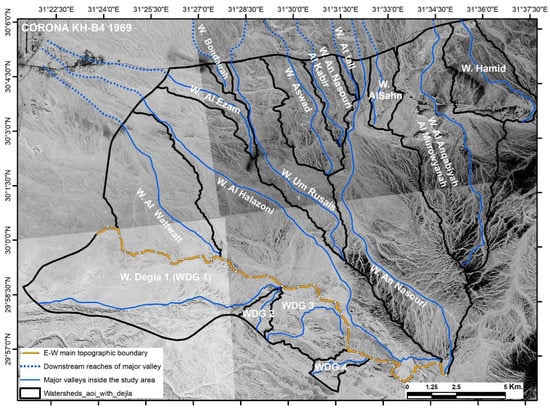
Figure 6.
The upstream reaches of NNW and NW watersheds and the northern upstream reaches of W. Degla watersheds.
The stream networks of all watersheds are well developed (Figure 6), indicating a high potential for water erosional processes and potential topographic differences. Each watershed has a main valley that receives water and sediment from the adjacent hillslopes. The main valleys are not primarily located in the middle of watersheds throughout the study area, implying the dominance of tilted strata within all the watersheds. The main valleys of the north–northwest and northwest trending watersheds are antecedent streams; their upstreams initiate from the crest of the main east–west cuesta that represents the highest topographic boundary within the study area (Figure 6). These valleys follow the prevalent northward dip slope trend in the north–northwest and northwest directions to their downstream reaches. Through their courses from the upstream to the downstream reaches, these valleys represent the main water paths in the study area. The locations of these valleys and their geometric characteristics should be maintained rather than improved under the stresses of spatial urban expansion for the purpose of efficiently discharging any possible surface runoff.
Throughout the study area, numerous numbers of stream branches conjoin the main valleys of watersheds. These stream branches discharge the adjacent hillslopes, which are characterized by different geospatial orientations rather than having dip slope and scarp slope sides, of tilted strata. Clearly, the study area has a complex morphologic setting inherited from a complex history of interaction between the tectonic and erosional forces. This interaction has produced salient morphologic landforms, such as watersheds, stream networks, and hillslopes. In this context, these hillslopes could be considered the principal land blocks or rock blocks for possible planning of spatial urban expansion. The principal concern is whether the massive spatial urban expansions have considered the morphologic setting of the study area. This research aims principally to test this hypothesis by studying the magnitudes, rates, and directions of spatial urban expansions and their spatial relationships with the geospatial orientations of the watersheds and their potentials for developing flash floods.
4.2. Spatial Urban Expansion
The systematic and regular acquisition of satellite images from the Landsat and ASTER earth observation systems enables scientists from different disciplines to monitor monthly and yearly dynamic spatial features, such as urban expansion. Images were collected on an annual basis for a 34-year period to monitor massive spatial urban expansions that occurred in the study area east of Cairo. Through this time period, a spatial urban expansion that was initiated with limited spatial extents from the 1980s to 2000 became rapid urban growth from 2000 to 2020 (Figure 7). The rates of urban growth varied at times throughout the entire study period in response to socioeconomic factors and the various regulations of urban policies. The spatial urban expansion in the study area east of Cairo can be categorized into four phases, according to the remarkable changes in the total urban mass and the growth rates (Figure 7).
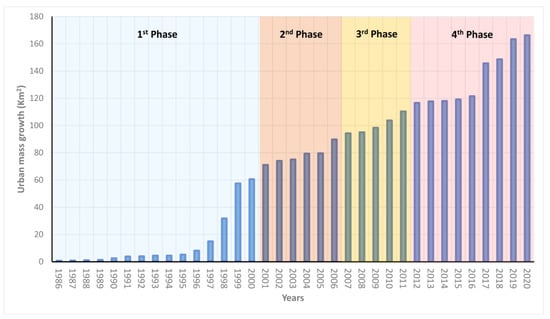
Figure 7.
Urban mass growth between 1986 and 2020 per km2.
In the first phase, extending from 1986 to 2000, the CRR was established. The early spatial urban expansion occurred in scattered locations to the east of the CRR. The urban growth rate was limited in the first phase in the order of 0.48 km2/yr from 1986 to 1995. The real urban expansion in the first phase occurred in 1996 in response to an urban expansion policy that Egypt adopted in the north and northeasterly directions. Accordingly, the development of the road network was massively accelerated through the last four years of the first phase, from 1996 to 2000. Through this time period, the spatial urban expansion extended to occupy a total area of 60 km2, with a tangible growth rate of 10.5 km2/yr.
The second phase of urban expansion occurred from 2001 to 2006 (Figure 7). In this phase, the total urban expansion reached 90 km2, with a rate in the order of 3.1 km2/yr. The principal direction of the urban growth was in the east, parallel to the main radial roads perpendicular to the CRR.
The third phase of spatial urban expansion occurred from 2007 to 2011 (Figure 7). The total area of spatial urban expansion east of Cairo reached 110 km2. This expansion was in the east on both sides of the main roads—90th Street and North 90th Street. Both roads accelerated the increase of the urban populations in these urban satellites; however, the rate of urban growth in the third phase was similar to the second phase in the order of 3.2 km2/yr.
The fourth phase extended from 2012 to 2020 and can be subdivided into two subphases: the 2012–2014 subphase and the 2015–2020 subphase (Figure 7). The rate of urban growth in the first subphase declined from the previous phase and was in the order of 0.5 km2/yr. The principal cause of this declination was the social instabilities that occurred in 2011 and the subsequent few years. In the second subphase of 2015–2020, spatial urban expansion revived again and reached a total area of 165 km2, with a high rate of urban growth in the order of 7.8 km2/yr. The principal area of spatial urban expansion in the last phase occurred in the northeast and east. The high rate of spatial urban expansion and its direction was potentially influenced by the establishment of the new administrative capital that is located directly to the east of the study area. These massive spatial urban expansions occurred over the various morphologic components in the study area. The pattern of interactions between the spatial urban expansion and some of the morphologic features in the study area are defined, analyzed, and assessed in the following discussion.
5. Discussion
The landscape is the backdrop for all human activities and ecosystems. Each landscape is comprised of distinctive morphologic and topographic characteristics that are controlled by particular earth surface processes. The principal earth surface processes in the study area are the fluvial processes. These processes develop surface runoff within topographically delineated watersheds in response to infrequent precipitation. Surface runoff produces masses of water and sediment from the upstream reaches of watersheds through the transportation systems (i.e., major valleys) to the downstream reaches of watersheds, where outlets are located. The interaction between surface runoff and the morphologic features and topographic parameters produces various landforms, such as stream networks and hillslopes. Accordingly, in response to the fluvial processes, the study area comprises many watersheds that include well-developed stream networks over hillslopes of tilted strata. In the following sections, the interplay between the spatial urban expansions and the spatial characteristics of watersheds, stream networks, and hillslopes will be presented and discussed from two perspectives—these are the geospatial orientation of watersheds and the spatial locations and extents of the main watershed transportation systems (i.e., major valleys) in the study area.
5.1. Spatial Orientation of Watersheds
Sixteen main watersheds can be recognized in the study area. In response to the regional structural settings previously discussed, the boundaries of the watersheds and their major transporting valleys follow the major structural trends. Consequently, nine watersheds trend in the north–northwestern directions, three watersheds trend in the northwestern directions, and the watersheds of the W. Degla drainage basins trend in the southern directions. The primary topographic boundaries of the watersheds (water divides) and their main valleys determine the major spatial orientations of the watersheds. To determine whether the directions of spatial urban expansions align with the geospatial orientations of watersheds, a rose diagram of the urban growth was created for the previously defined four phases; these are 1986–2000, 2001–2006, 2007–2011, and 2012–2020. Figure 8 was produced with the satellite images acquired at the starting and ending dates of each phase. Both images are overlaid by the spatial extents of urban expansion through the phase. The rose diagrams of each phase are placed between the starting and ending images of each phase. In addition, the boundaries of watersheds are also displayed in the images. In the first phase, extending from 1986 to 2000, the spatial urban expansions were primarily in the northeastern direction, with a secondary northerly direction (Figure 8). In the phase of 2001 to 2006, the spatial urban expansions occurred principally in the northeastern direction (Figure 8). In the phase of 2007 to 2011, the spatial urban expansions were principally in the eastern direction, with a secondary northeastern direction (Figure 8). Finally, in the last phase, extending from 2012 to 2020, the spatial urban expansions in the study area were massive and equivalent in both the northeast and eastern directions (Figure 8). Overall, the net directions of the spatial urban expansions through the entire period extending from 1986 to 2020 have occurred basically in the northeast, with subordinate directions in the north and east (Figure 9). These directions may be controlled by road networks (Figure 8 and Figure 9) or by other administrative and urban planning policies. Plainly, the northeastern and eastern directions of spatial urban expansions are opposite to the principal geospatial orientations of both water divides and main valleys of watersheds in the study area (Figure 8 and Figure 9).
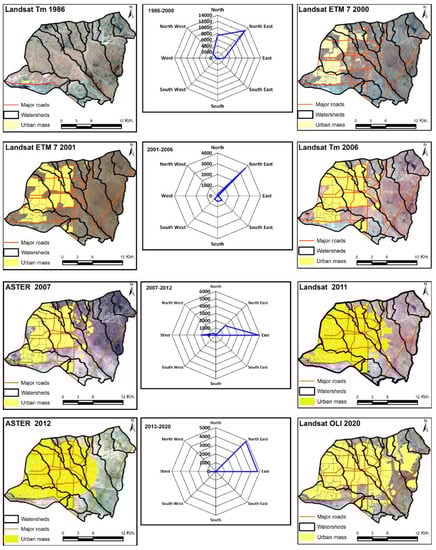
Figure 8.
The directions of spatial urban expansions through the main time periods extending from 1986 to 2020.
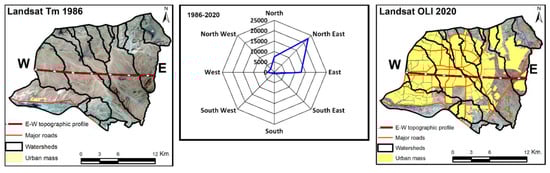
Figure 9.
The overall directions of spatial urban expansions and the orientation of water divides and main valleys of the studied watersheds.
This opposition has resulted in the aggression of spatial urban expansions against the main morphologic components of the landscape, including water divides, main valleys, and the adjacent hillslopes around the main valleys. These morphologic components have distinctive topography at various regional and local scales. On the regional scale, the topography of the landscape varies significantly from 378 m in the east to 247 m in the west, with a total elevation difference in the range of 131 m (Figure 10). On the local scale, the eastern and western water divides of all watersheds present remarkable elevation differences, with the exception of W. Umm Russaiss (Figure 10). Similarly, all watersheds show high internal topographic variations with the exception of W. Umm Russaiss (Figure 10). Because the spatial urban expansions occur opposite to the geospatial orientations of the watersheds, these east–west elevation differences could represent core challenges to urban expansions. This setting would compel the urban planner to conduct planation processes on the landscapes before urban construction (Figure 11). Planation processes definitely change the topographic characteristics of the areas holding water divides. Altering the topographic characteristics in these areas could potentially displace the water divides in new locations. Watershed sizes could then be changed, resulting in increased sizes of some watersheds at the expense of the occupied areas adjacent to these watersheds. Accordingly, it is recommended that the hydrological parameters of all watersheds in the study area be studied and analyzed with these new morphologic and topographic settings for the purpose of establishing proper strategies to avoid flash flood hazards.
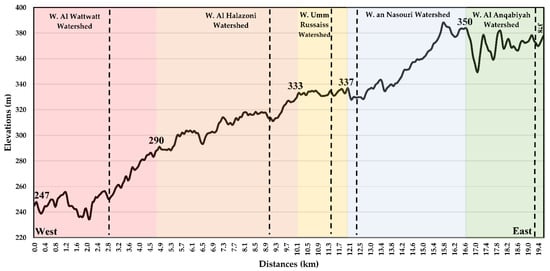
Figure 10.
East–west variation of topography across watersheds in the study area (the vertical dashed lines represent the locations of the main valleys in watersheds).
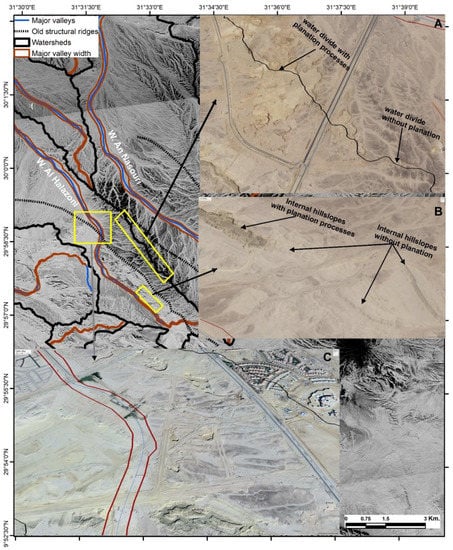
Figure 11.
The aggression against water divides (A), the internal hillslopes (B), and planning across the major trunk valley of W. Al Halazoni (C).
5.2. Spatial Relationships between Urban Spatial Expansions and Main Valleys of Watersheds
All watersheds have well-developed stream networks indicating the mutual interplay between potential topography and surface runoff. Each watershed has a main trunk valley that transports masses of water and sediment from the upstream hillslopes through stream networks. Morphologic and morphometric investigations of the main valleys imply high potentials for transporting masses of water and sediment. The main valleys actively incise in the bedrock without developing alluvial plains. They tend to be straight with sharp edges. The longitudinal topographic profiles of the main valleys were extracted from the DEMs of spatial resolution 30 m using the GIS 3D interpolation function technique of vector lines (Figure 12). The longitudinal topographic profiles indicate high potentials for the main valleys of watersheds to transport masses of water and sediment from the surrounding hillslopes into the main downstream reaches (Figure 12). The average elevations of the main valleys range from 202 m for W. Al Bondairah (a very short distance represented in the study area) to 357 m for Wadi Degla 4, with a mean value of 275 m asl (Figure 13). W. Degla 4, W. Degla 3, W. Al Halazoni, W. Umm Russaiss, W. Al Nasouri, and W. Al Anqabiyah have the highest elevation values (Figure 13). Most of these valleys also have the highest reliefs, ranging from 236 m for W. Al Anqabiyah to 248 m for W. Al Nasouri, 263 m for Degla 1, and 287 m for W. Al Halazoni (Figure 13).
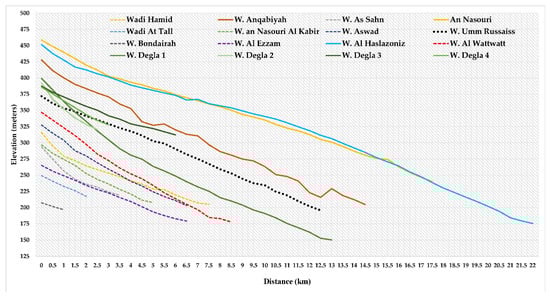
Figure 12.
The longitudinal topographic profiles of the main active channels of watersheds in the study area.
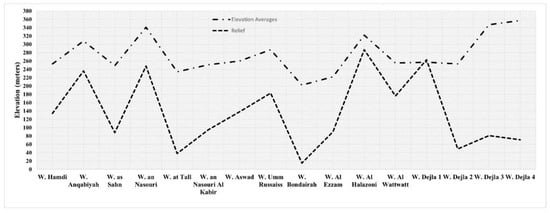
Figure 13.
The mean elevations and reliefs of the main valleys of watersheds in the study area.
The analysis of longitudinal profiles, elevation means, and reliefs of the main valleys strongly indicates that the main valleys of the watersheds in the study areas have a high potential to develop powerful flash floods in response to infrequent rainstorms in the arid regions. The potential of these valleys to develop flash floods entails leaving the valley floors free from any urban expansion in order to avoid the hazards of possible flash floods. However, analysis of visual interpretations of the multi-temporal satellite imagery can help recognize the spatial relationships between spatial urban expansion and the valley floors of watersheds (Figure 14). Urban expansions have primarily occurred within the main valleys of watersheds in the study area (Figure 14). The hazards of flash floods alongside urban expansions within the main valleys in the study area have been reported and documented over the last few years []. Using GIS analytical functions and operations, it is possible to determine urban masses that are under the direct threat of flash flood hazards (Figure 15). A total area of 8.14 km2 of urban areas is directly located within the valley floors of the studied watersheds. The spatial extents of these urban areas vary from one valley to another (Figure 15). The urban areas threatened by flash floods increase in W. Al Halazoni, W. Al Nasouri, W. Umm Russais, and W. Al Wattwatt, reaching 2.0, 1.3, 1.0, and 0.9 km2, respectively (Figure 15). Limited urban areas under the threat of flash floods are recorded in other valleys (Figure 15). The valley floors of W. Hamid and W. Degla 4 did not have any spatial urban areas under the threat of flash flood hazards until the spatial urban expansion in February 2020 (Figure 15).
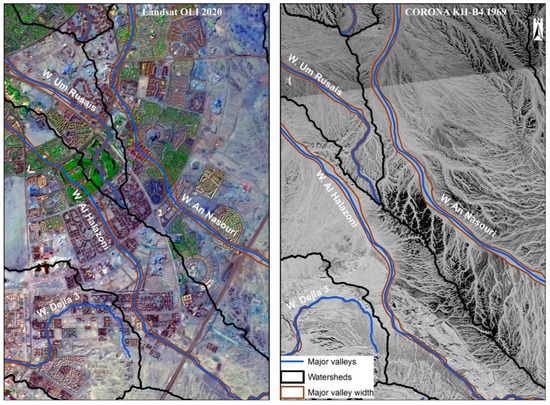
Figure 14.
The aggression of urban spatial expansion against the valley floors as demonstrated by the comparison between CORONA and Landsat OLI images acquired in 1969 and 2020, respectively.
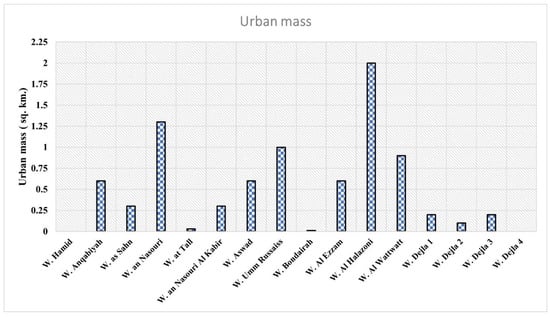
Figure 15.
Urban mass that is under threat of flash flood hazards within the watersheds in the study area east of Cairo.
6. Conclusions
Successful spatial urban expansion should adhere to appropriate watershed management practices. Earth observation satellite imagery enabled retrieval of the initial morphologic features before any spatial urban expansions. The CORONA images taken in 1969 with high spatial resolution enabled accurate tracking of watershed morphologic features, such as boundaries of watersheds, stream networks, and hillslopes, along with the spatial locations and extents of main valleys. The Landsat TM and ASTER satellites provided annual images of the study area extending from 1986 to 2020. The annual spatial urban expansions were automated into GIS layers for determination of the annual magnitudes of urban masses along with urban growth rates and directions. The study indicates that massive spatial urban expansions have occurred throughout the studied time period, with different rates in each phase of these expansions. The directions of spatial urban expansions have occurred principally in the northeastern directions, which are opposite to the geospatial orientations of the studied watersheds. The conflicting spatial urban expansions to the geospatial orientations of watersheds would strongly result in significant changes in topography through the planation processes of the urban construction.
These topographic changes may result in potential disturbances in the hydrologic parameters of watersheds in the study area. In addition, the topographic analyses asserted that the main valleys of the studied watersheds have a high potential for transporting masses of water and sediment from the surrounding hillslopes into the downstream reaches of the watersheds. Therefore, these main valleys can produce potential flash floods in response to rainstorms that occur intermittently in arid regions. The overlay and cartographic GIS analyses helped define and quantify urban areas that are located within the main valleys of the studied watersheds and are under direct threat of flash flood hazards. The potential of these main valleys to produce strong flash floods is expected to increase in response to the extensive spatial urban expansion throughout these watersheds. This study clearly indicates that the once bare arid fluvial watersheds in the area east of Cairo have been transformed into urban watersheds over the last few decades. Given this irreversible transformation, it is critical to carefully study and reassess the morphologic, topographic, and hydrologic characteristics of these urban watersheds to adopt successful watershed management strategies for the purpose of achieving social and environmental safety.
Author Contributions
Conceptualization, Heidi Shalaby and ElSayed Hermas; Data curation, Heidi Shalaby, Abudeif M. Farghaly, Ayman M. ElSayed, and Abdullah Alqurashi; Formal analysis, Heidi Shalaby, ElSayed Hermas, and Hassan Khormi; Investigation, Heidi Shalaby and ElSayed Hermas; Methodology, Heidi Shalaby, ElSayed Hermas, Ayman M. ElSayed, and Abdullah Alqurashi; Resources, Heidi Shalaby, ElSayed Hermas, Hassan Khormi, Abudeif M. Farghaly, Ayman M. ElSayed, Abdullah Alqurashi, and Ibrahim Ascoura; Software, Heidi Shalaby, Ayman M. ElSayed, and Abdullah Alqurashi; Validation, ElSayed Hermas, Hassan Khormi, Abudeif M. Farghaly, and Ibrahim Ascoura; Visualization, Heidi Shalaby, ElSayed Hermas, and Ibrahim Ascoura; Writing—original draft, Heidi Shalaby and ElSayed Hermas; Writing—review & editing, Heidi Shalaby, ElSayed Hermas, Hassan Khormi, and Abdullah Alqurashi. All authors have read and agreed to the published version of the manuscript.
Funding
This research received no external funding.
Institutional Review Board Statement
Not applicable.
Informed Consent Statement
Not applicable.
Data Availability Statement
Not applicable.
Acknowledgments
The authors would like to thank the anonymous reviewers and the editor for their constructive comments and suggestions for this manuscript.
Conflicts of Interest
The authors declare no conflict of interest.
References
- United Nations, Department of Economic and Social Affairs. Global Population Growth and Sustainable Development; United Nation: New York, NY, USA, 2022. [Google Scholar]
- Seto, K.C.; Güneralp, B.; Hutyra, L.R. Global forecasts of urban expansion to 2030 and direct impacts on biodiversity and carbon pools. Proc. Natl. Acad. Sci. USA 2012, 109, 16083–16088. [Google Scholar] [CrossRef] [PubMed] [Green Version]
- Li, X.; Zhou, W.; Ouyang, Z. Forty years of urban expansion in Beijing: What is the relative importance of physical, socioeconomic, and neighborhood factors? Appl. Geogr. 2013, 38, 1–10. [Google Scholar] [CrossRef]
- Liu, Y.; Zuo, R.; Dong, Y. Analysis of temporal and spatial characteristics of urban expansion in Xiaonan District from 1990 to 2020 using time series Landsat imagery. Remote Sens. 2021, 13, 4299. [Google Scholar] [CrossRef]
- Mahtta, R.; Fragkias, M.; Güneralp, B.; Mahendra, A.; Reba, M.; Wentz, E.A.; Seto, K.C. Urban land expansion: The role of population and economic growth for 300+ cities. NPJ Urban Sustain. 2022, 2, 5. [Google Scholar] [CrossRef]
- Aljoufie, M.; Zuidgeest, M.; Brussel, M.; van Maarseveen, M. Spatial–temporal analysis of urban growth and transportation in Jeddah City, Saudi Arabia. Cities 2013, 31, 57–68. [Google Scholar] [CrossRef]
- Daunt, A.B.P.; Inostroza, L.; Hersperger, A.M. The role of spatial planning in land change: An assessment of urban planning and nature conservation efficiency at the southeastern coast of Brazil. Land Use Policy 2021, 111, 105771. [Google Scholar] [CrossRef]
- Zhou, X.; Chen, H. Impact of urbanization-related land use land cover changes and urban morphology changes on the urban heat island phenomenon. Sci. Total Environ. 2018, 635, 1467–1476. [Google Scholar] [CrossRef]
- Elmqvist, T.; Andersson, E.; McPhearson, T.; Bai, X.; Bettencourt, L.; Brondizio, E.; Colding, J.; Daily, G.; Folke, C.; Grimm, N.; et al. Urbanization in and for the anthropocene. NPJ Urban Sustain. 2021, 1, 6. [Google Scholar] [CrossRef]
- Alig, R.J.; Kline, J.D.; Lichtenstein, M. Urbanization on the US landscape: Looking ahead in the 21st century. Landsc. Urban Plan. 2004, 69, 219–234. [Google Scholar] [CrossRef]
- PADCO Inc. Egypt Urban Growth and Urban Data Report; Prepared for the Ministry of Development of Egypt; PADCO Inc.: Washington, DC, USA, 1982. [Google Scholar]
- Moavenzadeh, F.; Selim, T.M. The Construction Industry in Egypt; Massachusetts Institute of Technology, Technology Adaptation Program: Cambridge, MA, USA, 1984. [Google Scholar]
- Selim, T.M. Development of the construction industry in Egypt. Int. J. Proj. Manag. 1985, 3, 27–34. [Google Scholar] [CrossRef]
- Saregeldin, M. Cairo: 1800–2000: Planning for the capital city in the context of Egypt’s history and development. In The Expanding Metropolis: Coping with the Urban Growth of Cairo; Evin, A., Ed.; Concept Media: Singapore, 1984; pp. 91–113. [Google Scholar]
- Feiler, G. Housing policy in Egypt. Middle East. Stud. 1992, 28, 295–312. [Google Scholar] [CrossRef]
- Emam, A. The futuer of urban growth in Egypt assessment of current trends and forging new approaches for sustainable development. JES J. Eng. Sci. 2019, 47, 752–764. [Google Scholar]
- Parker, J.B.; Coyle, J.R. Urbanization and Agricultural Policy in Egypt; US Department of Agriculture, Economic Research Service: Washington, DC, USA, 1981. [Google Scholar]
- Bécard, L. New Settlements: A New Approach to Solving Existing Housing and Urban Problems. In Architectural Transformations in the Islamic World—The Expanding Metropolis: Coping with the Urban Growth of Cairo; Amin, A., Ed.; Concept Media: Cairo, Egypt, 1985; pp. 183–187. [Google Scholar]
- Hafez, R.M. New cities between sustainability and real estate investment: A case study of New Cairo city. HBRC J. 2017, 13, 89–97. [Google Scholar] [CrossRef] [Green Version]
- Carle, M.V.; Halpin, P.N.; Stow, C.A. Patterns of watershed urbanization and impacts on water quality. JAWRA J. Am. Water Resour. Assoc. 2005, 41, 693–708. [Google Scholar] [CrossRef]
- Elmqvist, T.; Andersson, E.; Frantzeskaki, N.; McPhearson, T.; Olsson, P.; Gaffney, O.; Takeuchi, K.; Folke, C. Sustainability and resilience for transformation in the urban century. Nat. Sustain. 2019, 2, 267–273. [Google Scholar] [CrossRef]
- Sun, G.E.; Caldwell, P.V. Impacts of urbanization on stream water quantity and quality in the United States. Water Resour. Impact 2015, 17, 17–20. [Google Scholar]
- Sun, G.; Lockaby, B.G. Water quantity and quality at the urban–rural interface. In Urban–Rural Interfaces: Linking People and Nature; American Society of Agronomy: Madison, WI, USA, 2012; pp. 29–48. [Google Scholar]
- Maconachie, R. Urban Growth and Land Degradation in Developing Cities: Change and Challenges in Kano Nigeria; Routledge: London, UK, 2016. [Google Scholar]
- Oliveira, E.; Tobias, S.; Hersperger, A.M. Can strategic spatial planning contribute to land degradation reduction in urban regions? State of the art and future research. Sustainability 2018, 10, 949. [Google Scholar] [CrossRef] [Green Version]
- Hermas, E.; Alharbi, O.; Alqurashi, A.; Niang, A.; Al-Ghamdi, K.; Al-Mutiry, M.; Farghaly, A. Characterisation of Sand Accumulations in Wadi Fatmah and Wadi Ash Shumaysi, KSA, Using Multi-Source Remote Sensing Imagery. Remote Sens. 2019, 11, 2824. [Google Scholar] [CrossRef] [Green Version]
- Imbrenda, V.; Quaranta, G.; Salvia, R.; Egidi, G.; Salvati, L.; Prokopovà, M.; Coluzzi, R.; Lanfredi, M. Land degradation and metropolitan expansion in a peri-urban environment. Geomat. Nat. Hazards Risk 2021, 12, 1797–1818. [Google Scholar] [CrossRef]
- McDonald, R.I.; Green, P.; Balk, D.; Fekete, B.M.; Revenga, C.; Todd, M.; Montgomery, M. Urban growth, climate change, and freshwater availability. Proc. Natl. Acad. Sci. USA 2011, 108, 6312–6317. [Google Scholar] [CrossRef] [Green Version]
- Garschagen, M.; Romero-Lankao, P. Exploring the relationships between urbanization trends and climate change vulnerability. Clim. Change 2015, 133, 37–52. [Google Scholar] [CrossRef]
- Hao, L.; Huang, X.; Qin, M.; Liu, Y.; Li, W.; Sun, G. Ecohydrological processes explain urban dry island effects in a wet region, Southern China. Water Resour. Res. 2018, 54, 6757–6771. [Google Scholar] [CrossRef]
- Patra, S.; Sahoo, S.; Mishra, P.; Mahapatra, S.C. Impacts of urbanization on land use /cover changes and its probable implications on local climate and groundwater level. J. Urban Manag. 2018, 7, 70–84. [Google Scholar] [CrossRef]
- Lee, D.; Choe, H. Estimating the impacts of urban expansion on landscape ecology: Forestland perspective in the greater Seoul metropolitan area. J. Urban Plan. Dev. (ASCE) 2011, 137, 425–437. [Google Scholar] [CrossRef]
- McDonald, R.I.; Mansur, A.V.; Ascensão, F.; Colbert, M.; Crossman, K.; Elmqvist, T.; Gonzalez, A.; Güneralp, B.; Haase, D.r.; Hamann, M.; et al. Research gaps in knowledge of the impact of urban growth on biodiversity. Nat. Sustain. 2020, 3, 16–24. [Google Scholar] [CrossRef]
- Yang, X.; Li, S.; Zhu, C.; Dong, B.; Xu, H. Simulating urban expansion based on ecological security pattern—A case study of Hangzhou, China. Int. J. Environ. Res. Public Health 2022, 19, 301. [Google Scholar] [CrossRef]
- Kundu, S.; Khare, D.; Mondal, A. Past, present and future land use changes and their impact on water balance. J. Environ. Manag. 2017, 197, 582–596. [Google Scholar] [CrossRef]
- Kumar, S.; Moglen, G.E.; Godrej, A.N.; Grizzard, T.J.; Post, H.E. Trends in water yield under climate change and urbanization in the US Mid-Atlantic region. J. Water Resour. Plan. Manag. 2018, 144, 05018009. [Google Scholar] [CrossRef]
- Zeinali, V.; Vafakhah, M.; Sadeghi, S.H. Impact of urbanization on temporal distribution pattern of storm runoff coefficient. Environ. Monit. Assess. 2019, 191, 595. [Google Scholar] [CrossRef]
- Price, K. Effects of watershed topography, soils, land use, and climate on baseflow hydrology in humid regions: A review. Prog. Phys. Geogr. Earth Environ. 2011, 35, 465–492. [Google Scholar] [CrossRef]
- PEDRR. Managing Watersheds for Urban Resilience: Policy Brief; UN: Geneva, Switzerland, 2011; p. 16. [Google Scholar]
- Areu-Rangel, O.S.; Cea, L.; Bonasia, R.; Espinosa-Echavarria, V.J. Impact of Urban Growth and Changes in Land Use on River Flood Hazard in Villahermosa, Tabasco (Mexico). Water 2019, 11, 304. [Google Scholar] [CrossRef] [Green Version]
- Abd-Elhamid, H.F.; Zeleňáková, M.; Vranayová, Z.; Fathy, I. Evaluating the Impact of Urban Growth on the Design of Storm Water Drainage Systems. Water 2020, 12, 1572. [Google Scholar] [CrossRef]
- Del Monte, M.; D’Orefice, M.; Luberti, G.M.; Marini, R.; Pica, A.; Vergari, F. Geomorphological classification of urban landscapes: The case study of Rome (Italy). J. Maps 2016, 12, 178–189. [Google Scholar] [CrossRef] [Green Version]
- Hereher, M.E. Analysis of urban growth at Cairo, Egypt using remote sensing and GIS. Nat. Sci. 2012, 4, 19961. [Google Scholar] [CrossRef] [Green Version]
- Megahed, Y.; Cabral, P.; Silva, J.; Caetano, M. Land cover mapping analysis and urban growth modelling using remote sensing techniques in Greater Cairo Region—Egypt. ISPRS Int. J. Geo-Inf. 2015, 4, 1750–1769. [Google Scholar] [CrossRef] [Green Version]
- El-Sawy, E.K.; Ibrahim, A.M.; El-Bastawesy, M.A.; El-Saud, W.A. Detection of land use and land cover changes for New Cairo area, using remote sensing and GIS. Int. J. Sci. Res. (IJSR) 2000, 5, 161321. [Google Scholar]
- Salem, A. The anthropogenic geomorphology of the new suburbs, East of Greater Cairo, Egypt. Bull. De La Société De Géographie D’egypte 2018, 91, 1–28. [Google Scholar] [CrossRef]
- Roy, D.P.; Wulder, M.A.; Loveland, T.R.; Woodcock, C.E.; Allen, R.G.; Anderson, M.C.; Helder, D.; Irons, J.R.; Johnson, D.M.; Kennedy, R.; et al. Landsat-8: Science and product vision for terrestrial global change research. Remote Sens. Environ. 2014, 145, 154–172. [Google Scholar] [CrossRef] [Green Version]
- Chen, J.; Chen, J.; Liao, A.; Cao, X.; Chen, L.; Chen, X.; He, C.; Han, G.; Peng, S.; Lu, M.; et al. Global land cover mapping at 30m resolution: A POK-based operational approach. ISPRS J. Photogramm. Remote Sens. 2015, 103, 7–27. [Google Scholar] [CrossRef] [Green Version]
- Toure, S.I.; Stow, D.A.; Shih, H.; Weeks, J.; Lopez-Carr, D. Land cover and land use change analysis using multi-spatial resolution data and object-based image analysis. Remote Sens. Environ. 2018, 210, 259–268. [Google Scholar] [CrossRef]
- Havenith, H.r.; Strom, A.; Caceres, F.; Pirard, E. Analysis of landslide susceptibility in the Suusamyr region, Tien Shan: Statistical and geotechnical approach. Landslides 2006, 3, 39–50. [Google Scholar] [CrossRef]
- Menze, B.H.; Ur, J.A.; Sherratt, A.G. Detection of ancient settlement mounds. Photogramm. Eng. Remote Sens. 2006, 72, 321–327. [Google Scholar] [CrossRef] [Green Version]
- Galiatsatos, N.; Donoghue, D.N.M.; Philip, G. High resolution elevation data derived from stereoscopic CORONA imagery with minimal ground control. Photogramm. Eng. Remote Sens. 2007, 73, 1093–1106. [Google Scholar] [CrossRef] [Green Version]
- Narama, C.; Kääb, A.; Duishonakunov, M.; Abdrakhmatov, K. Spatial variability of recent glacier area changes in the Tien Shan Mountains, Central Asia, using Corona (~1970), Landsat (~2000), and ALOS (~2007) satellite data. Glob. Planet. Change 2010, 71, 42–54. [Google Scholar] [CrossRef]
- Hepcan, S.; Hepcan, C.C.; Kilicaslan, C.; Ozkan, M.B.; Kocan, N. Analyzing Landscape Change and Urban Sprawl in a Mediterranean Coastal Landscape: A Case Study from Izmir, Turkey. J. Coast. Res. 2012, 29, 301–310. [Google Scholar] [CrossRef]
- Jelil Niang, A.; Hermas, E.; Alharbi, O.; Al-Shaery, A. Monitoring landscape changes and spatial urban expansion using multi-source remote sensing imagery in Al-Aziziyah Valley, Makkah, KSA. Egypt. J. Remote Sens. Space Sci. 2020, 23, 89–96. [Google Scholar] [CrossRef]
- Gao, J.; Skillcorn, D. Capability of SPOT XS data in producing detailed land cover maps at the urban-rural periphery. Int. J. Remote Sens. 1998, 19, 2877–2891. [Google Scholar] [CrossRef]
- Altmaier, A.; Kany, C. Digital surface model generation from CORONA satellite images. ISPRS J. Photogramm. Remote Sens. 2002, 56, 221–235. [Google Scholar] [CrossRef]
- Schneider, A.; Friedl, M.A.; McIver, D.K.; Woodcock, C.E. Mapping urban areas by fusing multiple sources of coarse resolution remotely sensed data. Photogramm. Eng. Remote Sens. 2003, 69, 1377–1386. [Google Scholar] [CrossRef]
- Schneider, A.; Woodcock, C.E. Compact, dispersed, fragmented, extensive? A comparison of urban growth in twenty-five global cities using remotely sensed data, pattern metrics and census information. Urban Stud. 2008, 45, 659–692. [Google Scholar] [CrossRef]
- Li, C.; Sun, G.; Caldwell, P.V.; Cohen, E.; Fang, Y.; Zhang, Y.; Oudin, L.; Sanchez, G.M.; Meentemeyer, R.K. Impacts of Urbanization on Watershed Water Balances Across the Conterminous United States. Water Resour. Res. 2020, 56, e2019WR026574. [Google Scholar] [CrossRef]
- Alqurashi, A.F. Quantification of urban patterns and processes through space and time using remote sensing data: A comparative study between three Saudi Arabian cities. Sustainability 2021, 13, 12615. [Google Scholar] [CrossRef]
- Liu, S.; Zhang, X.; Feng, Y.; Xie, H.; Jiang, L.; Lei, Z. Spatiotemporal dynamics of urban green space influenced by rapid urbanization and land use policies in Shanghai. Forests 2021, 12, 476. [Google Scholar] [CrossRef]
- Shukri, N.M.; Akmal, M.G. The geology of Gebel el-Nasuri and Gebel el-Anqabiya district. Bull. Soc. Geogr. Egypte 1953, 26, 243–276. [Google Scholar]
- Said, R. Planktonic foraminifera from the Thebes formation, Luxor, Egypt. Micropaleontology 1960, 6, 277–286. [Google Scholar] [CrossRef]
- Sallam, E.; Issawi, B.; Osman, R. Stratigraphy, facies, and depositional environments of the Paleogene sediments in Cairo–Suez district, Egypt. Arab. J. Geosci. 2015, 8, 1939–1964. [Google Scholar] [CrossRef]
- Hassan, H.F.; Korin, A.H. Contribution to the biostratigraphy of the Middle-Upper Eocene rock units at North Eastern Desert; an integrated micropaleontological approach. Heliyon 2019, 5, e01671. [Google Scholar] [CrossRef] [Green Version]
- Abou Khadrah, A.M.; Wali, A.M.A.; Müller, A.M.A.; El Shazly, A.M. Facies development and sedimentary structures of syn-rift sediments, Cairo-Suez District, Egypt. Bull. Fac. Sci. Zagazig Univ 1993, 15, 355–373. [Google Scholar]
- Abdelkhalek, N.K.M.; Ghazy, E.W.; Abdel-Daim, M.M. Pharmacodynamic interaction of Spirulina platensis and deltamethrin in freshwater fish Nile tilapia, Oreochromis niloticus: Impact on lipid peroxidation and oxidative stress. Environ. Sci. Pollut. Res. 2015, 22, 3023–3031. [Google Scholar] [CrossRef]
- Strougo, A.; Abd-Allah, A.M. Mokattamian stratigraphy of north central Eastern desert (south of maadi-Qattamiya road). Middle East Res. Cent. Earth Sci. Ser. Ain Shams Univ. 1990, 4, 152–175. [Google Scholar]
- Moustafa, A.R.; Yehia, M.A.; Abdel Tawab, S. Structural setting of the area east of Cairo, Maadi and Helwan. Middle East Res. Cent. Ain Shams Univ. Sci. Res. Ser. 1985, 5, 40–64. [Google Scholar]
- Hagag, W. Structural evolution and Cenozoic tectonostratigraphy of the Cairo-Suez district, north Eastern Desert of Egypt: Field-structural data from Gebel Qattamiya-Gebel Um Reheiat area. J. Afr. Earth Sci. 2016, 118, 174–191. [Google Scholar] [CrossRef]
- Hagag, W.; Hassan, S.; Toni, M. Active tectonic structures in northeastern Egypt: A geospatial analysis using structural, remote sensing, and seismic data. Arab. J. Geosci. 2019, 12, 572. [Google Scholar] [CrossRef]
- Darwish, A.; Elghazali, S.; Shakweer, A. The effect of ring road construction on urban land cover change: Greater Cairo case study. In Proceedings of the 2007 Urban Remote Sensing Joint Event, Paris, France, 11–13 April 2007; pp. 1–6. [Google Scholar]
- Duranton, G.; Turner, M.A. Urban growth and transportation. Rev. Econ. Stud. 2012, 79, 1407–1440. [Google Scholar] [CrossRef]
- Osman, T.; Shaw, D.; Kenawy, E. An integrated land use change model to simulate and predict the future of greater Cairo metropolitan region. J. Land Use Sci. 2018, 13, 565–584. [Google Scholar] [CrossRef]
- Scaramuzza, P.; Barsi, J. Landsat 7 scan line corrector-off gap-filled product development. In Proceedings of the Pecora, Sioux Falls, SD, USA, 23–27 October 2005; pp. 23–27. [Google Scholar]
- McDonald, R.A. Opening the Cold War sky to the public: Declassifying satellite reconnaissance imagery. Photogramm. Eng. Remote Sens. 1995, 61, 385–390. [Google Scholar]
- Dashora, A.; Lohani, B.; Malik, J.N. A repository of earth resource information–CORONA satellite programme. Curr. Sci. 2007, 92, 926–932. [Google Scholar]
- Richelson, J.T. A “Rifle” in space. Air Force Magazine, 1 June 2003; 72–75. [Google Scholar]
- Fekete, A. Corona high-resolution satellite and aerial imagery for change detection assessment of natural hazard risk and urban growth in El Alto/La Paz in Bolivia, Santiago de Chile, Yungay in Peru, Qazvin in Iran, and Mount St. Helens in the USA. Remote Sens. 2020, 12, 3246. [Google Scholar] [CrossRef]
- Grosse, G.; Schirrmeister, L.; Kunitsky, V.V.; Hubberten, H. The use of CORONA images in remote sensing of periglacial geomorphology: An illustration from the NE Siberian coast. Permafr. Periglac. Processes 2005, 16, 163–172. [Google Scholar] [CrossRef] [Green Version]
- Said, R. The Geology of Egypt; El Sevier Publ Co.: Amsterdam, The Netherlands, 1962. [Google Scholar]
Publisher’s Note: MDPI stays neutral with regard to jurisdictional claims in published maps and institutional affiliations. |
© 2022 by the authors. Licensee MDPI, Basel, Switzerland. This article is an open access article distributed under the terms and conditions of the Creative Commons Attribution (CC BY) license (https://creativecommons.org/licenses/by/4.0/).