Abstract
Oxidative stress and environmental factors impair spermatogenesis and testicular function. The gut–testis axis has emerged as an important regulator of male reproductive health, influencing spermatogenesis beyond traditional endocrine control. This study evaluated the efficacy of a combination of Carob (Ceratonia siliqua), Bifidobacterium longum GA24, and ribonucleotides (MIX) on in vitro models of the gut–testis axis (co-culture Caco-2/HSerC on Transwell® system). At the intestinal level, MIX increased Caco-2 cell viability, improved tight junction levels, regulated ROS production, and increased butyrate synthesis beyond physiological values, highlighting improved intestinal barrier function and integrity. In the gut–testis model, HSerC cells subjected to H2O2 300 μM showed 1.5-fold increased viability, 81% reduction in ROS, increased ATP (+1.7-fold) and NO (+1.8-fold). The MIX combination reduced the apoptotic markers BAX (−1.6-fold), caspase-3 (−1.84-fold), and Cyto-C (−1.52-fold), and the inflammatory mediators TNFα and IL-6. MIX enhanced Sertoli cell maturation markers, increasing AR by 6-fold, p27 by 1.64-fold, and SGP-2 by 2.5-fold, and modulated hormonal-related markers by increasing testosterone and FSHR expression. These findings indicate that MIX may positively modulate the gut–testicular axis, supporting the intestinal barrier, testicular health, and spermatogenesis.
1. Introduction
Male subfertility is a multifactorial condition strongly associated with oxidative stress, hormonal dysregulation, and lifestyle-related factors, all of which converge on impaired spermatogenesis and reduced sperm quality [1,2,3]. Beyond local testicular alterations, growing evidence indicates that male reproductive function is influenced by systemic mechanisms, particularly those involving the gut–testis axis, which integrates metabolic, inflammatory, endocrine, and redox signalling pathways [4,5,6].
A central component of this axis is the integrity of the intestinal epithelial barrier. Alterations in gut homeostasis increase intestinal permeability, promoting the systemic translocation of bacterial endotoxins such as lipopolysaccharides (LPSs) and triggering chronic low-grade inflammation [4]. This inflammatory milieu is closely associated with excessive production of reactive oxygen species (ROS), which represent a major pathogenic factor in male infertility. Elevated ROS levels have been shown to impair mitochondrial function, induce lipid peroxidation, and cause DNA damage in germ cells, ultimately compromising sperm quality and viability [7,8]. Oxidative stress also directly interferes with hormonal signalling and Sertoli cell function. Excessive ROS and inflammatory cytokines, such as tumour necrosis factor alpha (TNF-α), interleukin 6 (IL-6), and interleukin 1 beta (IL-1β), negatively affect follicle-stimulating hormone receptor (FSHR) expression and signalling, a key regulator of Sertoli cell metabolism and germ cell development [9,10,11]. Disruption of FSHR-mediated signalling perturbs the expression of key downstream regulators of spermatogenic progression. This includes the androgen receptor (AR), which is critical for Sertoli cell maturation and support of germ cell development; secreted glycoprotein-2 (SGP-2), a major Sertoli cell secretory protein involved in the seminiferous tubular microenvironment; and cell cycle regulators such as p27, which coordinate germ cell proliferation and differentiation [12]. Impairment of these pathways disrupts the coordination of germ cell development and can compromise overall spermatogenic efficiency [13]. In parallel, oxidative and inflammatory stress activate apoptotic pathways within the testicular microenvironment. Increased expression of pro-apoptotic markers, such as Bcl-2-associated X protein (BAX), has been associated with Sertoli cell dysfunction, breakdown of the blood–testis barrier, and loss of germ cells, thereby contributing to reduced spermatogenic efficiency. Therefore, maintaining redox balance and hormonal responsiveness at the Sertoli cell level is a critical target for preserving male reproductive health [14].
Within this mechanistic framework, nutraceutical strategies aimed at modulating oxidative stress, hormonal signalling, and epithelial–testicular interactions have gained increasing interest as complementary approaches for the management of male subfertility [2,15]. Ceratonia siliqua (Carob) is a plant-derived compound with documented antioxidant and bioactive properties. Experimental evidence indicates that carob extract can modulate cyclic adenosine monophosphate (AMP) production and key enzymes involved in testicular steroidogenesis, leading to improvements in testosterone levels and sperm quality, and suggesting a protective role against ROS-mediated and hormone-related dysfunctions [15,16,17,18].
In addition, probiotics have emerged as important regulators of intestinal homeostasis and epithelial barrier integrity. By stabilising gut microbiota composition and limiting inflammatory signalling, probiotics indirectly contribute to the control of systemic oxidative stress and endocrine disruption [19,20,21]. Alterations in the male microbiota have been associated with impaired sperm parameters and changes in testicular function, while specific strains, such as Bifidobacterium longum, have been shown to reduce testicular inflammation and improve sperm quality [22,23,24]. These effects support a functional link between gut microbial balance, redox control, and Sertoli cell-dependent spermatogenesis.
Ribonucleotides further complement this approach as semi-essential nutrients required for cellular proliferation, tissue repair, and metabolic adaptation under stress conditions. Given the limited capacity of intestinal epithelial and testicular cells for de novo nucleotide synthesis, exogenous ribonucleotides may support epithelial integrity and cellular homeostasis, indirectly sustaining hormonal and redox-sensitive pathways within the gut–testis axis [25,26].
Based on the scientific evidence provided, our study aims to investigate an innovative combination of Carob, B. longum, and a ribonucleotide mixture (Ribomix). Using an in vitro three-dimensional co-culture model of the gut–testis axis (Caco-2/HSerC), we aimed to evaluate the effects of this formulation on intestinal epithelial function, oxidative stress modulation, hormonal signalling, particularly FSHR-related pathways, and key Sertoli cell markers involved in apoptosis, differentiation, and cell cycle regulation (BAX, AR, SGP-2, and p27). This targeted, mechanistic approach enables a direct link between the existing literature and the hypotheses tested in the present study, providing a preliminary biologically coherent framework for the prevention and management of male subfertility.
2. Materials and Methods
2.1. Preparation of Substances
B. longum (hereinafter B. longum GA24), donated by Probionova SA (Lugano, Switzerland), Ribomix (consisting of a mixture of 5′-natural nucleotides obtained by enzymatic hydrolysis of yeast, including 5′-AMP.Na2, 5′-CMP.Na2, 5′-UMP.Na2, 5′-GMP.Na2, and nucleosides; donated by Prosol Spa, Madone, BG, Italy), and Carob seeds extract 4:1 (donated by Nutra Futura Srl, Legnano, MI, Italy; see Table 1) were prepared freshly before use.

Table 1.
Bioactive composition of Ceratonia siliqua L. seed extract used in the study.
B. longum GA24 was supplied in lyophilised form and freshly reconstituted immediately before use following the manufacturer’s instructions to ensure bacterial viability at the time of application. B. longum GA24 was intentionally used as a live probiotic, not as a heat-killed bacterium or postbiotic material. The evaluated doses for the probiotic under consideration correspond to concentrations of colony-forming units (CFUs) of about 1 × 10⁹, 2 × 10⁹, and 3 × 10⁹ CFUs, respectively, for the dosages 10 mg, 20 mg, and 30 mg. CFU equivalents were determined using ISO 4833-1:2013 [27,28] plate counting protocols, and manufacturer-validated CFU/millilitre ratios were used; specific cells of the viable bacterial strain were found per milligram of powder. Following this protocol, viability was confirmed under both antibiotic-containing and antibiotic-free conditions, showing no significant differences in CFU counts, thus supporting the use of live B. longum GA24 in all experimental settings. Therefore, antibiotics were also maintained to prevent contamination during all culture experiments.
A dose–response study was also conducted to evaluate various concentrations of selected extracts, informed by the scientific literature and similar previous studies [25,29,30] for each material under investigation using the intestinal cellular model. In detail: for the Carob extract, concentrations of 5 μg/mL, 20 μg/mL, and 50 μg/mL were examined; for Ribomix, concentrations ranging from 1% to 100% were used; and for B. longum GA24, we studied dosages of 10 mg, 20 mg, and 30 mg. The mixture, Ribomix, was applied at the final concentrations described above, w/v relative to the stock solution. The concentration of 100% corresponds to the undiluted stock solution.
For each test, performed in triplicate, samples were diluted in culture medium before use in DMEM without phenol red (Merck Life Science, Rome, Italy) supplemented with 0% FBS, 50 IU/mL penicillin–streptomycin (Merck Life Science, Rome, Italy), and 2 mM L-glutamine solution (Merck Life Science, Rome, Italy). In a similar manner, hydrogen peroxide (H2O2, Merck Life Science, Rome, Italy) was also added to the same medium as the other agents under consideration, at a final concentration of 300 µM.
For all ELISA assays, cells were incubated in serum-free DMEM to avoid interference from serum-derived proteins and hormones. Matrix controls (medium only, with or without residual additives) were included for each assay to correct for background signal.
2.2. Cell Cultures
The human intestinal epithelial cell line Caco-2, purchased from the American Type Culture Collection (ATCC, Manassas, VA, USA), was also used as an in vitro model to predict intestinal absorption following oral administration [31]. This cell line was cultured in Dulbecco’s Modified Eagle’s Medium/Nutrient F-12 Ham (DMEM-F12, Merck Life Science, Rome, Italy) containing 10% FBS (Merck Life Science, Rome, Italy), 2 mM L-glutamine, and 1% penicillin–streptomycin (Merck Life Science, Rome, Italy) and maintained at 37 °C in a humidified incubator with 5% CO2 [32]. Paracellular permeability and transport properties were balanced using cells at passage numbers 26–32 [33]. For cell viability and ROS assays, 1 × 10⁴ Caco-2 cells were seeded in 96-well multi-wells. Cells were synchronised for 8 h in phenol red-free DMEM supplemented with 0.5% FBS, 2 mM L-glutamine, and 1% penicillin–streptomycin at 37 °C, using a density of 2 × 10⁴ cells per 6.5 mm (Corning® Costar®, Merck Life Science, Rome, Italy) of polycarbonate membrane insert with a 0.4 μm pore size (Corning® Costar®, Merck Life Science, Rome, Italy) in a 24-well plate for intestinal uptake analysis [32].
Primary human Sertoli cells (HSerC, ScienCell Research Laboratories, Carlsbad, CA, USA) were cultured in poly-L-lysine-coated flasks using SerCM medium (ScienCell Research Laboratories, Carlsbad, CA, USA) supplemented with 1% SerCGS (ScienCell Research Laboratories, Carlsbad, CA, USA), 5% FBS, and 1% penicillin–streptomycin according to the manufacturer’s instructions. Cells were maintained in an incubator at 37 °C and 5% CO2 [34,35]. Cells were used from passage 4 to passage 6. For all the analyses, 1 × 10⁵ cells were seeded in a 24-well poly-lysine multiwell and were subsequently co-cultured with Caco-2 cells using a Transwell® system (Corning Inc., Corning, NY, USA) (see Section 2.12).
2.3. Experimental Protocol
The experimental design was structured to investigate the intestinal absorption and biological effects of the tested formulation within the gut–testis axis. To this end, the study was divided into three sequential experimental phases.
The first experimental phase consisted of a dose–response study at the intestinal level to identify the optimal concentration for each of the three individual agents. Caco-2 cells were exposed to each compound for 1–6 h, and cell viability was evaluated using the 3-(4,5-dimethylthiazol-2-yl)-2,5-diphenyltetrazolium bromide (MTT) assay. Based on these results, the optimal concentrations of the individual agents were combined to generate the final formulation (MIX or Probiofert Uomo), which was subsequently tested and compared with the single compounds in the following experimental phases.
The second step aimed to analyse bioavailability, integrity, and permeability through the intestinal tract by using a 3D barrier model validated in the literature with Caco-2 cells on the Transwell® system [31]. Caco-2 monolayers were treated with carob extract, Ribomix, B. longum GA24, or the MIX formulation for 1–6 h. Cell viability and safety were assessed using the MTT assay, while intracellular ROS production was measured using a cytochrome C (Cyto-C) colourimetric method. Additionally, integrative analyses were performed to investigate intestinal antioxidant mechanisms, including nuclear factor erythroid 2-related factor 2 (Nrf2) activation and superoxide dismutase 1 (SOD1) expression, as reported in Appendix A. Intestinal barrier function and integrity were monitored by measuring transepithelial electrical resistance (TEER) using a volt–ohm metre (EVOM3™; World Precision Instruments, Sarasota, FL, USA). In parallel, tight junction (TJ) protein expression was quantified by ELISA, including occludin, claudin-1, and zonula occludens-1 (ZO-1). Additionally, levels of a lipid metabolite relevant to intestinal barrier function, butyric acid, were analysed following treatment, along with the evaluation of probiotic adherence to the intestinal epithelium, as reported in Appendix A.
The third experimental phase recreated an in vitro gut–testis axis by co-culturing Caco-2 cells in the apical compartment and primary human Sertoli cells (HSerC) in the basolateral compartment of a Transwell® system, allowing direct communication between the two cell types. To model oxidative stress, HSerC cells were pretreated with 300 μM H2O2 for 24 h, inducing controlled oxidative stress while preserving cell viability [36]. After this priming period, cells were transferred via Transwell® inserts into co-culture with intestinal cells. Immediately before co-culture, the medium was refreshed to minimise any residual H2O2, ensuring that the observed effects resulted from pre-induced oxidative stress rather than ongoing direct exposure [36,37]. Following a 24 h treatment with the test samples, biological effects at the testicular level were evaluated, including cell viability, adenosine triphosphate (ATP) levels, nitric oxide (NO) production, and intracellular ROS. The inflammatory profile was assessed by quantifying TNFα and IL-6 using ELISA, while the apoptotic process was evaluated through ELISA detection of BAX and Caspase 3 and confirmed by Cyto-C measurements. Markers of spermatogenesis and Sertoli cell function were analysed by measuring the expression of AR, p27, and SGP-2. Hormonal signalling was evaluated by measuring FSHR levels using both ELISA and Western blot analysis, and also testosterone analysis (ELISA kit; Abcam, Cambridge, UK).
2.4. MTT Viability
Cell viability analysis was performed with a classical technique based on the MTT In Vitro Toxicology Test Kit (Merck Life Science, Rome, Italy) [38,39], following the manufacturer’s instructions. At the end of treatment, cells were incubated with 1% MTT dye for 2 h in an incubator at 37 °C, 5% CO2, and 95% humidity. Purple formazan crystals were dissolved in an equal volume of MTT Solubilization Solution. Cell viability was determined by measuring absorbance at 570 nm with correction at 690 nm using a spectrophotometer (Infinite 200 Pro MPlex, Tecan, Männedorf, Switzerland) and calculated by comparing results to untreated control cells (baseline 0%). The findings, expressed as the mean ± SD (%) and based on five separate tests, each carried out in triplicate, are compared with the untreated control value (0% line).
2.5. In Vitro Model of the Intestinal Barrier
An in vitro intestinal barrier model was created using the Transwell® system, following a standard protocol reported in the literature [40] and approved by the European Medicines Agency (EMA) and the Food and Drug Administration (FDA) to estimate the absorption, metabolism, cellular response, and transepithelial interaction potential of different substances after oral intake in humans [41,42]. Briefly, Caco-2 cells, plated as described above, were maintained in complete culture medium, changing it every other day on the basal and apical sides for 21 days before simulations [40]. Throughout the maturation period, TEER values were measured using the EVOM3™ with STX2 rod electrodes (World Precision Instruments, Sarasota, FL, USA) to assess the formation of a mature intestinal epithelium and a proper paracellular barrier. On day 21, when TEER values were ≥400 Ω∙cm2 [43,44], uptake analysis began [44]. Before stimulation, the culture medium on the apical side was adjusted to pH 6.5, the pH of the lumen of the small intestine, while pH 7.4 on the basolateral side represented blood [31]. Under these conditions, test substances were added to the apical environment in a time-dependent study (1 to 6 h). At each time point, intestinal uptake was assessed using 0.04% fluorescein (Merck Life Science, Rome, Italy), a marker dye used to assess transepithelial transport [44]. The amount of fluorescein transported was measured at 37 °C for 40 min by incubating Caco-2 cells at the above concentration (apical pH, 6.0; basolateral pH, 7.4). Fluorescence was detected with a fluorescence spectrophotometer (Infinite 200 Pro MPlex, Tecan, Männedorf, Switzerland) at excitation/emission wavelengths of 490/514 nm. Cells were stimulated with all substances from 1 h to 6 h before subsequent analyses, including the permeability assay. The following formula determines the permeation rate:
Jmax: the maximum permeation rate. [C]: the initial concentration of fluorescein. Kt: the Michaelis–Menten constant.
Jmax [C]/(Kt + [C])
Results are shown as mean ± SD (%), including negative controls without cells to eliminate effects of the Transwell® membrane.
2.6. ROS Production
Quantification of superoxide anion release was obtained following a standard protocol based on Cyto-C reduction [39] in culture supernatants at 550 nm (Infinite 200 Pro MPlex, Tecan, Männedorf, Switzerland). Specifically, 100 μL Cyto-C (Merck, Milan, Italy) was added to all wells, and 100 μL superoxide dismutase (Merck, Milan, Italy) and 100 μL Cyto-C were added to the empty wells; the plate was then incubated for 30 min. Subsequently, 100 μL was taken from each well to measure the absorbance. The O2 rate was expressed as the mean ± SD (%) of nanomoles of reduced Cyto-C per microgram of protein, compared with the untreated control value (0% line).
2.7. TJ ELISA Kit
Tight junction proteins were assessed using Caco-2 cell lysates. The Human Occludin (OCLN) ELISA Kit (MyBiosource, San Diego, CA, USA) was used to test occludin levels, and the ELISA Kit from Cusabio Technology LLC (Houston, TX, USA) was used to quantify claudin-1. The Human Tight Junction Protein 1 (TJP1) ELISA Kit (MyBiosource, San Diego, CA, USA) was used to measure Zonula Occludens-1 (Zo-1) levels according to the manufacturer’s instructions. Protein concentrations were determined by interpolation from standard curves ranging from 0 to 1500 pg/mL for occludin and 0 to 1000 pg/mL for claudin-1 and Zo-1. Absorbance was measured at 450 nm using a Tecan spectrophotometer (Infinite 200 Pro MPlex, Tecan, Männedorf, Switzerland). The findings, expressed as the mean ± SD (%) and based on five separate tests, each carried out in triplicate, are compared with the untreated control value (0% line).
2.8. Butyric Acid Quantification
Butyric acid levels in the basolateral chamber of the Caco-2 cells in the Transwell® system were determined using an ELISA kit (Cloud-Clone, Wuhan, China) according to the manufacturer’s instructions [45]. After adding the stop solution, absorbance was read at 450 nm with an Infinite 200 Pro MPlex plate reader (Tecan, Männedorf, Switzerland). Concentrations were calculated from a standard curve ranging from 0 to 10,000 pg/mL. Data are reported as the mean ± SD (pg/mL) from five independent experiments, each performed in triplicate.
2.9. Probiotic Surface Hydrophobicity
Surface hydrophobicity was assessed following established protocols [46]. Probiotic suspensions (4 mL) were mixed with xylene (0.4 mL) and incubated for 15 min to allow phase separation, with phosphate-buffered saline (PBS) as a negative control. The absorbance of the aqueous phase and the control was measured at 600 nm. Each condition was tested in triplicate for ten samples, and hydrophobicity was calculated using the standard formula.
OD600 (control): The absorption value of the control. OD600 (test): The absorption value of the sample.
Data reported in Appendix A were represented as ± SD (%) compared with the untreated control value (0% line).
2.10. Nrf2 Production
Nrf2 levels in Caco-2 cell lysates were quantified using the NRF2 Quantification ELISA kit (MyBioSource, San Diego, CA, USA), according to the manufacturer’s instructions. Samples (100 µL) were incubated in 96-well plates at 37 °C, then sequentially incubated with detection solutions A and B. After substrate development in the dark, the reaction was stopped, and absorbance was measured at 450 nm using a microplate reader (Infinite 200 Pro-MPlex, Tecan, Männedorf, Switzerland). Nrf2 concentrations were calculated from a standard curve (0–25 ng/mL). Results were expressed as mean ± SD (%) versus control (line 0%) of five independent experiments performed in triplicate.
2.11. SOD Production
In Caco-2 cell lysates, superoxide dismutase (SOD) levels were quantified using a commercial Superoxide Dismutase Assay Kit (Cayman Chemical, Tallinn, Estonia), in accordance with the manufacturer’s protocol [39]. SOD activity was calculated from a standard calibration curve ranging from 0.005 to 0.05 U/mL. Absorbance values were recorded at 440–460 nm using a microplate reader (Infinite 200 Pro MPlex, Tecan, Männedorf, Switzerland). Data were expressed as percentage variation relative to untreated control cells (baseline set to 0%) and represent the mean ± SD of five independent experiments performed in triplicate.
2.12. In Vitro Gut–Testis Axis Model
HSerC cells, 1 × 10⁵, were seeded onto 24-well poly-lysine-coated plates two days before the completion of gut cell maturation and maintained at 37 °C until a monolayer formed. Meanwhile, 2 × 10⁴ Caco-2 cells were cultured on 6.5 mm Transwell® inserts with a 0.4 μm pore size polycarbonate membrane (Corning® Costar®, Merck Life Science, Rome, Italy). After a two-day maturation period, the Transwell® insert containing the Caco-2 monolayer was placed into the well with the Sertoli cell monolayer, establishing a gut–testis axis by functionally connecting the intestinal and testicular compartments for subsequent treatments.
2.13. ATP Production
At the end of each stimulation, HSerC cells of the gut–testis axis model were immediately treated with the components of the ATP assay kit (Calbiochem, San Diego, USA) according to the manufacturer’s instructions [47]. Luminescence was measured within 1 min after the addition of the ATP-monitoring enzyme in an Infinite 200 Pro MPlex reader (Tecan, Männedorf, Switzerland). Luminescence was calculated as % μmol of ATP/g protein and reported as mean ± SD of nanomol (nmol) per well of five independent experiments performed in triplicate versus untreated control (line 0%).
2.14. Nitric Oxide Production
Nitric oxide (NO) production was assessed by indirect measurement of nitrite concentration on HSerC cells of the gut–testis axis model using the Griess assay (Promega Corporation, Madison, WI, USA) according to the manufacturer’s instructions, as previously described [48]. Absorbance was measured with a microplate reader (Infinite 200 Pro MPlex, Tecan, Männedorf, Switzerland) at 550 nm. Standard nitrite dilutions in the range of 100–3125 μM (2-fold serial dilution) were used to calibrate the assay. Results from five independent experiments, performed in triplicate, are presented as the mean ± SD (%) of viable cells relative to the untreated control (line 0%).
2.15. BAX ELISA KIT
BAX levels were determined on HSerC cells of the gut–testis axis model using an ELISA kit (Human Bax ELISA Kit, MyBiosource, San Diego, CA, USA) according to the manufacturer’s instructions [49]. The absorbance of the samples was measured at 450 nm with a spectrophotometer (Infinite 200 Pro MPlex, Tecan, Männedorf, Switzerland). The results were compared with the standard curve (range 0 to 2000 pg/mL) and expressed as mean ± SD (%) normalised to the untreated control value (line 0%).
2.16. Caspase 3 ELISA Kit
Caspase 3 levels were studied in HSerC cell lysates of the gut–testis axis model using an ELISA kit (Caspase 3 (Cleaved) Human ELISA Kit, Thermoscientific, Waltham, MA, USA), according to the manufacturer’s instructions [50], by reading the absorbance of the sample at 450 nm with a spectrometer (Infinite 200 Pro MPlex, Tecan, Männedorf, Switzerland). The data were obtained by comparison with a standard curve (0.039 to 2.5 ng/mL), and the results were expressed as the mean ± SD (%) relative to the untreated control value (line 0%).
2.17. Cytochrome C (Cyto-C) ELISA Kit
The HSerC cell lysates of the gut–testis axis model were used to analyse Cyto-C levels using an ELISA kit (Cyto-C Human ELISA Kit, Thermoscientific, Waltham, MA, USA), according to the manufacturer’s instructions [51], by reading the absorbance of the sample at 450 nm with a spectrometer (Infinite 200 Pro MPlex, Tecan, Männedorf, Switzerland). The data were obtained by comparison with a standard curve (0.078 to 5 ng/mL), and the results were expressed as mean ± SD (%) versus the untreated control value (line 0%).
2.18. TNF-α ELISA Kit
The concentration of TNF-α was evaluated using the TNFα ELISA kit (Merck Life Science, Rome, Italy), following the experimental protocol [52] on HSerC supernatant of the gut–testis axis model. Colourimetric intensity was measured at 450 nm by a spectrophotometer (Infinite 200 Pro MPlex, Tecan, Männedorf, Switzerland). Data were calculated by generating a calibration curve (range 24.58 pg/mL to 6000 pg/mL) that relates the optical density of the sample to the concentration of the standards. Results were expressed as mean ± SD (%) versus control (line 0%) of five independent experiments performed in triplicate.
2.19. IL-6 ELISA Kit
The concentration of IL-6 in the supernatant of HSerC cells of the gut–testis axis model was analysed using the IL-6 ELISA kit (eBioscience, San Diego, CA, USA), following the manufacturer’s instructions [30]. The maximum wavelength of absorption at 450 nm was measured with a spectrometer (Infinite 200 Pro MPlex, Tecan, Männedorf, Switzerland), the concentration was calculated as pg/mL relative to the standard curve (0.078 to 5 pg/mL), and the results were expressed as mean ± SD (%) relative to the control (line 0%) of five independent experiments performed in triplicate.
2.20. Androgen Receptor (AR) ELISA Kit
To estimate the AR concentration in HSerC cell lysates of the gut–testis axis model, the Human AR ELISA Kit (MyBiosources, San Diego, CA, USA) was employed, according to the manufacturer’s instructions [53], this to investigate its key regulation of androgen-mediated cellular responses [54]. Lysates were obtained with cold PBS 1×. Briefly, 100 μL was incubated for 1 h at 37 °C, then 100 μL of Detection Reagent A was added and incubated for 1 h at 37 °C. After washing, 100 μL of Detection Reagent B was added and incubated for 30 min at 37 °C. Then, after washing, 90 μL of substrate solution was incubated for 10–20 min at 37 °C, and after adding 50 μL of stop solution, the optical density (OD) was measured at 450 nm with a spectrometer. The AR concentrations (ng/mL) were calculated from a standard curve (0.312 to 20 ng/mL), and the results were expressed as the mean ± SD (%) relative to the control (line 0%) of five independent experiments performed in triplicate.
2.21. P27 ELISA Kit
The p27 ELISA Kit was used to evaluate the presence of p27 in the sample analysed for HSerC cell lysates from the gut–testis axis model according to the manufacturer’s instructions (Bio-Techne SRL, Milan, Italy) [55]. The concentration was calculated by comparing the results with the standard curve (generated from the positive control) (from 62.50 to 4000 pg/mL according to different scalar dilutions) and reported as mean ± SD (%) versus control (line 0%) of five independent experiments performed in triplicate.
2.22. SGP2 ELISA Kit
SGP2 clusterin levels were studied in the supernatant of HSerC cells of the gut–testis axis model using an ELISA kit (Clusterin Human ELISA Kit, Thermoscientific, Waltham, MA, USA), according to the manufacturer’s instructions [56], by reading the absorbance of the sample at 450 nm with a spectrometer (Infinite 200 Pro MPlex, Tecan, Männedorf, Switzerland). The data were obtained by comparison with a standard curve (15 to 20,000 pg/mL), and the results were expressed as the mean ± SD (%) relative to the control value (line 0%) of five independent experiments performed in triplicate.
2.23. Testosterone ELISA Kit
The Testosterone ELISA Kit was used to analyse the amount of testosterone in HSerC cell supernatants of the gut–testis axis model, following the manufacturer’s instructions (Abcam, Cambridge, UK) [57]. The concentration was calculated by comparing the results with the standard curve (generated from the positive control) (from 0.2 to 16 ng/mL across different scalar dilutions) and reported as mean ± SD (%) versus the control (line 0%) of five independent experiments performed in triplicate.
2.24. FSHR ELISA Kit
The concentration of Follicle Stimulating Hormone Receptor (FSHR) was evaluated using a Human FSHR ELISA kit (Cloud-Clone Corp., Houston, TX, USA) and was measured at 450 nm using a microplate reader. Data were calculated by generating a calibration curve (range 0.312 ng/mL to 20 ng/mL) relating the optical density of the samples to the concentration of the standards. Results were expressed as mean ± SD (%) versus control (line 0%) of five independent experiments performed in triplicate.
2.25. Western Blot
HSerC cells were lysed on ice using Complete Tablet Buffer (Roche, Basel, Switzerland) supplemented with 1 mM PMSF, 2 mM sodium orthovanadate (Na3VO4), a 1:50 dilution of phosphatase inhibitor cocktail, and a 1:200 dilution of protease inhibitor cocktail. Protein extracts (35 µg) were separated by 10% sodium dodecyl sulfate–polyacrylamide gel electrophoresis (SDS-PAGE) and transferred onto polyvinylidene fluoride (PVDF) membranes (GE Healthcare Europe GmbH, Milan, Italy). Membranes were incubated overnight at 4 °C with anti-FSHR primary antibody (sc-13935, Santa Cruz Biotechnology, Santa Cruz, CA, USA) diluted 1:500. Protein loading was confirmed using an anti-β-actin antibody (1:4000; Merck Life Science, Rome, Italy). Results are expressed as mean ± SD (%) relative to untreated controls.
2.26. Statistical Analysis
Data were provided as mean ± SD (%) for at least 5 biological replicates per experimental technique, with each replicate repeated 3 times. Only for Western blot analyses, data are presented as mean ± SD from at least three experiments. By dividing each value by the control mean and averaging across three replicates per sample, the data were normalised to the control. To facilitate interpretation of differences between treatment groups, the results were presented as percentage-normalised values, with the control set to 0%. The mean optical density (OD) of each treated sample (three replicates) was divided by the mean OD of the untreated control, which served as the standard and was prepared from cells in culture media. The resulting ratios were multiplied by 100 and then subtracted from 1 (the normalised control value) using the previously mentioned procedure to determine the percentage departure from the control.
To ease standardisation and analyse treatment effects on viability and metabolic activity across datasets, we set the untreated control to 0%. GraphPad Prism 10.2.3 (GraphPad Software, Inc., San Diego, CA, USA) employed the Mann–Whitney U test or one-way ANOVA with Bonferroni’s post hoc to compare groups. TEER and viability data were analysed independently using a one-way ANOVA and Tukey’s post hoc test. A p < 0.05 was deemed statistically significant.
3. Results
3.1. Safety Assessment of Various Concentrations of Carob, B. longum GA24, and Ribomix on Caco-2 Cells
To select the optimal concentration associated with good health and cell viability, detailed assessments of the test substances’ tolerability in the intestinal in vitro model were conducted early in the study. Carob extract significantly improved cell viability compared to the control, as shown in Figure 1 (p < 0.05), with a peak at 4 h of over 60%; the most favourable results were seen following stimulation with the highest specified concentration, 50 μg/mL, in comparison to the other concentrations (p < 0.05). As for the ribonucleotide mixture, Ribomix increased cell viability at all tested dosages, with a more pronounced effect at 1% (p < 0.05), peaking at 4 h at around 30%. Finally, B. longum GA24 10 mg increased cell viability compared to the other concentrations tested (p < 0.05). These data provided crucial and baseline information for subsequent examinations, in which a new formulation was hypothesised, based on the combination of these substances: Carob 50 µg/mL + Ribomix 1% + B. longum 10 mg (referred to as MIX).
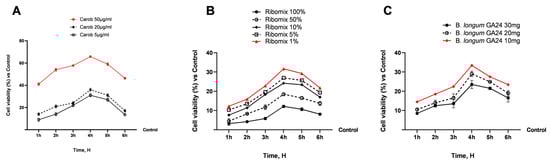
Figure 1.
Dose–response study on Caco-2 cells. In (A–C) analysis of cell viability of single agents at different concentrations and dosages. Results are expressed as mean ± SD (%) of 5 normalised biological replicates performed in triplicate vs. untreated control (0% line). All samples p < 0.05 vs. control. B. longum GA24 10 mg: ~1 × 10⁹ CFU/mL; 20 mg: ~2 × 10⁹ CFU/mL; 30 mg: ~3 × 10⁹ CFU/mL per insert.
3.2. Evaluation of Integrity Condition and Absorption Kinetics in an In Vitro Intestinal Barrier Model
Fundamental evaluations of the real safety of the hypothetical MIX were conducted at the level of the Transwell® in vitro intestinal barrier model. The effects of separate agents against MIX on cell viability and ROS generation during the 1–6 h period were compared. In Figure 2A, viability increased gradually with MIX treatment, peaking at 4 h and then declining somewhat after 6 h, although it remained consistently higher than responses seen with individual agents (p < 0.05). The variation in superoxide anion (O2•−) release is shown in Figure 2B. All treatments induced time-dependent changes in O2•− levels. While individual components generally showed a gradual increase in O2•− release over time relative to the untreated control, MIX displayed a distinct profile, with superoxide levels decreasing below baseline at 5–6 h. These differences were statistically significant (p < 0.05) at the indicated time points compared to all single treatments. Integrative analyses of Nrf2 and SOD modulation were conducted and are reported in Appendix A (Figure A1). The MIX treatment decreased Nrf2 production at 6 h (−12.1%), showing a 2.4–2.7-fold greater reduction than Carob 50 µg/mL and B. longum GA24 10 mg (~1 × 10⁹ CFU/mL), and an 8-fold greater decrease than Ribomix 1%. Similarly, MIX reduced SOD production (−5.4%) with a 2.7–4.3-fold stronger effect than Carob 50 µg/mL and B. longum GA24 10 mg (~1 × 10⁹ CFU/mL), and nearly 4-fold more than Ribomix 1%.
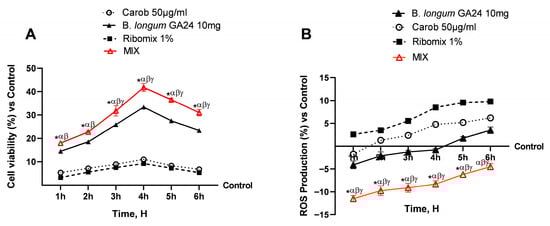
Figure 2.
Effects of individual agents and their combination (MIX) on cell viability and ROS production in a Transwell® intestinal barrier model. In (A), data obtained on cell viability after the MTT assay. In (B), data on ROS production by the colourimetric method with Cyto-C. Results are expressed as mean ± SD (%) of 5 biological replicates performed in triplicate vs. untreated control (0% line). * p < 0.05 vs. control; α p < 0.05 vs. Carob 50 µg/mL; β p < 0.05 vs. Ribomix 1%; γ p < 0.05 vs. B. longum GA24 10 mg (~1 × 10⁹ CFU/mL) per insert.
The samples were then subjected to additional thorough studies to ensure that the integrity and permeability functionality were maintained during the 1–6 h period. The samples, individually and in combination, were examined using a 3D in vitro intestinal barrier model. Throughout the investigation, MIX was shown to exert greater effects on individual component integrity (p < 0.05), with a peak in TEER occurring 4 h after stimulation, as assessed using certain ELISA kits (Figure 3B–D). Compared with single agents, MIX increased all TJ levels (p < 0.05). In detail, MIX increased claudin levels (577 pg/mL) by 28% (451 pg/mL) in relation to the control, 17% (494 pg/mL) over Carob 50 μg/mL, 6% (546 pg/mL) when compared to B. longum GA24 10 mg (~1 × 10⁹ CFU/mL), and 19.3% (484 pg/mL) when compared to Ribomix 1% (p < 0.05). Compared with the individual agents, MIX was shown to increase occludin levels (562 pg/mL; p < 0.05). Occludin levels were specifically elevated by 28% (439 pg/mL) over control, 12% (489 pg/mL) over Carob 50 μg/mL, 21% (531 pg/mL) over B. longum GA24 10 mg, and 9.5% (479 pg/mL) over Ribomix 1%. Zo-1 levels were improved by MIX (510 pg/mL) when compared to single drugs (p < 0.05). It raised Zo-1 levels by 16% (438 pg/mL) over control, 11% (460 pg/mL) over Carob 50 μg/mL, 5% (486 pg/mL) over B. longum GA24 10 mg (~1 × 10⁹ CFU/mL), and 16% (456 pg/mL) over Ribomix 1%. Additional analyses were performed to evaluate the adhesive properties of the probiotic under investigation. Specifically, the hydrophobicity assay described in Appendix A (Figure A2) confirmed that B. longum GA24 10 mg exhibits a high degree of cell surface hydrophobicity. The MIX formulation further increased the hydrophobicity of B. longum GA24 10 mg (~1 × 10⁹ CFU/mL) compared with the probiotic alone (34% increase, p < 0.05).
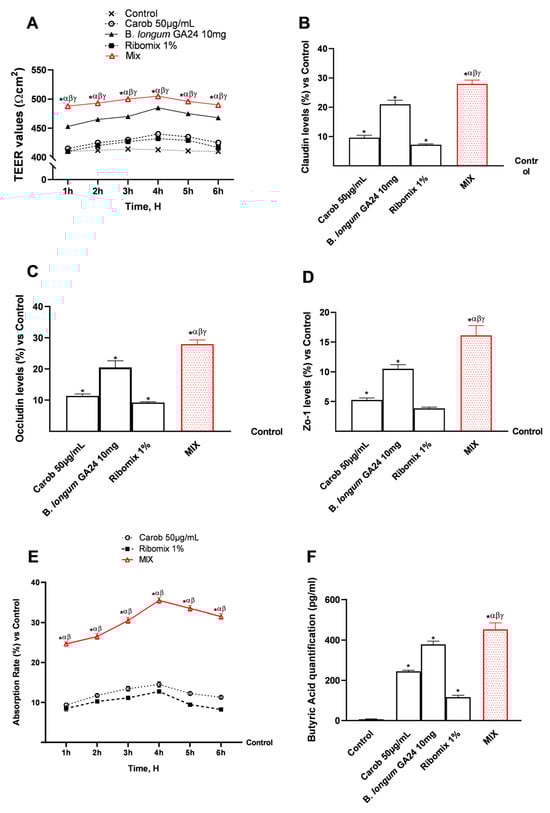
Figure 3.
Analysis of the effects of samples on intestinal barrier function in an in vitro model of intestinal barrier. In (A), TEER analysis was performed using EVOM3™; in (B–D), TJ quantification was assessed by an ELISA Kit; in (E), absorption rate was examined by a fluorescent probe; in (F), butyric acid quantification was assessed by an ELISA Kit. Results are expressed as mean ± SD (%). Results are expressed as mean ± SD (%) of 5 biological replicates performed in triplicate vs. untreated control (0% line only in (B–E)). * p < 0.05 vs. control; α p < 0.05 vs. Carob 50 µg/mL; β p < 0.05 vs. B. longum GA24 10 mg (~1 × 10⁹ CFU/mL per insert); γ p < 0.05 vs. Ribomix 1%.
Using a fluorescent probe, absorption of the substances was measured over time along the intestinal epithelial barrier model (Figure 3E). Both individual agents and the MIX formulation showed comparable absorption rates, with a peak at approximately 4 h. The absorption rate of MIX in the presence of B. longum GA24 10 mg (~1 × 10⁹ CFU/mL) was higher than that of the individual agents (p < 0.05), reaching 35.50% after 4 h, representing a 59% increase compared to Carob 50 μg/mL and a 64% increase compared to Ribomix 1%. Finally, butyrate levels were quantified at the end of the 6 h stimulation phase, capturing cumulative production by both epithelial cells and viable bacteria, as well as the combination (Figure 3F). MIX increased butyrate levels compared with the individual agents and B. longum GA24 (p < 0.05).
3.3. Analysis of the Biological Effects of Formulation on a Gut-Testicle Axis
The biological effects of the treatments on HSerC cells were evaluated using a 3D in vitro gut–testis axis model in a Transwell®. HSerC cells were pretreated with 300 μM H2O2 for 24 h to induce oxidative stress and then exposed in a co-culture model to 50 μg/mL Carob, 1% Ribomix, 10 mg B. longum GA24 (~1 × 10⁹ CFU/mL), or the MIX formulation. Pretreatment with 300 μM H2O2 disrupted the ROS/NO ratio and decreased cell viability and ATP generation, with significant results when compared to the untreated control (p < 0.05). Figure 4A shows the effects of the treatments on HSerC viability after 24 h, indicating a beneficial impact of the samples and maintenance of cellular homeostasis. The most pronounced effect was observed with MIX (p < 0.05), which increased cell viability by 1.5-fold compared to H2O2 300 μM, by 85% compared to Carob 50 μg/mL, by 50% compared to B. longum GA24 10 mg (~1 × 10⁹ CFU/mL), and by 76% compared to Ribomix 1%. These results are consistent with those shown in Figure 4B, in which all samples reduced ROS production over 24 h relative to the control. B. longum GA24 10 mg (~1 × 10⁹ CFU/mL) induced a statistically significant reduction (p < 0.05) of 8.5% in ROS levels. MIX achieved a 2.4-fold increase compared to 300 μM H2O2, a 92% greater reduction than Carob 50 μg/mL, a 59% decrease compared to B. longum GA24 10 mg (~1 × 10⁹ CFU/mL), and an 81% decrease compared to Ribomix 1%, suggesting a combined effect of MIX.
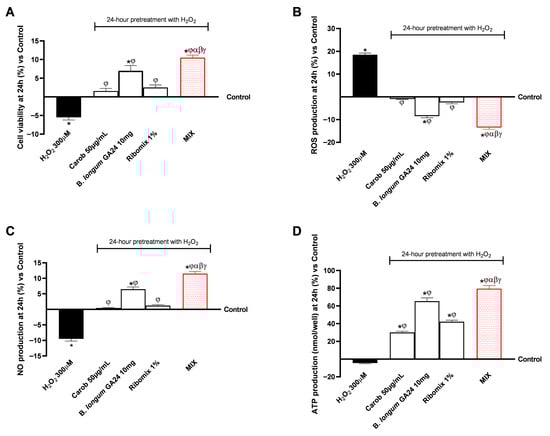
Figure 4.
Biological effects at 24 h of samples on HSerC after intestinal metabolism in an in vitro gut–testis axis model, assessing cell viability, ROS, NO, and ATP production. In (A), cell viability through MTT assay. In (B), production of ROS by the colourimetric method with Cyto-C. In (C), the production of NO is measured using the Griess assay. In (D), ATP production by luminescence assay. Results are expressed as mean ± SD (%) of 5 biological replicates performed in triplicate vs. control (0% line). * p < 0.05 vs. control; φ p < 0.05 vs. H2O2 300 μM; α p < 0.05 vs. Carob 50 µg/mL; β p < 0.05 vs. B. longum GA24 10 mg (~1 × 10⁹ CFU/mL per insert); γ p < 0.05 vs. Ribomix 1%.
Figure 4C shows the effects of individual agents and MIX on NO production. A statistically significant increase compared to the control (p < 0.05) was observed with B. longum GA24 10 mg (~1 × 10⁹ CFU/mL) among the single agents. The MIX treatment induced the highest increase, by 1.8-fold compared to H2O2 300 μM, corresponding to a 95% enhancement compared to Carob 50 μg/mL, a 77% increase compared to B. longum GA24 10 mg (~1 × 10⁹ CFU/mL), and an 8-fold increase compared to Ribomix 1%. In addition, ATP production was assessed to evaluate mitochondrial metabolic activity. As shown in Figure 4D, 24 h treatment with all samples, even as single agents, significantly enhanced ATP levels compared to the control (p < 0.05). The MIX treatment elicited the greatest effect, increasing ATP production (183 nmol/g protein), amplifying the effects of individual components by 38% (133 nmol/g protein) compared to Carob 50 μg/mL, by 8% (169 nmol/g protein) compared to B. longum GA24 10 mg (~1 × 10⁹ CFU/mL), by 26% (145 nmol/g protein) compared to Ribomix 1% and by 88% (97 nmol/g protein) compared to H2O2 300 μM.
In a subsequent phase, the study evaluated biological parameters related to HSerC cell health following 24 h treatment with the individual test samples and their combination. Specifically, Figure 4 presents the effects on key markers associated with the initiation of apoptosis, including BAX, Caspase-3, and Cyto-C, and those related to the inflammatory pathway, such as TNFα and IL-6. In Figure 5A, all individual agents maintained BAX levels comparable to the control (Carob 50 μg/mL and Ribomix 1%) or significantly lower in the case of B. longum GA24 10 mg (~1 × 10⁹ CFU; p < 0.05). The MIX treatment reduced BAX levels to 39 pg/mL, approximately 8% lower than in the control (43 pg/mL, p < 0.05). Compared with the individual components, MIX further lowered BAX relative to Carob (44 pg/mL, 10% decrease), B. longum 10 mg (~1 × 10⁹ CFU/mL; 40 pg/mL, 2.3% decrease), and Ribomix 1% (42.5 pg/mL, 7%), while showing a 20% reduction compared to H2O2 300 μM (48 pg/mL). At the same time, analysis of Caspase-3 levels showed similar trends, as illustrated in Figure 5B. Treatment with B. longum 10 mg (~1 × 10⁹ CFU) produced the strongest inhibitory effect compared to the other samples and control (p < 0.05). The MIX reached statistical significance for Carob 50 μg/mL and Ribomix 1% (p < 0.05). Specifically, H2O2 300 μM increased Caspase-3 levels by 13% relative to control (1.13 vs. 1.00 ng/mL). Carob 50 μg/mL, B. longum GA24 10 mg (~1 × 10⁹ CFU/mL), and Ribomix (1%) slightly reduced Caspase-3 levels to 0.98, 0.93, and 0.98 ng/mL, respectively. Furthermore, analysis of Cyto-C levels, shown in Figure 5C, revealed a 6.5% reduction compared to control with B. longum GA24 10 mg (~1 × 10⁹ CFU/mL) treatment (p < 0.05). The MIX reached statistical significance for Carob 50 μg/mL and Ribomix 1% (p < 0.05). Specifically, the MIX treatment reduced Cyto-C levels to 3.88 ng/mL, corresponding to approximately 23% lower than H2O2 300 μM (4.98 ng/mL). It further enhanced the inhibitory effects of the individual components, reducing levels to 12% vs. Carob (4.4 ng/mL), by 3% (3.96 ng/mL) vs. B. longum 10 mg (~1 × 10⁹ CFU/mL), and nearly 11% (4.34 ng/mL) vs. Ribomix.
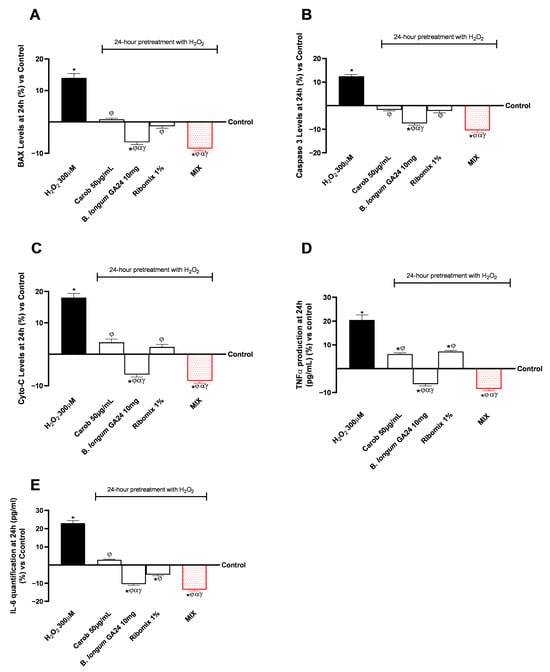
Figure 5.
Analysis of the biological effects of samples on HSerC after 24 h treatment, focusing on apoptotic and inflammatory pathways on a gut-testicle axis. In (A) BAX levels, in (B) Caspase 3 levels, in (C) and Cyto-C levels, in (D) TNFα, and in (E) IL-6 results by ELISA kit. Results are expressed as mean ± SD (%) of 5 biological replicates performed in triplicate vs. control (0% line). * p < 0.05 vs. control; φ p < 0.05 vs. H2O2 300 μM; α p < 0.05 vs. Carob 50 µg/mL; β p < 0.05 vs. B. longum GA24 10 mg (~1 × 10⁹ CFU/mL per insert); γ p < 0.05 vs. Ribomix 1%.
Regarding the inflammatory profile, both TNFα (Figure 5D) and IL-6 (Figure 5E) analyses showed that B. longum GA24 (10 mg) promoted a greater reduction in production levels of both pro-inflammatory cytokines than Carob 50 μg/mL and Ribomix 1% (p < 0.05). In addition, MIX produced the best effects in both analyses compared to individual agents (p < 0.05). Specifically, for TNFα, H2O2 300 μM induced a strong pro-inflammatory response (117 pg/mL) relative to control (98 pg/mL). The MIX treatment reduced TNFα levels to 89.6 pg/mL, corresponding to approximately a 23.4% reduction relative to H2O2. MIX further enhanced the inhibitory effects of the individual components, reducing levels by 14% (104 pg/mL) compared to Carob 50 μg/mL, by 3% (91 pg/mL) compared to B. longum 10 mg (~1 × 10⁹ CFU/mL), and 15% (105 pg/mL) compared to Ribomix 1%. For IL-6, MIX reduced its production to 2.59 pg/mL, corresponding to a 30% reduction compared to H2O2 300 μM (3.68 pg/mL). It further enhanced the inhibitory effects of the individual components, reducing levels by 16% (3.1 pg/mL) compared to Carob 50 μg/mL, by 4% (2.66 pg/mL) compared to B. longum GA24 10 mg (~1 × 10⁹ CFU/mL), and by 8.5% (2.83 pg/mL) compared to Ribomix 1%.
3.4. Analysis of the Combination on Sertoli Cell Maturation and Gametogenic Hormone Production in a Gut–Testis Axis Model
The effects of individual substances and MIX on key molecular mechanisms involved in Sertoli cell maturation were also evaluated. In particular, the activity levels of AR, cell cycle inhibitor protein p27, and SGP-2, essential markers for regulating spermatogenesis and Sertoli cell function in vitro, were analysed (Figure 6). In all analyses, all samples examined demonstrated an active role in counteracting the negative effects of H2O2 (300 μM) in the in vitro testicular model, with enhanced results for MIX (p < 0.05).
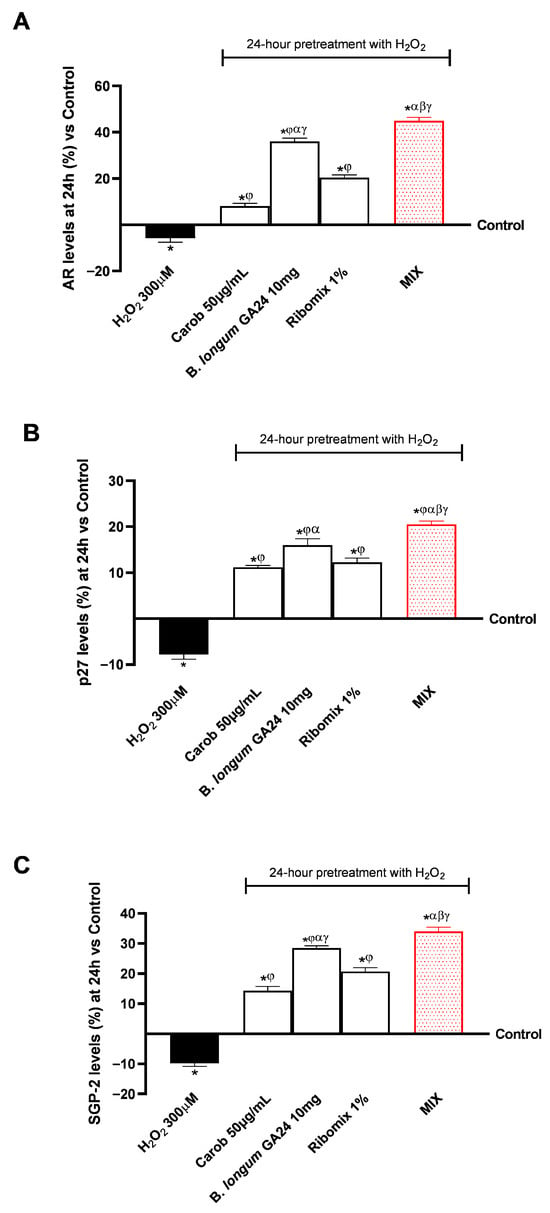
Figure 6.
Effects of individual substances and the MIX combination on Sertoli cell maturation and function in the gut-testicle axis model. In (A) AR levels, in (B) p27 levels, and in (C) and SGP-2 levels were all determined using an ELISA kit. Results are expressed as mean ± SD (%) of 5 biological replicates performed in triplicate vs. control (0% line). * p < 0.05 vs. control; φ p < 0.05 vs. H2O2 300 μM; α p < 0.05 vs. Carob 50 µg/mL; β p < 0.05 vs. B. longum GA24 10 mg (~1 × 10⁹ CFU/mL per insert); γ p < 0.05 vs. Ribomix 1%.
In the context of AR (Figure 6A), all treatments significantly increased their levels after 24 h compared to the control, with the B. longum GA24 10 mg treatment showing the most effective results (p < 0.05). Compared with individual agents, MIX produced the largest increase (p < 0.05). MIX raised AR levels to 9.0 ng/mL after 24 h, a 5-fold increase compared to H2O2 at 300 μM (1.25 ng/mL). It further enhanced the effects of the individual components, increasing AR by 82% (4.95 ng/mL) compared to Carob 50 μg/mL, by 20% (7.50 ng/mL) compared to B. longum GA24 10 mg (~1 × 10⁹ CFU/mL), and by 54% (5.84 ng/mL) compared to Ribomix 1%. In the gut–testicle axis model, p27 and SGP-2 protein levels (Figure 6B,C) also significantly increased after all treatments. After a 24 h treatment period, MIX increased p27 levels to 1278 pg/mL, corresponding to an 89% rise compared to H2O2 300 μM (675 pg/mL) and 21% relative to the control (1056 pg/mL). It further enhanced the effects of the individual components, raising p27 by 9% (1172 pg/mL) compared to Carob 50 μg/mL, by 5% (1222 pg/mL) compared to B. longum GA24 10 mg (~1 × 10⁹ CFU/mL), and by 8% (1186 pg/mL) compared to Ribomix 1%. Lastly, all treated groups showed a substantial increase in SGP-2 glycoprotein levels. At the same time, MIX showed an increase in SGP-2 levels to 1635 pg/mL, a 1.50-fold increase compared to H2O2 at 300 μM (654 pg/mL). It further enhanced the effects of the individual components, increasing levels by 57% (703 pg/mL) compared to Carob 50 μg/mL, by 18% (1341 pg/mL) compared to B. longum GA24 10 mg (~1 × 10⁹ CFU/mL), and by 38% (1014 pg/mL) compared to Ribomix 1%.
The effects of individual drugs and MIX on the synthesis of key hormones involved in gamete maturation, such as testosterone and FSHR (Figure 7). In all analyses, all samples examined demonstrated an active role in counteracting the negative effects of H2O2 (300 μM) in the in vitro testicular model, with enhanced results for MIX (p < 0.05). MIX improved testosterone levels to 5.22 ng/mL, a 5.52-fold increase compared to H2O2 at 300 μM (0.8 ng/mL). It further enhanced the effects of the individual components, increasing levels by 86% (2.81 ng/mL) compared to Carob 50 μg/mL, by 17% (4.46 ng/mL) compared to B. longum GA24 10 mg (~1 × 10⁹ CFU/mL), and by 43% (3.65 ng/mL) compared to Ribomix 1%.
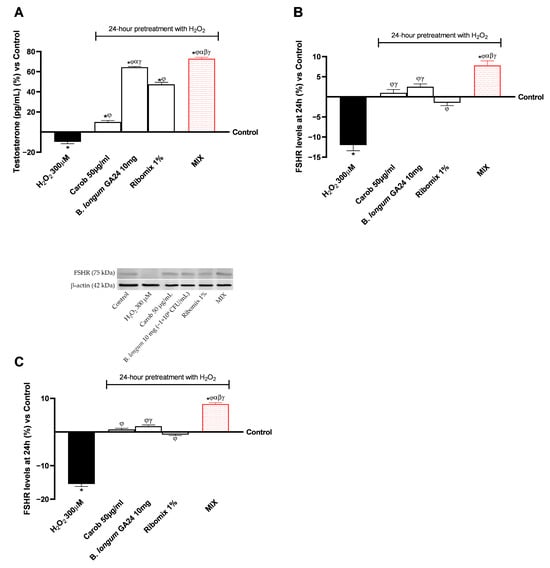
Figure 7.
Effects of individual treatments and MIX on gametogenic hormone production in Sertoli cells on the gut-testicle axis model after 24 h. In (A), Testosterone levels, in (B) FSHR levels, using an ELISA kit, and in (C) example images of FSHR expression with densitometric analysis after Western blot are shown. Results are expressed as mean ± SD (%) of 5 biological replicates performed in triplicate vs. control (0% line).* p < 0.05 vs. control; φ p < 0.05 vs. H2O2 300 μM; α p < 0.05 vs. Carob 50 µg/mL; β p < 0.05 vs. B. longum GA24 10 mg (~1 × 10⁹ CFU/mL per insert); γ p < 0.05 vs. Ribomix 1%.
Furthermore, as depicted in Figure 7C, MIX significantly modulated FSHR levels and expression, with effects greater than those of individual agents (p < 0.05). MIX increased FSHR levels to 10.42 pg/mL, corresponding to a 2.06-fold increase compared with H2O2 300 µM (3.4 pg/mL). Moreover, MIX enhanced the effects of the individual treatments, increasing FSHR levels by approximately 63% (3.85 pg/mL) relative to Carob 50 µg/mL, by 62.5% (3.9 pg/mL) compared with B. longum GA24 10 mg (~1 × 10⁹ CFU/mL), and by about compared to 1.8-fold Ribomix 1% (3.75 pg/mL). Comparable data were also obtained by densitometric analysis, in which MIX promoted a mean 88% increase in FSHR expression compared with the single agents (p < 0.05).
4. Discussion
Maintaining a healthy gut–testis axis is increasingly recognised as a key factor in supporting male reproductive function [4,5,6,9]. Our preliminary results suggest that the gut–testis axis is a crucial determinant of male reproductive function, in which intestinal homeostasis, oxidative stress, and hormonal signalling are interconnected. Gut-level perturbations can impair testicular redox balance, promote apoptosis, and reduce Sertoli cell function, whereas restoration of intestinal integrity can exert protective effects along this axis.
Considering these findings, using probiotics and nutraceuticals to promote male reproductive function appears to be a novel and promising approach to preserve the gut–testis axis [4,58]. Nutritional and microbial factors not only influence oxidative balance and hormone-mediated pathways but also help maintain intestinal barrier function and integrity, as demonstrated in Caco-2 cell models [59,60,61]. In vitro, the MIX formulation maintained intestinal barrier viability and integrity more effectively than individual components, as reflected by enhanced TEER values (495.3 ± 6.4 Ω·cm2) during a 1–6 h period above the 400 Ω·cm2 cut-off, and increased TJ protein levels (claudin, occludin, Zo-1), suggesting improved epithelial cohesion and paracellular regulation [62,63]. Such models have shown that bioactive compounds can enhance TJ proteins and functional barrier strength by activating redox-regulated pathways, such as Nrf2, which is critically involved in controlling epithelial oxidative stress and preserving mucosal integrity by upregulating antioxidant responses [63,64,65]. The regulation of superoxide anion and intracellular ROS levels in the intestine has also been linked to modulation of key antioxidant defences, including SOD1, through Nrf2-dependent signalling [66]. By preserving epithelial cohesion, controlling ROS release, and enhancing intrinsic antioxidant mechanisms, this combination may reinforce gut homeostasis, thereby supporting downstream cellular and hormonal signalling along the gut–testis axis and contributing to the maintenance of testicular function under oxidative challenge.
Beyond structural integrity, MIX promoted microbial metabolic activity, evidenced by increased butyrate synthesis and enhanced adhesion of B. longum GA24 to the epithelium [67,68,69]. These effects may help maintain intestinal health, modulate local oxidative responses, and indirectly support testicular homeostasis [22,70]. Butyrate in the basolateral compartment may derive from bacterial metabolism and from Caco-2 uptake and processing via monocarboxylate transporters (MCT1/MCT4) [71]. Natural substances rich in fibre and polyphenols, such as Carob, can promote the production of beneficial microbial metabolites, including short-chain fatty acids (SCFAs), which support intestinal barrier integrity and help modulate systemic inflammatory responses. These effects may, in turn, lower oxidative and inflammatory stress at the testicular level, creating a more favourable environment for spermatogenesis [58,65,69]. In addition, enhanced adhesion of B. longum may further stabilise microbial localisation at the epithelial surface, increasing local metabolite concentrations and supporting epithelial cell homeostasis. At the same time, exogenous ribonucleotides in the formulation likely provided substrates to support cellular proliferation, while Carob polyphenols may have reinforced intestinal barrier function and antioxidant capacity [58,65,72,73].
Following intestinal condition optimisation, the focus switched to assessing the biological effects on human Sertoli cells (HSerC) in the gut–testis axis in vitro. According to recognised models of oxidative damage in testicular cells, exposure to H2O2 300 μM for 24 h successfully caused oxidative stress, as demonstrated by increased ROS generation, reduced cell viability, impaired ATP synthesis, and an imbalanced ROS/NO ratios [37,74]. Treatment with Carob, B. longum GA24, Ribomix, and particularly MIX mitigated these deleterious effects, highlighting their protective role on testicular redox homeostasis. Compound probiotics have been shown to protect against oxidative damage by activating the NRF2 antioxidant system and reducing ROS generation in Sertoli cells under toxic insults in vitro [75]. Similarly, flavonoids such as quercetin and kaempferol, contained in Carob as reported in the literature [76,77], protect Sertoli cells not only directly, but also indirectly through supporting intestinal barrier integrity, limiting ROS release, and enhancing SOD1 and Nrf2-dependent antioxidant signalling in Caco-2 models. This dual gut–testis action may enhance Sertoli cell resilience to oxidative stress [66,78]. Carob extract preparations were also validated in in vivo models of reproduction, where they demonstrated antioxidant activity and improved testicular parameters, including reductions in oxidative stress markers and protection of spermatozoa and testicular function from experimentally induced toxicities [18,79]. In terms of mitochondrial activity, as measured by ATP production, all treatments increased comparably, with MIX producing the most gain, suggesting a combined effect of the probiotic, ribonucleotides, and Carob-derived polyphenols on mitochondrial quality and energy metabolism. This lends credence to the idea that probiotic and nutraceutical treatments used together may improve Sertoli cells’ energy metabolism, which is essential for sustaining spermatogenic support under oxidative stress situations [80,81]. These results align with research that links dietary components and gut microbiome metabolites to mitochondrial quality control in testicular cells [22,82]. Furthermore, as an increase in nucleotide availability can enhance mitochondrial quality and efficiency, the inclusion of ribonucleotides in MIX may act both at the gut and testicular levels, supporting mitochondrial stability, respiratory chain complex integrity, and mitochondrial genome transcription. Defects in oxidative phosphorylation and energy generation are observed when this supply is impaired [83,84].
According to the description above, the assessment of proinflammatory cytokines (TNFα, IL-6) and apoptotic markers (BAX, Caspase-3, Cytochrome-C) showed that MIX also considerably reduced pro-inflammatory and pro-apoptotic signalling when compared to individual agents, suggesting a combined effect that integrates both direct protection of Sertoli cells and indirect modulation via the intestinal environment. By potentially supporting gut barrier integrity, modulating ROS production, and influencing Nrf2- and SOD1-mediated antioxidant responses in intestinal epithelial models (Caco-2), the combination of Carob, B. longum, and ribonucleotides may help attenuate oxidative and inflammatory signals that could impact the testicular microenvironment [4]. These results reinforce research showing that probiotic supplements, bioactive polyphenols, and nucleotides can reduce oxidative stress-induced apoptosis in testicular cells, promoting cell survival and functional integrity. Indeed, in vitro comparative studies of probiotic strains have indicated that bifidobacterial species tend to promote an anti-inflammatory cytokine profile compared with other strains, highlighting their potential to influence cytokine release in immune cells [85]. At the same time, phenolic-rich plant extracts, including Carob, exert complementary effects by modulating NF-κB signalling and decreasing the activity of intrinsic apoptotic regulators such as Caspase-3 and Cytochrome-C, thereby reinforcing Sertoli cell resilience under oxidative challenge [86,87].
The study also assessed markers directly associated with Sertoli cell maturation and spermatogenic support, including AR, p27, and SGP-2. All treatments positively modulated these markers, with the MIX formulation producing the most pronounced effects, indicating a coordinated enhancement of Sertoli cell functional maturation. Notably, B. longum GA24 alone markedly increased AR expression, in agreement with previous evidence suggesting a role for this probiotic in modulating redox balance and supporting spermatogenesis through gut–testis axis interactions [82]. The upregulation of p27, a cyclin-dependent kinase inhibitor essential for cell-cycle exit, is particularly relevant, as increased p27 expression is a hallmark of Sertoli cell differentiation and maturation, reflecting the transition from a proliferative to a supportive phenotype required for efficient spermatogenesis. Accordingly, the observed increase in p27 suggests that the treatments, especially MIX, promote stabilisation of the mature Sertoli cell state. Similarly, SGP-2 (clusterin) plays a crucial role in Sertoli–germ cell interactions, contributing to cell adhesion, cytoprotection, and the maintenance of the integrity of the seminiferous epithelium [12,88,89,90]. Its upregulation in response to treatment is consistent with enhanced Sertoli cell support functions and increased resistance to oxidative or inflammatory stress [91]. The nucleotide mixture (Ribomix) may have contributed by supporting nucleic acid synthesis and mitochondrial activity, while carob-derived polyphenols likely mitigated oxidative stress and reinforced cytoskeletal organisation and cell–cell interactions, thereby sustaining p27- and SGP-2-associated maturation pathways, as reported in the literature [80,92].
Our results demonstrate that MIX significantly restored FSHR levels and expression in H2O2-challenged Sertoli cells, outperforming individual components, including Carob, B. longum GA24, and Ribomix. Importantly, this suggests a synergistic action of multiple bioactive compounds, likely combining antioxidant and microbiota-modulating effects, thereby attenuating oxidative stress and supporting receptor regulation.
These data align with emerging evidence that the gut–testis axis influences male reproductive physiology. Multiple reviews and experimental studies show that the intestinal microbiome can modulate oxidative status, inflammatory tone, and endocrine signalling, thereby impacting testicular function and spermatogenesis [5,60]. Probiotic supplementation—for example, strains of Lactobacillus and Bifidobacterium—have been shown to reduce ROS generation and improve sperm parameters by enhancing antioxidant defences and reducing systemic inflammation [93]. This supports the idea that microbiota modulation may help maintain a favourable redox and immune environment that permits optimal gonadotropic signalling.
Moreover, antioxidant and nutraceutical compounds (e.g., polyphenol-rich extracts such as carob) are known to directly scavenge reactive species and enhance cellular resilience under oxidative stress [94]. When combined with targeted probiotic interventions, such approaches may facilitate a more robust recovery of hormone receptor expression, such as FSHR, by mitigating oxidative damage and stabilising intracellular signalling pathways [95]. The enhanced upregulation of FSHR by MIX compared with single agents is consistent with a multi-target strategy acting through improvements in redox balance and microbiota-derived systemic signalling within the gut–testis axis [96]. These mechanistic links highlight the potential of combined antioxidant/probiotic treatments to counteract oxidative insults and support hormonal responsiveness in Sertoli cells.
Overall, these findings indicate that a combinatorial strategy integrating probiotics, nucleotides, and plant-derived polyphenols (Probiofert Uomo) can target multiple, interconnected mechanisms, including mitochondrial function, redox balance, inflammation, apoptosis, Sertoli cell maturation, and endocrine regulation, to support spermatogenic processes. This multi-level activity highlights the translational potential of nutraceutical–probiotic formulations as supportive approaches for male reproductive health. Notwithstanding these insights, some limitations should be considered. The study was conducted exclusively in vitro, and although the 3D Transwell® system provides a functional approximation of the gut–testis axis, it does not fully capture the complexity of in vivo endocrine, immune, and vascular interactions. Quantification of butyrate by ELISA is less sensitive and specific than HPLC/MS; however, the ELISA we used enabled a first reproducible assessment of metabolic trends. Additionally, AR, p27, and SGP-2 were quantified as indicators of Sertoli cell functional state and maturation rather than direct markers of spermatogenesis, given the absence of germ cells in our in vitro model. Experimental concentrations and exposure conditions may not directly reflect physiological settings. Finally, while the MIX formulation exhibited enhanced efficacy compared with individual components, the molecular basis of their interaction remains to be fully elucidated. Future investigations should therefore include in vivo validation, with assessment of spermatogenesis, sperm quality, and fertility outcomes, as well as deeper exploration of underlying mechanisms such as mitochondrial biogenesis, microbiota-mediated effects, and Sertoli–germ cell communication.
5. Conclusions
Using an in vitro gut–testis axis model, this preliminary study suggests that the combination of Carob, B. longum GA24, and Ribomix (Probiofert Uomo) supports the maintenance of intestinal barrier function under oxidative stress, a key prerequisite for gut–testis axis communication. Preservation of barrier integrity, together with controlled transepithelial transport, provides a stable experimental context for downstream effects on testicular cell responses. Within this in vitro framework, the MIX was associated with improved Sertoli cell viability and functional markers, alongside partial restoration of hormone-related pathways relevant to gametogenic support, including testosterone and FSHR signalling. These effects were accompanied by coordinated modulation of AR, p27, and SGP-2 expression, reduced oxidative and inflammatory stress, and improved mitochondrial function (see Figure A3 in Appendix A). While these findings support a potential synergistic action of probiotics, plant-derived polyphenols, and nucleotide supplementation at the cellular level, further in vivo studies are required to confirm physiological relevance and translational implications for male reproductive health.
Author Contributions
Conceptualization, S.M., R.G. and F.U.; methodology, R.G., F.P. and M.M.; software, S.M. and R.G.; validation, S.M., R.G. and F.U.; formal analysis, S.M.; investigation, S.M. and R.G.; resources, F.U.; data curation, S.M.; writing—original draft preparation, S.M., R.G., F.P., M.M. and F.U.; visualisation, F.U.; supervision, F.U.; project administration, F.U.; funding acquisition, F.U. All authors have read and agreed to the published version of the manuscript.
Funding
This research received no external funding.
Institutional Review Board Statement
Not applicable.
Informed Consent Statement
Not applicable.
Data Availability Statement
The data presented in this study are available on request from the corresponding author (The Laboratory of Physiology carefully stores raw data to ensure permanent retention under a secure system).
Acknowledgments
The authors thank Probionova SA and Nutra Futura Srl for the kind gesture of donating the probiotic and bioactive ingredients necessary to conduct the research.
Conflicts of Interest
Authors Francesca Parini and Rebecca Galla were employees of Noivita S.r.l.s. at the time the study was conducted. These authors had no role in the study design, data collection, analysis and interpretation of results, manuscript writing, or decision to submit it for publication. Noivita S.r.l.s. played no role in the design of the study, the collection, analysis or interpretation of data, the drafting of the manuscript or the decision to submit it for publication. The remaining authors declare that the research was conducted in the absence of any commercial or financial relationships that could be construed as a potential conflict of interest.
Abbreviations
The following abbreviations are used in this manuscript:
| ATP | Adenosine Triphosphate |
| AR | Androgen Receptor |
| BAX | Bcl-2-associated X protein |
| B. longum | Bifidumbacterium longum |
| CFU | Colony-Forming Units |
| Cyto-C | Cytochrome C |
| DMEM | Dulbecco’s Modified Eagle Medium |
| ELISA | Enzyme-Linked Immunosorbent Assay |
| EMA | European Medicines Agency |
| FBS | Foetal bovine serum |
| FDA | Food and Drug Administration |
| FSHR | Follicle-Stimulating Hormone Receptor |
| H2O2 | Hydrogen Peroxide |
| HSerC | Human Sertoli Cells |
| IL-1β | Interleukin 1β |
| IL-6 | Interleukin 6 |
| MCT | Monocarboxylate transporters |
| MTT | 3-(4,5-dimethylthiazol-2-yl)-2,5-diphenyltetrazolium bromide |
| NF-κB | Nuclear Factor kappa-light-chain-enhancer of activated B cells |
| NO | Nitric Oxide |
| PBS | Phosphate-Buffered Saline |
| PVDF | Polyvinylidene fluoride |
| ROS | Reactive Oxygen Species |
| SCFA | Short Chain Fatty Acids |
| SGP-2 | Sulfated Glycoprotein-2 (Clusterin) |
| SDS-PAGE | Sodium dodecyl sulfate–polyacrylamide gel electrophoresis |
| TEER | Transepithelial/Transendothelial Electrical Resistance |
| TJ | Tight Junction |
| TNFα | Tumour Necrosis Factor α |
| Zo-1 | Zonula Occludens-1 |
Appendix A

Figure A1.
Analysis of Nrf2 (A) and SOD (B) production at 6 h in response to treatments with Carob (50 µg/mL), B. longum GA24 10 mg, Ribomix (1%), and MIX. Data are expressed as mean ± SD (%) of five independent experiments performed in triplicate versus control (0% line). * p < 0.05 vs. control; α p < 0.05 vs. Carob 50 µg/mL; β p < 0.05 vs. B. longum GA24 10 mg (~1 × 10⁹ CFU/mL per insert); γ p < 0.05 vs. Ribomix 1%.


Figure A2.
Analysis of the hydrophobicity activity of probiotics using the surface hydrophobicity assay on an in vitro model of intestinal barrier after 6 h treatment. Test results are expressed as mean ± SD (%) of 5 independent experiments performed in triplicate vs. control (0% line). * p < 0.05 vs. control, α p < 0.05 vs. to B. longum GA24 10 mg (~1 × 10⁹ CFU/mL per insert).


Figure A3.
Schematic representation of the beneficial effects induced by the MIX.
Figure A3.
Schematic representation of the beneficial effects induced by the MIX.

References
- Ko, E.Y.; Sabanegh, E.S. The Role of Nutraceuticals in Male Fertility. Urol. Clin. N. Am. 2014, 41, 181–193. [Google Scholar] [CrossRef] [PubMed]
- Feyzi Dehkhargani, S.; Malekinejad, H.; Shahrooz, R.; Sarkhanloo, R.A. Detrimental Effect of Atrazine on Testicular Tissue and Sperm quality: Implication for Oxidative stress and Hormonal Alterations. Iran. J. Toxicol. 2011, 5, 426–435. [Google Scholar]
- Kuchakulla, M.; Soni, Y.; Patel, P.; Parekh, N.; Ramasamy, R. A Systematic Review and Evidence-based Analysis of Ingredients in Popular Male Fertility Supplements. Urology 2020, 136, 133–141. [Google Scholar] [CrossRef] [PubMed]
- Kaltsas, A.; Giannakodimos, I.; Markou, E.; Stavropoulos, M.; Deligiannis, D.; Kratiras, Z.; Chrisofos, M. The Androbactome and the Gut Microbiota-Testis Axis: A Narrative Review of Emerging Insights into Male Fertility. Int. J. Mol. Sci. 2025, 26, 6211. [Google Scholar] [CrossRef]
- Lv, S.; Huang, J.; Luo, Y.; Wen, Y.; Chen, B.; Qiu, H.; Chen, H.; Yue, T.; He, L.; Feng, B.; et al. Gut Microbiota Is Involved in Male Reproductive Function: A Review. Front. Microbiol. 2024, 15, 1371667. [Google Scholar] [CrossRef]
- Leelani, N.; Bajic, P.; Parekh, N.; Vij, S.C.; Lundy, S.D. The emerging role of the gut-testis axis in male reproductive health and infertility. F&S Rev. 2023, 4, 131–141. [Google Scholar] [CrossRef]
- Duru, N.K.; Morshedi, M.; Oehninger, S. Effects of hydrogen peroxide on DNA and plasma membrane integrity of human spermatozoa. Fertil. Steril. 2000, 74, 1200–1207. [Google Scholar] [CrossRef]
- Takeshima, T.; Usui, K.; Mori, K.; Asai, T.; Yasuda, K.; Kuroda, S.; Yumura, Y. Oxidative stress and male infertility. Reprod. Med. Biol. 2020, 20, 41–52. [Google Scholar] [CrossRef]
- Elhija, M.A.; Potashnik, H.; Lunenfeld, E.; Potashnik, G.; Schlatt, S.; Nieschlag, E.; Huleihel, M. Testicular interleukin-6 response to systemic inflammation. Eur. Cytokine Netw. 2005, 16, 167–172. [Google Scholar]
- Santacroce, L.; Imbimbo, C.; Ballini, A.; Crocetto, F.; Scacco, S.; Cantore, S.; Di Zazzo, E.; Colella, M.; Jirillo, E. Testicular Immunity and Its Connection with the Microbiota. Physiological and Clinical Implications in the Light of Personalized Medicine. J. Pers. Med. 2022, 12, 1335. [Google Scholar] [CrossRef]
- Matzkin, M.E.; Calandra, R.S.; Rossi, S.P.; Bartke, A.; Frungieri, M.B. Hallmarks of Testicular Aging: The Challenge of Anti-Inflammatory and Antioxidant Therapies Using Natural and/or Pharmacological Compounds to Improve the Physiopathological Status of the Aged Male Gonad. Cells 2021, 10, 3114. [Google Scholar] [CrossRef]
- O’Donnell, L.; Dagley, L.F.; Curley, M.; Darbey, A.; O’Shaughnessy, P.J.; Diemer, T.; Pilatz, A.; Fietz, D.; Stanton, P.G.; Smith, L.B.; et al. Sertoli Cell-Enriched Proteins in Mouse and Human Testicular Interstitial Fluid. PLoS ONE 2023, 18, e0290846. [Google Scholar] [CrossRef]
- Corpuz-Hilsabeck, M.; Culty, M. Impact of endocrine disrupting chemicals and pharmaceuticals on Sertoli cell development and functions. Front. Endocrinol. 2023, 14, 1095894. [Google Scholar] [CrossRef]
- Potiris, A.; Moustakli, E.; Trismpioti, E.; Drakaki, E.; Mavrogianni, D.; Matsas, A.; Zikopoulos, A.; Sfakianakis, A.; Tsakiridis, I.; Dagklis, T.; et al. From Inflammation to Infertility: How Oxidative Stress and Infections Disrupt Male Reproductive Health. Metabolites 2025, 15, 267. [Google Scholar] [CrossRef] [PubMed]
- Arato, I.; Grande, G.; Barrachina, F.; Bellucci, C.; Lilli, C.; Jodar, M.; Aglietti, M.C.; Mancini, F.; Vincenzoni, F.; Pontecorvi, A.; et al. “In Vitro” Effect of Different Follicle–Stimulating Hormone Preparations on Sertoli Cells: Toward a Personalized Treatment for Male Infertility. Front. Endocrinol. 2020, 11, 401. [Google Scholar] [CrossRef] [PubMed]
- Mahdian, E.; Khadem Haghighian, H.; Javadi, M.; Karami, A.A.; Kavianpour, M. Effect of Carob (Ceratonia siliqua L.) oral supplementation on changes of semen parameters, oxidative stress, inflammatory biomarkers and reproductive hormones in infertile men. Sci. J. Kurd. Univ. Med. Sci. 2018, 56, 66–75. [Google Scholar]
- Mokhtari, M.; Sharifi, E. The effects of hydro alcoholic extract of Ceratonia siliqua L. seeds on pituitary—Testis hormones and spermatogenesis in rat. Adv. Environ. Biol. 2012, 6, 2778–2784. [Google Scholar]
- Soleimanzadeh, A.; Kian, M.; Moradi, S.; Mahmoudi, S. Carob (Ceratonia siliqua L.) fruit hydro-alcoholic extract alleviates reproductive toxicity of lead in male mice: Evidence on sperm parameters, sex hormones, oxidative stress biomarkers and expression of Nrf2 and iNOS. Avicenna J. Phytomed. 2020, 10, 35–49. [Google Scholar]
- Kour, J.; Chopra, H.; Bukhari, S.; Sharma, R.; Bansal, R.; Hans, M.; Saxena, D.C. Nutraceutical—A deep and profound concept. In Nutraceuticals and Health Care; Elsevier: Amsterdam, The Netherlands, 2022; pp. 1–28. [Google Scholar]
- Thakur, N.; Rokana, N.; Panwar, H. Probiotics: Selection criteria, safety and role in health and disease. J. Innov. Biol. 2016, 3, 259–270. [Google Scholar]
- Caramia, G.; Silvi, S. Probiotics: From the Ancient Wisdom to the Actual Therapeutical and Nutraceutical Perspective. In Probiotic Bacteria and Enteric Infections: Cytoprotection by Probiotic Bacteria; Springer: Berlin/Heidelberg, Germany, 2011; pp. 3–37. [Google Scholar]
- Alfano, M.; Ferrarese, R.; Locatelli, I.; Ventimiglia, E.; Ippolito, S.; Gallina, P.; Cesana, D.; Canducci, F.; Pagliardini, L.; Viganò, P. Testicular microbiome in azoospermic men-first evidence of the impact of an altered microenvironment. Hum. Reprod. 2018, 33, 1212–1217. [Google Scholar] [CrossRef]
- Feng, T.; Liu, Y. Microorganisms in the reproductive system and probiotic’s regulatory effects on reproductive health. Comput. Struct. Biotechnol. J. 2022, 20, 1541–1553. [Google Scholar] [CrossRef]
- Zhang, Y.; Hou, B.; Liu, T.; Wu, Y.; Wang, Z. Probiotics improve polystyrene microplastics-induced male reproductive toxicity in mice by alleviating inflammatory response. Ecotoxicol. Environ. Saf. 2023, 263, 115248. [Google Scholar] [CrossRef] [PubMed]
- Uberti, F.; Ruga, S.; Morsanuto, V.; Galla, R.; Farghali, M.; Molinari, C. Role of Ribonucleotides in Improving Muscle Cell Function. J. Food Sci. Nutr. Res. 2020, 3, 4. [Google Scholar] [CrossRef]
- Verkerk, R. Nucleotides: Speculation on lifestyle-induced essentiality. NHD Clin. 2011, 64, 29–32. [Google Scholar]
- Kodinova, S.; Dushkova, M.; Miteva-Petrova, M.; Yanakieva, V.; Petrov, S.; Denkova, Z. Production of probiotic Bulgarian yoghurts obtained from an ultrafiltered cow’s milk. Ir. J. Agric. Food Res. 2020, 59, 1–11. [Google Scholar] [CrossRef]
- International Organization for Standardization (ISO) 4833-1:2013; Microbiology of the Food Chain—Horizontal Method for the Enumeration of Microorganisms—Part 1: Colony Count at 30 °C by the Pour Plate Technique. International Organization for Standardization: Geneva, Switzerland, 2013.
- Faramarzi, A.; Aghaz, F.; Bakhtiari, M.; Roshankhah, S.; Rashidi, Z.; Khazaei, M. Ceratonia siliqua (Carob) extract improved in vitro development of vitrified-warmed mouse germinal vesicle oocytes: Assessment of possible mechanism. Cell Tissue Bank. 2021, 22, 137–144. [Google Scholar] [CrossRef]
- Ferrari, S.; Galla, R.; Mulè, S.; Uberti, F. Analysis of the Beneficial Effects of Probiotics on the Gut–Prostate Axis Using Prostatic Co-Culture Model. Foods 2024, 13, 3647. [Google Scholar] [CrossRef]
- DiMarco, R.L.; Hunt, D.R.; Dewi, R.E.; Heilshorn, S.C. Improvement of paracellular transport in the Caco-2 drug screening model using protein-engineered substrates. Biomaterials 2017, 129, 152–162. [Google Scholar] [CrossRef]
- Uberti, F.; Morsanuto, V.; Ruga, S.; Galla, R.; Farghali, M.; Notte, F.; Bozzo, C.; Magnani, C.; Nardone, A.; Molinari, C. Study of Magnesium Formulations on Intestinal Cells to Influence Myometrium Cell Relaxation. Nutrients 2020, 12, 573. [Google Scholar] [CrossRef]
- Ceriotti, L.; Meloni, M. La valutazione dell’assorbimento intestinale in vitro. L’integratore Nutr. 2014, 17, 62–65. [Google Scholar]
- Rodríguez Gutiérrez, D.; Eid, W.; Biason-Lauber, A. A Human Gonadal Cell Model From Induced Pluripotent Stem Cells. Front. Genet. 2018, 9, 624. [Google Scholar] [CrossRef]
- Zhang, D.C.; Chen, R.; Cai, Y.H.; Wang, J.J.; Yin, C.; Zou, K. Hyperactive reactive oxygen species impair function of porcine Sertoli cells via suppression of surface protein ITGB1 and connexin-43. Zool. Res. 2020, 41, 203–207. [Google Scholar] [CrossRef] [PubMed]
- Tang, Y.; Wang, Z.; Chen, Y.; Wang, J.; Wang, H.; Li, B.; Liu, B.; Zheng, P. Melatonin Improves H2O2-Induced Oxidative Stress in Sertoli Cells Through Nrf2-Keap1 Signaling Pathway. Genes 2024, 15, 1544. [Google Scholar] [CrossRef] [PubMed]
- Almansa-Ordonez, A.; Bellido, R.; Vassena, R.; Barragan, M.; Zambelli, F. Oxidative Stress in Reproduction: A Mitochondrial Perspective. Biology 2020, 9, 269. [Google Scholar] [CrossRef] [PubMed]
- Ruga, S.; Galla, R.; Penna, C.; Molinari, C.; Uberti, F. The Activity of Ten Natural Extracts Combined in a Unique Blend to Maintain Cholesterol Homeostasis—In Vitro Model. Int. J. Mol. Sci. 2022, 23, 3805. [Google Scholar] [CrossRef]
- Molinari, C.; Ruga, S.; Farghali, M.; Galla, R.; Fernandez-Godino, R.; Clemente, N.; Uberti, F. Effects of a New Combination of Natural Extracts on Glaucoma-Related Retinal Degeneration. Foods 2021, 10, 1885. [Google Scholar] [CrossRef]
- Uberti, F.; Morsanuto, V.; Ghirlanda, S.; Molinari, C. Iron Absorption from Three Commercially Available Supplements in Gastrointestinal Cell Lines. Nutrients 2017, 9, 1008. [Google Scholar] [CrossRef]
- U.S. Food and Drug Administration (FDA). M9 BIOPHARMACEUTICS CLASSIFICATION SYSTEM-BASED BIOWAIVERS. 2025. Available online: https://www.fda.gov/media/117974/download (accessed on 10 October 2025).
- European Medicines Agency (EMA). ICH M9 Biopharmaceutics Classification System-Based Biowaivers: Scientific Guideline. 2025. Available online: https://www.ema.europa.eu/en/ich-m9-biopharmaceutics-classification-system-based-biowaivers-scientific-guideline (accessed on 10 October 2025).
- Guha, S.; Alvarez, S.; Majumder, K. Transport of Dietary Anti-Inflammatory Peptide, γ-Glutamyl Valine (γ-EV), across the Intestinal Caco-2 Monolayer. Nutrients 2021, 13, 1448. [Google Scholar] [CrossRef]
- Konishi, Y.; Hagiwara, K.; Shimizu, M. Transepithelial Transport of Fluorescein in Caco-2 Cell Monolayers and Use of Such Transport in In Vitro Evaluation of Phenolic Acid Availability. Biosci. Biotechnol. Biochem. 2002, 66, 2449–2457. [Google Scholar] [CrossRef]
- Allers, K.; Stahl-Hennig, C.; Fiedler, T.; Wibberg, D.; Hofmann, J.; Kunkel, D.; Moos, V.; Kreikemeyer, B.; Kalinowski, J.; Schneider, T. The Colonic Mucosa-Associated Microbiome in SIV Infection: Shift towards Bacteroidetes Coincides with Mucosal CD4+ T Cell Depletion and Enterocyte Damage. Sci. Rep. 2020, 10, 10887. [Google Scholar] [CrossRef]
- Guan, C.; Chen, X.; Jiang, X.; Zhao, R.; Yuan, Y.; Chen, D.; Zhang, C.C.; Lu, M.; Lu, Z.; Gu, R. In vitro studies of adhesion properties of six lactic acid bacteria isolated from the longevous population of China. RSC Adv. 2020, 10, 24234–24240. [Google Scholar] [CrossRef] [PubMed]
- Molinari, C.G.; Morsanuto, V.; Ruga, S.; Stoppa, I.; Notte, F.; Farghali, M.; Bozzo, C. Role of vitamin D3 and alginates in prevention of NSAID-dependent cellular injury. EC Gastroenterol. Dig. Syst. 2019, 6, 211–223. [Google Scholar]
- Uberti, F.; Morsanuto, V.; Bardelli, C.; Molinari, C. Protective effects of 1α,25-Dihydroxyvitamin D3 on cultured neural cells exposed to catalytic iron. Physiol. Rep. 2016, 4, e12769. [Google Scholar] [CrossRef] [PubMed]
- Chaaban, I.; Hafez, H.; AlZaim, I.; Tannous, C.; Ragab, H.; Hazzaa, A.; Ketat, S.; Ghoneim, A.; Katary, M.; Abd-Alhaseeb, M.M.; et al. Transforming Iodoquinol into Broad-Spectrum Antitumor Leads: Repurposing to Modulate Redox Homeostasis. Bioorg. Chem. 2021, 113, 105035. [Google Scholar] [CrossRef]
- Paik, E.S.; Kim, T.H.; Cho, Y.J.; Ryu, J.; Choi, J.J.; Lee, Y.Y.; Choi, C.H.; Kim, W.Y.; Sa, J.K.; Lee, J.W. Preclinical Assessment of the VEGFR Inhibitor Axitinib as a Therapeutic Agent for Epithelial Ovarian Cancer. Sci. Rep. 2020, 10, 4904. [Google Scholar] [CrossRef]
- Chiu, C.C.; Yeh, T.H.; Lu, C.S.; Huang, Y.C.; Cheng, Y.C.; Huang, Y.Z.; Weng, Y.-H.; Liu, Y.-C.; Lai, S.-C.; Chen, Y.-L.; et al. PARK14 PLA2G6 Mutants Are Defective in Preventing Rotenone-Induced Mitochondrial Dysfunction, ROS Generation and Activation of Mitochondrial Apoptotic Pathway. Oncotarget 2017, 8, 79046–79060. [Google Scholar] [CrossRef]
- Molinari, C.; Ruga, S.; Farghali, M.; Galla, R.; Bassiouny, A.; Uberti, F. Preventing c2c12 muscular cells damage combining magnesium and potassium with vitamin D3 and curcumin. J. Tradit. Complement. Med. 2021, 11, 532–544. [Google Scholar] [CrossRef]
- Muzaail, H.H.; El-Assmy, A.; Harraz, A.M.; Awadalla, A.; Shokeir, A.A.; Abdel-Aziz, A.F. Prediction of recurrence of non-muscle invasive bladder cancer: The role of androgen receptor and miRNA-2909. Urol. Oncol. 2022, 40, 197.e25–197.e35. [Google Scholar] [CrossRef]
- Kim, Y.E.; Choi, H.C.; Nam, G.; Choi, B.Y. Costunolide promotes the proliferation of human hair follicle dermal papilla cells and induces hair growth in C57BL/6 mice. J. Cosmet. Dermatol. 2019, 18, 414–421. [Google Scholar] [CrossRef]
- Moss, S.C.; Lightell, D.J.; Marx, S.O.; Marks, A.R.; Woods, T.C. Rapamycin Regulates Endothelial Cell Migration through Regulation of the Cyclin-dependent Kinase Inhibitor p27Kip1. J. Biol. Chem. 2010, 285, 11991–11997. [Google Scholar] [CrossRef]
- Anjo, S.I.; dos Santos, P.V.; Rosado, L.; Baltazar, G.; Baldeiras, I.; Pires, D.; Januário, C.; Castelo-Branco, M.; Grãos, M.; Manadas, B. A Different Vision of Translational Research in Biomarker Discovery: A Pilot Study on Circulatory Mitochondrial Proteins as Parkinson’s Disease Potential Biomarkers. Transl. Neurodegener. 2020, 9, 11. [Google Scholar] [CrossRef] [PubMed]
- Faisal, I.; Cisneros-Montalvo, S.; Hamer, G.; Tuominen, M.M.; Laurila, P.P.; Tumiati, M.; Jauhiainen, M.; Kotaja, N.; Toppari, J.; Mäkelä, J.-A.; et al. Transcription Factor USF1 Is Required for Maintenance of Germline Stem Cells in Male Mice. Endocrinology 2019, 160, 1119–1136. [Google Scholar] [CrossRef] [PubMed]
- Kayode, O.; Ohanaka, N.J.; Kolawole, I.O.; Afolabi, O.A.; Iyobhebhe, M.E. Reproductive health-promoting effects of functional foods. Funct. Foods Health Dis. 2023, 13, 448–458. [Google Scholar] [CrossRef]
- Mu, K.; Kitts, D.D. Gallic Acid Mitigates Intestinal Inflammation and Loss of Tight Junction Protein Expression Using a 2D-Caco-2 and RAW 264.7 Co-Culture Model. Arch. Biochem. Biophys. 2024, 756, 109978. [Google Scholar] [CrossRef]
- Zhao, L.; Xie, Q.; Evivie, S.E.; Yue, Y.; Yang, H.; Lv, X.; Zhang, H.; Huo, G. Bifidobacterium longum subsp. longum K5 Alleviates Inflammatory Response and Prevents Intestinal Barrier Injury Induced by LPS In Vitro Based on Comparative Genomics. J. Funct. Foods 2022, 92, 105030. [Google Scholar] [CrossRef]
- Ahmadi, S.; Wang, S.; Nagpal, R.; Wang, B.; Jain, S.; Razazan, A.; Mishra, S.P.; Zhu, X.; Wang, Z.; Kavanagh, K.; et al. A Human-Origin Probiotic Cocktail Ameliorates Aging-Related Leaky Gut and Inflammation via Modulating the Microbiota/Taurine/Tight Junction Axis. JCI Insight 2020, 5, e132055. [Google Scholar] [CrossRef]
- Persidis, S.; Moshos, M.; Katramadou, M.; Tyligada, K.; Carageorgiou, H. Histopathologic Modifications of Rabbit Conjunctiva after the Administration of Latanoprost, Travoprost, Vimato-prost and Combinations with Timolol: Preliminary Report. Rev. Clin. Pharmacol. Pharmacokinet. 2009, 26, 200. [Google Scholar]
- Yu, X.; Wang, Y.; Xu, Y.; Li, X.; Zhang, J.; Su, Y.; Guo, L. Resveratrol Attenuates Intestinal Epithelial Barrier Dysfunction via Nrf2/HO-1 Pathway in Dextran Sulfate Sodium-Induced Caco-2 Cells. Immun. Inflamm. Dis. 2024, 12, e1193. [Google Scholar] [CrossRef]
- Tang, L.; Deng, J.; Shi, P.; Zou, S.; Ran, H.; Yin, F.; Liu, J. Rosmarinic Acid Improves Intestinal Barrier Integrity through PI3K/AKT/Nrf2-Mediated Regulation of Tight Junction Protein Expression. Int. Immunopharmacol. 2025, 164, 115380. [Google Scholar] [CrossRef]
- Laaraj, S.; Tikent, A.; El-Rhouttais, C.; Farihi, A.; Ed-Dra, A.; Bouhrim, M.; Elfazazi, K. Nutritional value, HPLC-DAD analysis and biological activities of Ceratonia siliqua L. pulp based on in vitro and in silico studies. Sci. Rep. 2024, 14, 31115. [Google Scholar] [CrossRef]
- Aitken, R.J. Impact of oxidative stress on male and female germ cells: Implications for fertility. Reproduction 2020, 159, R189–R201. [Google Scholar] [CrossRef] [PubMed]
- Gasaly, N.; Hermoso, M.A.; Gotteland, M. Butyrate and the Fine-Tuning of Colonic Homeostasis: Implication for Inflammatory Bowel Diseases. Int. J. Mol. Sci. 2021, 22, 3061. [Google Scholar] [CrossRef] [PubMed]
- Daneshpour, N. Bifidobacterium and the Immune System: A Key Player Against Gastrointestinal Cancers. J. Microbiota 2024, 1, 3. [Google Scholar] [CrossRef]
- Cai, H.; Cao, X.; Qin, D.; Liu, Y.; Liu, Y.; Hua, J.; Peng, S. Gut microbiota supports male reproduction via nutrition, immunity, and signaling. Front. Microbiol. 2022, 13, 977574. [Google Scholar] [CrossRef]
- Yan, X.; Feng, Y.; Hao, Y.; Zhong, R.; Jiang, Y.; Tang, X.; Lu, D.; Fang, H.; Agarwal, M.; Chen, L.; et al. Gut-Testis Axis: Microbiota Prime Metabolome to Increase Sperm Quality in Young Type 2 Diabetes. Microbiol. Spectr. 2022, 10, e01423-22. [Google Scholar] [CrossRef]
- Liu, T.; Han, S.; Yao, Y.; Zhang, G. Role of Human Monocarboxylate Transporter 1 (hMCT1) and 4 (hMCT4) in Tumor Cells and the Tumor Microenvironment. Cancer Manag. Res. 2023, 15, 957–975. [Google Scholar] [CrossRef]
- Ogawa, T.; Kita, K.; Kubota, Y. Proliferation of spermatogonial stem cells and spermatogenesis in vitro. Reprod. Med. Biol. 2006, 5, 169–174. [Google Scholar] [CrossRef]
- Węgłowska, E.; Koziołkiewicz, M.; Kamińska, D.; Grobelski, B.; Pawełczak, D.; Kołodziejczyk, M.; Bielecki, S.; Gendaszewska-Darmach, E. Extracellular Nucleotides Affect the Proangiogenic Behavior of Fibroblasts, Keratinocytes, and Endothelial Cells. Int. J. Mol. Sci. 2022, 23, 238. [Google Scholar] [CrossRef]
- Wang, C.; Zhao, A.; Fan, L.; Ma, B.; Shang, X.J.; Zhang, Q. H2O2 alters metabolism in TM4 Sertoli cells in the mouse. Zhonghua Nan Ke Xue = Natl. J. Androl. 2017, 23, 497–502. [Google Scholar]
- Guo, H.; Liu, T.; Li, J.; Li, E.; Wen, X.; Chen, F.; Zhu, Q. Compound probiotics regulate the NRF2 antioxidant pathway to inhibit aflatoxin B1-induced autophagy in mouse Sertoli TM4 cells. Ecotoxicol. Environ. Saf. 2024, 281, 116619. [Google Scholar] [CrossRef]
- Boufadia, Y.M.; Elaoufi, M.; Tabet, F.; Benali, M.; Riazi, A. Chemical composition and antioxidant activity of Carob pulp (Ceratonia siliqua L.) extracts. J. Food Sci. 2015, 5, 76–83. [Google Scholar] [CrossRef]
- Elaoufi, M.M.; Bouterfas, K.; Djebbar, A.A.; Meziani, S.; Rezki, H.; Kermas, F.; Yasmina, B.M. Chemical composition, anti-ulcer and anti-inflammatory effects of carob pods (Ceratonia siliqua L.) polyphenols from Ain Temouchent. J. Microbiol. Biotechnol. Food Sci. 2022, 12, 2. [Google Scholar] [CrossRef]
- Liang, N.; Kitts, D.D. Amelioration of Oxidative Stress in Caco-2 Cells Treated with Pro-inflammatory Proteins by Chlorogenic Acid Isomers via Activation of the Nrf2-Keap1-ARE-Signaling Pathway. J. Agric. Food Chem. 2018, 66, 11008–11017. [Google Scholar] [CrossRef] [PubMed]
- Moradi, M.; Ghanbari, E.; Rashidi, Z.; Moradi, S.; Shakeri, A.; Faramarzi, A. Carob extract restores testicular function and sperm quality in cadmium-exposed mice: An experimental study. Int. J. Reprod. Biomed. 2025, 23, 545–558. [Google Scholar] [CrossRef]
- Park, Y.J.; Pang, M.G. Mitochondrial Functionality in Male Fertility: From Spermatogenesis to Fertilization. Antioxidants 2021, 10, 98. [Google Scholar] [CrossRef]
- Costa, J.; Braga, P.C.; Rebelo, I.; Oliveira, P.F.; Alves, M.G. Mitochondria Quality Control and Male Fertility. Biology 2023, 12, 827. [Google Scholar] [CrossRef]
- Ansari, Z.; Maleki, M.H.; Roohy, F.; Ebrahimi, Z.; Shams, M.; Mokaram, P.; Zamanzadeh, Z.; Hosseinzadeh, Z.; Koohpeyma, F.; Dastghaib, S. Protective effects of artichoke extract and Bifidobacterium longum on male infertility in diabetic rats. Biochem. Biophys. Rep. 2024, 40, 101834. [Google Scholar] [CrossRef]
- Desler, C.; Munch-Petersen, B.; Stevnsner, T.; Matsui, S.; Kulawiec, M.; Singh, K.K.; Rasmussen, L.J. Mitochondria as determinant of nucleotide pools and chromosomal stability. Mutat. Res. 2007, 625, 112–124. [Google Scholar] [CrossRef]
- Grotehans, N.; McGarry, L.; Nolte, H.; Xavier, V.; Kroker, M.; Narbona-Pérez, Á.J.; MacVicar, T. Ribonucleotide synthesis by NME6 fuels mitochondrial gene expression. EMBO J. 2023, 42, e113256. [Google Scholar] [CrossRef]
- Dong, H.; Rowland, I.; Yaqoob, P. Comparative effects of six probiotic strains on immune function in vitro. Br. J. Nutr. 2012, 108, 459–470. [Google Scholar] [CrossRef]
- El-Zeftawy, M.; Ghareeb, D. Pharmacological bioactivity of Ceratonia siliqua pulp extract: In vitro screening and molecular docking analysis, implication of Keap-1/Nrf2/NF-ĸB pathway. Sci. Rep. 2023, 13, 12209. [Google Scholar] [CrossRef] [PubMed]
- Zhang, W.; Zhuang, S.; Guan, H.; Li, F.; Zou, H.; Li, D. New insights into the anti-apoptotic mechanism of natural polyphenols in complex with Bax protein. J. Biomol. Struct. Dyn. 2024, 42, 3081–3093. [Google Scholar] [CrossRef] [PubMed]
- Holsberger, D.R.; Buchold, G.M.; Leal, M.C.; Kiesewetter, S.E.; O’Brien, D.A.; Hess, R.A.; Cooke, P.S. Cell-cycle inhibitors p27Kip1 and p21Cip1 regulate murine Sertoli cell proliferation. Biol. Reprod. 2005, 72, 1429–1436. [Google Scholar] [CrossRef]
- Meroni, S.B.; Galardo, M.N.; Rindone, G.; Gorga, A.; Riera, M.F.; Cigorraga, S.B. Molecular mechanisms and signaling pathways involved in Sertoli cell proliferation. Front. Endocrinol. 2019, 10, 224. [Google Scholar] [CrossRef] [PubMed]
- Ni, F.D.; Hao, S.L.; Yang, W.X. Multiple signaling pathways in Sertoli cells: Recent findings in spermatogenesis. Cell Death Dis. 2019, 10, 541. [Google Scholar] [CrossRef]
- Galardo, M.N.; Riera, M.F.; Pellizzari, E.H.; Sobarzo, C.; Scarcelli, R.; Denduchis, B.; Meroni, S.B. Adenosine regulates Sertoli cell function by activating AMPK. Mol. Cell. Endocrinol. 2010, 330, 49–58. [Google Scholar] [CrossRef]
- Vafaei, A.; Mohammadi, S.; Fazel, A.; Soukhtanloo, M.; Mohammadipour, A.; Beheshti, F. Effects of carob (Ceratonia siliqua) on sperm quality, testicular structure, testosterone level and oxidative stress in busulfan-induced infertile mice. Pharm. Sci. 2018, 24, 104–111. [Google Scholar] [CrossRef]
- Ashonibare, V.J.; Akorede, B.A.; Ashonibare, P.J.; Akhigbe, T.M.; Akhigbe, R.E. Gut Microbiota–Gonadal Axis: The Impact of Gut Microbiota on Reproductive Functions. Front. Immunol. 2024, 15, 1346035. [Google Scholar] [CrossRef]
- Kurhaluk, N.; Kamiński, P.; Tkaczenko, H. Oxidative Stress, Antioxidants, Gut Microbiota and Male Fertility. Cell. Physiol. Biochem. 2025, 59, 82–123. [Google Scholar] [CrossRef]
- Petricca, S.; Carnicelli, V.; Luzi, C.; Cinque, B.; Celenza, G.; Iorio, R. Oxidative Stress, Cytotoxic and Inflammatory Effects of Azoles Combinatorial Mixtures in Sertoli TM4 Cells. Antioxidants 2023, 12, 1142. [Google Scholar] [CrossRef]
- Wang, J.M.; Li, Z.F.; Yang, W.X.; Tan, F.Q. Follicle-Stimulating Hormone Signaling in Sertoli Cells: A Licence to the Early Stages of Spermatogenesis. Reprod. Biol. Endocrinol. 2022, 20, 97. [Google Scholar] [CrossRef]


Disclaimer/Publisher’s Note: The statements, opinions and data contained in all publications are solely those of the individual author(s) and contributor(s) and not of MDPI and/or the editor(s). MDPI and/or the editor(s) disclaim responsibility for any injury to people or property resulting from any ideas, methods, instructions or products referred to in the content. |
© 2026 by the authors. Licensee MDPI, Basel, Switzerland. This article is an open access article distributed under the terms and conditions of the Creative Commons Attribution (CC BY) license.