

Trends in Health-Risk Behaviors and Psychological Distress among Australian First-Year University Students

 ,
,  , , ,
, , , 
Abstract
1. Introduction
2. Materials and Methods
2.1. Study Design
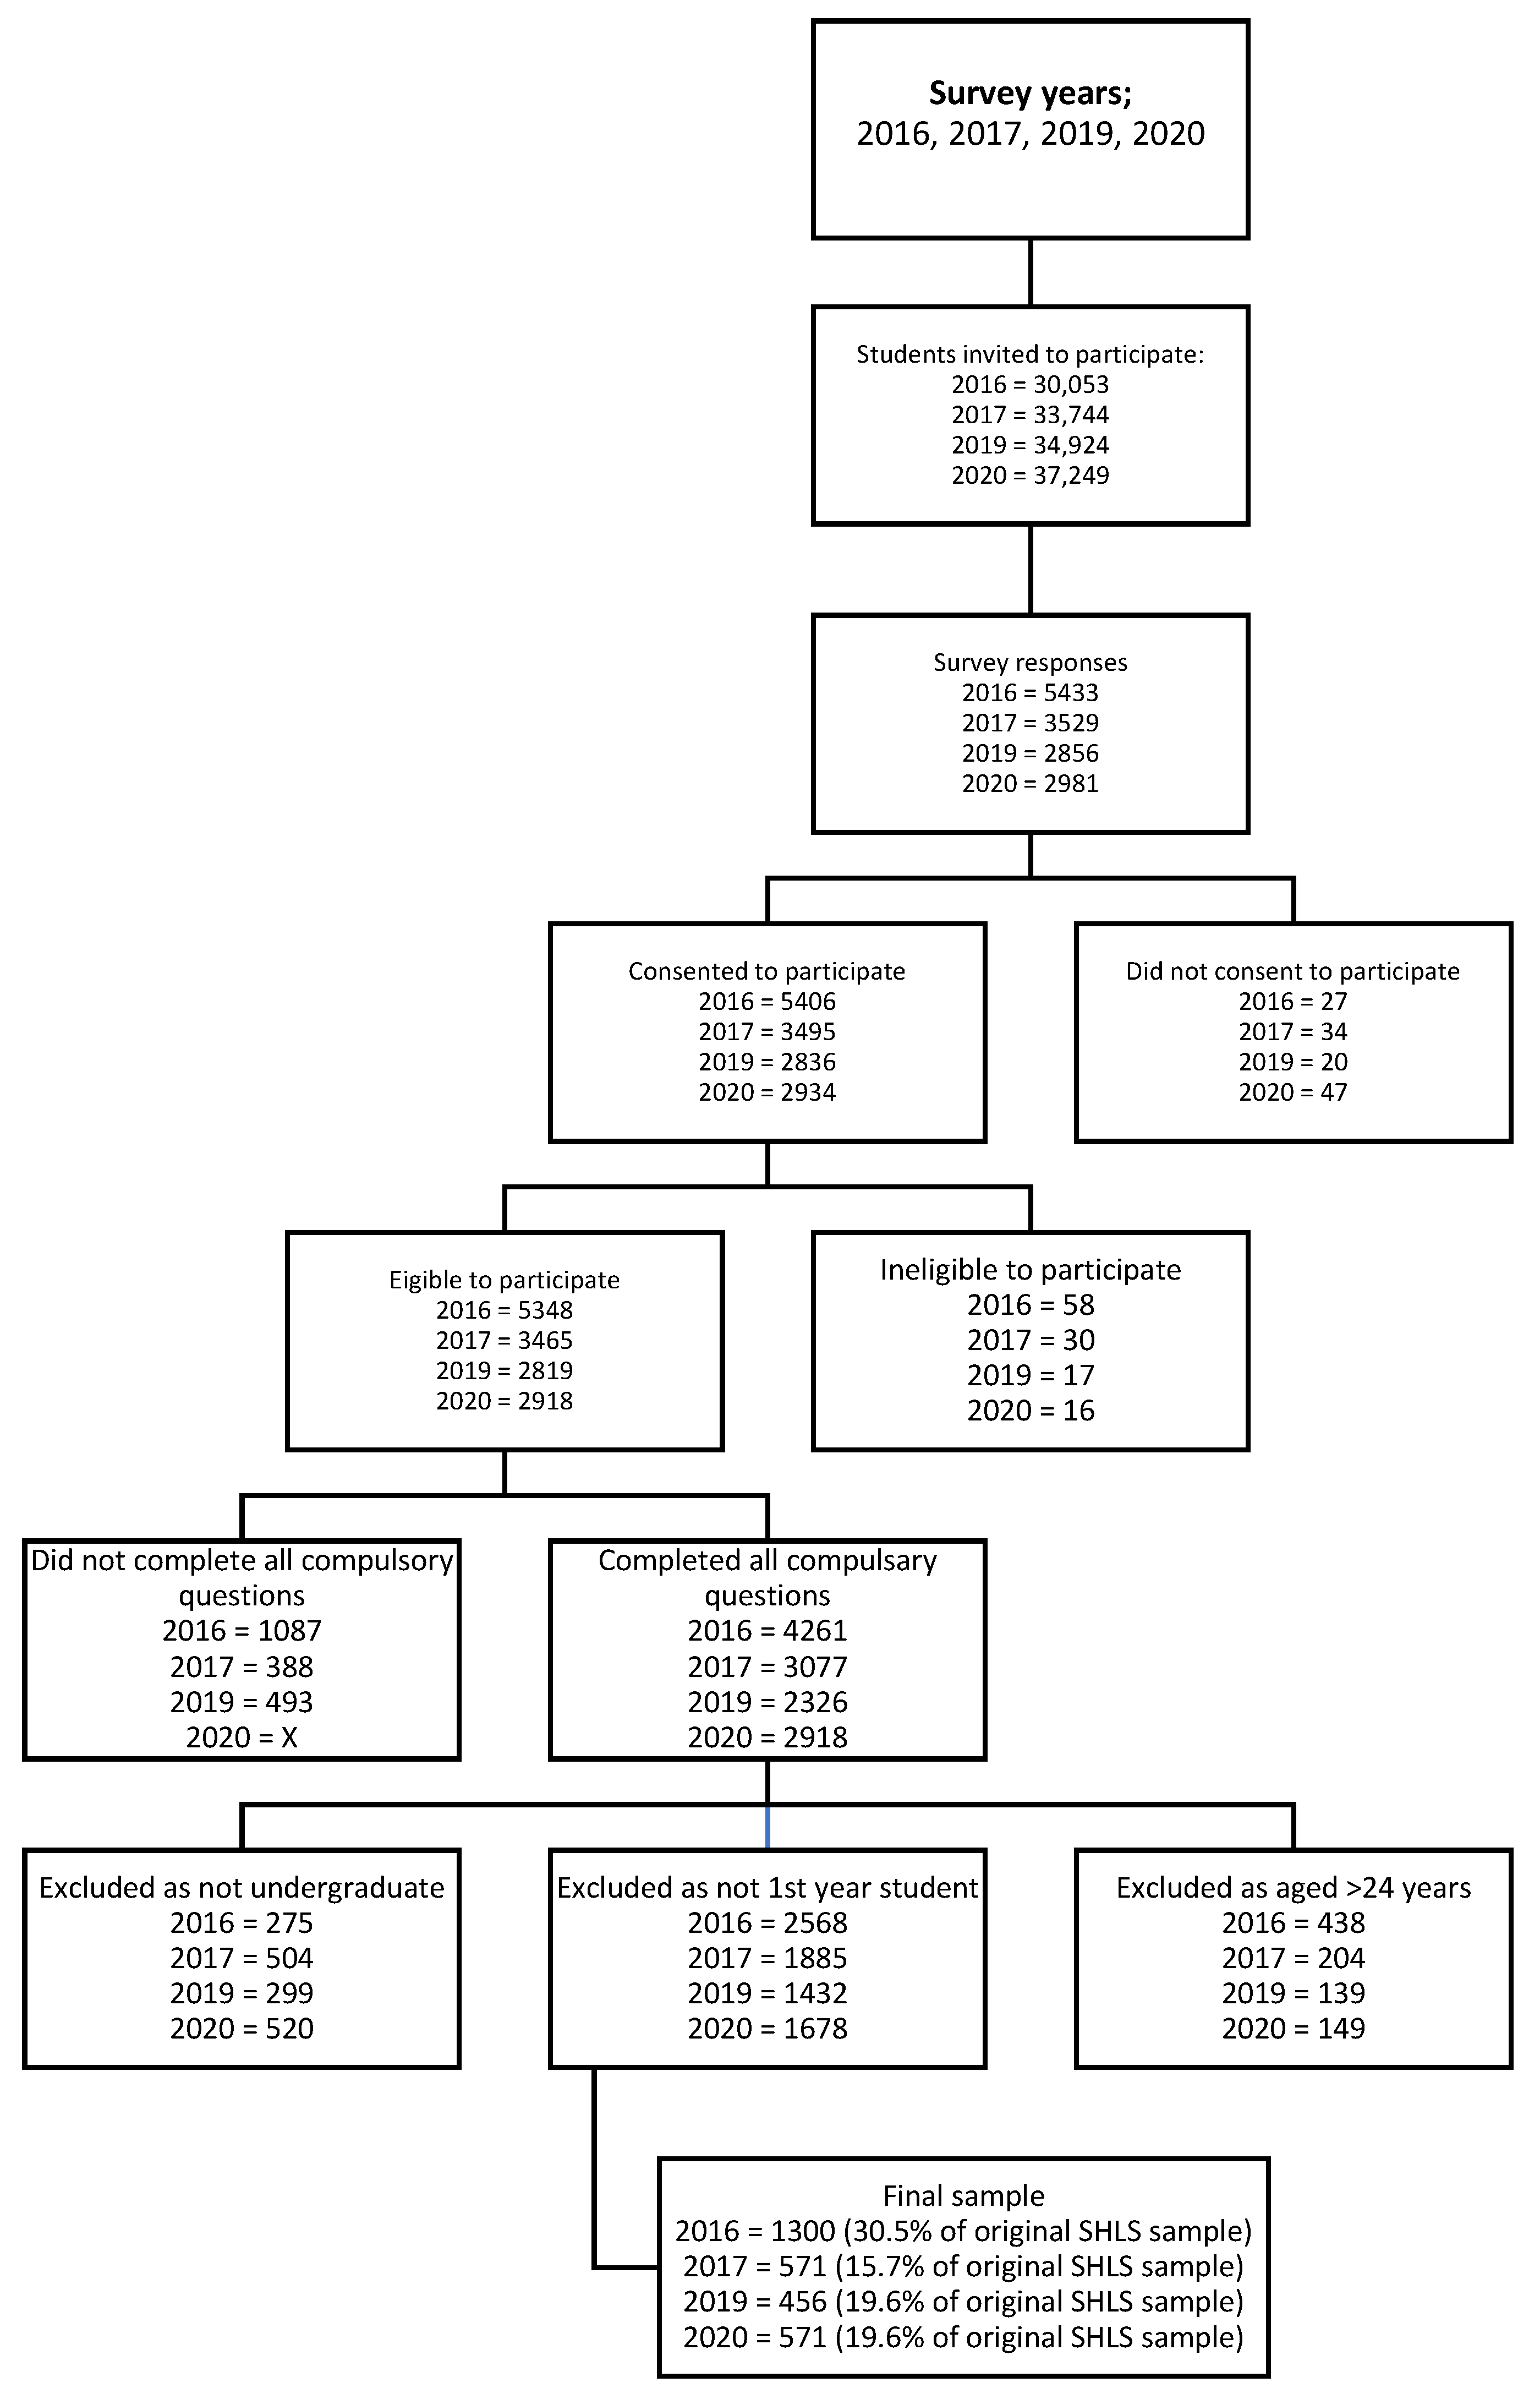
2.2. Participants and Recruitment
2.3. Measures
2.3.1. Demographic and Student-Related Characteristics
2.3.2. Health-Risk Behaviors and Psychological Distress
2.4. Statistical Analysis
3. Results
3.1. Participant Characteristics
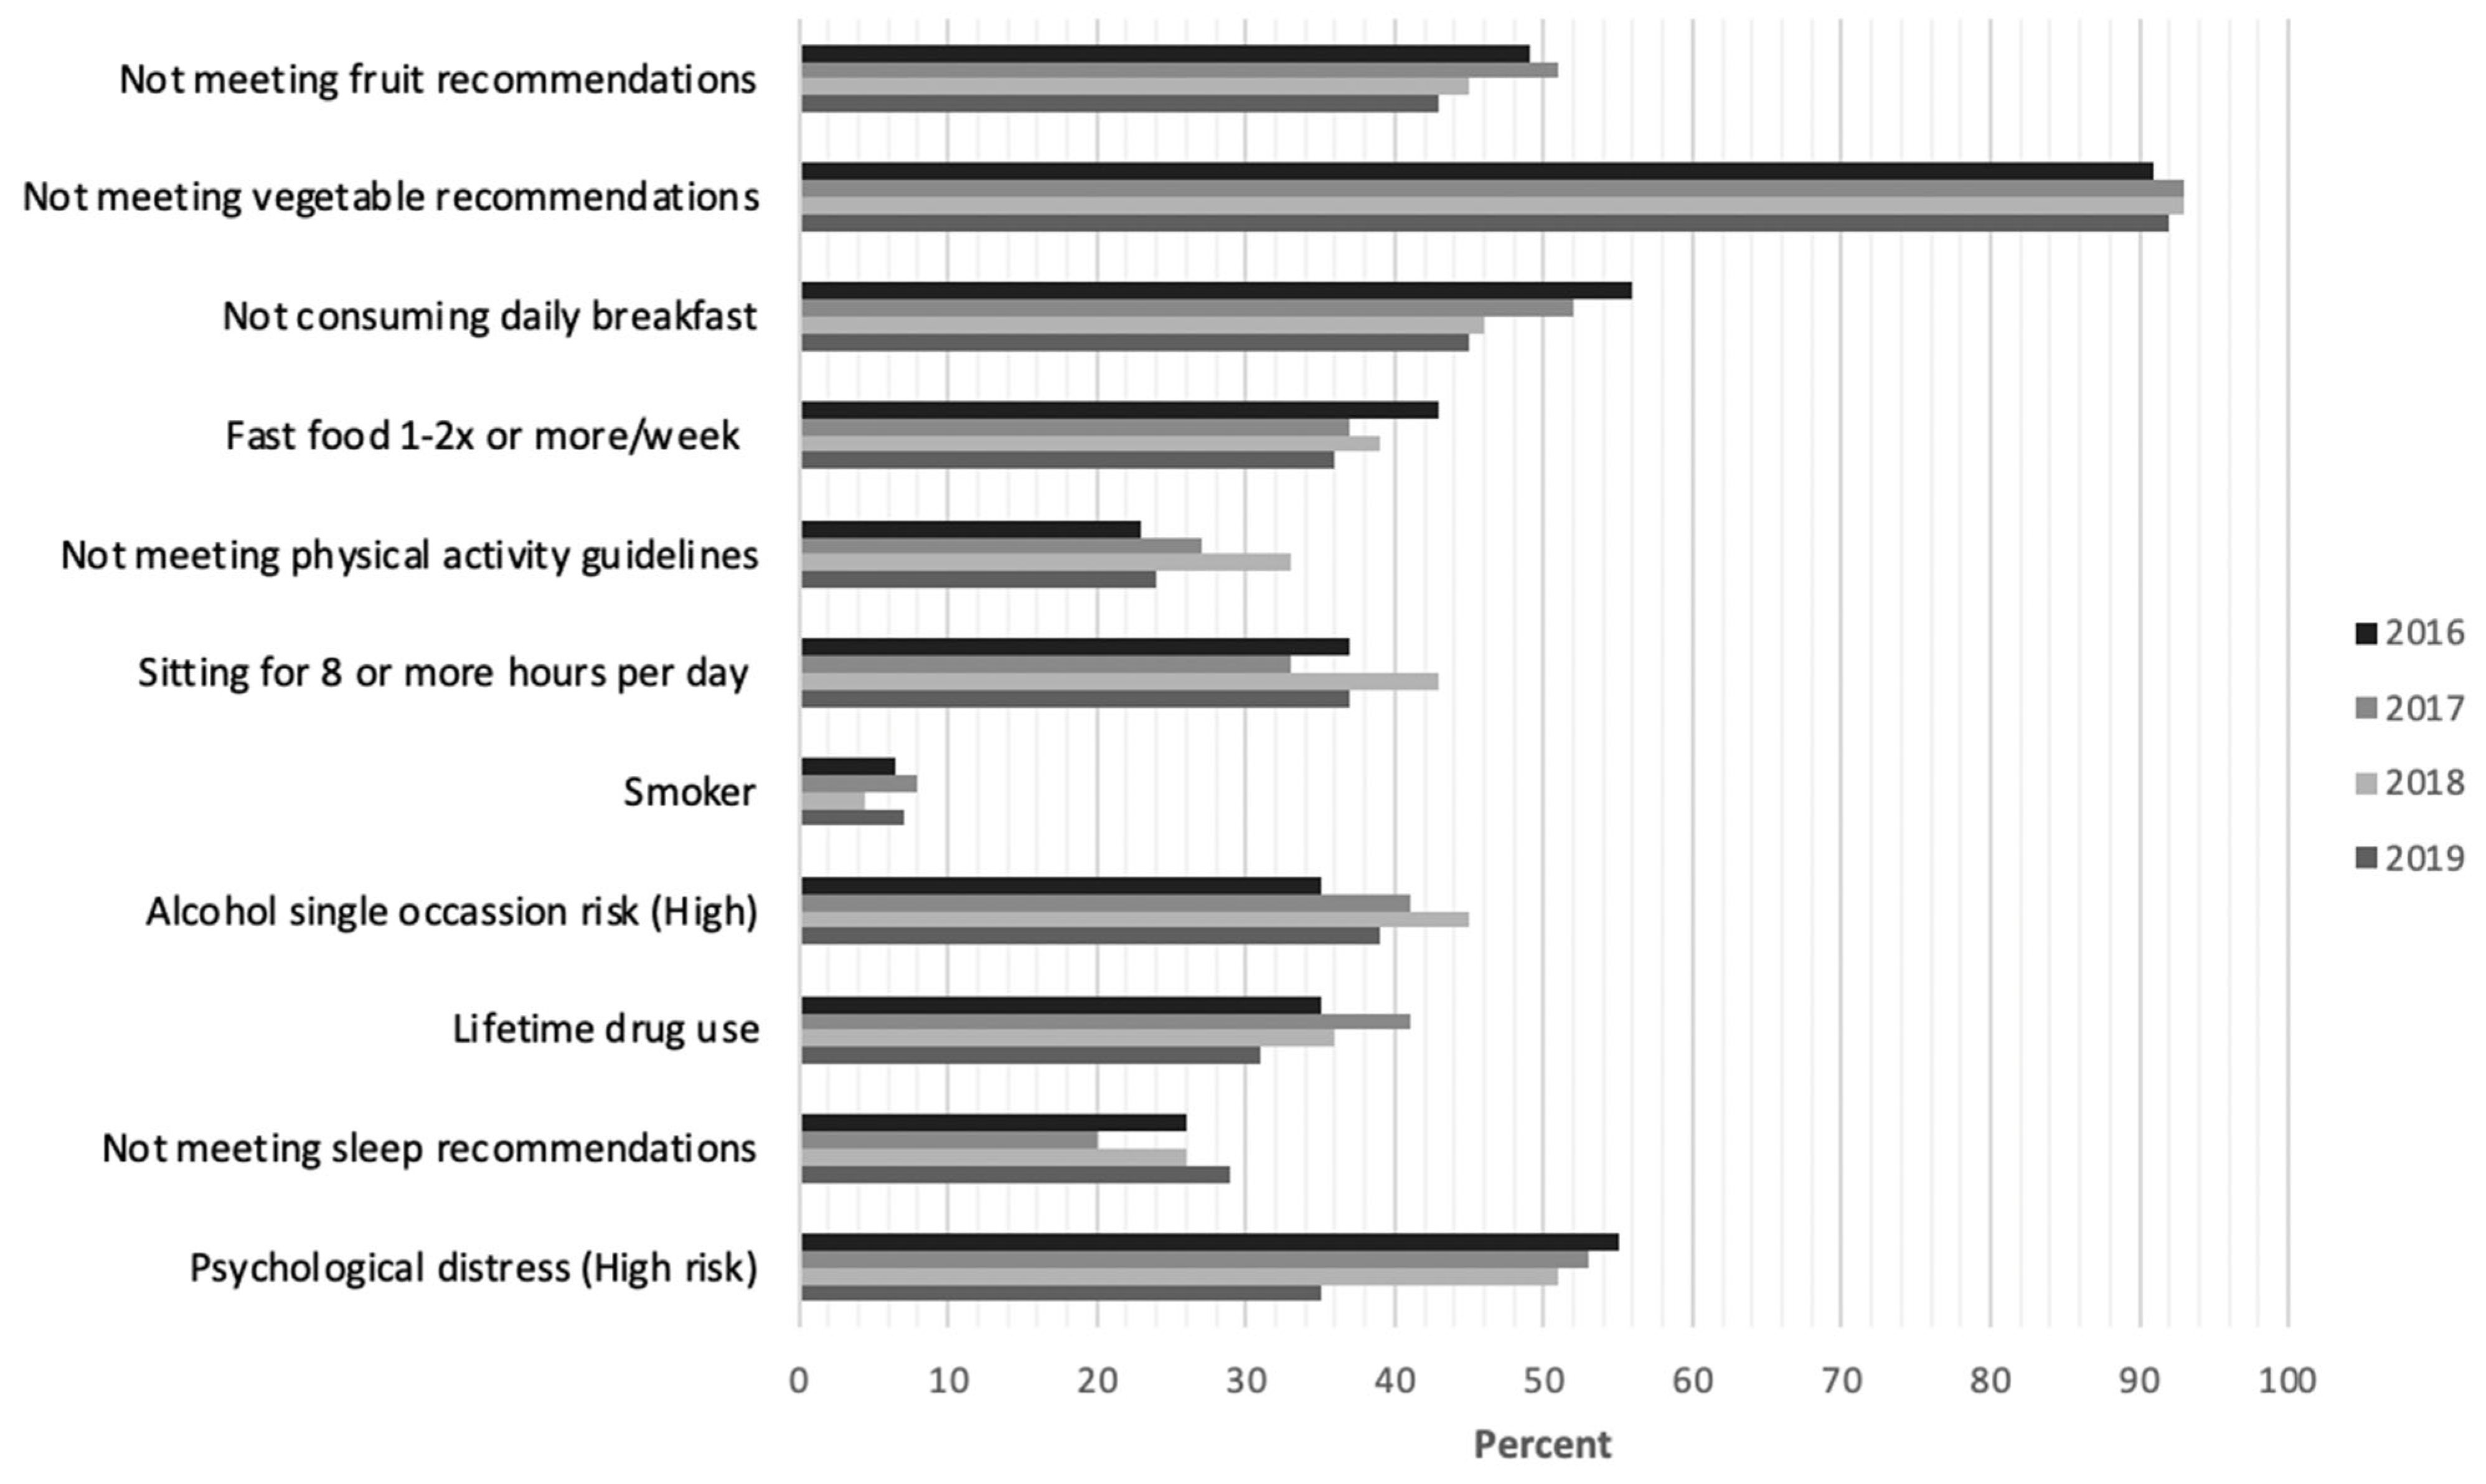
3.2. Health-Risk Behaviors
3.2.1. Diet
3.2.2. Physical Activity
3.2.3. Sitting Time
3.2.4. Smoking
3.2.5. Alcohol
3.2.6. Illicit Drug Use
3.2.7. Sleep
3.3. Psychological Distress
4. Discussion
5. Conclusions
Supplementary Materials
Author Contributions
Funding
Institutional Review Board Statement
Informed Consent Statement
Data Availability Statement
Acknowledgments
Conflicts of Interest
References
- Auerbach, R.P.; Alonso, J.; Axinn, W.G.; Cuijpers, P.; Ebert, D.D.; Green, J.G.; Hwang, I.; Kessler, R.C.; Liu, H.; Mortier, P.; et al. Mental disorders among college students in the World Health Organization World Mental Health Surveys-CORRIGENDUM. Psychol. Med. 2017, 47, n2737. [Google Scholar] [CrossRef] [PubMed]
- Hutchesson, M.J.; Duncan, M.J.; Oftedal, S.; Ashton, L.M.; Oldmeadow, C.; Kay-Lambkin, F.; Whatnall, M.C. Latent Class Analysis of Multiple Health Risk Behaviors among Australian University Students and Associations with Psychological Distress. Nutrients 2021, 13, 425. (In English) [Google Scholar] [CrossRef] [PubMed]
- American College Health Association. National College Health Assessment: Fall 2021. Reference Group Summary; American College Health Association: Silver Spring, MD, USA, 2021; Available online: https://www.acha.org/documents/ncha/NCHA-III_FALL_2021_REFERENCE_GROUP_EXECUTIVE_SUMMARY.pdf (accessed on 16 June 2022).
- Keller, S.; Maddock, J.E.; Hannover, W.; Thyrian, J.R.; Basler, H.D. Multiple Health Risk Behaviors in German First Year University Students. Prev. Med. 2008, 46, 189–195. [Google Scholar] [CrossRef] [PubMed]
- Deliens, T.; Clarys, P.; Bourdeaudhuij, I.D.; Deforche, B. Weight, socio-demographics, and health behaviour related correlates of academic performance in first year university students. Nutrients 2013, 12, 162. [Google Scholar] [CrossRef] [PubMed]
- Wong, J.G.; Cheung, E.P.; Chan, K.K.; Ma, K.K.; Tang, S.W. Web-based survey of depression, anxiety and stress in first-year tertiary education students in Hong Kong. Aust. N. Z. J. Psychiatry 2006, 40, 777–782. (In English) [Google Scholar] [CrossRef] [PubMed]
- Department of Education Skills and Employment. Selected Higher Education Statistics-2020 Student Data; Australian Government, Department of Education: Canberra, Australia, 2020. Available online: https://www.dese.gov.au/higher-education-statistics/student-data/selected-higher-education-statistics-2020-student-data-0 (accessed on 16 June 2022).
- Walker-Harding, L.R.; Christie, D.; Joffe, A.; Lau, J.S.; Neinstein, L. Young Adult Health and Well-Being: A Position Statement of the Society for Adolescent Health and Medicine. J. Adolesc. Health 2017, 60, 758–759. (In English) [Google Scholar] [CrossRef]
- Deforche, B.; Van Dyck, D.; Deliens, T.; De Bourdeaudhuij, I. Changes in weight, physical activity, sedentary behaviour and dietary intake during the transition to higher education: A prospective study. Int. J. Behav. Nutr. Phys. Act. 2015, 12, 16. (In English) [Google Scholar] [CrossRef]
- Katz, S.; Somers, C.L. Individual and Environmental Predictors of College Adjustment: Prevention and Intervention. Curr. Psychol. 2017, 36, 56–65. [Google Scholar] [CrossRef]
- Aceijas, C.; Waldhäusl, S.; Lambert, N.; Cassar, S.; Bello-Corassa, R. Determinants of health-related lifestyles among university students. Perspect. Public Health 2017, 137, 227–236. [Google Scholar] [CrossRef]
- Swai, J.; Mohamed, A.; Zhang, J.P. Commentary: Impact of the COVID-19 Pandemic on the Mental Health of College Students: A Systematic Review and Meta-Analysis. Front. Psychol. 2021, 12, 753798. (In English) [Google Scholar] [CrossRef]
- World Health Organization. WHO Coronavirus Disease (COVID-19) Dashboard. Available online: https://covid19.who.int/ (accessed on 10 June 2022).
- Rivera, P.A.; Nys, B.L.; Fiestas, F. Impact of COVID-19 induced lockdown on physical activity and sedentary behavior among university students: A systematic review. Medwave 2021, 21, e8456. (In English) [Google Scholar] [CrossRef] [PubMed]
- Whatnall, M.C.; Patterson, A.J.; Brookman, S.; Convery, P.; Swan, C.; Pease, S.; Hutchesson, M.J. Lifestyle behaviors and related health risk factors in a sample of Australian university students. J. Am. Coll. Health 2020, 68, 734–741. (In English) [Google Scholar] [CrossRef] [PubMed]
- Australian Bureau of Statistics. Census of Population and Housing Sample household Form. Available online: http://www.abs.gov.au/AUSSTATS/abs@.nsf/DetailsPage/2900.02016?OpenDocument (accessed on 2 June 2022).
- Centre for Epidemiology and Evidence. NSW Population Health Survey 2014-Questionnare; NSW Health: Sydney, Australia, 2014. Available online: https://www.health.nsw.gov.au/surveys/adult/Documents/Questionnaire-2014-WEB.pdf (accessed on 10 June 2022).
- National Health and Medical Research Council. Eat for Health Educator Guide. Australian Government. Available online: https://www.nhmrc.gov.au/adg (accessed on 2 June 2022).
- Australian Institute of Health and Welfare. The Active Australia Survey: A GUIDE and Manual for implemendation, Analysis, and Reporting. Available online: https://www.aihw.gov.au/reports/physical-activity/active-australia-survey/summar (accessed on 2 June 2022).
- Australian Government Department of Health and Aged Care. Australia’s Physical Activity and Sedentary Behaviour Guidelines. Australian Government. Available online: https://www.health.gov.au/topics/physical-activity-and-exercise/physical-activity-and-exercise-guidelines-for-all-australians/for-adults-18-to-64-years (accessed on 20 June 2022).
- Van der Ploeg, H.P.; Chey, T.; Korda, R.J.; Banks, E.; Bauman, A. Sitting time and all-cause mortality risk in 222 497 Australian adults. Arch. Intern. Med. 2012, 172, 494–500. (In English) [Google Scholar] [CrossRef]
- Department of Health and Aged Care. Standards Drink Guide. Australian Government. Available online: https://www.health.gov.au/topics/alcohol/about-alcohol/standard-drinks-guide (accessed on 20 June 2022).
- National Health and Medical Research Council. Australian Guidelines to Reduce Health Risks from Drinking Alcohol. NHMRC. Available online: https://www.nhmrc.gov.au/health-advice/alcohol# (accessed on 2 June 2022).
- Australian Institute of Health and Welfare. National Drug Stategy Household Survey. Available online: https://www.aihw.gov.au/getmedia/e1f0d168-cad3-476f-b388-5c5714755451/ndshs-2013-questionnaire.pdf.aspx (accessed on 2 June 2022).
- Centers for Disease Control and Prevention. Data and Statistics-Sleep and Sleep Disorders. Available online: https://www.cdc.gov/sleep/data-and-statistics/Adults.html (accessed on 6 June 2022).
- Sleep Health Foundation. Sleep Needs Across the Lifespan. Available online: https://www.sleephealthfoundation.org.au/files/pdfs/Sleep-Needs-Across-Lifespan.pdf (accessed on 8 June 2022).
- Kessler, R.C.; Andrews, G.; Colpe, L.J.; Hiripi, E.; Mroczek, D.K.; Normand, S.-L.T.; Walters, E.E.; Zaslavsky, A.M. Short screening scales to monitor population prevalences and trends in non-specific psychological distress. Psychol. Med. 2002, 32, 959–976. [Google Scholar] [CrossRef]
- Australian Bureau of Statistics. National Study of Health and Wellbeing, 2020–2021. Available online: https://www.abs.gov.au/statistics/health/mental-health/national-study-mental-health-and-wellbeing/latest-release#psychological-distress (accessed on 15 November 2022).
- Adonu, R.E.; Amoah, M.; Saah, F.I. Breakfast intake and associated factors and barriers among tertiary institution students in the Western Region, Ghana. BMC Nutr. 2023, 9, 7. (In English) [Google Scholar] [CrossRef] [PubMed]
- Hilger-Kolb, J.; Diehl, K. ‘Oh God, I Have to Eat Something, But Where Can I Get Something Quickly?’—A Qualitative Interview Study on Barriers to Healthy Eating among University Students in Germany. Nutrients 2019, 11, 2440. (In English) [Google Scholar] [CrossRef] [PubMed]
- Díaz-Torrente, X.; Quintiliano-Scarpelli, D. Dietary Patterns of Breakfast Consumption Among Chilean University Students. Nutrients 2020, 12, 552. (In English) [Google Scholar] [CrossRef] [PubMed]
- Dingle, G.A.; Han, R.; Carlyle, M. Loneliness, Belonging, and Mental Health in Australian University Students Pre- and Post-COVID-19. Behav. Chang. 2022, 39, 146–156. [Google Scholar] [CrossRef]
- Sidor, A.; Rzymski, P. Dietary Choices and Habits during COVID-19 Lockdown: Experience from Poland. Nutrients 2020, 12, 1657. (In English) [Google Scholar] [CrossRef]
- Padrón, I.; Fraga, I.; Vieitez, L.; Montes, C.; Romero, E. A Study on the Psychological Wound of COVID-19 in University Students. Front. Psychol. 2021, 12, 589927. (In English) [Google Scholar] [CrossRef]
- Deng, J.; Zhou, F.; Hou, W.; Silver, Z.; Wong, C.Y.; Chang, O.; Drakos, A.; Zuo, Q.K.; Huang, E. The prevalence of depressive symptoms, anxiety symptoms and sleep disturbance in higher education students during the COVID-19 pandemic: A systematic review and meta-analysis. Psychiatry Res. 2021, 301, 113863. (In English) [Google Scholar] [CrossRef] [PubMed]
- Australian Bureau of Statistics. Alcohol Consumption. Available online: https://www.abs.gov.au/statistics/health/health-conditions-and-risks/alcohol-consumption/latest-release (accessed on 15 May 2023).
- American College Health Association. American College Health Association-National College Health Assessment III: Reference Group Executive Summary Spring 2023; American College Health Association: Silver Spring, MD, USA, 2023; Available online: https://www.acha.org/documents/ncha/NCHA-III_SPRING_2023_REFERENCE_GROUP_EXECUTIVE_SUMMARY.pdf (accessed on 5 March 2023).
- Australian Bureau of Statistics. Physical Activity. Available online: https://www.aihw.gov.au/reports/physical-activity/physical-activity (accessed on 5 March 2024).
- Department of Health and Aged Care. Smoking and Tobacco Laws in Australia. Available online: https://www.health.gov.au/topics/smoking-vaping-and-tobacco/about-smoking/laws-in-australia (accessed on 5 March 2024).

| Survey Year | 2016 | 2017 | 2019 | 2020 |
|---|---|---|---|---|
| Eligibility | All UON students (n = 30,053) | All UON students (n = 33,744) | All UON students (n = 34,924) | All UON students (n = 37,249) |
| Recruitment time frame | 15 February 2016–13 March 2016 During orientation and first 3 weeks of semester 1 | 4 September 2017–1 October 2017 During semester 2 | 9 September 2019–5 October 2019 During semester 2 | 6 October 2020–November 2020 During semester 2 |
| Invitation methods | Email invitation sent 15 February 2016 2 reminder/thankyou emails sent to students 1 and 2 weeks after the original email Incentive: 1 in 10 prizes valued at up to $250 | Email invitation sent 4 September 2017 2 reminder/thankyou emails sent to students 1 and 2 weeks after the original email Incentive; 1 in 5 $100 gift vouchers | Email invitation sent 9 September 2019 2 reminder/thankyou emails sent 1 and 2 weeks after the original email Incentive: 1 in 5 $100 gift vouchers | Email invitation sent 6 October 2020 2 reminder/thankyou emails sent 1 and 2 weeks after the original email Incentive; 1 in 10 $100 gift cards |
| Advertisement | Advertised over 4 weeks; -Social media accounts -Screen savers on all university computers -Posters displayed on noticeboards -Lecturers advertised at the beginning of class using a PowerPoint slide | Advertised over 4 weeks; -Social media accounts -Screen savers on all university computers -Posters displayed on noticeboards -Lecturers advertised at the beginning of class using a PowerPoint slide | Advertised over 4 weeks; -Social media accounts -Screen savers on all university computers -Posters displayed on noticeboards -Lecturers advertised at the beginning of class using a PowerPoint slide | Advertised over 4 weeks; -Social media accounts -Screen savers on all university computers -Lecturers advertised at the beginning of class using a PowerPoint slide |
| Study design | -Online cross-sectional survey via survey monkey -Anonymous answers -Provided consent -Could only submit one entry -15 min to complete | -Online cross-sectional survey via survey monkey -Anonymous answers -Provided consent -Could only submit one entry -15 min to complete | -Online cross-sectional survey via survey monkey -Anonymous answers -Provided consent -Could only submit one entry -15 min to complete | -Online cross-sectional survey via Blue -Anonymous answers -Could only submit one entry -Provided consent -15 min to complete |
| Total questions | 66 over 30 pages | 61 over 27 pages | 71 over 34 pages | 50 questions |
| Sample size who completed all compulsory survey questions (n) (%) | n = 4261 (14.2%) | n = 3077 (9.1%) | n = 2326 (6.7%) | n = 2918 (7.8%) |
| Total who answered Non-compulsory questions (n) (%) | 4095 drug use (13.6%) 4134 Mental health and wellbeing (13.7%) | 3043 Other drugs (9%) 3003 mental health (8.9%) | 2142 other drugs (6.1%) 2265 mental health (6.5%) | 2709 Other drugs (7.6%) 2816 Mental health (7.5%) |
| Characteristic | 2016 (n = 1300) | 2017 (n = 484) | 2019 (n = 456) | 2020 (n = 571) | |
|---|---|---|---|---|---|
| Domestic/International | Domestic | 1253 (96%) | 456 (94%) | 438 (96%) | 520 (91%) |
| International (onshore) | 29 (2.2%) | 22 (4.5%) | 13 (2.9%) | 18 (3.2%) | |
| International (offshore) | 18 (1.4%) | 6 (1.2%) | 5 (1.1%) | 33 (5.8%) | |
| Gender | Male | 380 (29%) | 136 (28%) | 129 (28%) | 168 (29%) |
| Female | 915 (70%) | 345 (71%) | 320 (70%) | 399 (70%) | |
| Other | 5 (0.4%) | 3 (0.6%) | - | - | |
| Non-binary | - | - | 3 (0.7%) | 3 (0.5%) | |
| Another gender identity | - | - | 4 (0.9%) | 1 (0.2%) | |
| Age (years) | 17 | 90 (6.9%) | 2 (0.4%) | 1 (0.2%) | - |
| 18 | 527 (41%) | 100 (21%) | 106 (23%) | 115 (20%) | |
| 19 | 289 (22%) | 158 (33%) | 176 (39%) | 212 (37%) | |
| 20 | 143 (11%) | 89 (18%) | 70 (15%) | 104 (18%) | |
| 21 | 77 (5.9%) | 51 (11%) | 38 (8.3%) | 47 (8.2%) | |
| 22 | 54 (4.2%) | 33 (6.8%) | 32 (7.0%) | 35 (6.1%) | |
| 23 | 63 (4.8%) | 24 (5.0%) | 16 (3.5%) | 33 (5.8%) | |
| 24 | 57 (4.4%) | 27 (5.6%) | 17 (3.7%) | 25 (4.4%) | |
| Aboriginal or Torres Strait Islander Origin | Aboriginal | 47 (3.6%) | 13 (2.7%) | 16 (3.5%) | 15 (2.6%) |
| Torres Strait Islander | - | - | 1 (0.2%) | 3 (0.5%) | |
| Aboriginal and Torres Strait Islander | 2 (0.2%) | - | 1 (0.2%) | - | |
| None of the above | 1251 (96%) | 471 (97%) | 437 (96%) | 541 (95%) | |
| No response | 1 (0.2%) | 12 (2.1%) |
| Health Behavior | Comparison Years | Crude Odds Ratio (95% CI) | Crude p-Value | Adjusted Odds Ratio (95% CI) | Adjusted p-Value |
|---|---|---|---|---|---|
| Meeting fruit recommendations | 2016 vs. 2017 | 1.09 (0.89, 1.35) | 0.400 | 1.04 (0.83, 1.29) | 0.749 |
| 2016 vs. 2019 | 1.37 (1.11, 1.70) | 0.004 | 1.36 (1.09, 1.69) | 0.007 | |
| 2016 vs. 2020 | 1.25 (1.03, 1.53) | 0.024 | 1.18 (0.96, 1.45) | 0.113 | |
| 2017 vs. 2019 | 1.25 (0.97, 1.62) | 0.084 | 1.31 (1.01, 1.70) | 0.043 | |
| 2017 vs. 2020 | 1.15 (0.90, 1.46) | 0.269 | 1.14 (0.89, 1.46) | 0.298 | |
| 2019 vs. 2020 | 0.91 (0.71, 1.17) | 0.477 | 0.87 (0.68, 1.12) | 0.281 | |
| Meeting vegetable recommendations | 2016 vs. 2017 | 1.19 (0.79, 1.78) | 0.405 | 1.24 (0.81, 1.88) | 0.322 |
| 2016 vs. 2019 | 1.23 (0.81, 1.88) | 0.326 | 1.26 (0.82, 1.95) | 0.292 | |
| 2016 vs. 2020 | 0.93 (0.65, 1.32) | 0.673 | 0.90 (0.62, 1.30) | 0.579 | |
| 2017 vs. 2019 | 1.04 (0.62, 1.73) | 0.883 | 1.02 (0.61, 1.72) | 0.936 | |
| 2017 vs. 2020 | 0.78 (0.49, 1.23) | 0.287 | 0.73 (0.46, 1.16) | 0.184 | |
| 2019 vs. 2020 | 0.75 (0.47, 1.20) | 0.233 | 0.71 (0.44, 1.15) | 0.168 | |
| Breakfast consumption (everyday) | 2016 vs. 2017 | 1.06 (0.86, 1.31) | 0.575 | 1.01 (0.82, 1.26) | 0.901 |
| 2016 vs. 2019 | 1.30 (1.05, 1.61) | 0.016 | 1.25 (1.00, 1.55) | 0.048 | |
| 2016 vs. 2020 | 1.57 (1.29, 1.91) | 0.000 | 1.48 (1.20, 1.82) | 0.000 | |
| 2017 vs. 2019 | 1.22 (0.95, 1.58) | 0.122 | 1.23 (0.95, 1.59) | 0.116 | |
| 2017 vs. 2020 | 1.48 (1.16, 1.89) | 0.002 | 1.46 (1.14, 1.87) | 0.003 | |
| 2019 vs. 2020 | 1.21 (0.94, 1.55) | 0.135 | 1.19 (0.92, 1.52) | 0.182 | |
| Fast food consumption (<1–2 times/week) | 2016 vs. 2017 | 1.13 (0.91, 1.40) | 0.268 | 1.15 (0.92, 1.43) | 0.222 |
| 2016 vs. 2019 | 1.04 (0.83, 1.29) | 0.748 | 1.03 (0.82, 1.30) | 0.796 | |
| 2016 vs. 2020 | 1.32 (1.08, 1.61) | 0.007 | 1.34 (1.09, 1.66) | 0.006 | |
| 2017 vs. 2019 | 0.92 (0.71, 1.20) | 0.527 | 0.90 (0.69, 1.17) | 0.430 | |
| 2017 vs. 2020 | 1.17 (0.91, 1.49) | 0.222 | 1.17 (0.91, 1.50) | 0.228 | |
| 2019 vs. 2020 | 1.27 (0.99, 1.63) | 0.063 | 1.30 (1.00, 1.68) | 0.046 | |
| Performing sufficient physical activity | 2016 vs. 2017 | 1.56 (1.23, 1.97) | 0.000 | 1.48 (1.17, 1.89) | 0.001 |
| 2016 vs. 2019 | 1.18 (0.92, 1.50) | 0.199 | 1.14 (0.88, 1.47) | 0.319 | |
| 2016 vs. 2020 | 0.94 (0.74, 1.20) | 0.628 | 0.89 (0.69, 1.14) | 0.337 | |
| 2017 vs. 2019 | 0.75 (0.57, 1.00) | 0.054 | 0.77 (0.57, 1.03) | 0.074 | |
| 2017 vs. 2020 | 0.61 (0.46, 0.80) | 0.000 | 0.60 (0.45, 0.79) | 0.000 | |
| 2019 vs. 2020 | 0.80 (0.60, 1.07) | 0.137 | 0.78 (0.58, 1.05) | 0.098 | |
| Sitting time (<8 h/day) | 2016 vs. 2017 | 0.78 (0.63, 0.96) | 0.021 | 1.32 (1.06, 1.64) | 0.014 |
| 2016 vs. 2019 | 1.23 (0.98, 1.54) | 0.072 | 0.83 (0.66, 1.05) | 0.118 | |
| 2016 vs. 2020 | 1.03 (0.84, 1.27) | 0.747 | 0.97 (0.78, 1.20) | 0.751 | |
| 2017 vs. 2019 | 1.58 (1.21, 2.06) | 0.001 | 0.63 (0.48, 0.83) | 0.001 | |
| 2017 vs. 2020 | 1.33 (1.04, 1.70) | 0.025 | 0.73 (0.57, 0.94) | 0.016 | |
| 2019 vs. 2020 | 0.84 (0.65, 1.09) | 0.190 | 1.16 (0.89, 1.52) | 0.264 | |
| Tobacco smoking (non-smoker) | 2016 vs. 2017 | 0.63 (0.39, 1.01) | 0.054 | 0.53 (0.33, 0.87) | 0.011 |
| 2016 vs. 2019 | 1.16 (0.78, 1.73) | 0.465 | 1.05 (0.70, 1.58) | 0.816 | |
| 2016 vs. 2020 | 0.91 (0.61, 1.35) | 0.639 | 0.78 (0.51, 1.17) | 0.229 | |
| 2017 vs. 2019 | 1.85 (1.08, 3.19) | 0.026 | 1.97 (1.14, 3.41) | 0.016 | |
| 2017 vs. 2020 | 1.46 (0.85, 2.50) | 0.175 | 1.46 (0.84, 2.53) | 0.182 | |
| 2019 vs. 2020 | 0.78 (0.49, 1.26) | 0.315 | 0.74 (0.46, 1.20) | 0.221 | |
| Low-risk alcohol consumption (single occasion) | 2016 vs. 2017 | 1.29 (1.04, 1.59) | 0.018 | 1.36 (1.09, 1.69) | 0.006 |
| 2016 vs. 2019 | 1.07 (0.86, 1.33) | 0.520 | 1.10 (0.87, 1.37) | 0.427 | |
| 2016 vs. 2020 | 0.85 (0.70, 1.05) | 0.129 | 0.92 (0.74, 1.14) | 0.455 | |
| 2017 vs. 2019 | 0.83 (0.64, 1.08) | 0.168 | 0.81 (0.62, 1.05) | 0.112 | |
| 2017 vs. 2020 | 0.66 (0.52, 0.85) | 0.001 | 0.68 (0.53, 0.87) | 0.003 | |
| 2019 vs. 2020 | 0.79 (0.62, 1.02) | 0.076 | 0.84 (0.65, 1.09) | 0.191 | |
| No lifetime drug use | 2016 vs. 2017 | 1.24 (1.00, 1.55) | 0.055 | 1.08 (0.85, 1.36) | 0.528 |
| 2016 vs. 2019 | 1.50 (1.20, 1.87) | 0.000 | 1.40 (1.11, 1.76) | 0.005 | |
| 2016 vs. 2020 | 1.16 (0.94, 1.44) | 0.155 | 1.10 (0.88, 1.37) | 0.399 | |
| 2017 vs. 2019 | 1.21 (0.93, 1.57) | 0.164 | 1.30 (0.99, 1.70) | 0.063 | |
| 2017 vs. 2020 | 0.94 (0.73, 1.21) | 0.615 | 1.02 (0.78, 1.33) | 0.879 | |
| 2019 vs. 2020 | 0.78 (0.60, 1.00) | 0.051 | 0.79 (0.60, 1.03) | 0.076 | |
| Meeting sleep recommendations | 2016 vs. 2017 | 0.87 (0.69, 1.10) | 0.240 | 0.89 (0.70, 1.13) | 0.333 |
| 2016 vs. 2019 | 0.62 (0.48, 0.81) | 0.000 | 0.63 (0.48, 0.82) | 0.001 | |
| 2016 vs. 2020 | 0.87 (0.70, 1.09) | 0.222 | 0.89 (0.71, 1.13) | 0.345 | |
| 2017 vs. 2019 | 0.72 (0.53, 0.98) | 0.034 | 0.71 (0.52, 0.96) | 0.028 | |
| 2017 vs. 2020 | 1.00 (0.76, 1.32) | 0.982 | 1.01 (0.76, 1.33) | 0.952 | |
| 2019 vs. 2020 | 1.40 (1.04, 1.88) | 0.026 | 1.43 (1.06, 1.93) | 0.020 | |
| Low–moderate risk on Kessler scale | 2016 vs. 2017 | 1.92 (1.55, 2.38) | 0.000 | 1.91 (1.52, 2.38) | 0.000 |
| 2016 vs. 2019 | 2.12 (1.70, 2.64) | 0.000 | 2.12 (1.69, 2.66) | 0.000 | |
| 2016 vs. 2020 | 2.24 (1.83, 2.74) | 0.000 | 2.31 (1.86, 2.86) | 0.000 | |
| 2017 vs. 2019 | 1.10 (0.85, 1.43) | 0.467 | 1.11 (0.85, 1.45) | 0.434 | |
| 2017 vs. 2020 | 1.17 (0.91, 1.49) | 0.226 | 1.21 (0.94, 1.56) | 0.138 | |
| 2019 vs. 2020 | 1.06 (0.82, 1.36) | 0.661 | 1.09 (0.84, 1.41) | 0.513 |
Disclaimer/Publisher’s Note: The statements, opinions and data contained in all publications are solely those of the individual author(s) and contributor(s) and not of MDPI and/or the editor(s). MDPI and/or the editor(s) disclaim responsibility for any injury to people or property resulting from any ideas, methods, instructions or products referred to in the content. |
© 2024 by the authors. Licensee MDPI, Basel, Switzerland. This article is an open access article distributed under the terms and conditions of the Creative Commons Attribution (CC BY) license (https://creativecommons.org/licenses/by/4.0/).
Share and Cite
Knapp, A.; Burrows, T.; Whatnall, M.; Leigh, L.; Leask, S.; Hutchesson, M. Trends in Health-Risk Behaviors and Psychological Distress among Australian First-Year University Students. Int. J. Environ. Res. Public Health 2024, 21, 620. https://doi.org/10.3390/ijerph21050620
Knapp A, Burrows T, Whatnall M, Leigh L, Leask S, Hutchesson M. Trends in Health-Risk Behaviors and Psychological Distress among Australian First-Year University Students. International Journal of Environmental Research and Public Health. 2024; 21(5):620. https://doi.org/10.3390/ijerph21050620
Chicago/Turabian StyleKnapp, Alison, Tracy Burrows, Megan Whatnall, Lucy Leigh, Sarah Leask, and Melinda Hutchesson. 2024. "Trends in Health-Risk Behaviors and Psychological Distress among Australian First-Year University Students" International Journal of Environmental Research and Public Health 21, no. 5: 620. https://doi.org/10.3390/ijerph21050620
APA StyleKnapp, A., Burrows, T., Whatnall, M., Leigh, L., Leask, S., & Hutchesson, M. (2024). Trends in Health-Risk Behaviors and Psychological Distress among Australian First-Year University Students. International Journal of Environmental Research and Public Health, 21(5), 620. https://doi.org/10.3390/ijerph21050620