
Retrospective Analyses of COVID-19 and Population Ageing Effects on Italian Mortality during the Pandemic


Abstract
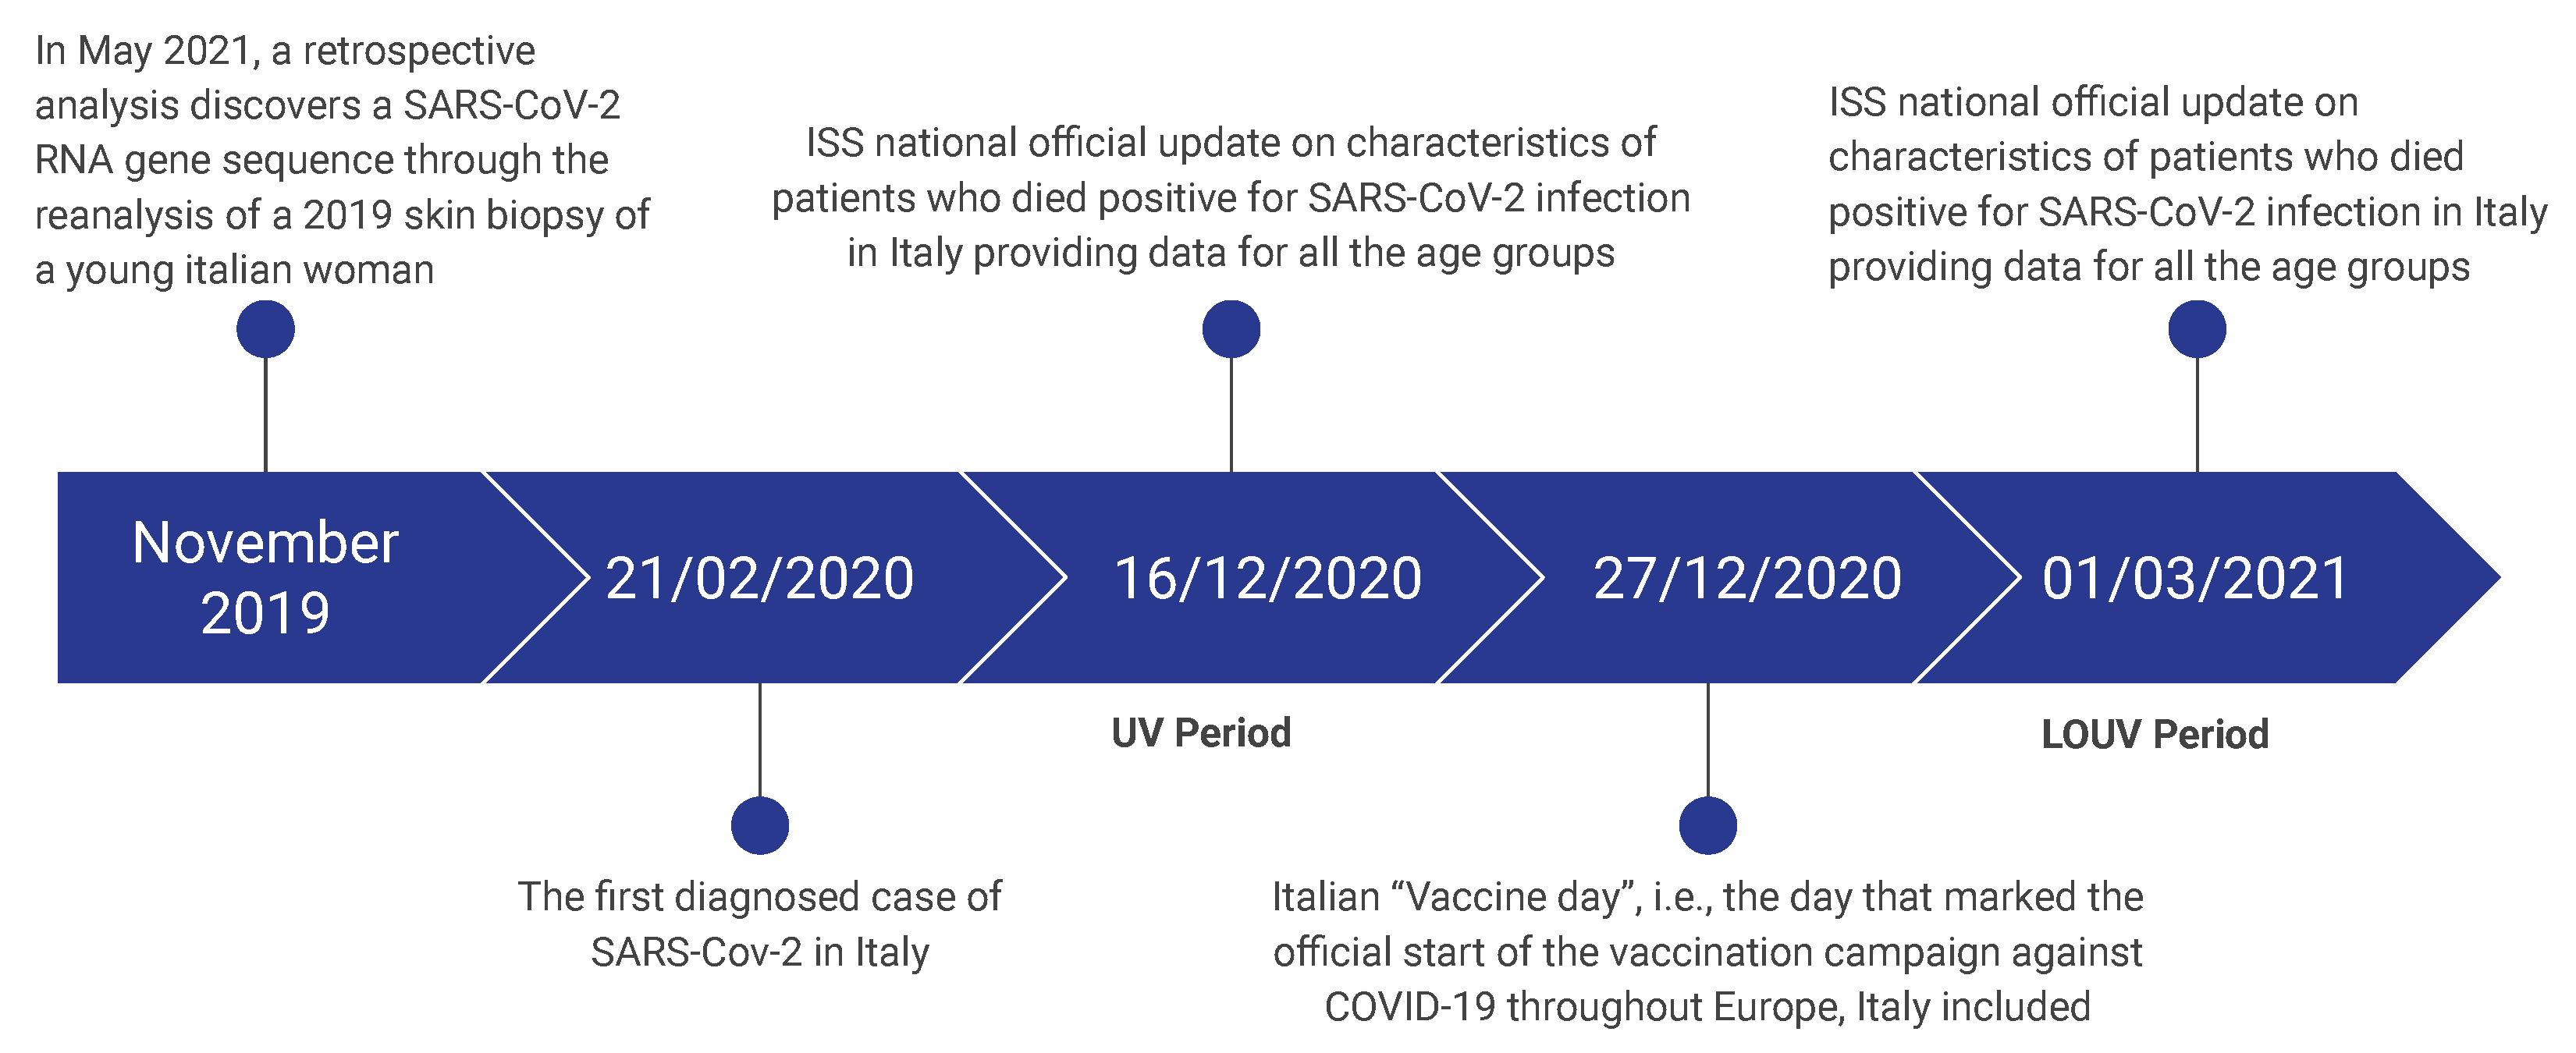
:1. Introduction
2. Retrospective Analyses
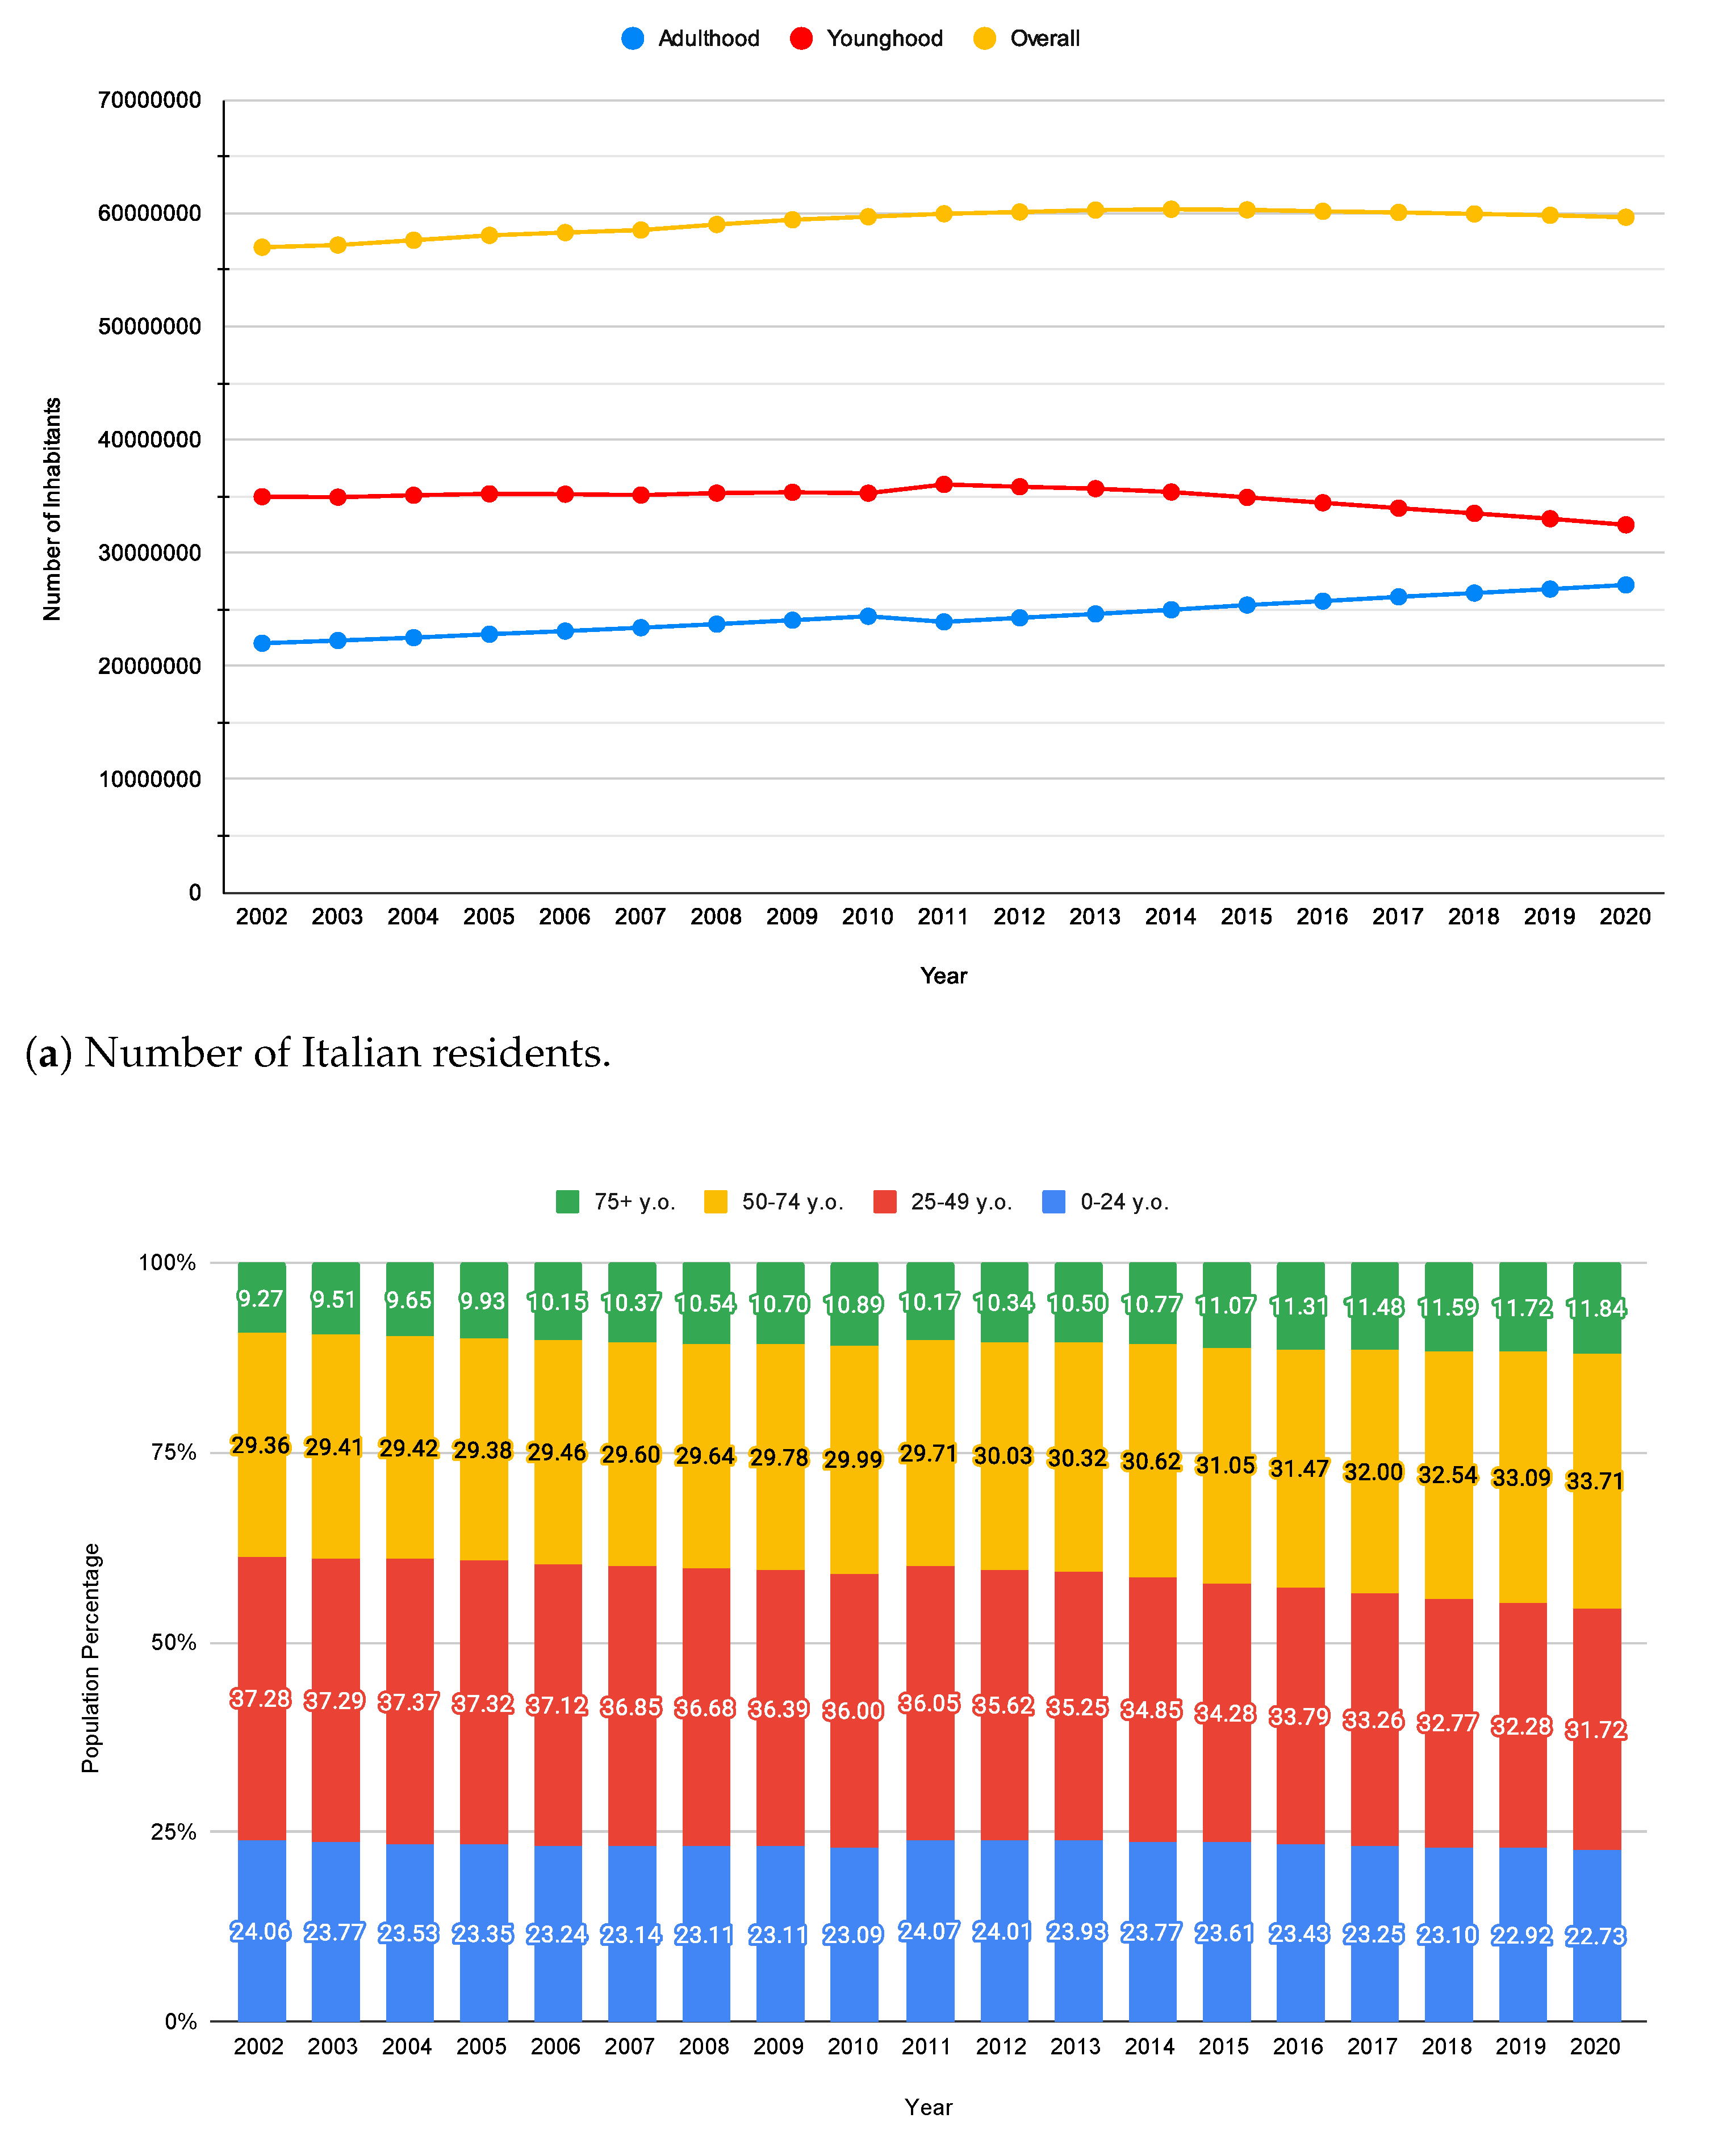
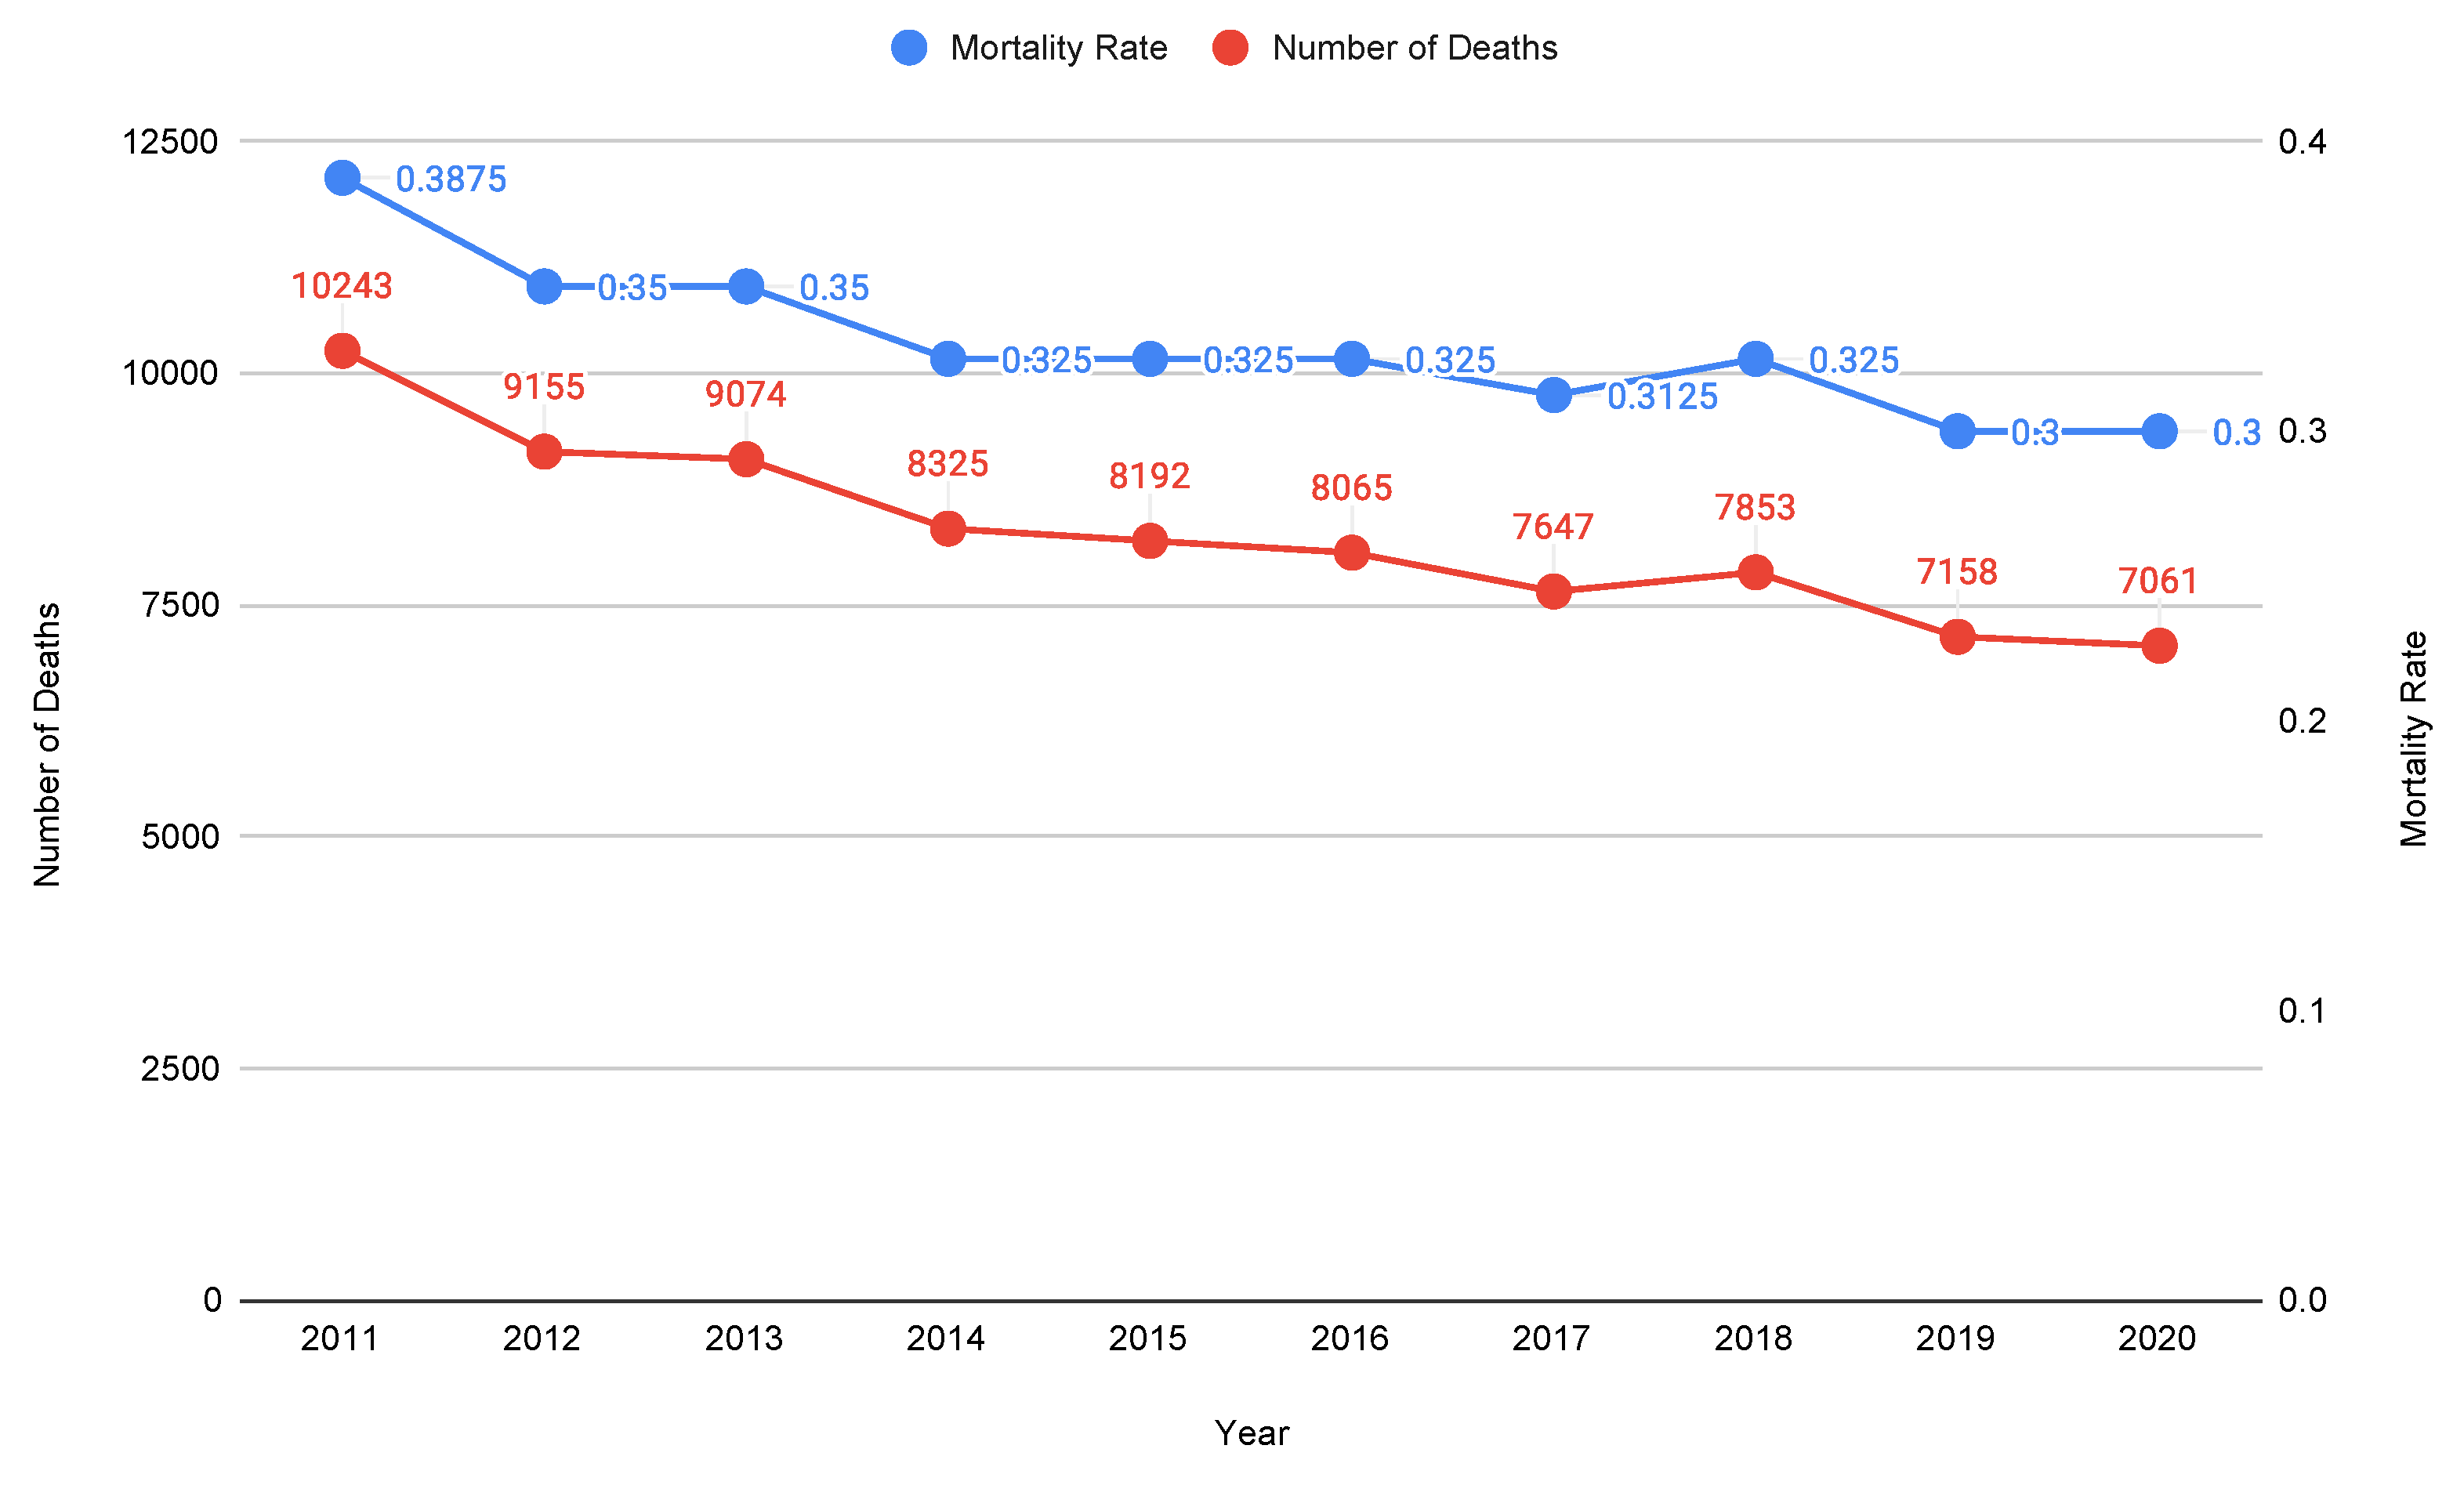
- Italian MRs and population structure by age groups. Since the impact of COVID-19 was extremely different in terms of deaths among younger and elderly people, we mainly focus on adulthood (i.e., where the pandemic hit hard), trying to figure out how hard it was compared to what happened during previous years 2011–2019. Thus, we examine the effect of the ageing population through the variations that occurred in both the population percentages and the MRs for the same age groups and in the same period. For what concerns younger people, whose mortality did not increase during the pandemic, we contextualize COVID-19 mortality in a broader framework where other causes of death are considered.
- Italian population responsiveness. Two parallel simulations are carried out to assess the responsiveness of the Italian population to different MRs.
2.1. Italian MRs and Population Structure by Age Groups
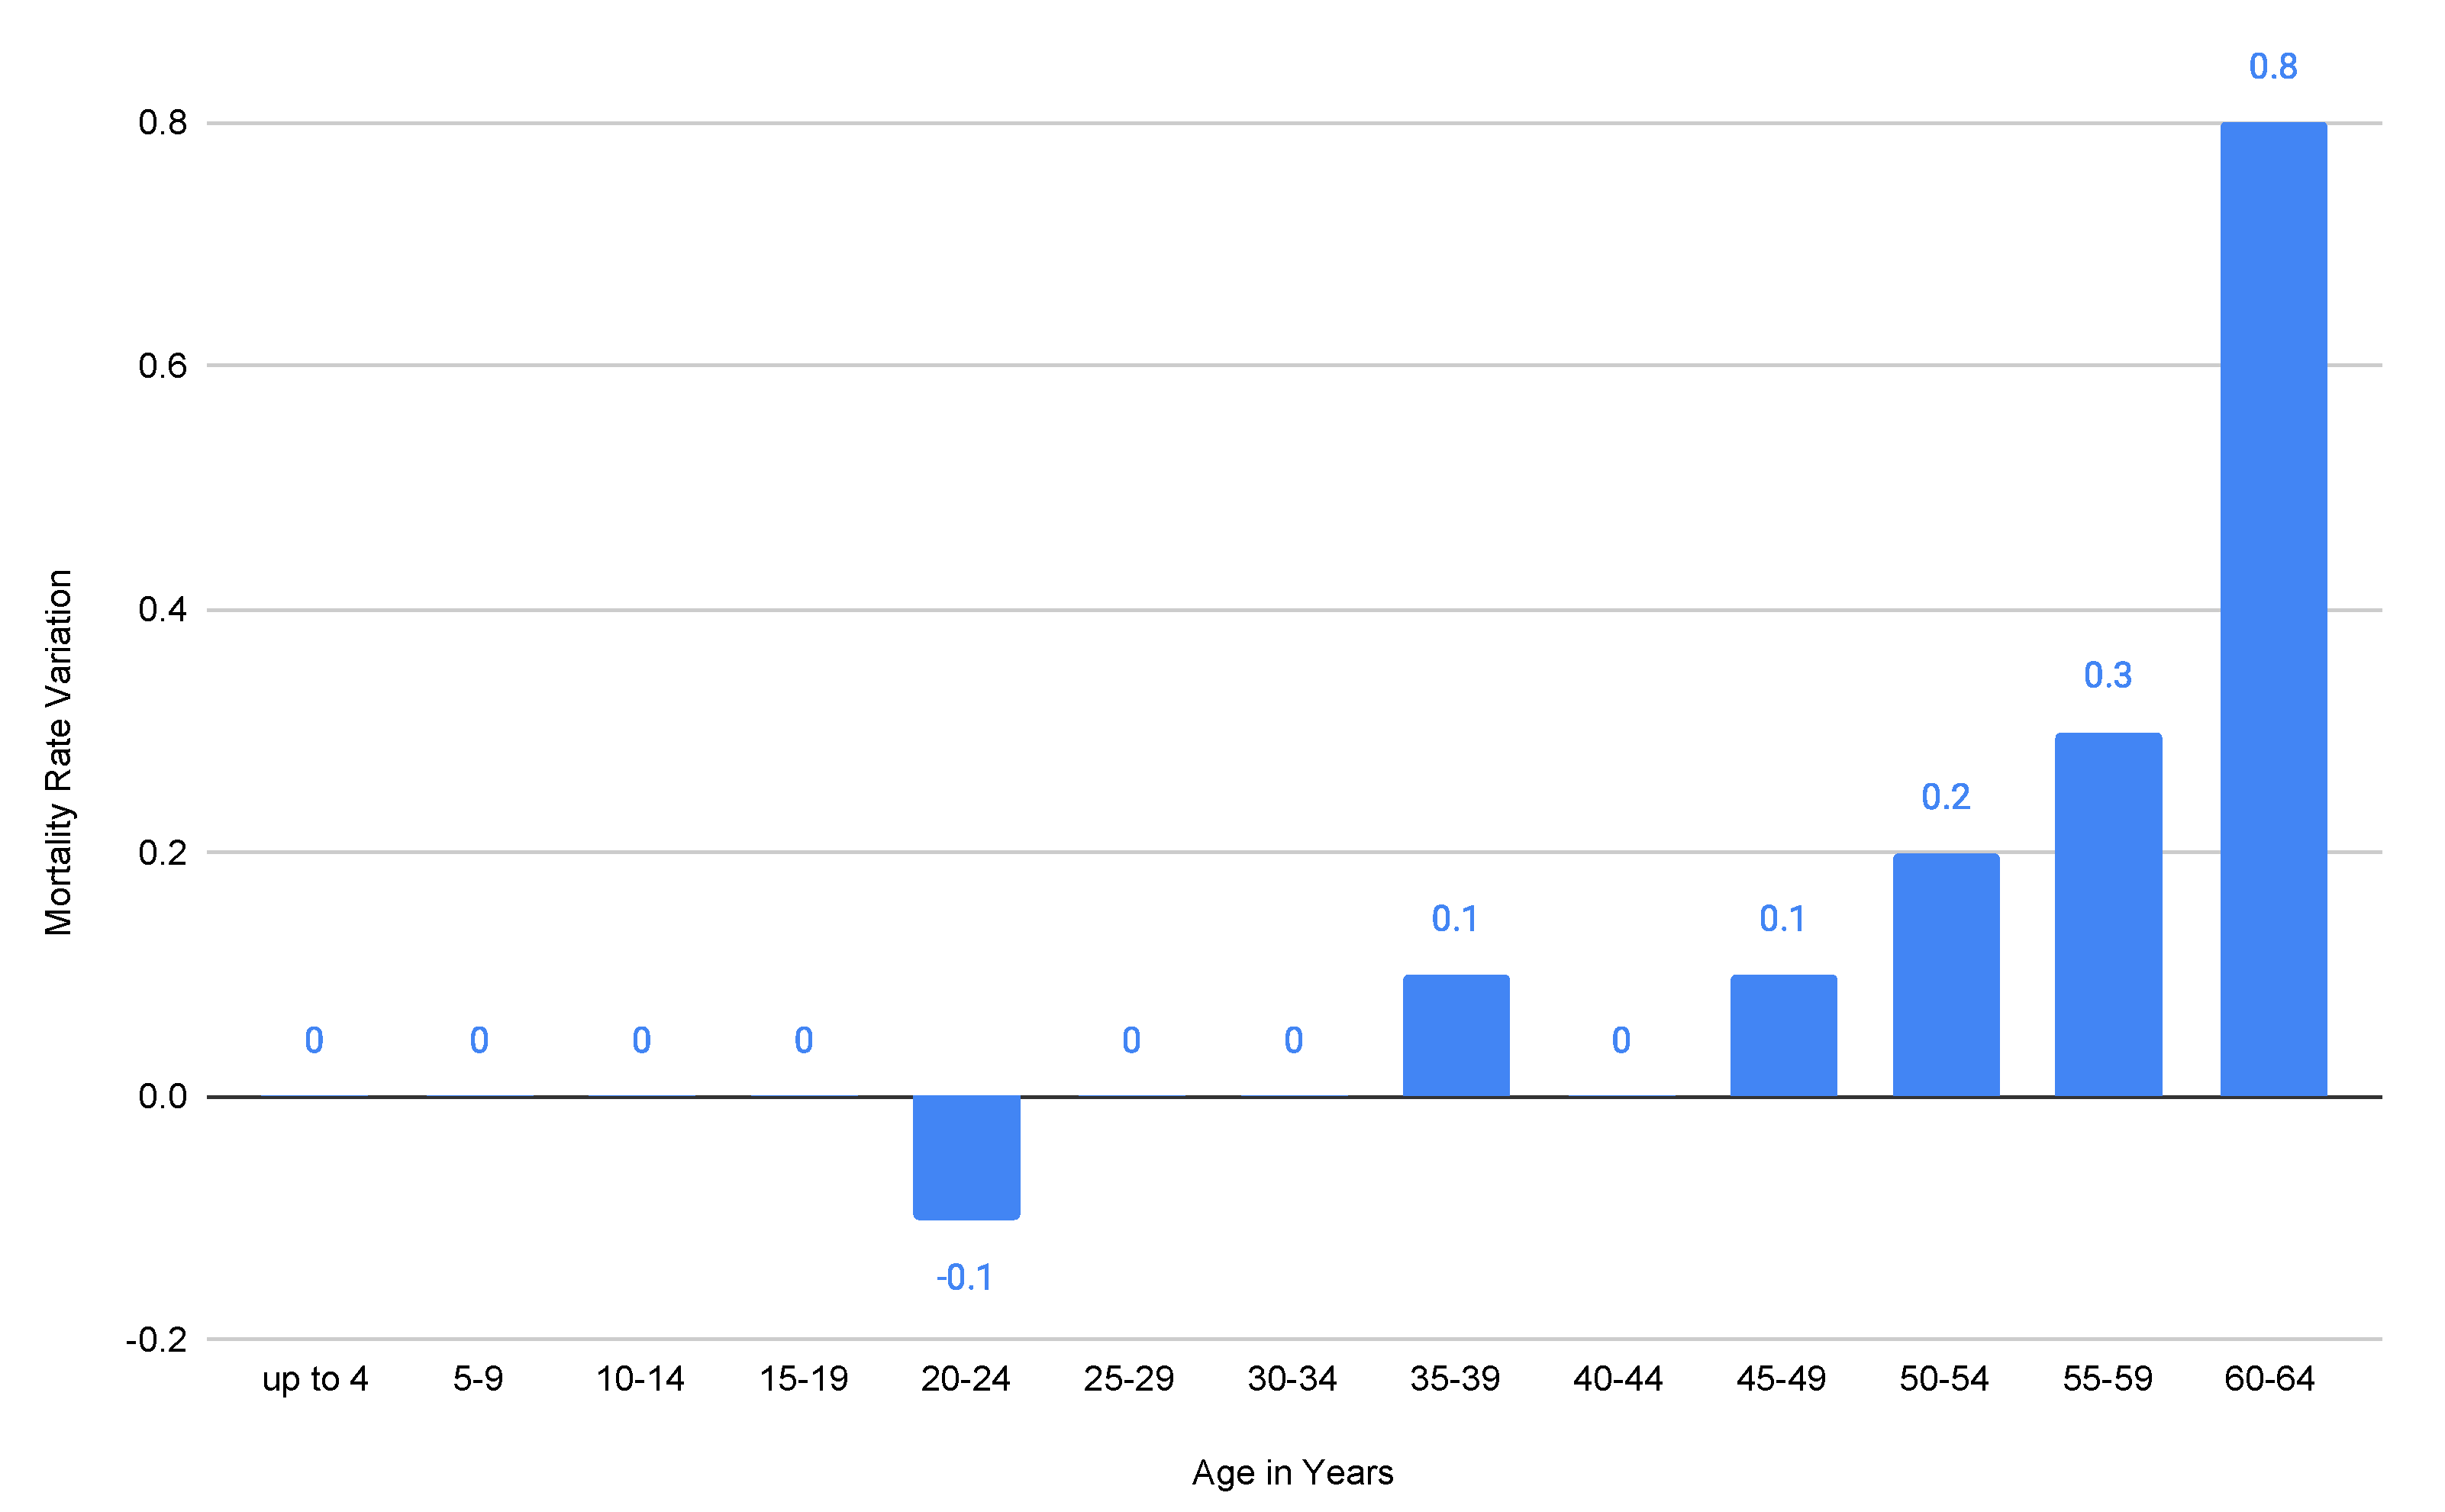
- Zero impact on mortality for people aged 0–4, 5–9, 10–14, 15–19, 25–29, 20–34, and 40–44 years old (notice also that the COVID-19 lethality for people aged 0–39 years old is so low that in March 2021, ISS reported a value equal to 0 associated with it [13]);
- A negligible impact (−0.1 mortality variation, i.e., fewer deaths, in 2019–2020) on the mortality for people aged 20–24 years old;
- An irrelevant impact (+0.1 mortality variation, i.e., more deaths, in 2019–2020) on the mortality for people aged 35–39 and 45–49 years old;
- An increasing impact on mortality for people aged 50+ years old, but still not significant for those aged 50–54 years old and 55–59 years old (respectively, +0.2 and +0.3 mortality variation in 2019–2020).
2.1.1. Adulthood
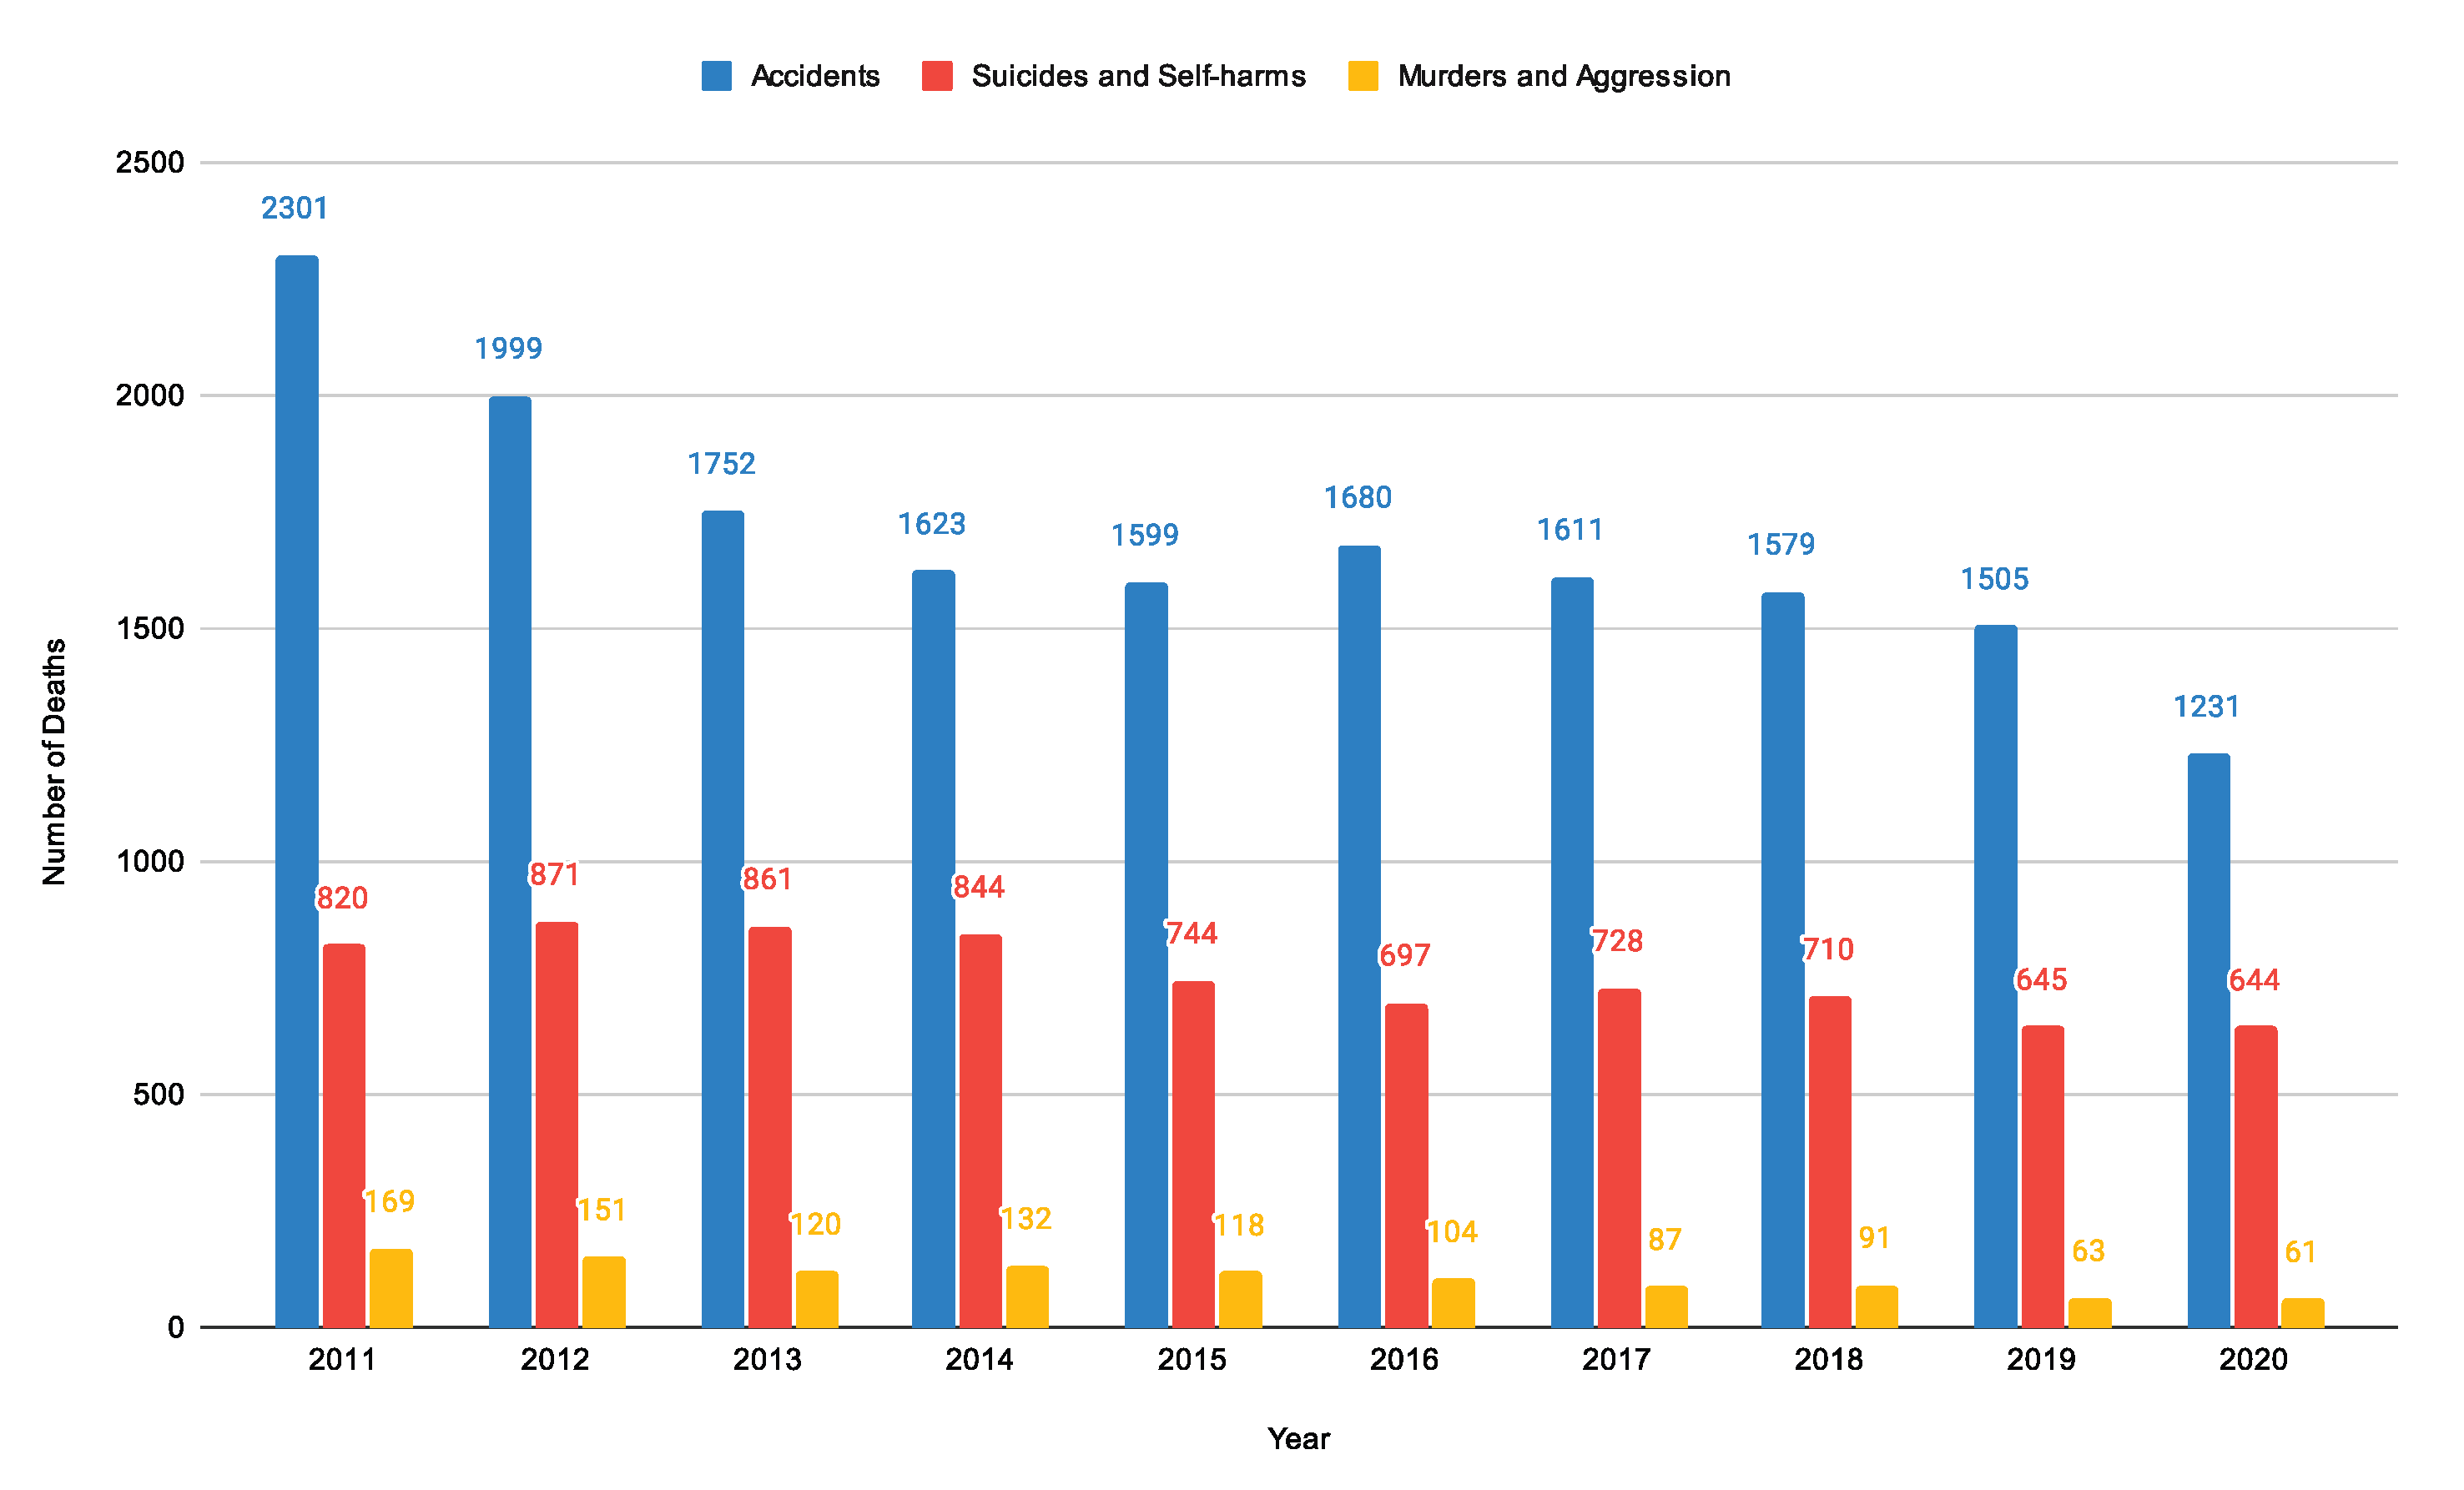
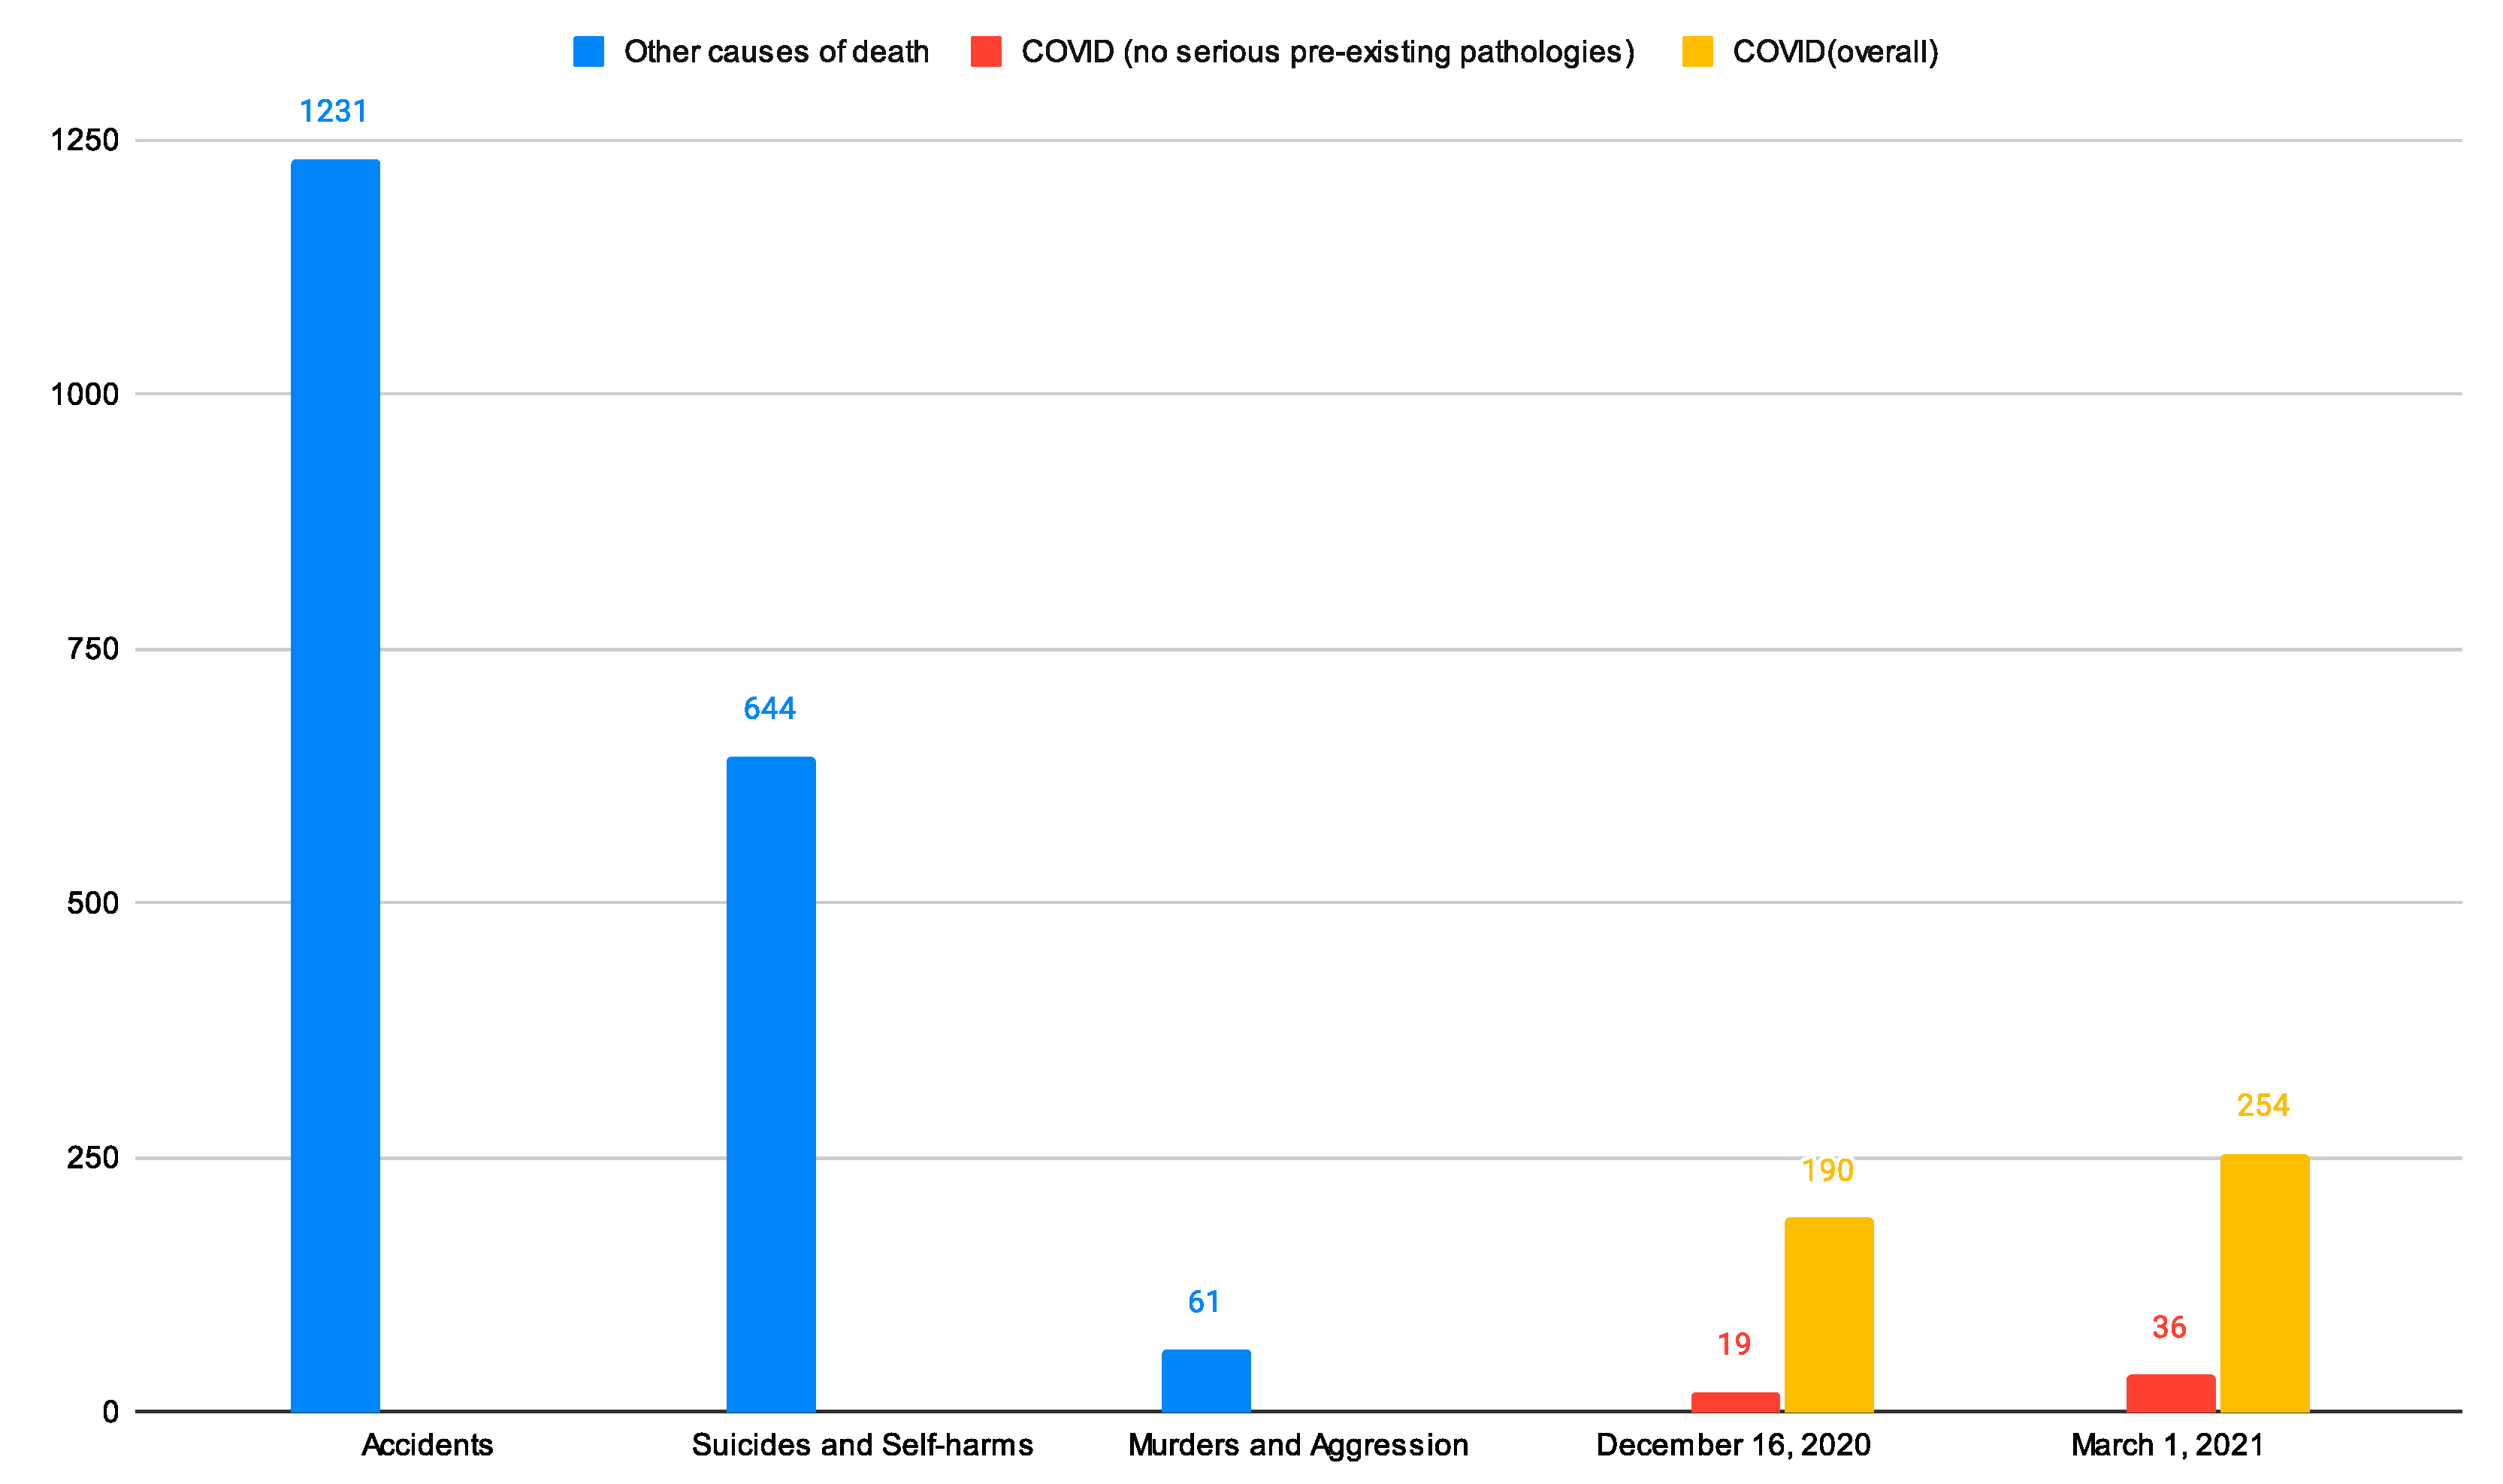
2.1.2. Younghood
2.2. Italian Population Responsiveness
- What would have happened if COVID-19 had spread before 2020 in Italy, hitting an overall younger population?
- What would have happened in Italy if the past populations structured as in 2020 had faced the past yearly MRs?
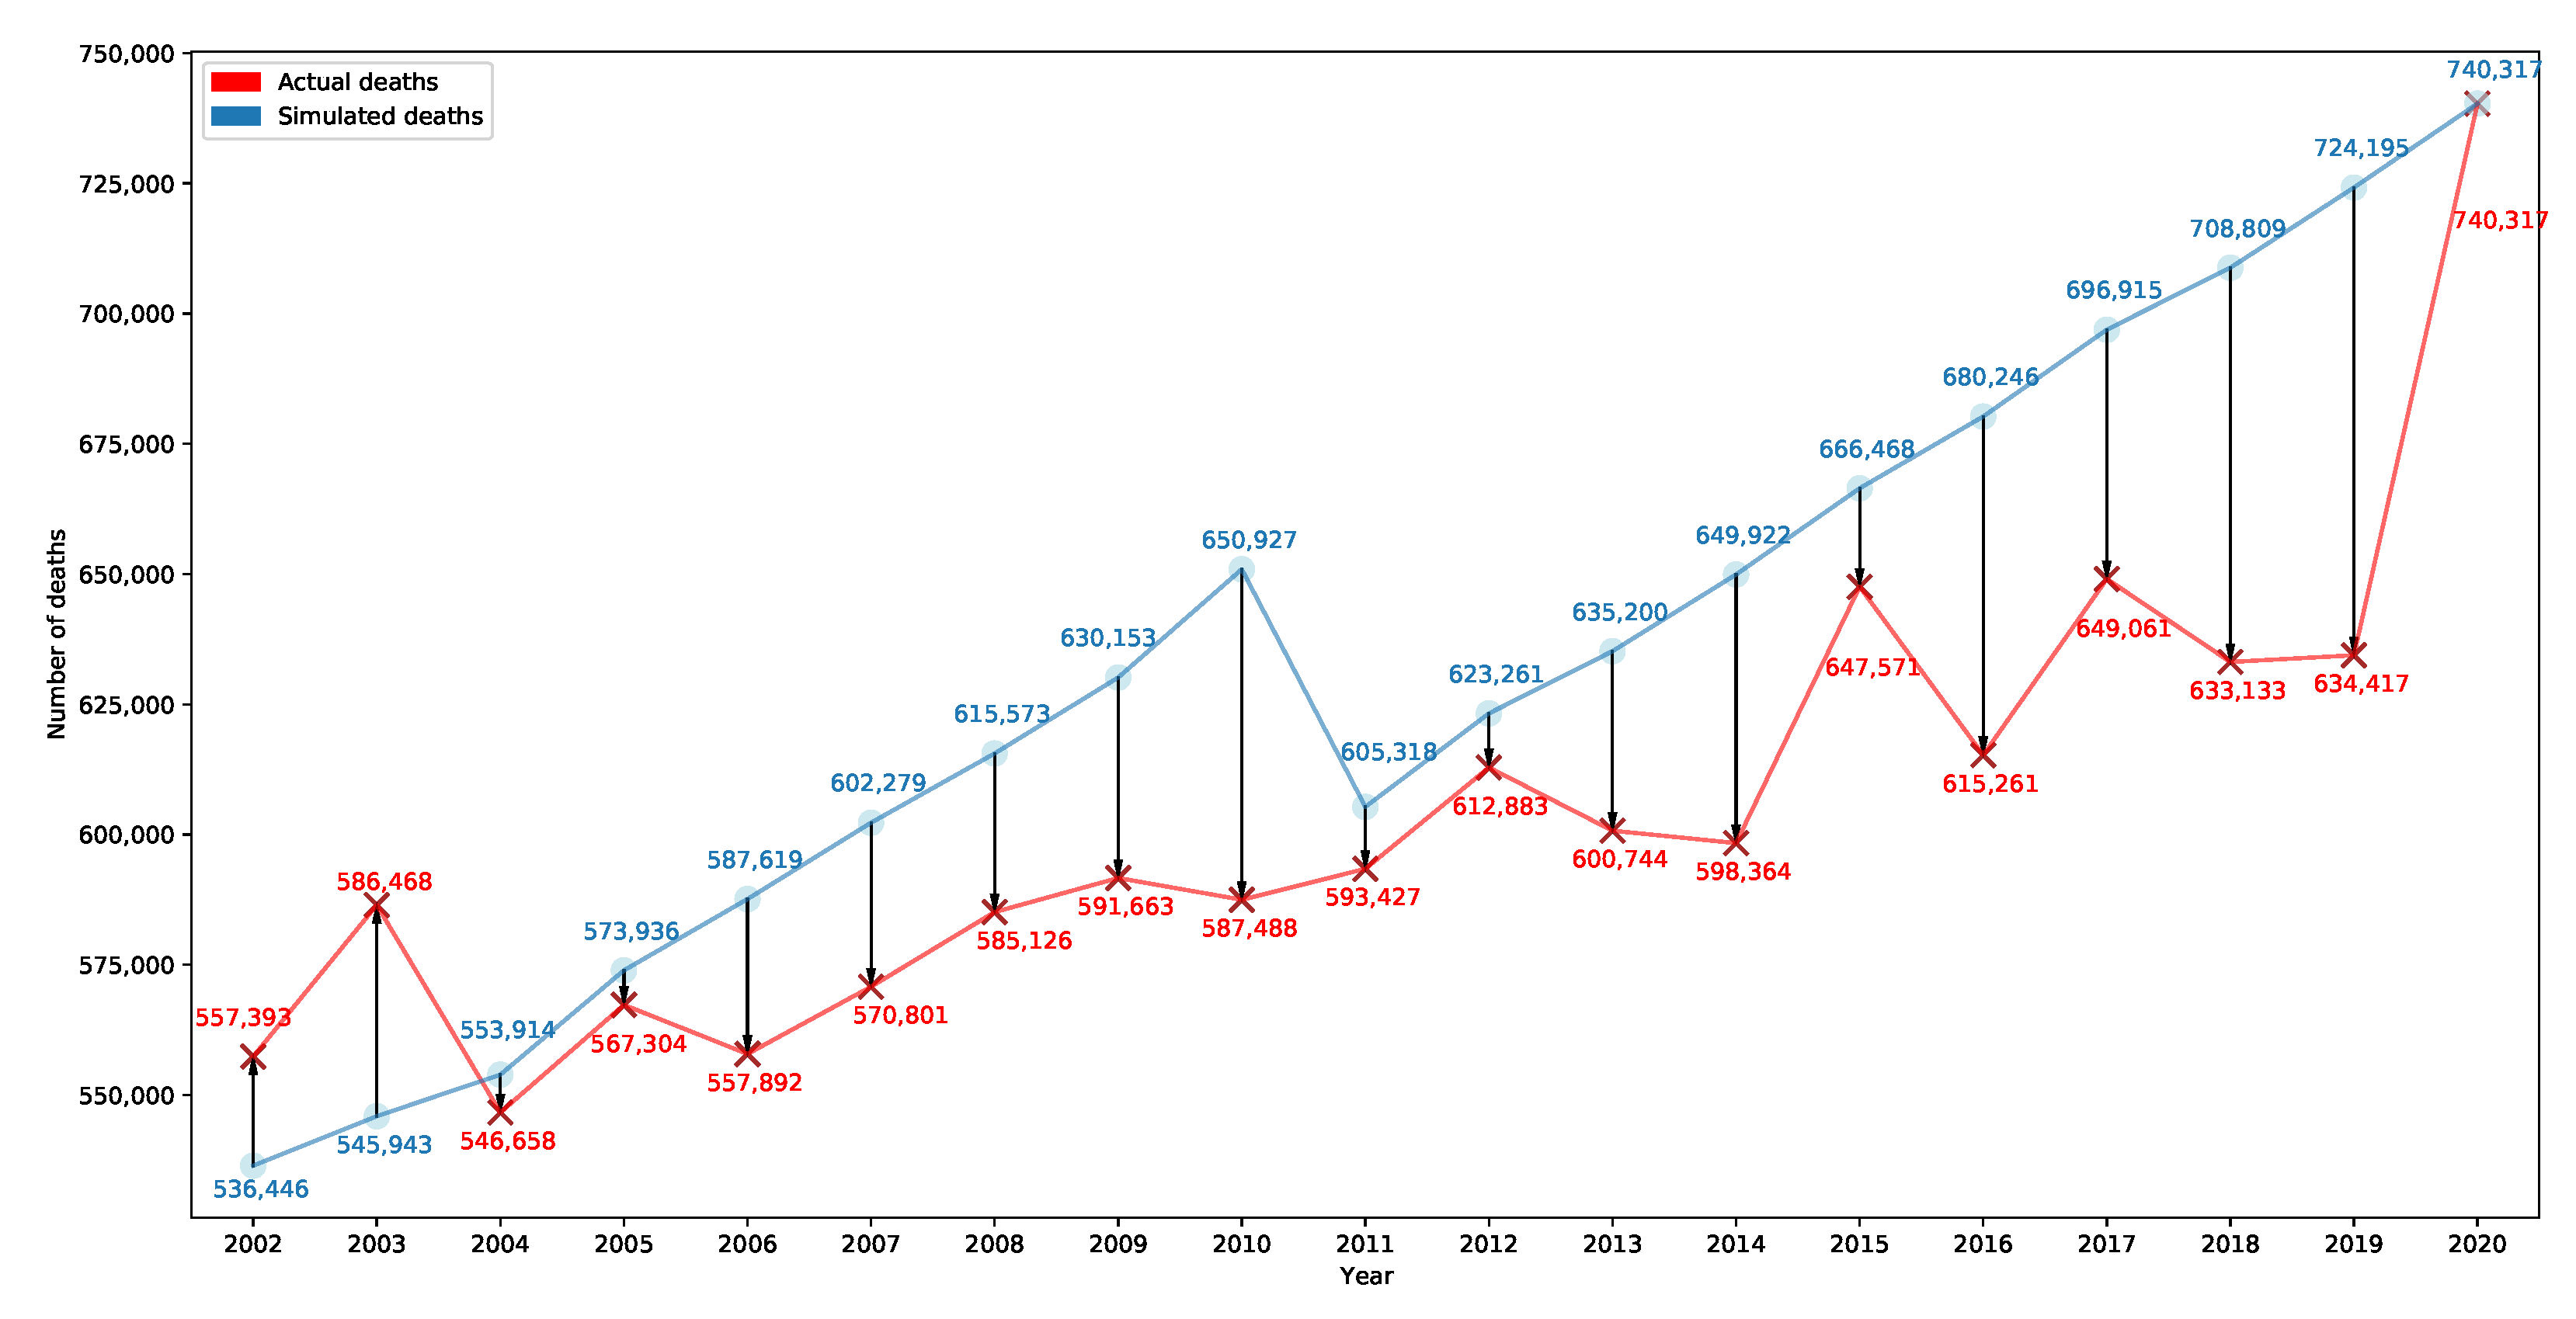
2.2.1. Question 1: Past Populations Facing the 2020 MRs
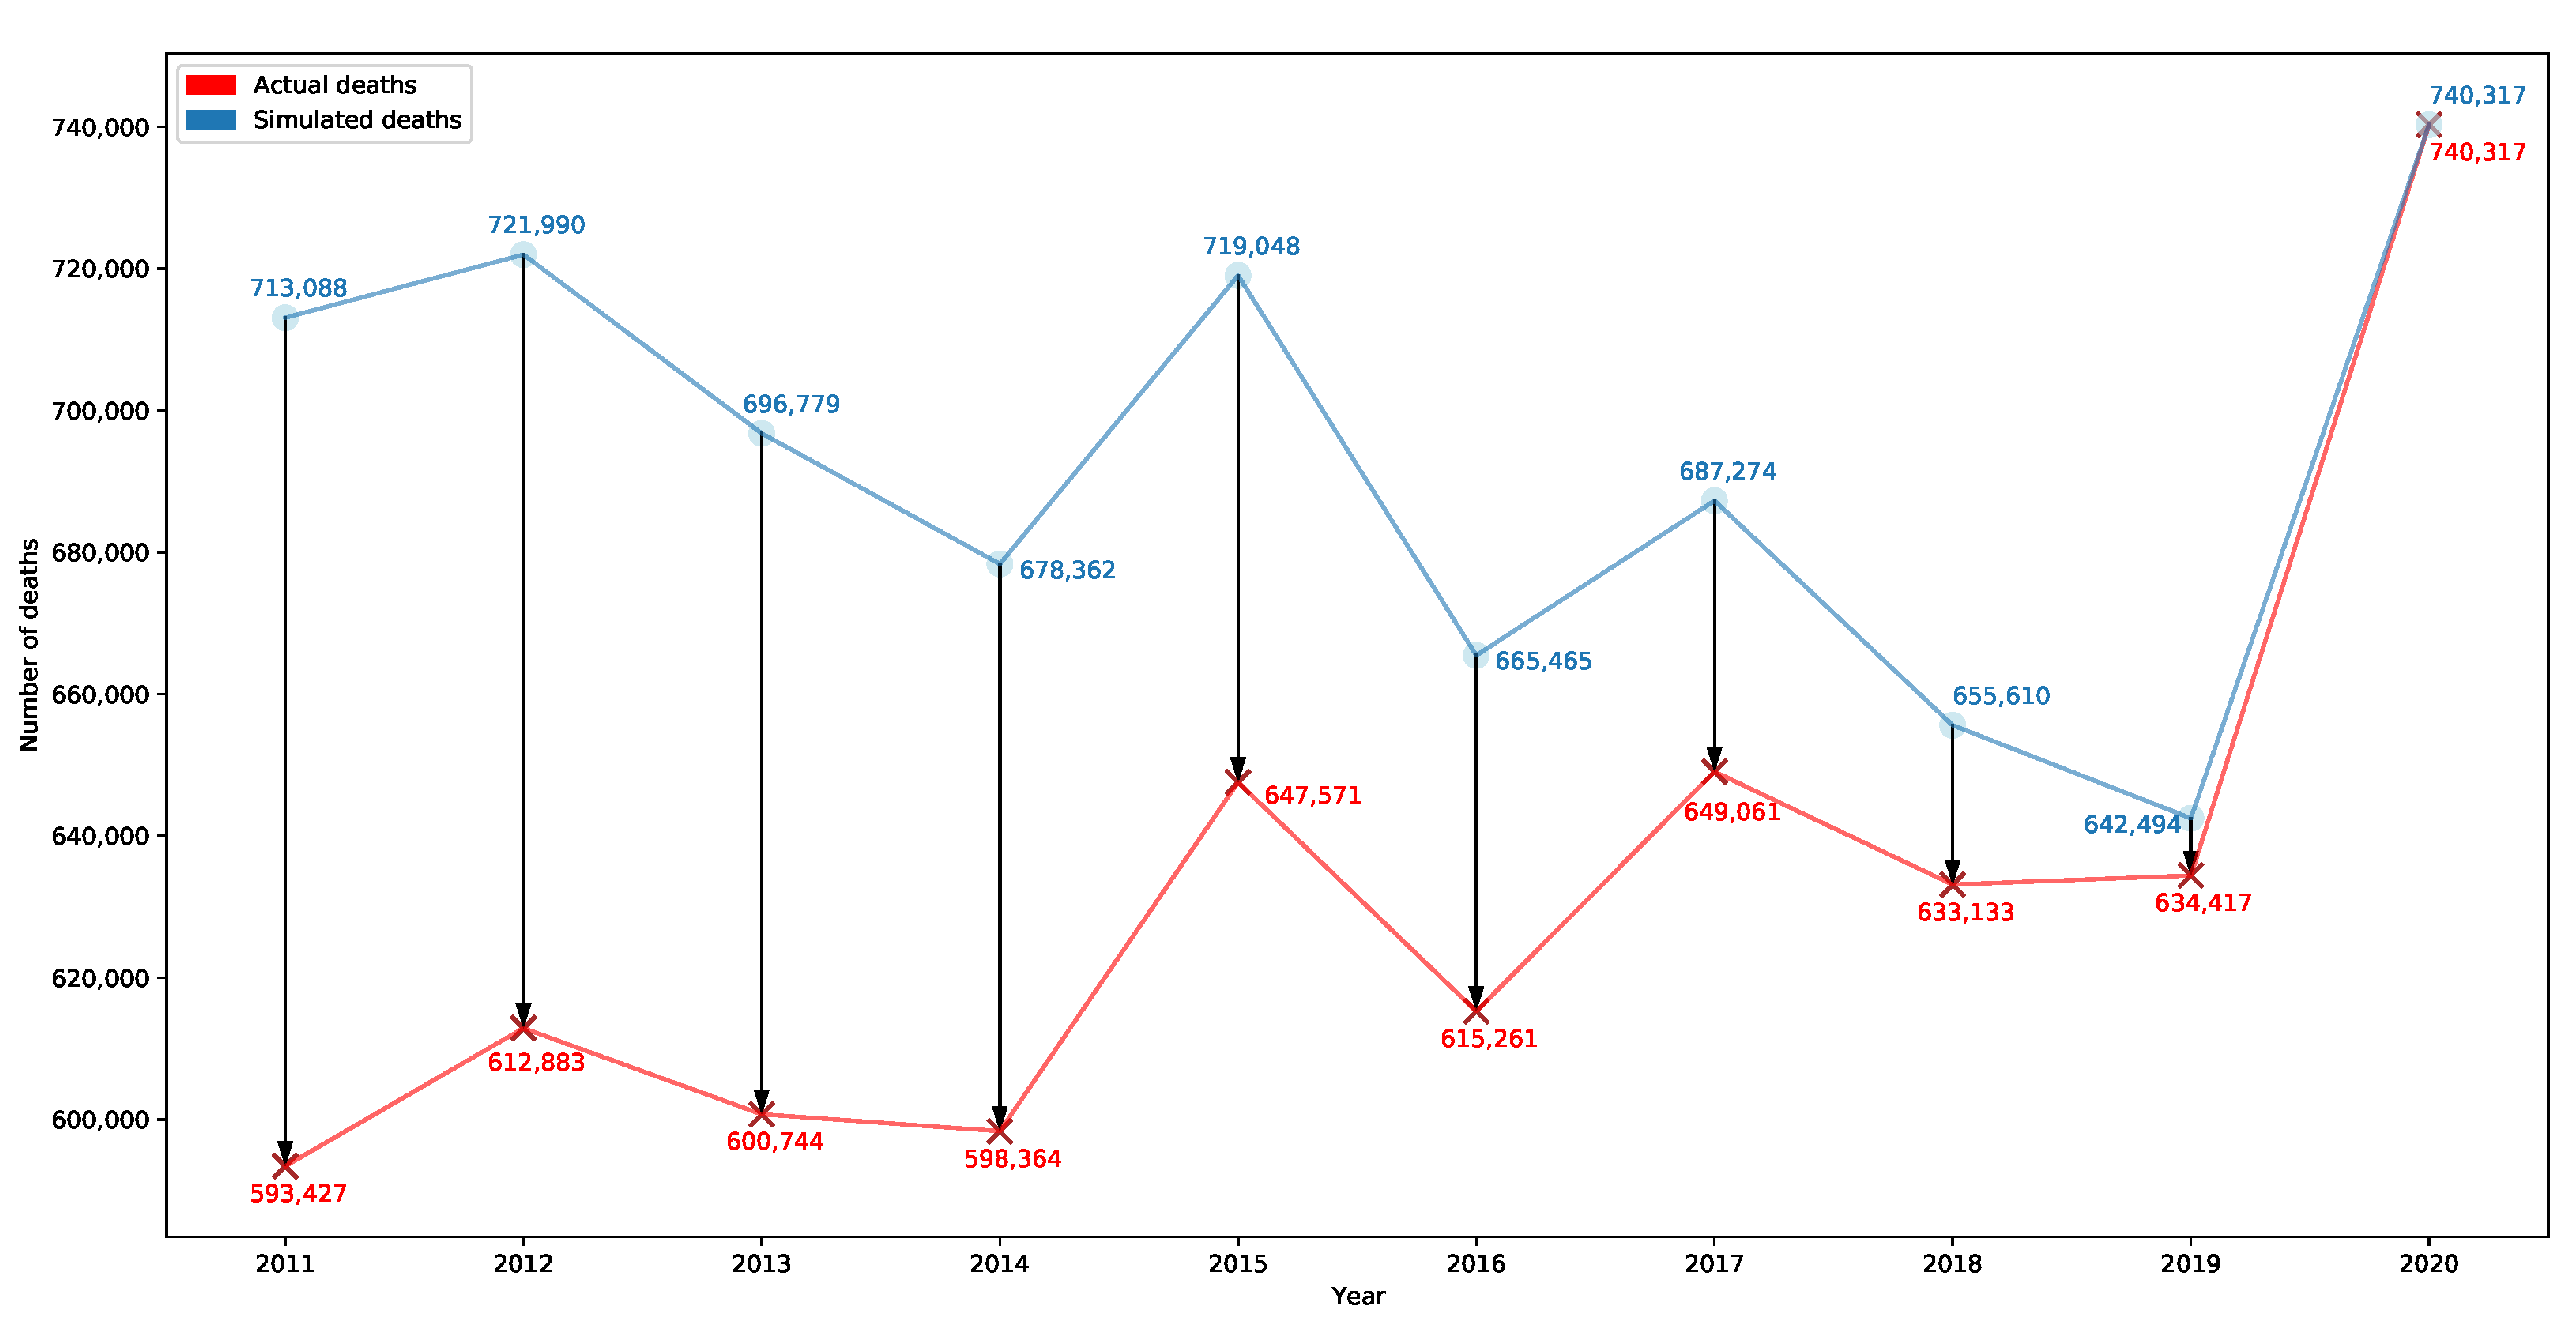
2.2.2. Question 2: Past MRs Applied to Populations Structured as in 2020
3. Discussion
3.1. Limitations and Future Work
3.2. General Considerations
4. Conclusions
Author Contributions
Funding
Data Availability Statement
Conflicts of Interest
Abbreviations
| LOUV | Limited Or Unavailable Vaccines |
| ICD-10 | International Classification of Diseases 10th Revision |
| IQR | InterQuartile Range |
| ISS | Istituto Superiore di Sanità (Italian National Institute of Health) |
| ISTAT | Istituto nazionale di STATistica (Italian National Institute of Statistics) |
| ND | Number of Deaths |
| NPP | No Pre-existing Pathologies |
| O | Overall |
| UV | Unavailable Vaccines |
| y.o. | Years Old |
Appendix A
Appendix A.1
Appendix A.2
Appendix A.3

References
- Confermato Caso Italiano: A Milano Situazione Simile a Quella della Germania. Adottate le Misure tra più Restrittive Previste in Caso di Focolaio Epidemico—ISS. Available online: https://www.iss.it/coronavirus/-/asset_publisher/1SRKHcCJJQ7E/content/id/5269517 (accessed on 1 April 2023).
- Gianotti, R.; Barberis, M.; Fellegara, G.; Galván-Casas, C.; Gianotti, E. COVID-19-related dermatosis in November 2019: Could this case be Italy’s patient zero? Br. J. Dermatol. 2021, 184, 970–971. [Google Scholar] [CrossRef] [PubMed]
- Piano Nazionale di Vaccinazione COVID-19. Available online: https://www.epicentro.iss.it/vaccini/covid-19-piano-vaccinazione (accessed on 1 April 2023).
- Coronavirus in Italia, i dati e la Mappa. Available online: https://lab24.ilsole24ore.com/coronavirus/?refresh_ce (accessed on 1 April 2023).
- Mi Intubano ma Non Voglio: Le Ultime Parole di Cristopher Mansilla, Ciclista Morto di COVID. Available online: https://www.fanpage.it/sport/ciclismo/mi-intubano-ma-non-voglio-le-ultime-parole-di-cristopher-mansilla-ciclista-morto-di-covid/ (accessed on 1 April 2023).
- Coronavirus Oggi. Muore di COVID a Roma Bimba di 2 anni, dalla Calabria in Condizioni Disperate—Il Sole 24 ORE. Available online: https://www.ilsole24ore.com/art/regno-unito-via-vaccinazioni-bambini-rischio-AE6wu8AB (accessed on 1 April 2023).
- Marziano, V.; Guzzetta, G.; Rondinone, B.M.; Boccuni, F.; Riccardo, F.; Bella, A.; Poletti, P.; Trentini, F.; Pezzotti, P.; Brusaferro, S.; et al. Retrospective analysis of the Italian exit strategy from COVID-19 lockdown. Proc. Natl. Acad. Sci. USA 2021, 118, e2019617118. [Google Scholar] [CrossRef] [PubMed]
- Fochesato, A.; Simoni, G.; Reali, F.; Giordano, G.; Domenici, E.; Marchetti, L. A Retrospective Analysis of the COVID-19 Pandemic Evolution in Italy. Biology 2021, 4, 311. [Google Scholar] [CrossRef] [PubMed]
- Rovetta, A.; Bhagavathula, A.S. The Impact of COVID-19 on Mortality in Italy: Retrospective Analysis of Epidemiological Trends. JMIR Public Health Surveill. 2022, 8, e36022. [Google Scholar] [CrossRef] [PubMed]
- Heligman, L.; Pollard, J.H. The age pattern of mortality. J. Inst. Actuar. 1980, 107, 49–80. Available online: http://www.jstor.org/stable/41140508 (accessed on 28 April 2023). [CrossRef]
- Tavole di Mortalità: Singole età. Available online: http://dati.istat.it/Index.aspx?QueryId=19053 (accessed on 31 December 2022).
- Mortalità per Territorio di Residenza. Available online: http://dati.istat.it/Index.aspx?DataSetCode=DCIS_CMORTE1_RES (accessed on 7 March 2023).
- Epidemia COVID-19. Available online: https://www.epicentro.iss.it/coronavirus/bollettino/Bollettino-sorveglianza-integrata-COVID-19_31-marzo-2021.pdf (accessed on 1 April 2023).
- Report-_ISS_Istat__5-marzo-2021_en.pdf. Available online: https://www.istat.it/it/files//2021/03/Report-_ISS_Istat__5-marzo-2021_en.pdf (accessed on 1 April 2023).
- De Natale, G.; Ricciardi, V.; De Luca, G.; De Natale, D.; Di Meglio, G.; Ferragamo, A.; Marchitelli, V.; Piccolo, A.; Scala, A.; Somma, R.; et al. The COVID-19 Infection in Italy: A Statistical Study of an Abnormally Severe Disease. J. Clin. Med. 2020, 9, 1564. [Google Scholar] [CrossRef] [PubMed]
- Aumento di Mortalità nel 2015? Prudenza Nell’interpretazione. Available online: https://www.epicentro.iss.it/mortalita/EccessoMortalita2015 (accessed on 20 May 2023).
- Presentazione Standard di PowerPoint. Available online: https://www.epicentro.iss.it/coronavirus/bollettino/Report-COVID-2019_1_marzo_2021.pdf (accessed on 1 April 2023).
- Presentazione Standard di PowerPoint. Available online: https://www.epicentro.iss.it/coronavirus/bollettino/Report-COVID-2019_16_dicembre.pdf (accessed on 1 April 2023).
- Epidemia COVID-19. Available online: https://www.epicentro.iss.it/coronavirus/bollettino/Bollettino-sorveglianza-integrata-COVID-19_3-marzo-2021.pdf (accessed on 1 April 2023).
- Popolazione Residente. Available online: https://demo.istat.it/app/?l=it&a=2020&i=POS (accessed on 1 January 2023).
- Ricostruzione della Popolazione 2002–2019. Available online: https://demo.istat.it/app/?i=RIC (accessed on 1 January 2023).
- Popolazione Italia (2001–2021) Grafici su dati ISTAT. Available online: https://www.tuttitalia.it/statistiche/popolazione-andamento-demografico/ (accessed on 1 January 2023).
- Tavole di Mortalità. Available online: http://dati.istat.it/Index.aspx?DataSetCode=DCIS_MORTALITA1# (accessed on 31 December 2022).
- Influenza Archivio 2015. Available online: https://www.epicentro.iss.it/influenza/2015 (accessed on 1 April 2023).
- C04.pdf. Available online: https://www.istat.it/it/files//2020/12/C04.pdf (accessed on 1 April 2023).
- Doerre, A.; Doblhammer, G. The influence of gender on COVID-19 infections and mortality in Germany: Insights from age- and gender-specific modeling of contact rates, infections, and deaths in the early phase of the pandemic. PLoS ONE 2022, 17, e0268119. [Google Scholar] [CrossRef] [PubMed]
- Bourdrel, T.; Annesi-Maesano, I.; Alahmad, B.; Maesano, C.N.; Bind, M.A. The impact of outdoor air pollution on COVID-19: A review of evidence from in vitro, animal, and human studies. Eur. Respir. Rev. 2021, 30, 200242. [Google Scholar] [CrossRef] [PubMed]
- Cegolon, L.; Pichierri, J.; Mastrangelo, G.; Cinquetti, S.; Sotgiu, G.; Bellizzi, S.; Pichierri, G. Hypothesis to explain the severe form of COVID-19 in Northern Italy. BMJ Glob. Health 2020, 5, 6. [Google Scholar] [CrossRef]
- codifica-delle-cause-di-morte-ICD10-2016.pdf. Available online: https://www.istat.it/it/files//2018/10/codifica-delle-cause-di-morte-ICD10-2016.pdf (accessed on 21 July 2023).
- Iss, Brusaferro: «La Fascia d’età più Colpita è Quella tra i 20 e 30 Anni. Aumentano i Casi tra i Bambini»—Il Video—Open. Available online: https://www.open.online/2021/12/03/covid-19-monitoraggio-iss-3-dicembre/ (accessed on 1 April 2023).
- COVID, 14enne Morto a Modena. Ricoverato a Marzo con Sintomi Gravi: Non Aveva Patologie Pregresse—Il Fatto Quotidiano. Available online: https://www.ilfattoquotidiano.it/2021/06/17/covid-14enne-morto-a-modena-ricoverato-a-marzo-con-sintomi-gravi-non-aveva-patologie-pregresse/6233836/ (accessed on 1 April 2023).
- COVID. Morto Giovane non Vaccinato di Terracina, D’Amato: “Virus Colpisce Duramente Anche i Giovani”—Quotidiano Sanità. Available online: https://www.quotidianosanita.it/lazio/articolo.php?articolo_id=101669 (accessed on 1 April 2023).
- Draghi gela Salvini, è Tensione sui Vaccini—Politica—ANSA. Available online: https://www.ansa.it/sito/notizie/politica/2021/07/22/draghi-gela-salvini-e-tensione-sui-vaccini_193fe53f-f34b-4913-8218-82d3e4de6f5e.html (accessed on 1 April 2023).


| Mortality Rate | ||||||||||
|---|---|---|---|---|---|---|---|---|---|---|
| 2011 | 2012 | 2013 | 2014 | 2015 | 2016 | 2017 | 2018 | 2019 | 2020 | 2021 |
| 9.9 | 10.2 | 10 | 9.9 | 10.8 | 10.2 | 10.8 | 10.6 | 10.6 | 12.5 | 11.9 |
| Mortality Rate | ||||||
|---|---|---|---|---|---|---|
| Age Group | 11–19 | 11–19 | 11–19 | 11–19 - | 2020 - | 2020 |
| 50–54 | 2.5 | (2.3, 2.7) | (2.1, 2.9) | 0.0 | 2.5 | |
| 55–59 | 4 | (3.7, 4.3) | (3.6, 4.4) | 0.0 | 4 | |
| 60–64 | 6.4 | (5.9, 6.8) | (5.35, 7.35) | 0.94 | 6.7 | |
| 65–69 | 10.4 | (9.4, 10.9) | (9.4, 11) | 1.43 | 10.9 | |
| 70–74 | 17 | (15.4, 17.4) | (14.95, 18.55) | 2.41 | 18.3 | |
| 75–79 | 19.3 | (27.2, 31) | (24.65, 32.25) | 2.31 | 32.1 | |
| 80–84 | 54 | (49.8, 58.4) | (45.55, 63.55) | 1.31 | 58.3 | |
| 85–89 | 104.9 | (98.8, 110.2) | (88.7, 119.9) | 2.18 | 113.5 | |
| 90–94 | 184.8 | (181.8, 199.6) | (176.1, 197.7) | 3.75 | 209.7 | |
| 95+ | 330.2 | (314.7, 358.5) | (292.65, 360.25) | 1.93 | 358.1 | |
| Non-COVID-19 Illness (Event) | COVID-19 | |
|---|---|---|
| O | NPP | |
| External causes of injury and poisoning | 7.67 | 54.14 |
| Tumours | 6.15 | 43.39 |
| Accidents | 4.85 | 34.19 |
| Suicides and self-harms | 2.54 | 17.89 |
| Symptoms, signs, abnormal findings, and ill-defined causes | 2.24 | 15.78 |
| Congenital malformations and chromosomal abnormalities | 1.54 | 10.86 |
| Murders and aggression | 0.24 | 1.69 |
| Number of Deaths | |||||
|---|---|---|---|---|---|
| First Cause of Death | 11–19 | 11–19 | 11–19 | 11–19 | 2020 |
| Symptoms, signs, abnormal results and ill-defined causes | 12,490.4 ± 1793.3 | 12,541 | (9984, 15,116) | (6413, 18,597) | 24,709 |
| Unknown and unspecified causes | 2271 ± 375.9 | 2210 | (1838, 2884) | (934, 3654) | 9569 |
Disclaimer/Publisher’s Note: The statements, opinions and data contained in all publications are solely those of the individual author(s) and contributor(s) and not of MDPI and/or the editor(s). MDPI and/or the editor(s) disclaim responsibility for any injury to people or property resulting from any ideas, methods, instructions or products referred to in the content. |
© 2023 by the authors. Licensee MDPI, Basel, Switzerland. This article is an open access article distributed under the terms and conditions of the Creative Commons Attribution (CC BY) license (https://creativecommons.org/licenses/by/4.0/).
Share and Cite
Brunori, D.; Frajese, G.V.; Sarno, E. Retrospective Analyses of COVID-19 and Population Ageing Effects on Italian Mortality during the Pandemic. Int. J. Environ. Res. Public Health 2023, 20, 6481. https://doi.org/10.3390/ijerph20156481
Brunori D, Frajese GV, Sarno E. Retrospective Analyses of COVID-19 and Population Ageing Effects on Italian Mortality during the Pandemic. International Journal of Environmental Research and Public Health. 2023; 20(15):6481. https://doi.org/10.3390/ijerph20156481
Chicago/Turabian StyleBrunori, Damiano, Giovanni Vanni Frajese, and Emma Sarno. 2023. "Retrospective Analyses of COVID-19 and Population Ageing Effects on Italian Mortality during the Pandemic" International Journal of Environmental Research and Public Health 20, no. 15: 6481. https://doi.org/10.3390/ijerph20156481
APA StyleBrunori, D., Frajese, G. V., & Sarno, E. (2023). Retrospective Analyses of COVID-19 and Population Ageing Effects on Italian Mortality during the Pandemic. International Journal of Environmental Research and Public Health, 20(15), 6481. https://doi.org/10.3390/ijerph20156481