Article

Environmental Regulation, Rural Residents’ Health Investment, and Agricultural Eco-Efficiency: An Empirical Analysis Based on 31 Chinese Provinces

1
College of Management, Sichuan Agricultural University, Chengdu 611130, China
2
Biogas Institute of Ministry of Agriculture and Rural Affairs, Chengdu 610041, China
*
Author to whom correspondence should be addressed.
Int. J. Environ. Res. Public Health 2022, 19(5), 3125; https://doi.org/10.3390/ijerph19053125
Submission received: 24 January 2022 / Revised: 3 March 2022 / Accepted: 4 March 2022 / Published: 7 March 2022

Abstract

:
This paper explores the effects of environmental regulation (ER) and rural residents’ health investment (RRHI) on agricultural eco-efficiency (AEE) to provide a reference for the Chinese Government and other developing countries for implementing environmental regulation policies and to provide new paths to further improve green development in agriculture. Using the panel data of 31 Chinese provinces from 2009–2018, the Super-SBM model was used to measure AEE. The role of ER on AEE was analyzed based on panel two-way fixed effects with endogeneity treatment and a robustness test, and this mediating effect analysis was conducted to analyze the role of RRHI in ER and AEE, examining the extent of the effect of ER on AEE in three regions of China—eastern, central and western—using a heterogeneity analysis. The results of the study show that: (1) from a national perspective, ER has a significant positive impact on AEE, showing that ER is effective at this stage; (2) when RRHI is used as a mediating variable, the rising ER’s intensity can promote AEE by increasing RRHI; and (3) the results of the heterogeneity analysis show that ER has the greatest impact on AEE in the economically developed eastern region; the western region with a weaker level of economic development is in second place. However, ER has a negative impact on AEE in the central region with a medium level of economic development. Thus, the impact of ER on AEE will show great differences depending on the stage of economic development.

1. Introduction

Since its reform and opening-up policies, China’s industrialization has accelerated significantly, and its socioeconomic development has reached a new level, but the problem of environmental pollution has become increasingly serious, which severely affects agricultural production [1]. For a long time, in order to solve the problem of subsistence, Chinese farmers have used chemical fertilizers and pesticides in large quantities to improve grain production, but at the same time, the excessive use of chemical fertilizers and pesticides has brought serious damages [2], which led to environmental pollution and a series of soil quality degradation problems [3]. According to the 2019 National Arable Land Quality Grade Bulletin issued by the Chinese Ministry of Agriculture and Rural Development in 2019, more than 20% of China’s arable land is grade 7 to 10; this part of the arable land has a relatively poor basic land quality and significant obstacles to agricultural production, and it is difficult to make fundamental improvements in a short period of time. Additionally, soil pollution caused by excessive heavy metals and the excessive use of chemical fertilizers and pesticides has degraded the quality of arable land to some extent, and the issue of agricultural food safety was once a hot topic of concern for many people. Improving the level opening-up of green agricultural development is the key to solving the problems of resource scarcity and environmental degradation in Chinese agriculture [4]. To actively explore the path of high-yield, ecological and safe agricultural development, the Chinese Ministry of Agriculture and Rural Affairs issued the Action Plan for Zero Growth of Chemical Fertilizer Use by 2020 and the Action Plan for Zero Growth of Pesticide Use by 2020 in 2015 to slow down the excessive input of chemical fertilizers and pesticides, and the Document NO.1 of the Central Government has also proposed for many years that agricultural green development should move in the main direction of the current development of Chinese agriculture.
Agricultural eco-efficiency (AEE) is an important indicator of the level of green agricultural development. In the existing studies on AEE, most scholars take agriculture (plantation) as the research object and the number of chemical fertilizers, pesticides, and agricultural films used in the production process as the main evaluation index of AEE, adopting the life-cycle method, stochastic frontier production function, or a data envelopment analysis to measure AEE as a measure of the level of AEE in a country or region [5,6,7,8]. Similarly, a few scholars evaluated the green production behavior preferences of farmers in typical regions and their influencing factors by establishing an agricultural eco-efficiency index system and conducting field research [4,6,9,10]. This paper intends to measure the level of AEE in each province of China by using rural residential health investment as a mediating variable to observe the mechanisms of action between ER, RRHI and AEE, but it is difficult to obtain real-time data on each farmer’s agricultural production factor inputs by using a micro-survey on a national scale. Instead, AEE aims to measure the number of chemicals, such as chemical fertilizers, pesticides, and agricultural films that produce certain hazards to crops, soil, and food in the production of farmers; the lower the number of inputs, such as chemical fertilizers and their residues, the lower the degree of hazards to the soil, water systems and food, and the higher the degree of AEE. Therefore, macro panel data were used to measure the degree of green production in terms of the residues of fertilizers, pesticides, and agricultural films invested in the production process by farmers and carbon emissions as non-desired outputs.
Environmental regulation (ER) refers to the fact that, because environmental pollution has negative externalities, the Government regulates economic activities by formulating the corresponding policies and measures to achieve the goal of harmonizing environmental protection and economic development. Environmental pollution is a hot spot of international concern, and ER is a favorable measure for the Government to solve the externality harm caused by environmental pollution. Whether ER can effectively promote AEE also becomes key for the accurate implementation of national policies. The impact of ER on the green development of agriculture is an important judgment basis for measuring the effectiveness of government policy implementation and social governance behavior. Rural residents’ health investment (RRHI) refers to rural residents’ investment in health services (e.g., health care and medical services) to cope with their own diseases and major public health events [11], and it is an important way to improve human capital. RRHI also increases or decreases with changes in environmental conditions, and correspondingly, the physical health status of rural residents plays an important role in agricultural production. Therefore, an in-depth analysis of the mechanisms and effects among ER, RRHI and AEE is of great significance for improving rural residents’ health and promoting agricultural production. Current scholarly research hotspots in ER focus on the role of policies in promoting the green development of the economy [12] and the effect on the structural upgrading of manufacturing or industrial industries [13,14,15,16]. Some scholars have also focused on the economic impact of ER in green technology innovation [17,18], ecological improvement [19], and total factor productivity (TFP) [20]. Additionally, in the study of eco-efficiency in the agricultural sector, some scholars focus on the policy combing of ER in agriculture [21], the impact of ER on the green transformation of agriculture [22], and the green production behavior of farmers [23], the agricultural sector and farm eco-efficiency [24,25,26,27]. However, few scholars have studied the mechanism of the impact of ER on AEE under different degrees of economic development, and the mediating role of RRHI in ER and AEE. Therefore, exploring the impact of ER on AEE under different levels of economic development, and whether AEE can be improved by promoting RRHI, is important for the Chinese Government to tailor its policies to local conditions, as well as for rural residents’ livelihood and agricultural sustainable development in various regions of China.
This paper uses macro panel statistics from 2009 to 2018 in 31 provinces of China to analyze the impact and mechanisms of ER and RRHI on AEE and further employs a heterogeneity analysis to evaluate the impact of ER on AEE in different regions of economic development. The possible innovations of this paper are the following. First, this article simultaneously incorporates surface source pollution from fertilizers, pesticides and agricultural films and carbon dioxide emissions that may be generated during agricultural production into the AEE index system to measure AEE from the perspective of carbon emissions, which is not common in the existing relevant literature. Second, on the basis of analyzing whether ER can effectively promote AEE, the mechanism of the role of RRHI in ER on AEE is further explored, so as to discover whether RRHI can act as a mediating variable in it and to provide a more rigorous explanation of the role of ER on AEE. Third, according to its economic development, China is categorized and analyzed according to its economic development status to find out whether ERs have different effects on AEE in different stages of economic development, which will also provide some theoretical basis for the degree of ER implemented to promote AEE in countries or regions in the process of economic development.

2. Research Mechanism and Hypothesis

2.1. The Role of ER on AEE

Any economic activity is a rational activity that maximizes utility under certain institutional constraints, i.e., economic activity is strongly influenced by institutional factors. In agricultural production, environmental regulation (ER) refers to a series of guidance, incentives, and constraint measures taken by the Government to promote farmers’ participation in green production and alleviate rural environmental pollution problems [28]. ER in agriculture contains three dimensions: guided environmental regulation (GER), incentive-based environmental regulation (IBER), and constraint environmental regulations (CER) [29]. Among them, guided environmental regulation (GER) reduces agricultural environmental pollution by guiding farmers to establish green production concepts and technology; IBER usually refers to a series of economic compensation or incentives implemented by the government to motivate farmers to adopt green fertilization behaviors; CER refers to a series of penalty-based policies and measures introduced by the government to restrain farmers’ non-green production behaviors. ER is an important measure to reduce environmental pollution and improve the way of AEE. In general, ER can influence farmers’ perceived benefits through guiding farmers’ perceptions, financial subsidies, and penalties, which can help promote farmers’ adoption of organic fertilizer behaviors and reduce chemical inputs such as fertilizers and pesticides in agricultural production [28], thus promoting AEE. Therefore, this paper proposes the following hypothesis:
Hypothesis 1 (H1).
ER will enhance the level of AEE.

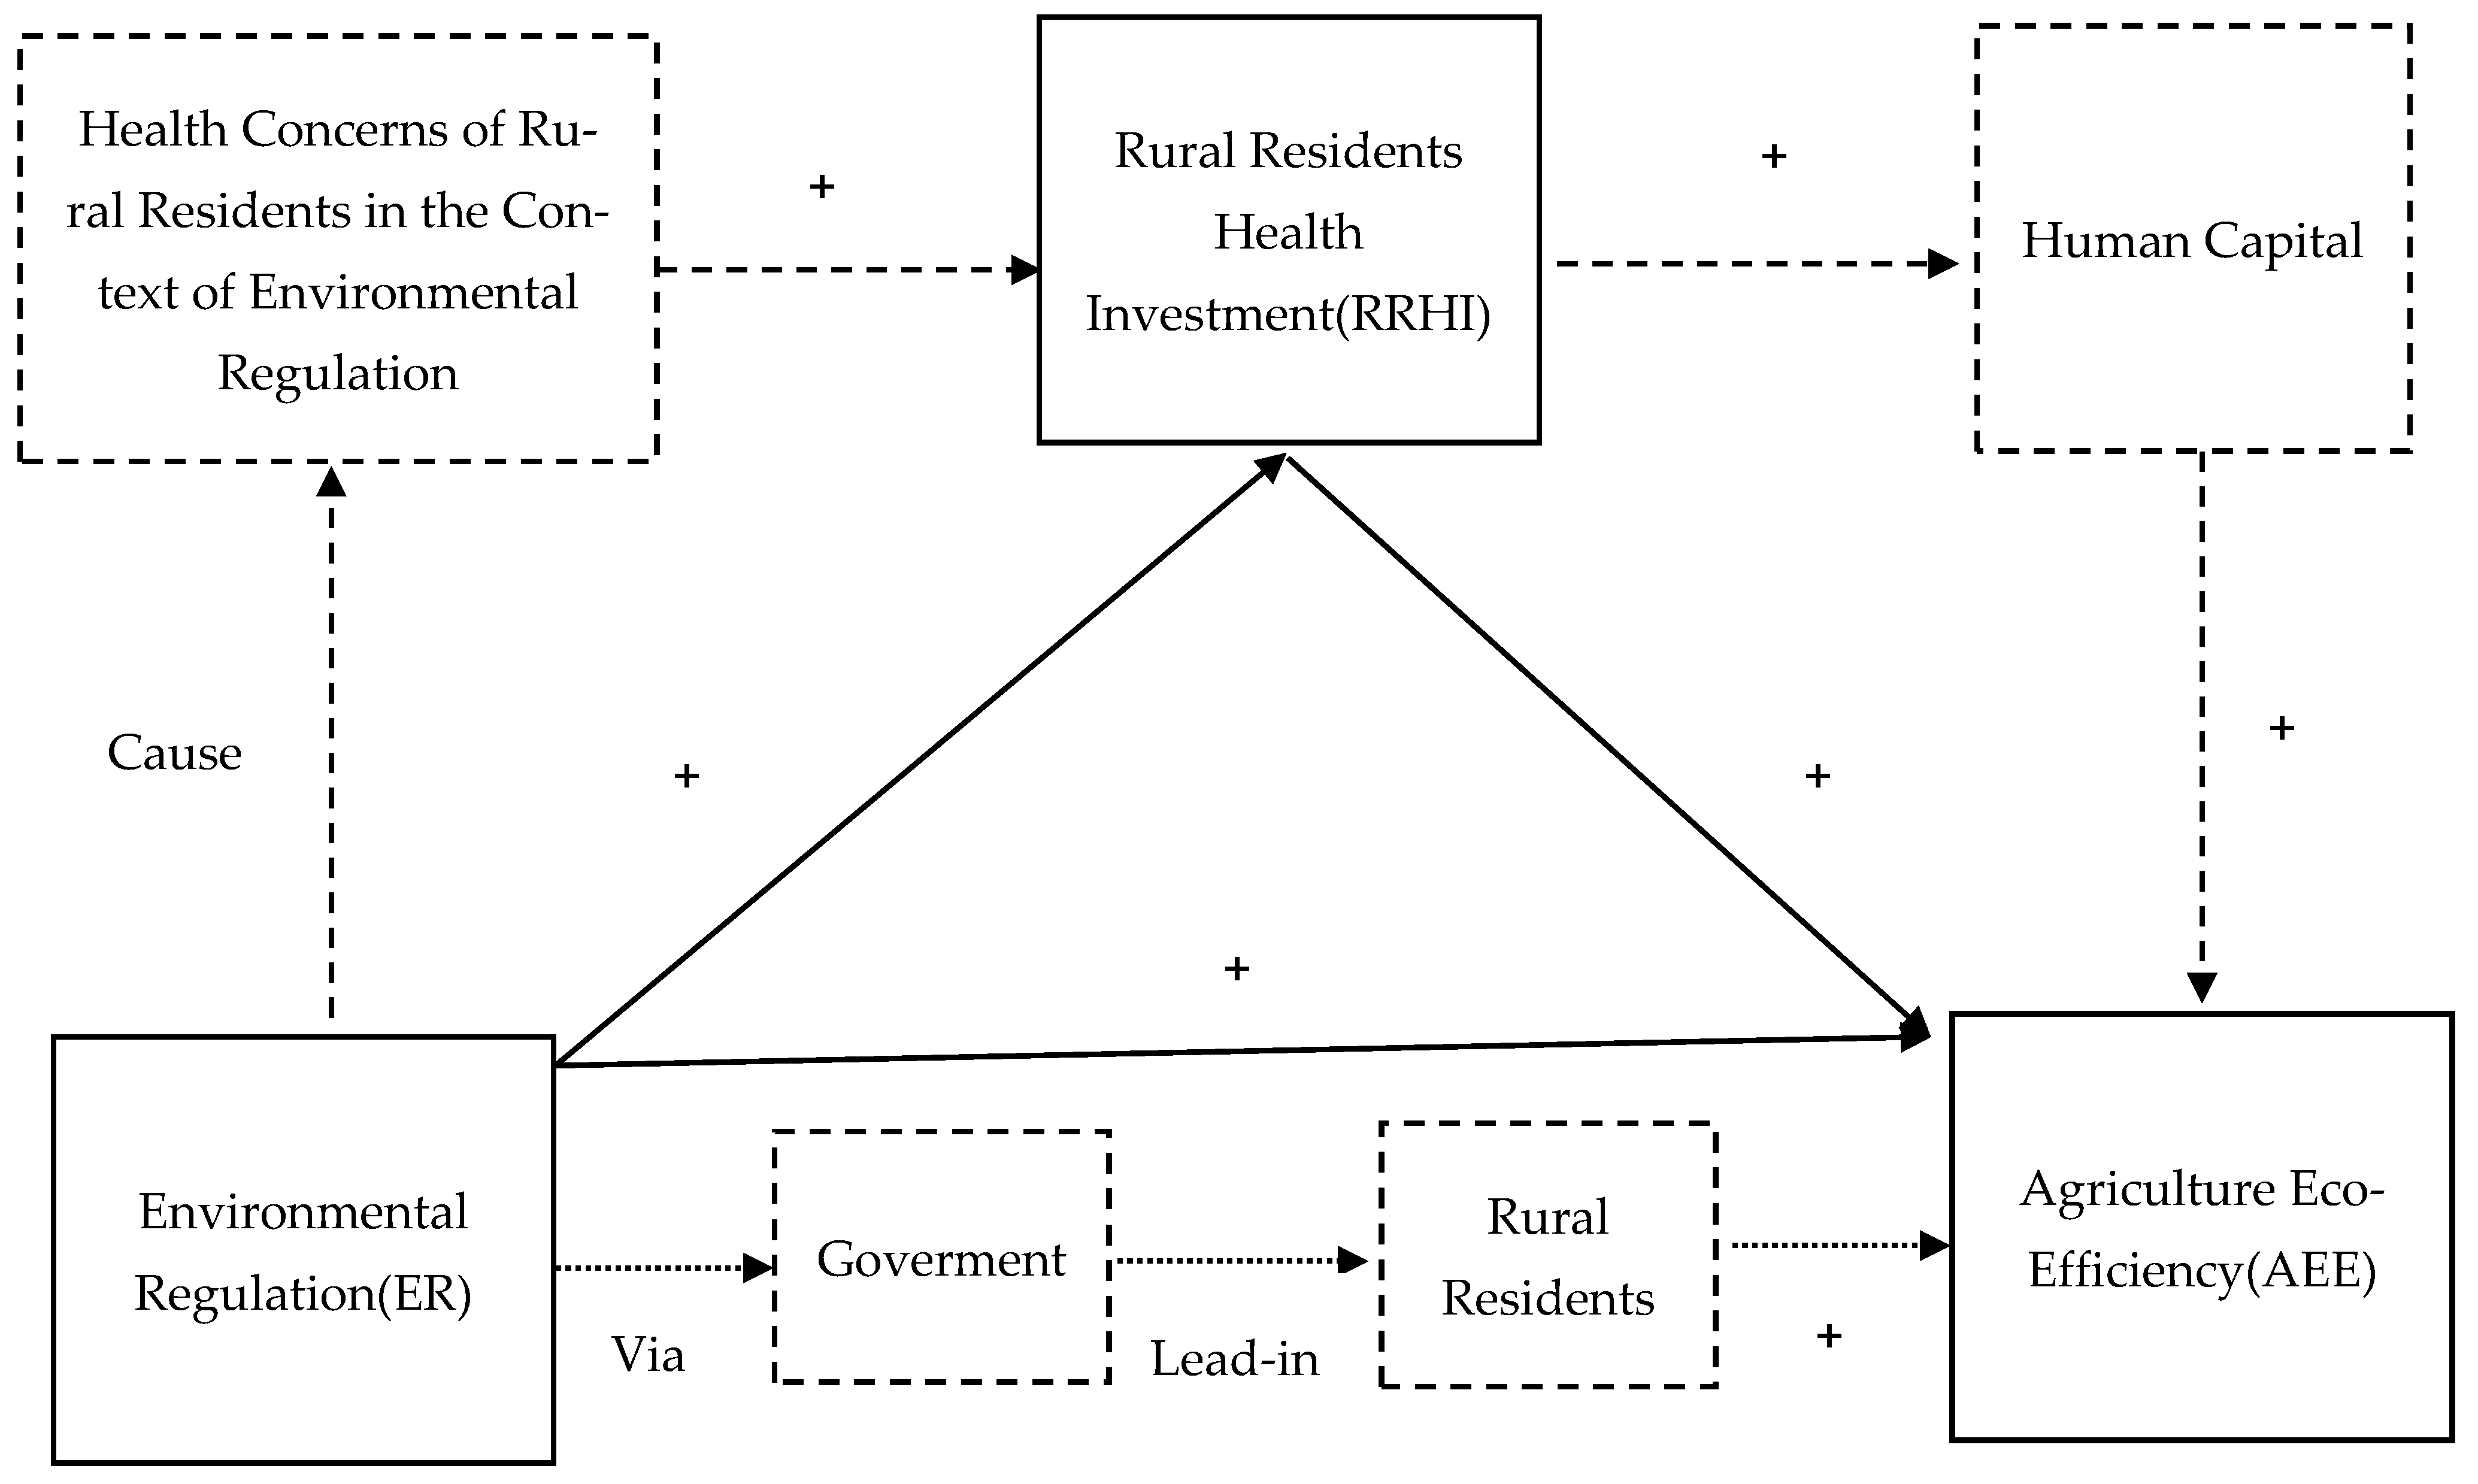
2.2. ER, RRHI, and AEE

Environmental pollution is an important cause of health hazards for the population [30], and people will increase their health care expenditures when pollution poses a risk to human health. For example, Jerrett et al. (2003) examined the relationship between environmental quality and health care expenditures using cross-sectional data and found that health care expenditures were also higher in areas with high environmental pollution after controlling for other variables that may affect health expenditures [31]. The health of residents is affected not only by environmental pollution and environmental impacts in the region, but also by the total amount of pollutant emissions from surrounding areas and the intensity of ER. The improvement in environmental quality is usually seen as a short-term effect of the implementation of regulatory policies, while the improvement in residents’ physical and mental health is seen as a long-term benign effect of sustained environmental quality improvement [32]. The higher intensity of ER indicates that the local environmental pollution poses a greater threat to the life and health levels of the residents, and the Government will implement strong ER to mitigate the harm caused by pollution to maintain stable social development. For example, to curb the serious damage to air quality caused by pollution emissions from power stations, the Chinese Government enacted a strict pollution emission control decree (Two Control Zone policy, TCZ) for power stations in 1998. Based on this, Tanaka (2015) analyzed the impact of this air pollution emission regulation policy on the health of Chinese residents using the double-difference method (DID) [33]. They found that this policy (TCZ) improved the health status of the population and reduced infant and child mortality, while the health expenditures of the population increased significantly. In other words, ER rises with the level of pollution, and the rise in ER and pollution triggers the population to pay attention to health and make health investments to ensure sufficient production levels. For a long time, Chinese agriculture has required large amounts of labor and land for its development, and good health levels are necessary to carry out agricultural production. As environmental quality declines and the intensity of ERs becomes higher, it also raises rural residents’ concern about their health, and they will increase investment in their health to mitigate the health risks associated with environmental pollution and ensuring the physical demands of agricultural production. Therefore, this paper proposes the following hypothesis.
Hypothesis 2 (H2).
ER can effectively promote the increase of RRHI.
Human capital is composed of human knowledge, skills, and health qualities, which have economic value and are a combination of the mental and physical qualities of workers [34]. RRHI can promote their own health and improve their human capital, so that they can better adapt to physical and mental activities. Having a healthy body allows for a higher production demand and sustains long-term economic growth. Environmental quality can affect both individual health and productivity levels [35]. Without deliberate intervention, environmental pollution will increase human morbidity and mortality, reduce economic productivity, and impair human capital formation [36]. In the agricultural sector, AEE cannot be achieved without the input of high-quality human capital, and the quantity and quality of human capital will have a significant impact on the high-quality development of the agricultural economy. The current development situation in China determines that a large amount of human capital input is required for agricultural production, and the better the health of the workforce and higher the condition of human capital, the more likely it is to meet the requirements of high-intensity ERs and promote AEE [37]. Therefore, this paper proposes the following hypothesis.
Hypothesis 3 (H3).
Increasing investment in the health of rural residents can effectively promote AEE.
If all the above hypotheses are valid, that is, both ER and rural residents’ RRHI can promote AEE and ER can promote RRHI, it can be inferred that RRHI plays a mediating role in the effect of ER on AEE; therefore, this paper proposes the following hypothesis. Please see Figure 1 for the specific research mechanism in this paper.
Hypothesis 4 (H4).
RRHI plays a mediating role in the effect of ER on AEE.

3. Research Methodology and Data Sources

3.1. Model Construction

3.1.1. Super-SBM Model Based on the Undesired Output

The basic data envelopment model (DEA) model idea is to consider the research object as each decision unit, analyze the input–output ratios of each decision unit comprehensively, operate the input–output weights of each decision unit as variables, and judge whether each decision unit reaches the efficient state through the operation results [38]. The traditional data envelopment model (DEA) does not consider the input–output slackness, and the calculation results have certain errors; therefore, Tone improved the DEA model on this basis and defined the new model as the Super-SBM model [39,40]. The Super-SBM model is a non-radial, non-rectangular model that incorporates slack variables into the model and provides a more accurate measure of efficiency. Therefore, the following Super-SBM model is constructed in this paper:
ρ * = m i n 1 m i = 1 m X i X i 0 1 S 1 + S 2 ( r = 1 s 1 Y r g Y r 0 g + t = 1 s 2 Y t b Y t 0 b    
s . t . X j = 1 , 0 n β j X j , Y g j = 1 , 0 n β j Y j g , Y b j = 1 , 0 n β j Y j b , X X 0 , Y g Y 0 g ,   Y b Y 0 b ;   j = 1 , 0 n β j = 1 , Y g 0 , β 0
In the above Equation (1), ρ* is the target efficiency value; X is the input; Yg is the desired output; Yb is the non-desired output; X is the input slackness; Y−g is the slack in desired output; Y−b is the slackness for non-desired output; β is the weight vector; and model subscript “0” is the evaluated decision unit. ρ* is strictly monotonically decreasing with respect to Y−g, Y−b, X, and 0 ≤ ρ* ≤ 1. For a specific decision unit, when ρ* = 1 and Y−g, Y−b, X are all equal to 0, it indicates that the decision cell is valid; conversely, if ρ^* < 1, it indicates that the decision unit is invalid and the corresponding input–output needs to be improved.

3.1.2. Benchmark Regression Model

To examine the impact of ERs on AEE, the following benchmark regression model is constructed in this paper:
A E E i t = β 0 + β 1 L n E R i t + β 2 C o n t r o l X i t + σ i + υ t + ε i  
where i denotes the Chinese provinces, t denotes the year, AEEit indicates agriculture eco-efficiency, LnERit denotes the logarithm of environment regulation, ControlXit represents a series of control variables affecting AEE, σi denotes the individual fixed effect, υt denotes the time fixed effect, and εi is the random error term. β0 is the intercept term, and β1 is the coefficient of the effect of ER on AEE.

3.2. Selection of Variables

Explained variables: agriculture eco-efficiency (AEE). Firstly, the indicators are selected in two dimensions of input and output of agriculture (planting industry), among which nine indicators are selected for input indicators, such as total agricultural machinery power (TAMP), the use of water in agriculture (IA), sown area (SA), agricultural labor force (ALF), agricultural electricity consumption (AEC), fertilizer (Fert), pesticide (Ptc), agricultural film (AF) and diesel (Ds). Outputs are divided into desired and undesired outputs, where the desired output is agricultural output (Agr-GDP), and there are two types of undesired outputs: fertilizer and film residues (FFR) and carbon emissions (CO2-E) from agricultural planting processes. Secondly, the residual coefficients of chemical fertilizers, pesticides and agricultural films in the indicators are based on the First National Pollution Source Census of China. For the calculation of carbon emissions generated in agricultural production, we refer to existing studies [41,42] and go by the following carbon emission factors: fertilizer 0.896 (kg/kg), pesticide 4.934 (kg/kg), agricultural film 5.180 (kg/kg), diesel 0.693 (kg/kg), tillage 20.476 (kg/hm2), and irrigation 312.60 (kg/hm2). Since the DEA method for solving production efficiency is independent of the data dimensionality, the data are not dimensionless in this paper. Please see Table A1 in Appendix A for the results of AEE measurement in China
Core explanatory variables: environmental regulation (ER) is one of the important variables analyzed in this study. Although ER is generally classified into three types: guidance, incentive, and constraint, according to relevant scholars, the measurement of each type of ER varies widely when it comes to different industry sectors or different research objectives. In terms of the construction of the formula, Fang Zeng et al. (2021) argued that the level of economic development can better reflect the intensity of local ER, and the area of the region can significantly influence the intensity of local ER [43]. Xuehui Wang and Guofeng Gu (2016) took two-thirds of the regional area as the intra-regional distance and used the regional area and circumference as key elements to construct the Euclidean linear distance of the region, which would provide a better geographical distance explanation for the implementation of ER at the regional scale [44]. Therefore, referring to Wang and Gu (2016) and Zeng et al. (2021), this paper uses the adjustment factor to improve the total GDP of regional economic development level to measure the intensity of ER [43,44]. In order to avoid the effect of heteroskedasticity in the regression due to ER units that are too large, this paper will treat the logarithm of ER with the following equation:
L n E R i = L n ( G D P i × 1 2 3 × a r e a i π )
LnERi denotes the logarithm of ER intensity in region i, GDPi denotes the gross regional product, areai is the area of each province’s administrative region, and π is the circumference.
Mediating variable: rural residents’ health investment (RRHI), measured by health care and medical services expenditures in rural residents’ living expenses (Medical), and logarithmic (Lnmedical).
Control variables: based on the studies of Baoyi Wang, Weiguo Zhang (2018) and Dai SH et al. (2021), for the reliability of data sources and the scientific nature of the study, the per capita sown area, industrial structure ratio, mechanization level and labor input per unit area were selected as control variables in this paper [28,42]. Among them, the sown area per capita (SAPC), is expressed by the ratio of primary industry employees to sown area. When the scale of agricultural production is small, farmers will put a lot of chemical fertilizers and pesticides on the limited arable land in order to obtain high yield and income. However, these production methods are relatively crude and their awareness of ecology and environmental protection is weak, thus leading to low AEE. When the scale of agricultural production is increased, various agricultural production materials inputs will increase, and additional employment costs will also be incurred. When farmers still maintain a crude production and operation method or adopt large fuel-based mechanized operations, they will also have some impact on AEE. The industrial structure (IS), expressed as the ratio of agricultural GDP to agricultural, forestry, and fishery GDP. The higher ratio of agricultural industry structure indicates that the development of the region’s economy relies more on the development of agricultural plantation industry; however, under the current situation of insufficient development of modern agriculture, family agricultural production is cruder and cannot achieve the scientific and fine management of agricultural production, and the AEE is low. The level of agricultural mechanization (LAM), expressed by the total power of agricultural machinery per unit area. The level of agricultural mechanization represents to a certain extent the level of agricultural modernization in a region, and its advantageous role in the agricultural production process is becoming increasingly clear. The improvement in the level of agricultural mechanization will improve land productivity and increase farmers’ income. However, the increase in the level of agricultural mechanization will increase the use of chemical fuels such as oil and diesel and pollution emissions, which creates some problems in terms of environmental pollution and could inhibit the improvement in AEE. Labor input per unit area (LI) is expressed as the ratio of primary industry employees to total crop sown area. The higher the quantity of labor input, the higher the degree of labor-intensive production, which relies mainly on labor input to achieve high output, indicates that the more rudimentary the production method, the lower the AEE. See Table 1 for specific information on all variables.

4. Regression Analysis

4.1. Benchmark Regression Analysis

In this paper, after the Hausman test, the p-value is 0.0001, which is less than 0.05, so the fixed-effects model is chosen for estimation, which includes an individual fixed effects and two-way fixed-effects model with the addition of control individuals and time until the parameter estimation of the regression coefficients of ER affecting AEE, Table 2 shows the regression results of individual fixed and two-way fixed-effects models, where Table 2, Model (1) and (2) are the regression results for fixed provinces, and (3) and (4) are the regression results for fixed time and provinces. The results show that before and after the addition of control variables, the regression results of both models show that ER has a significant positive effect on AEE, and R2 also increases with the addition of control variables; therefore, it can be proved that the level of AEE can be significantly increased with the effect of ER, and thus hypothesis H1 is proved. In the fourth column of Table 2, the regression results of the two-way fixed effects model with the addition of control variables are as follows: for every 1% unit increase in ER, the AEE will increase by 0.879%.

4.2. Endogeneity Problem

Although the benchmark regression results show a significant positive effect of ER on AEE, ER and AEE may have a two-way causal relationship, which leads to endogenous problems. ER can not only promote AEE; conversely, if the level of AEE is low, it means that the environmental quality in the agricultural production process is poor, which will lead the government to strengthen the management of the agricultural production environment and improve the strength of ER, so there is a two-way causality between ER and AEE. In this paper, we choose the IV-2SLS method and refer to the first-order lag of ER as an instrumental variable [45] for addressing the endogeneity issue. Table 3 shows the IV-2SLS regression results. In the first stage, the effect of ER first-order lag term of ER on ER is positive, with p-values significant at the 1% level, and the Kleibergen–Paap F-value in the first stage is much greater than 10, which is consistent with the rule of thumb (Model (5))/ The second stage regression results show that there is still a significant positive effect of ER on AEE (Model (6)).

4.3. Robustness Test

To ensure the reliability of the regression results, this paper further conducts robustness tests. Traditional robustness tests are generally performed by replacing core variables, changing the model, and increasing or decreasing the sample size. Based on the existing data collection and the simplicity of the model operation, this paper adopts the method of transforming the model and replacing the explanatory variables to conduct the robustness test.
The type of data in this paper is panel data, so the dynamic panel estimation method, GMM method, is used to perform the robustness test. The GMM estimation method is divided into two types of differential GMM and systematic GMM estimation, but Li Gu-Cheng et al. (2018) pointed out that systematic GMM estimation may cause the problem of over-identification of instrumental variables [46]; therefore, this paper chooses a differential GMM estimation method to verify the robustness of the model. The results of differential GMM estimation are shown in Model (7) of Table 4, which shows that ER still have a significant positive effect on AEE.
Second, this paper uses the inverse of the non-desired output of agricultural production (Nonoutput−1) instead of AEE. This is because a higher degree of AEE indicates a lower degree of non-desired agricultural output and a higher value of the inverse of non-desired output (AEE and non-desired output > 0). Therefore, this paper measures AEE by the inverse of agricultural non-desired output, and if ER can significantly promote AEE, its coefficient will be positive, and a non-desired output will be reduced. In Table 4, the coefficient of ER is still significantly positive, indicating that, as the intensity of ER increases, the non-desired output decreases, and the inverse of the non-desired output increases, thus promoting AEE. Model (8) of Table 4 shows that ER can reduce the agricultural non-desired output and promote AEE, while controlling for time and individual effects.

5. ER, RRHI, and AEE

5.1. Analysis of Mediating Effects

5.1.1. Model Construction

In this paper, the mediating effect is tested through the following three steps. First, ER is regressed on the mediating variable RRHI, and if the regression coefficient is significantly positive, it indicates that ER can promote residents’ investment in their health. Second, the regression of AEE uses RRHI, and if the coefficient is significantly positive, it indicates that RRHI can significantly promote AEE. Finally, if the coefficients of ER and RRHI are included in the model at the same time, and the coefficient of ER is still significantly positive and RRHI is also significantly positive, it indicates that the variable ER affects AEE through the mediating variable, RRHI. This paper constructs a model based on the following:
L n M e d i c a l i t = α 0 + α 1 L n E R i t + i = 1 N β i C o n t r o l X i t + σ i + υ t + ξ i t
A E E i t = δ 0 + δ 1 L n M e d i c a l i t + k = 1 N κ i C o n t r o l X i t + σ i t + υ i t + τ i t
A E E i t = γ 0 + γ 1 L n E R i t + γ 2 L n M e d i c a l i t + λ = 1 N λ i C o n t r o l X i t + σ i t + υ i t + μ i t  
LnMedicalit denotes the logarithm of RRHI; ControlXit is the control variable; β i , κ i ,  λ i are the coefficients of the control variables in each model, respectively; ξit, τit, μit, are random errors term; σi denotes individual fixed effects; and υt denotes time fixed effects.

5.1.2. Empirical Analysis

We must consider that ER may improve AEE by promoting rural residents to make RRHI and improve human capital, thus increasing AEE. The mediating variable in this paper is taken as RRHI, which is expressed as the logarithm of rural residents’ health care expenditure (Lnmedical), and the data are obtained from the China Rural Statistical Yearbook and provincial statistical yearbooks from 2010–2019.
The regression results of steps one to three are shown in Models (9) to (11) of Table 5. In Model (9) of Table 5, the regression coefficient of ER is positive at the 10% significance level, indicating that ER has a positive effect on RRHI, and H2 is verified. In Model (10), the regression result of RRHI is positive at the 5% significance level, indicating that as RRHI increases, it also significantly improves AEE, and H3 is verified. In Model (11), the regression results, including both ER and RRHI, show that the regression coefficients of both variables are significant and positive, indicating that RRHI plays a mediating role in the effect of ER on AEE, and H4 is verified.
In summary, this paper finds that ER can effectively enhance AEE and further improve AEE by promoting RRHI to achieve AEE.

5.2. Heterogeneity Analysis

This paper investigates the mechanisms of ER, RRHI, and AEE in 31 provinces of China; however, differences in economic development across regions may have an impact on the research in this paper. Therefore, this paper first divides China’s 31 provinces into the traditional three regions—eastern, central and western—according to the classification criteria of the National Development and Reform Commission, which represent high, middle, and low levels of economic development, and then analyzes the effect of ER on AEE; the regression results are shown in Table 6. The regression results in Model (12) and Model (14) of Table 6 show that there is a significant positive effect of ER on AEE in the eastern and western regions, and it passes the 1% significance level test. This indicates that ERs have a positive impact on AEE and green economic development at both high and low levels of economic development. This also illustrates the reality of agricultural production in the eastern and western regions of China. In the western regions with lower levels of economic development, such as Tibet Autonomous Region (Tibet), Xinjiang Uygur Autonomous Region (Xijiang), Qinghai, Inner Mongolia Autonomous Region (Neimenggu), and Sichuan, most farmers are still using traditional methods of agricultural production, and these regions do not improve AEE by sacrificing the environment and putting in large amounts of chemicals. On the contrary, in regions with a high level of economic development, such as Guangdong, Jiangsu, Zhejiang, and Shandong, where people’s income level determines that they are more concerned about health, ER will work to improve agricultural production methods and promote AEE to meet the demand for higher-quality food from society’s residents. The impact of ER on AEE in the central region is negative, and the p-value is not significant (Model (13)). The possible reason for this is that the central region requires a lot of chemical inputs to increase the productivity per unit of land during the stage of economic development from a low to a high level; the demand for agrochemicals is huge and their prices are cheaper at this stage, but this will cause some harm to the environment. At this stage, the cost to the government of increasing ER to improve AEE will become higher [47], to promote agricultural productivity and reduce government financial pressure, the government may deregulate farmers’ use of fertilizers and pesticides, but this also reduces the level of agroecological efficiency. Therefore, at this stage, increasing the level of ER will not effectively improve AEE, and forcing an increase in ER will result in the phenomenon of reduced efficiency of AEE.

6. Conclusions and Recommendations

This paper empirically analyzes the effect of ER on AEE, and the mediating effect of RRHI in ER and AEE using the panel data of 31 provinces in China from 2009 to 2018. It was found that, (1) regarding the role of ER on AEE in the univariate linear regression model, ER has a significant positive effect on AEE. After adding some control variables, the promotion effect of ER on AEE was significantly increased, suggesting that, at this stage, ER in China has a significant contribution to AEE. (2) The mediating effect model based on RRHI shows that RRHI can act as a mediating variable between ER and AEE better. That is, ER can increase the level of AEE by promoting RRHI. This suggests that environmental regulation positively contributes to both RRHI and AEE, and that RRHI can also improve AEE. (3) When China is divided into three regions—eastern, central and western—the heterogeneity results show that the impact of ER on AEE is greatest in the economically developed eastern region, followed by the western region, while the ERs in the central region have a negative (but not significant) impact on AEE. It also means that the rapid development of agriculture in the low-to-high development stage of regional or national economy is carried out at the expense of ecological environment, while at a certain level of socio-economic development, the Government and residents begin to gradually increase the ecological awareness and intensity of environmental regulations, and thus the agricultural development method begins to develop into a green economy. Therefore, the impact of ER on AEE is not always facilitated at different stages of economic development.
These findings have important implications for ER in promoting human health and AEE and provide a better realistic basis for how to formulate environmental regulation policy implementation under different stages of regional economic development. First of all, ER can promote AEE, so governments at all levels should pay attention to the role of ER, introduce policy documents related to the green development of agriculture, mobilize farmers’ enthusiasm for green production, and play the role of supervision by the public. Secondly, RRHI plays an intermediary role in ER and AEE; therefore, ER should be used to mobilize residents’ concerns and investments in the environment and their health. We should explore the green development model of “government guide, social supervision, and people participation”, and play the role of ER at multiple levels to raise residents’ concern for health. Finally, ERs have clear regional heterogeneity. Therefore, local governments should implement ERs according to the degree of socio-economic development, the cost of ERs and the cost of green agricultural production, and should not adopt a “one-size-fits-all” approach to promote green agricultural production. For example, in medium economic regions, ER should be moderately reduced, while in economically developed regions, ER should be increased, so that environmental regulations can play a role in promoting green agricultural production.

7. Limitations and Perspectives

This paper is of great significance for describing the mechanism of the role of ER in AEE, and it also provides help to different regional governments in formulating environ-mental policies; however, this paper also has the following limitations. (1) This study uses indicators, such as the level of economic development and size of administrative areas, to measure the level of environmental regulation, which can reflect the strength of environmental regulation to some extent but hardly represents the meaning of the three types of environmental regulation. (2) Although this article uses an accurate method to measure regional AEE, the result obtained using macro data may differ from field surveys.
Based on the limitations of this paper and the trend of related research, this paper proposes the next research intention and outlook: (1) By focusing on a typical region and using questionnaires to assess local ER, RRHI and AEE can better match more realistic measurements. (2) Currently, the economic development in some regions is still at the expense of the environment, and the local environmental quality and health level of residents still requires attention. Therefore, interested scholars can focus on such regions and study in more depth the evolution of local environmental policies and changes in the health level of residents as the regional economy develops, which have important implications for environmental protection and residents’ health.

Author Contributions

Conceptualization, K.Z. and J.W.; methodology, K.Z.; software, K.Z.; validation, K.Z.; formal analysis, K.Z.; resources, K.Z.; data curation, K.Z. and X.Z.; writing—original draft preparation, K.Z.; writing—review and editing, J.L., Y.L. and J.W.; visualization, X.Z.; supervision, J.L. and J.W.; funding acquisition, J.W. and Y.L. All authors have read and agreed to the published version of the manuscript.

Funding

This research was funded by the Ministry of Agriculture and Rural “Agricultural Financial Special Project” (No. 1251610010000190005) and the Sichuan Provincial Department of Science and Technology’s “Soft Science Project” (No. 22RKX0457).

Institutional Review Board Statement

Not applicable.

Informed Consent Statement

Not applicable.

Data Availability Statement

Publicly available datasets were analyzed in this study. This data can be found here: (https://data.stats.gov.cn/easyquery.htm?cn=E0103, accessed on 10 September 2021), and partial data were obtained from the China Rural Statistical Yearbook, purchased at the author’s expense, and are available from the first author (K.Z.) upon request.

Conflicts of Interest

The authors declare no conflict of interest.

Appendix A

This paper focuses on the analysis of the role of ER and RRHI in ARR. A single agricultural eco-efficiency result is not used as the main description object in this paper; if the reader wants to observe this, please see Appendix A in Table A1.
Table A1. Agricultural eco-efficiency value.
YearCityAEECityAEECityAEECityAEECityAEECityAEECityAEE
2009Anhui0.2400Beijing0.6212Chongqing0.3093Fujian0.4146Gansu0.2339Guangdong0.3693Guangxi0.4694
2010Anhui0.2766Beijing0.6733Chongqing0.3469Fujian0.4898Gansu0.2827Guangdong0.4169Guangxi0.5406
2011Anhui0.2993Beijing0.7297Chongqing0.4027Fujian0.5642Gansu0.3018Guangdong0.4855Guangxi0.6207
2012Anhui0.3179Beijing0.8089Chongqing0.4467Fujian0.6179Gansu0.3410Guangdong0.5088Guangxi0.6833
2013Anhui0.3391Beijing0.8979Chongqing0.4701Fujian0.6778Gansu0.3736Guangdong0.5445Guangxi0.7482
2014Anhui0.3595Beijing0.8861Chongqing0.4912Fujian0.7595Gansu0.3882Guangdong0.5691Guangxi0.7935
2015Anhui0.3510Beijing1.0039Chongqing0.4805Fujian0.6614Gansu0.3089Guangdong0.6010Guangxi0.7428
2016Anhui0.3795Beijing1.0159Chongqing0.5846Fujian1.0442Gansu0.4549Guangdong0.6621Guangxi1.0329
2017Anhui0.3873Beijing1.0132Chongqing0.5877Fujian0.8613Gansu0.3891Guangdong0.7594Guangxi0.9137
2018Anhui0.3893Beijing1.1030Chongqing0.6472Fujian1.0011Gansu0.4296Guangdong1.0010Guangxi1.0351
2009Guizhou0.2863Hebei0.2967Henan0.3412Heilongjiang0.2942Hainan0.4901Hubei0.3362Hunan0.3382
2010Guizhou0.3164Hebei0.3844Henan0.4469Heilongjiang0.3176Hainan0.5169Hubei0.4227Hunan0.4096
2011Guizhou0.3091Hebei0.4461Henan0.4493Heilongjiang0.4109Hainan0.5590Hubei0.4932Hunan0.4810
2012Guizhou0.4021Hebei0.5146Henan0.5060Heilongjiang0.5445Hainan0.6090Hubei0.5525Hunan0.5233
2013Guizhou0.4497Hebei0.5948Henan0.5373Heilongjiang0.6916Hainan0.6399Hubei0.5655Hunan0.5796
2014Guizhou0.5760Hebei0.5881Henan0.5892Heilongjiang0.7370Hainan0.7216Hubei0.6059Hunan0.5987
2015Guizhou0.7529Hebei0.4494Henan0.5922Heilongjiang0.7947Hainan0.7511Hubei0.4405Hunan0.5737
2016Guizhou0.8215Hebei0.6269Henan0.6156Heilongjiang0.6777Hainan1.0055Hubei0.7318Hunan0.6826
2017Guizhou0.8967Hebei0.4988Henan0.6232Heilongjiang0.9133Hainan1.0262Hubei0.5255Hunan0.7180
2018Guizhou1.1513Hebei0.5740Henan0.7319Heilongjiang1.0607Hainan1.1096Hubei0.5504Hunan0.7899
2009Jilin0.2982Jiangsu0.3953Jiangxi0.2440Liaoning0.3214Neimenggu0.2579Ningxia0.3299Qinghai0.4870
2010Jilin0.3263Jiangsu0.4655Jiangxi0.2598Liaoning0.3825Neimenggu0.2991Ningxia0.4215Qinghai0.5758
2011Jilin0.3671Jiangsu0.5879Jiangxi0.2911Liaoning0.4286Neimenggu0.3486Ningxia0.4369Qinghai0.5620
2012Jilin0.4242Jiangsu0.6997Jiangxi0.3110Liaoning0.5167Neimenggu0.3659Ningxia0.4595Qinghai0.7784
2013Jilin0.4574Jiangsu0.7637Jiangxi0.3707Liaoning0.5790Neimenggu0.4168Ningxia0.5087Qinghai0.7817
2014Jilin0.4914Jiangsu0.8269Jiangxi0.3921Liaoning0.6019Neimenggu0.4378Ningxia0.5407Qinghai1.0036
2015Jilin0.3813Jiangsu0.9393Jiangxi0.4616Liaoning0.6292Neimenggu0.4576Ningxia0.5873Qinghai0.7799
2016Jilin0.4345Jiangsu0.9623Jiangxi0.4972Liaoning0.6835Neimenggu0.4200Ningxia0.6560Qinghai0.8399
2017Jilin0.3076Jiangsu1.0035Jiangxi0.5116Liaoning0.5508Neimenggu0.4243Ningxia0.6581Qinghai0.9003
2018Jilin0.3488Jiangsu1.0135Jiangxi0.5510Liaoning0.6296Neimenggu0.4733Ningxia1.0195Qinghai1.0226
2009Sichuan0.3629Shandong0.3816Shanghai0.7482Shanxi0.2561Shaanxi0.3683Tianjin0.4153Xinjiang0.3701
2010Sichuan0.4054Shandong0.4393Shanghai0.8272Shanxi0.2976Shaanxi0.4760Tianjin0.5124Xinjiang0.6440
2011Sichuan0.4870Shandong0.4654Shanghai1.0191Shanxi0.3286Shaanxi0.5739Tianjin0.5465Xinjiang0.6241
2012Sichuan0.5719Shandong0.4893Shanghai1.0055Shanxi0.3532Shaanxi0.6310Tianjin0.6129Xinjiang0.7077
2013Sichuan0.6089Shandong0.5880Shanghai1.0055Shanxi0.3826Shaanxi0.7100Tianjin0.7072Xinjiang0.7326
2014Sichuan0.6566Shandong0.6503Shanghai1.0116Shanxi0.3973Shaanxi0.7938Tianjin0.7855Xinjiang0.7128
2015Sichuan0.7203Shandong0.6281Shanghai0.9685Shanxi0.3410Shaanxi0.7807Tianjin0.6200Xinjiang0.7446
2016Sichuan0.8454Shandong0.6444Shanghai0.8624Shanxi0.4222Shaanxi0.8787Tianjin1.0180Xinjiang0.7749
2017Sichuan0.9383Shandong0.6067Shanghai0.8989Shanxi0.3999Shaanxi0.9128Tianjin0.7470Xinjiang0.8694
2018Sichuan1.0666Shandong0.7218Shanghai1.0875Shanxi0.4190Shaanxi1.0782Tianjin1.1089Xinjiang1.0665
2009Tibet1.0608Yunnan0.2409Zhejiang0.3755
2010Tibet0.9996Yunnan0.2402Zhejiang0.4540
2011Tibet0.9986Yunnan0.2776Zhejiang0.5085
2012Tibet1.0287Yunnan0.3291Zhejiang0.5508
2013Tibet0.7977Yunnan0.3735Zhejiang0.6140
2014Tibet0.8106Yunnan0.4023Zhejiang0.6525
2015Tibet0.7639Yunnan0.3918Zhejiang0.6577
2016Tibet0.5616Yunnan0.4226Zhejiang0.9094
2017Tibet0.8866Yunnan0.4276Zhejiang0.9169
2018Tibet1.0982Yunnan0.5483Zhejiang1.0276

References

  1. Salahuddin, M.; Gow, J.; Vink, N. Effects of Environmental Quality on Agricultural Productivity in Sub Saharan African Countries: A Second Generation Panel Based Empirical Assessment. Sci. Total Environ. 2020, 741, 140520. [Google Scholar] [CrossRef] [PubMed]
  2. Su, Y.; He, S.; Wang, K.; Shahtahmassebi, A.R.; Zhang, L.; Zhang, J.; Zhang, M.; Gan, M. Quantifying the Sustainability of Three Types of Agricultural Production in China: An Emergy Analysis with the Integration of Environmental Pollution. J. Clean. Prod. 2020, 252, 119650. [Google Scholar] [CrossRef]
  3. Koondhar, M.A.; Udemba, E.N.; Cheng, Y.; Khan, Z.A.; Koondhar, M.A.; Batool, M.; Kong, R. Asymmetric Causality among Carbon Emission from Agriculture, Energy Consumption, Fertilizer, and Cereal Food Production—A Nonlinear Analysis for Pakistan. Sustain. Energy Technol. Assess. 2021, 45, 101099. [Google Scholar] [CrossRef]
  4. Fang, L.; Hu, R.; Mao, H.; Chen, S. How Crop Insurance Influences Agricultural Green Total Factor Productivity: Evidence from Chinese Farmers. J. Clean. Prod. 2021, 321, 128977. [Google Scholar]
  5. Jones, A.D.; Ngure, F.M.; Pelto, G.; Young, S.L. What Are We Assessing When We Measure Food Security? A Compendium and Review of Current Metrics. Adv. Nutr. 2013, 4, 481–505. [Google Scholar] [CrossRef] [PubMed] [Green Version]
  6. Guo, J. Factors Affecting Green Agricultural Production Financing Behavior in Heilongjiang Family Farms: A Structural Equation Modeling Approach. Front. Psychol. 2021, 12, 13. [Google Scholar]
  7. Deng, X.; Gibson, J. Improving Eco-Efficiency for the Sustainable Agricultural Production: A Case Study in Shandong, China. Technol. Forecast. Soc. Change 2019, 144, 394–400. [Google Scholar] [CrossRef]
  8. Akbar, U.; Li, Q.L.; Akmal, M.A.; Shakib, M.; Iqbal, W. Nexus between agro-ecological efficiency and carbon emission transfer: Evidence from China. Environ. Sci. Pollut. Res. 2021, 28, 18995–19007. [Google Scholar]
  9. Xu, X.; Huang, X.; Huang, J.; Gao, X.; Chen, L. Spatial-Temporal Characteristics of Agriculture Green Total Factor Productivity in China, 1998–2016: Based on More Sophisticated Calculations of Carbon Emissions. Int. J. Environ. Res. Public Health 2019, 16, 3932. [Google Scholar] [CrossRef] [Green Version]
  10. Li, M.; Wang, J.; Zhao, P.; Chen, K.; Wu, L. Factors Affecting the Willingness of Agricultural Green Production from the Perspective of Farmers’ Perceptions. Sci. Total Environ. 2020, 738, 140289. [Google Scholar] [CrossRef]
  11. Lu, W.; Wu, H.; Geng, S. Heterogeneity and threshold effects of environmental regulation on health expenditure: Considering the mediating role of environmental pollution. J. Environ. Manag. 2021, 297, 113276. [Google Scholar] [CrossRef] [PubMed]
  12. Shuai, S.; Fan, Z. Modeling the Role of Environmental Regulations in Regional Green Economy Efficiency of China: Empirical Evidence from Super Efficiency DEA-Tobit Model. J. Environ. Manag. 2020, 261, 110227. [Google Scholar] [CrossRef] [PubMed]
  13. Wang, L.; Wang, Z.; Ma, Y. Does environmental regulation promote the high-quality development of manufacturing? A quasi-natural experiment based on China’s carbon emission trading pilot scheme. Socio-Econ. Plan. Sci. 2021, 10, 101216. [Google Scholar] [CrossRef]
  14. Zhou, A.; Li, J. Impact of Anti-Corruption and Environmental Regulation on the Green Development of China’s Manufacturing Industry. Sustain. Prod. Consum. 2021, 27, 1944–1960. [Google Scholar] [CrossRef]
  15. Song, Y.; Zhang, X.; Zhang, M. The Influence of Environmental Regulation on Industrial Structure Upgrading: Based on the Strategic Interaction Behavior of Environmental Regulation among Local Governments. Technol. Forecast. Soc. Change 2021, 170, 120930. [Google Scholar] [CrossRef]
  16. Wang, Q. Do Land Price Variation and Environmental Regulation Improve Chemical Industrial Agglomeration? A Regional Analysis in China. Land Use Policy 2020, 94, 104568. [Google Scholar] [CrossRef]
  17. Zhou, X. Does Environmental Regulation Induce Improved Financial Development for Green Technological Innovation in China? J. Environ. Manag. 2021, 300, 113685. [Google Scholar] [CrossRef]
  18. Du, K. Environmental Regulation, Green Technology Innovation, and Industrial Structure Upgrading: The Road to the Green Transformation of Chinese Cities. Energy Econ. 2021, 98, 205247. [Google Scholar] [CrossRef]
  19. Wu, X.; Deng, H.; Li, H.; Guo, Y. Impact of Energy Structure Adjustment and Environmental Regulation on Air Pollution in China: Simulation and Measurement Research by the Dynamic General Equilibrium Model. Technol. Forecast. Soc. Change 2021, 172, 121010. [Google Scholar] [CrossRef]
  20. Wu, H.; Hao, Y.; Ren, S. How do environmental regulation and environmental decentralization affect green total factor energy efficiency: Evidence from China. Energy Econ. 2020, 9883, 104880. [Google Scholar] [CrossRef]
  21. Bonde, T.A. Environmental Regulations of Agriculture in the Baltic Sea Catchment Areas, with Reference to the European Union and the North Sea. Mar. Pollut. Bull. 1994, 29, 491–499. [Google Scholar] [CrossRef]
  22. Gonzalez-Martinez, A.R.; Jongeneel, R.; Kros, H.; Lesschen, J.P.; de Vries, M.; Reijs, J.; Verhoog, D. Aligning Agricultural Production and Environmental Regulation: An Integrated Assessment of the Netherlands. Land Use Policy 2021, 105, 105388. [Google Scholar] [CrossRef]
  23. Lutz, E. Integration of Environmental Concerns into Agricultural Policies of Industrial and Developing Countries. World Dev. 1992, 20, 241–253. [Google Scholar] [CrossRef]
  24. Victor, M.; Margarita, R.; Pedro, M. Economic-Environmental Efficiency of European Agriculture—A Generalized Maximum Entropy Approach. Agric. Econ. 2018, 64, 423–435. [Google Scholar] [CrossRef] [Green Version]
  25. Weltin, M.; Hüttel, S. Farm Eco-Efficiency: Can Sustainable Intensification Make the Difference? Agric. Land Mark. –Effic. Regulation. 2019, 10, 1–26. [Google Scholar]
  26. Rybaczewska-Błażejowska, M.; Gierulski, W. Eco-Efficiency Evaluation of Agricultural Production in the EU-28. Sustainability 2018, 10, 4544. [Google Scholar] [CrossRef] [Green Version]
  27. Pang, J.; Chen, X.; Zhang, Z.; Li, H. Measuring Eco-Efficiency of Agriculture in China. Sustainability 2016, 8, 398. [Google Scholar] [CrossRef] [Green Version]
  28. Dai, S.H.; Xu, J.B.; Wang, Y. The impacts of farmers’ perceived benefits on green fertilization behaviors under environmental regulations. Res. Agric. Mod. 2021, 42, 880–888. (In Chinese) [Google Scholar]
  29. Zhu, H.; Ge, J. A Theoretical and Empirical Analysis on the Impact of Government Regulation on Green Entrepreneurship of Agricultural Enterprises—A Case of Agricultural Leading Enterprises in Jiangxi Province. East China Econ. Manag. 2018, 32, 30–36. (In Chinese) [Google Scholar]
  30. Alberini, A.; Cropper, M.; Fu, T.-T.; Krupnick, A.; Liu, J.-T.; Shaw, D.; Harrington, W. Valuing Health Effects of Air Pollution in Developing Countries—The Case of Taiwan. J. Environ. Econ. Manag. 1997, 34, 107–126. [Google Scholar] [CrossRef] [Green Version]
  31. Jerrett, M.; Eyles, J.; Dufournaud, C.; Birch, S. Environmental Influences on Healthcare Expenditures: An Exploratory Analysis from Ontario, Canada. J. Epidemiol. Community Health 2003, 57, 334–338. [Google Scholar] [CrossRef] [PubMed] [Green Version]
  32. Zheng, J. Environmental regulation, what is the impact? J. Transl. Foreign Lit. Econ. 2021, 2, 64–71. (In Chinese) [Google Scholar]
  33. Tanaka, S. Environmental Regulations on Air Pollution in China and Their Impact on Infant Mortality. J. Health Econ. 2015, 42, 90–103. [Google Scholar] [CrossRef] [PubMed]
  34. Yang, J.; Gong, L.; Zhang, Q. Human Capital Formation land its Effects on Economic Growth. Manag. World 2006, 5, 10–18. [Google Scholar]
  35. Zivin, J.G.; Neidell, M. The Impact of Pollution on Worker Productivity. Am. Econ. Rev. 2012, 102, 3652–3673. [Google Scholar] [CrossRef] [Green Version]
  36. Fisher, S.; Bellinger, D.C.; Cropper, M.L.; Kumar, P.; Binagwaho, A.; Koudenoukpo, J.B.; Park, Y.; Taghian, G.; Landrigan, P.J. Air Pollution and Development in Africa: Impacts on Health, the Economy, and Human Capital. Lancet Planet. Health 2021, 5, e681–e688. [Google Scholar] [CrossRef]
  37. Grossman, M. On the Concept of Health Capital and the Demand for Health. J. Political Econ. 1972, 80, 223–255. [Google Scholar] [CrossRef] [Green Version]
  38. Jahanshahloo, G.R.; Hosseinzadeh, F.; Shoja, N.; Sanei, M.; Tohidi, G. Sensitivity and Stability Analysis in DEA. Appl. Math. Comput. 2005, 169, 897–904. [Google Scholar] [CrossRef]
  39. Tone, K. A Slacks-Based Measure of Efficiency in Data Envelopment Analysis. Eur. J. Oper. Res. 2001, 130, 498–509. [Google Scholar] [CrossRef] [Green Version]
  40. Tone, K. A Slacks-Based Measure of Super-Efficiency in Data Envelopment Analysis. Eur. J. Oper. Res. 2002, 143, 32–41. [Google Scholar] [CrossRef] [Green Version]
  41. West, T.O.; Marland, G. A synthesis of carbon sequestration, carbon emissions, and net carbon flux in agriculture: Comparing tillage practices in the United States. Agric. Ecosyst. Environ. 2002, 16, 217–232. [Google Scholar] [CrossRef]
  42. Wang, B.; Zhang, W. Cross-provincial Differences in Determinants of Agricultural Eco-efficiency in China: An Analysis Based on Panel Data from 31 Provinces in 1996–2015. Chin. Rural Econ. 2018, 1, 46–62. (In Chinese) [Google Scholar]
  43. Zeng, F.; Li, D.; Tan, Y. Impact of hog industry transfer on the adjustment of agricultural structure under the background of environmental regulations. China Popul. Resour. Environ. 2021, 31, 158–166. (In Chinese) [Google Scholar]
  44. Wang, X.; Gu, G. Spatial Pattern and Spillover Effects of Urban Economic Growth Based on Market Potential. Sci. Geogr. Sin. 2017, 37, 1617–1623. (In Chinese) [Google Scholar]
  45. Shen, K.; Jin, G.; Fang, X. Does Environmental Regulation Cause Pollution to Transfer Nearby? Econ. Res. J. 2017, 52, 44–59. (In Chinese) [Google Scholar]
  46. Li, G.; Li, Y.; Zhou, X. Agricultural Mechanization, Labor Transfer and the Growth of Farmer’s Income: A Re-examination of Causality. Chin. Rural Econ. 2017, 11, 112–127. (In Chinese) [Google Scholar]
  47. Song, L.; Cui, F. Environmental Regulation, Environmental Pollution and the Health of Residents—The Analysis of Mediating Effect and Spatial Spillover Effect. J. Xiangtan Univ. (Philos. Soc. Sci.) 2019, 43, 60–68. (In Chinese) [Google Scholar]
Figure 1. Mechanism analysis framework of ER, RRHI, and AEE.
Ijerph 19 03125 g001
Table 1. Descriptive statistical analysis.
VariablesVariable Specific DefinitionMeanSDMinimumMaximum
Agricultural electricity consumption (AEC)Agricultural electricity consumption266.3397.20.8001933
Agricultural labor force (ALF)Agriculture, forestry, animal husbandry and fishery employees × agriculture GDP/agriculture, forestry and fishing GDP945.1681.933.382765
Sown area (SA)Total crop sown area52923777103.814,903
The use of water in agriculture (IA)Irrigated area20671611109.76120
Total agricultural machinery power (TAMP)Total mechanical power322829239413,353
Fertilizer (Fert) Fertilizer input186.9148.14.700716.1
Agricultural film (AF)Agricultural film input78,07466,961441322,965
Diesel (Ds)Diesel input67.4060.461.900301.9
Pesticide (Ptc)Pesticide input55,97143,650921169,043
Agricultural output (Agr-GDP)Agricultural GDP1600119339.104974
Carbon emissions (CO2-E)Carbon emissions from agricultural production processes350.9250.713.911049
Fertilizer and film residues (FFR)Agricultural film and fertilizer residue18,15415,569102.675,094
Agriculture eco-efficiency (AEE)agro-ecological efficiency0.60070.23110.233861.1512
Environment regulation (LnER)Ln (regional GDP × (2/3(area of regional jurisdiction × 1/circumference)1/2)−1)3.9410.5752.0295.081
Industiral structure (IS)Agriculture GDP/agriculture, forestry and fishery GDP0.530.08810.3020.899
The level of agricultural mechanization (LAM)Total agricultural machinery power/total crop sown area 0.6690.3470.252.451
The sown area per capita (SAPC)Total crop area sown/rural population6.1553.2221.42219.92
Unit area labor Inputs (LI)Employees in the primary sector/total area sown to crops 0.2030.1020.0500.703
Rural residents’ health investment (Lnmedical)Ln (rural residents’ health care expenditure)2.7730.2811.7863.299
Table 2. Benchmark regression model analysis.
VariablesModel (1)Model (2)Model (3)Model (4)
AEEAEEAEEAEE
LnER0.95173 ***0.990 ***0.427 **0.879 ***
(21.69)(23.01)(2.18)(4.39)
IS 1.267 *** 1.373 ***
(6.96) (7.07)
LAM −0.289 *** −0.244 ***
(−5.27) (−4.06)
SAPC 0.0299 *** 0.0256 **
(3.25) (2.53)
LI 1.491 *** 1.328 ***
(5.80) (4.66)
cons−3.149−4.267 ***−1.193−3.856 ***
(−18.20)(−22.03)(−1.65)(−4.97)
Times-fixedNONOYESYES
Province-fixedYESYESYESYES
R20.62850.72680.66410.7441
N310310310310
Note: t-statistics in parentheses, ** p < 0.05, *** p < 0.01.
Table 3. 2 SLS Regression.
VariablesModel (5)
AEE
Model (6)
AEE
L.LnER0.8918 ***-
(0.088)
LnER-1.042 ***
(0.0568)
IS−0.04081.325 ***
(0.029)(0.2632)
LAM−0.015−0.2483 **
(0.0136)(0.0823)
SAPC−0.00160.0286 ***
(0.0015)(0.0121)
LI0.0721.453 ***
(0.033)(0.2901)
N279279
Underidentification test (Kleibergen-Paaprk LM statistic)97.88, p = 0.0000
Weak identification test (Cragg–Donald Wald F statistic):12,695.96
(Kleibergen–Paap rk Wald statistic):10,259.08
Note: Robust standard error in parentheses, ** p < 0.05, *** p < 0.01.
Table 4. Robustness Test.
VariablesModel (7)Model (8)
AEENonoutput−1
L.AEE0.128-
(1.64)-
LnER0.920 ***0.00626 **
(11.26)(2.06)
IS1.060 ***−0.0016
(6.20)(−0.53)
SAPC−0.302 ***0.00018
(−5.19)(0.35)
LAM0.0246 **0.00006
(2.09)(0.63)
LI1.683 ***−0.0012 ***
(4.94)(−0.48)
cons−3.951 ***−0.0221 ***
(−12.80)(−3.05)
Times-fixedYESYES
Province-fixedYESYES
Sargan test0.819-
AR (1)0.0369-
R2-0.226
N279310
Note: The numbers in parentheses in Model (7) of the table are z-statistics, and the numbers in parentheses in Model (8) are t-statistics; ** p < 0.05, *** p < 0.01.
Table 5. Mediating effect test.
VariablesModel (9)Model (10)Model (11)
LnmedicalAEEAEE
Lnmedical-0.172 **0.133 *
(2.13)(1.69)
LnER0.297 *-0.839 ***
(1.91)(4.17)
IS0.2161.401 ***1.344 ***
(1.43)(7.01)(6.91)
LAM−0.0524−0.137 **−0.237 ***
(−1.12)(−2.42)(−3.95)
SAPC0.0008530.01010.0255 **
(0.11)(1.05)(2.53)
LI−0.495 **0.969 ***1.394 ***
(−2.24)(3.51)(4.87)
cons1.414 **0.945 ***−4.04 ***
(2.34)(−3.78)(−5.18)
R20.90570.73020.7469
Times-fixedYESYESYES
Province-fixedYESYESYES
N310310310
Note: t-statistics in parentheses, * p < 0.10, ** p < 0.05, *** p < 0.01.
Table 6. Analysis of heterogeneity regression results.
VariablesModel (12)Model (13)Model (14)
AEEAEEAEE
LnER1.424 ***−0.1891.285 ***
(3.12)(−0.54)(3.46)
CYJG0.928 ***1.938 ***1.145 ***
(2.67)(6.54)(3.47)
LAM−0.19120.196 **−0.556 ***
(−1.52)(2.30)(−5.85)
SAPC0.0582 ***−0.0170.0883 **
(3.43)(−1.01)(2.50)
LI1.305 ***0.891.138 *
(3.24)(1.06)(1.83)
cons−6.546 **−0.105−4.772 ***
(−3.38)(−0.07)(−3.93)
R20.8640.81590.7789
Times-fixedYESYESYES
Province-fixedYESYESYES
N90110110
Note: t-statistics in parentheses, * p < 0.10, ** p < 0.05, *** p < 0.01.
Publisher’s Note: MDPI stays neutral with regard to jurisdictional claims in published maps and institutional affiliations.

