
What Affects the Economic Resilience of China’s Yellow River Basin Amid Economic Crisis—From the Perspective of Spatial Heterogeneity


Abstract
: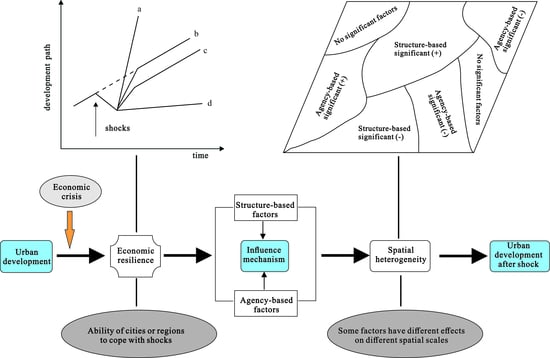
1. Introduction
2. Review of Literature
3. Study Area and Possible Influencing Factors
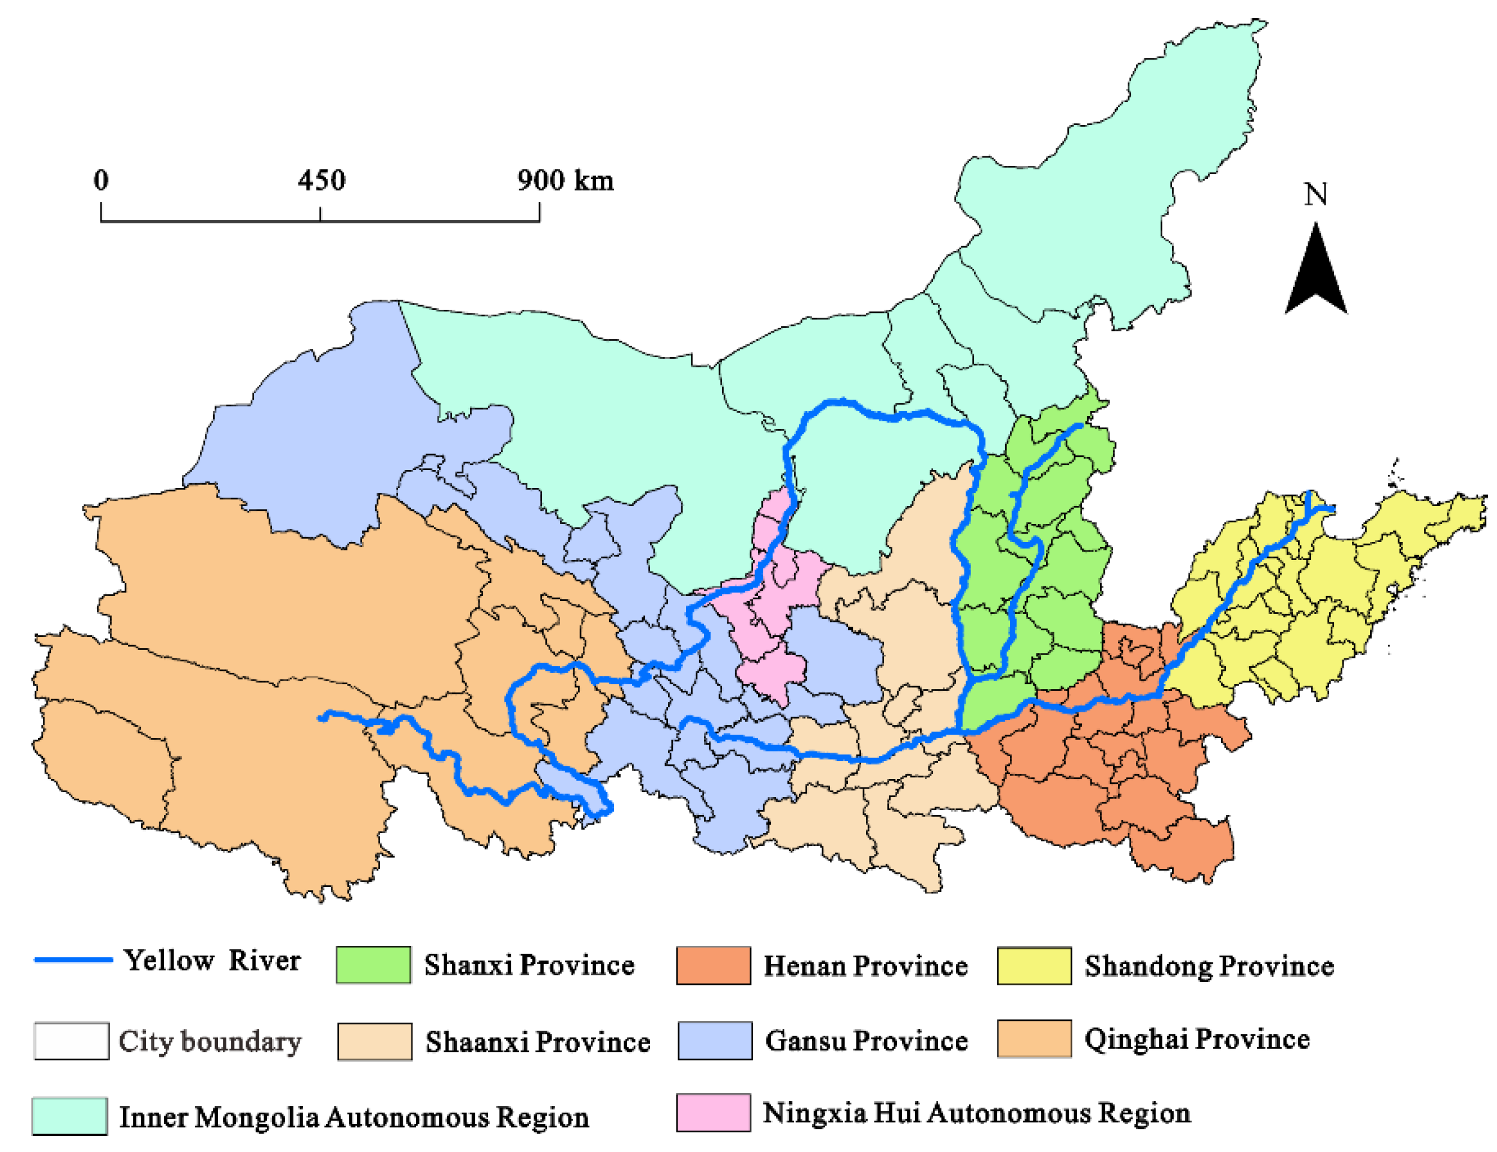
3.1. Study Area and Period Division
3.2. Research Methods
3.2.1. Measurement of Regional Economic Resilience
3.2.2. Multi-Scale Geographical Weighted Regression (MGWR)
3.3. Possible Influencing Factors of the Yellow River Basin’s Economic Resilience
3.3.1. Industrial Structure
3.3.2. Opening to the Global Economy
3.3.3. Government Agency
3.3.4. Financial Market
3.3.5. Resource-Based Economy
3.3.6. The Environmental Condition of the Yellow River Basin
3.3.7. Urban Hierarchy
3.4. Data Sources
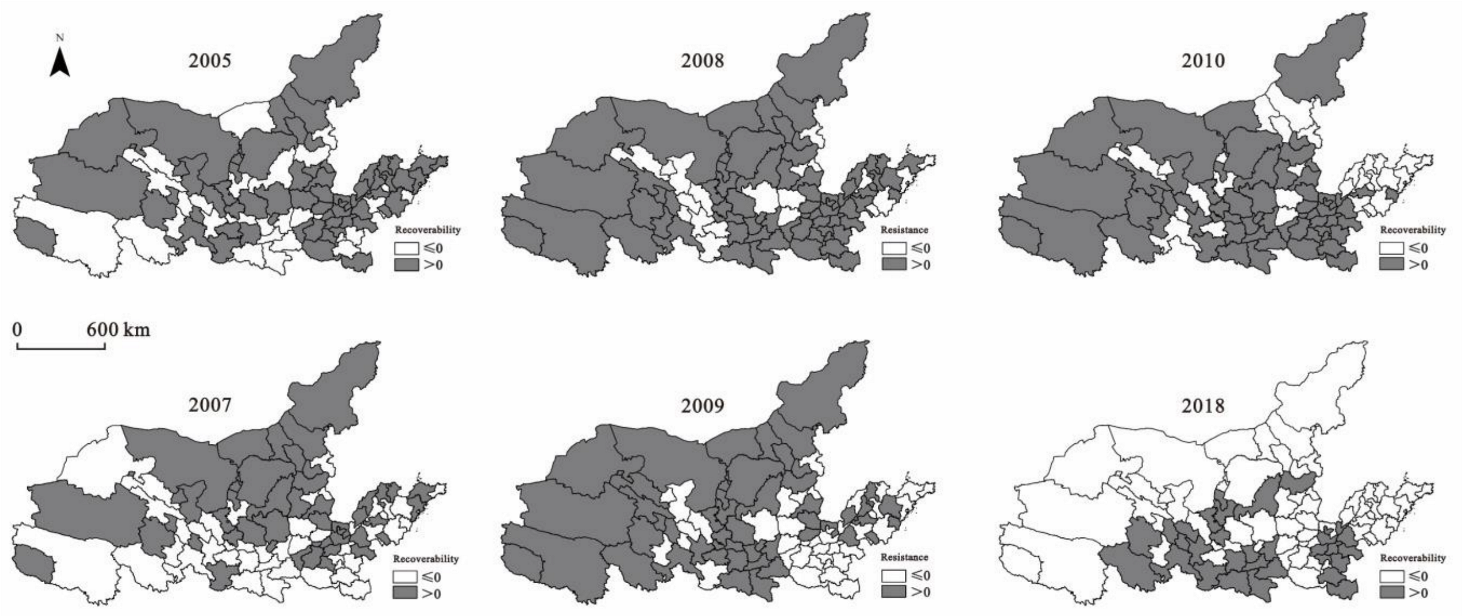
4. Spatiotemporal Evolution Characteristics of Regional Economic Resilience
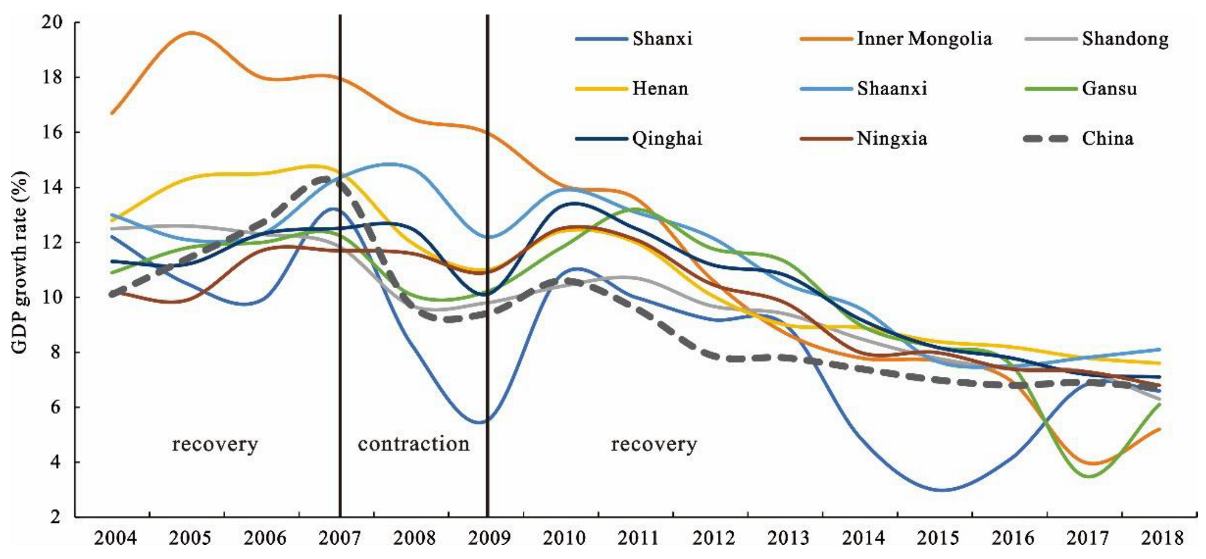
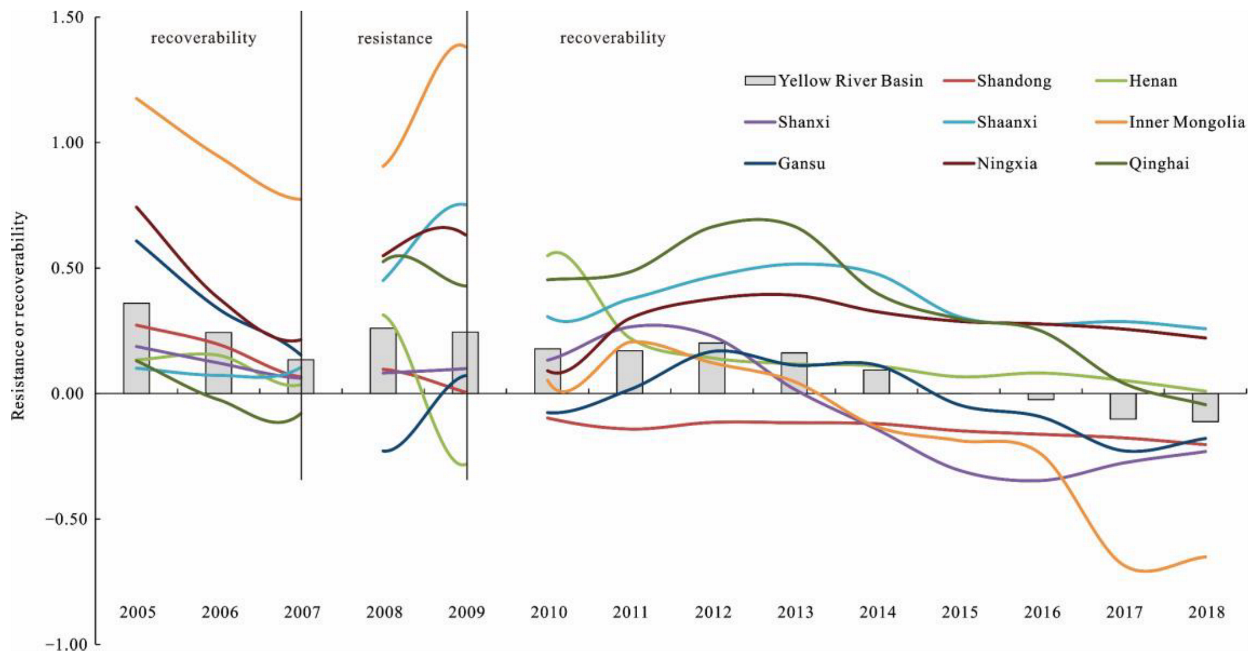
4.1. Temporal Evolution Characteristics
4.2. Spatial Evolution Characteristics
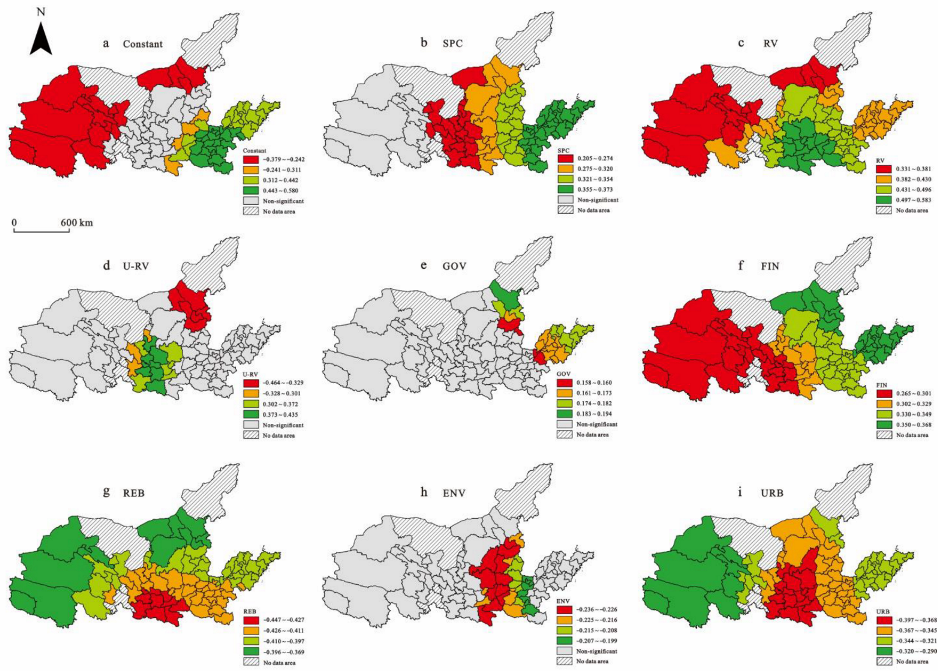
5. Determinants of Economic Resilience in the Yellow River Basin
5.1. Model Comparison and Scale Analysis
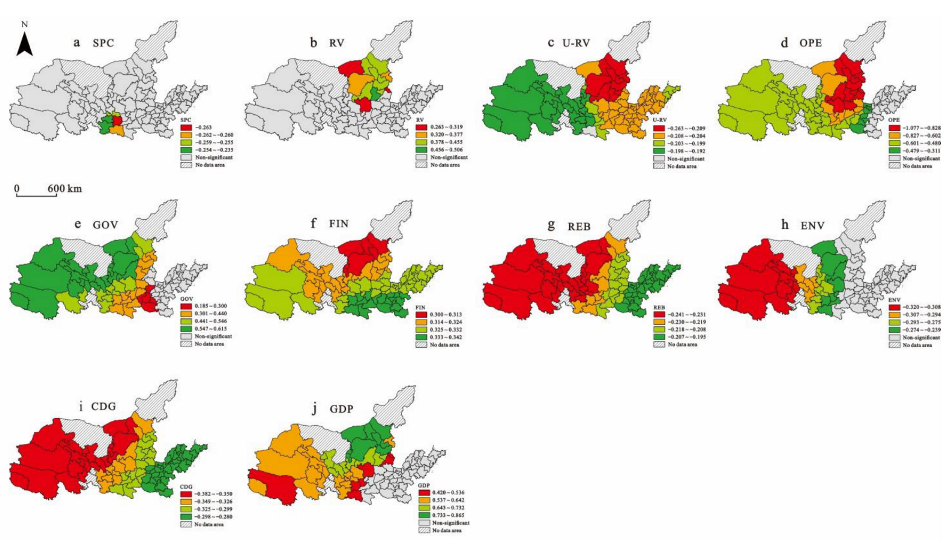
5.2. Spatial Pattern Analysis of Influencing Factors
5.2.1. Resistance in 2008–2009
5.2.2. Recoverability in 2010–2018
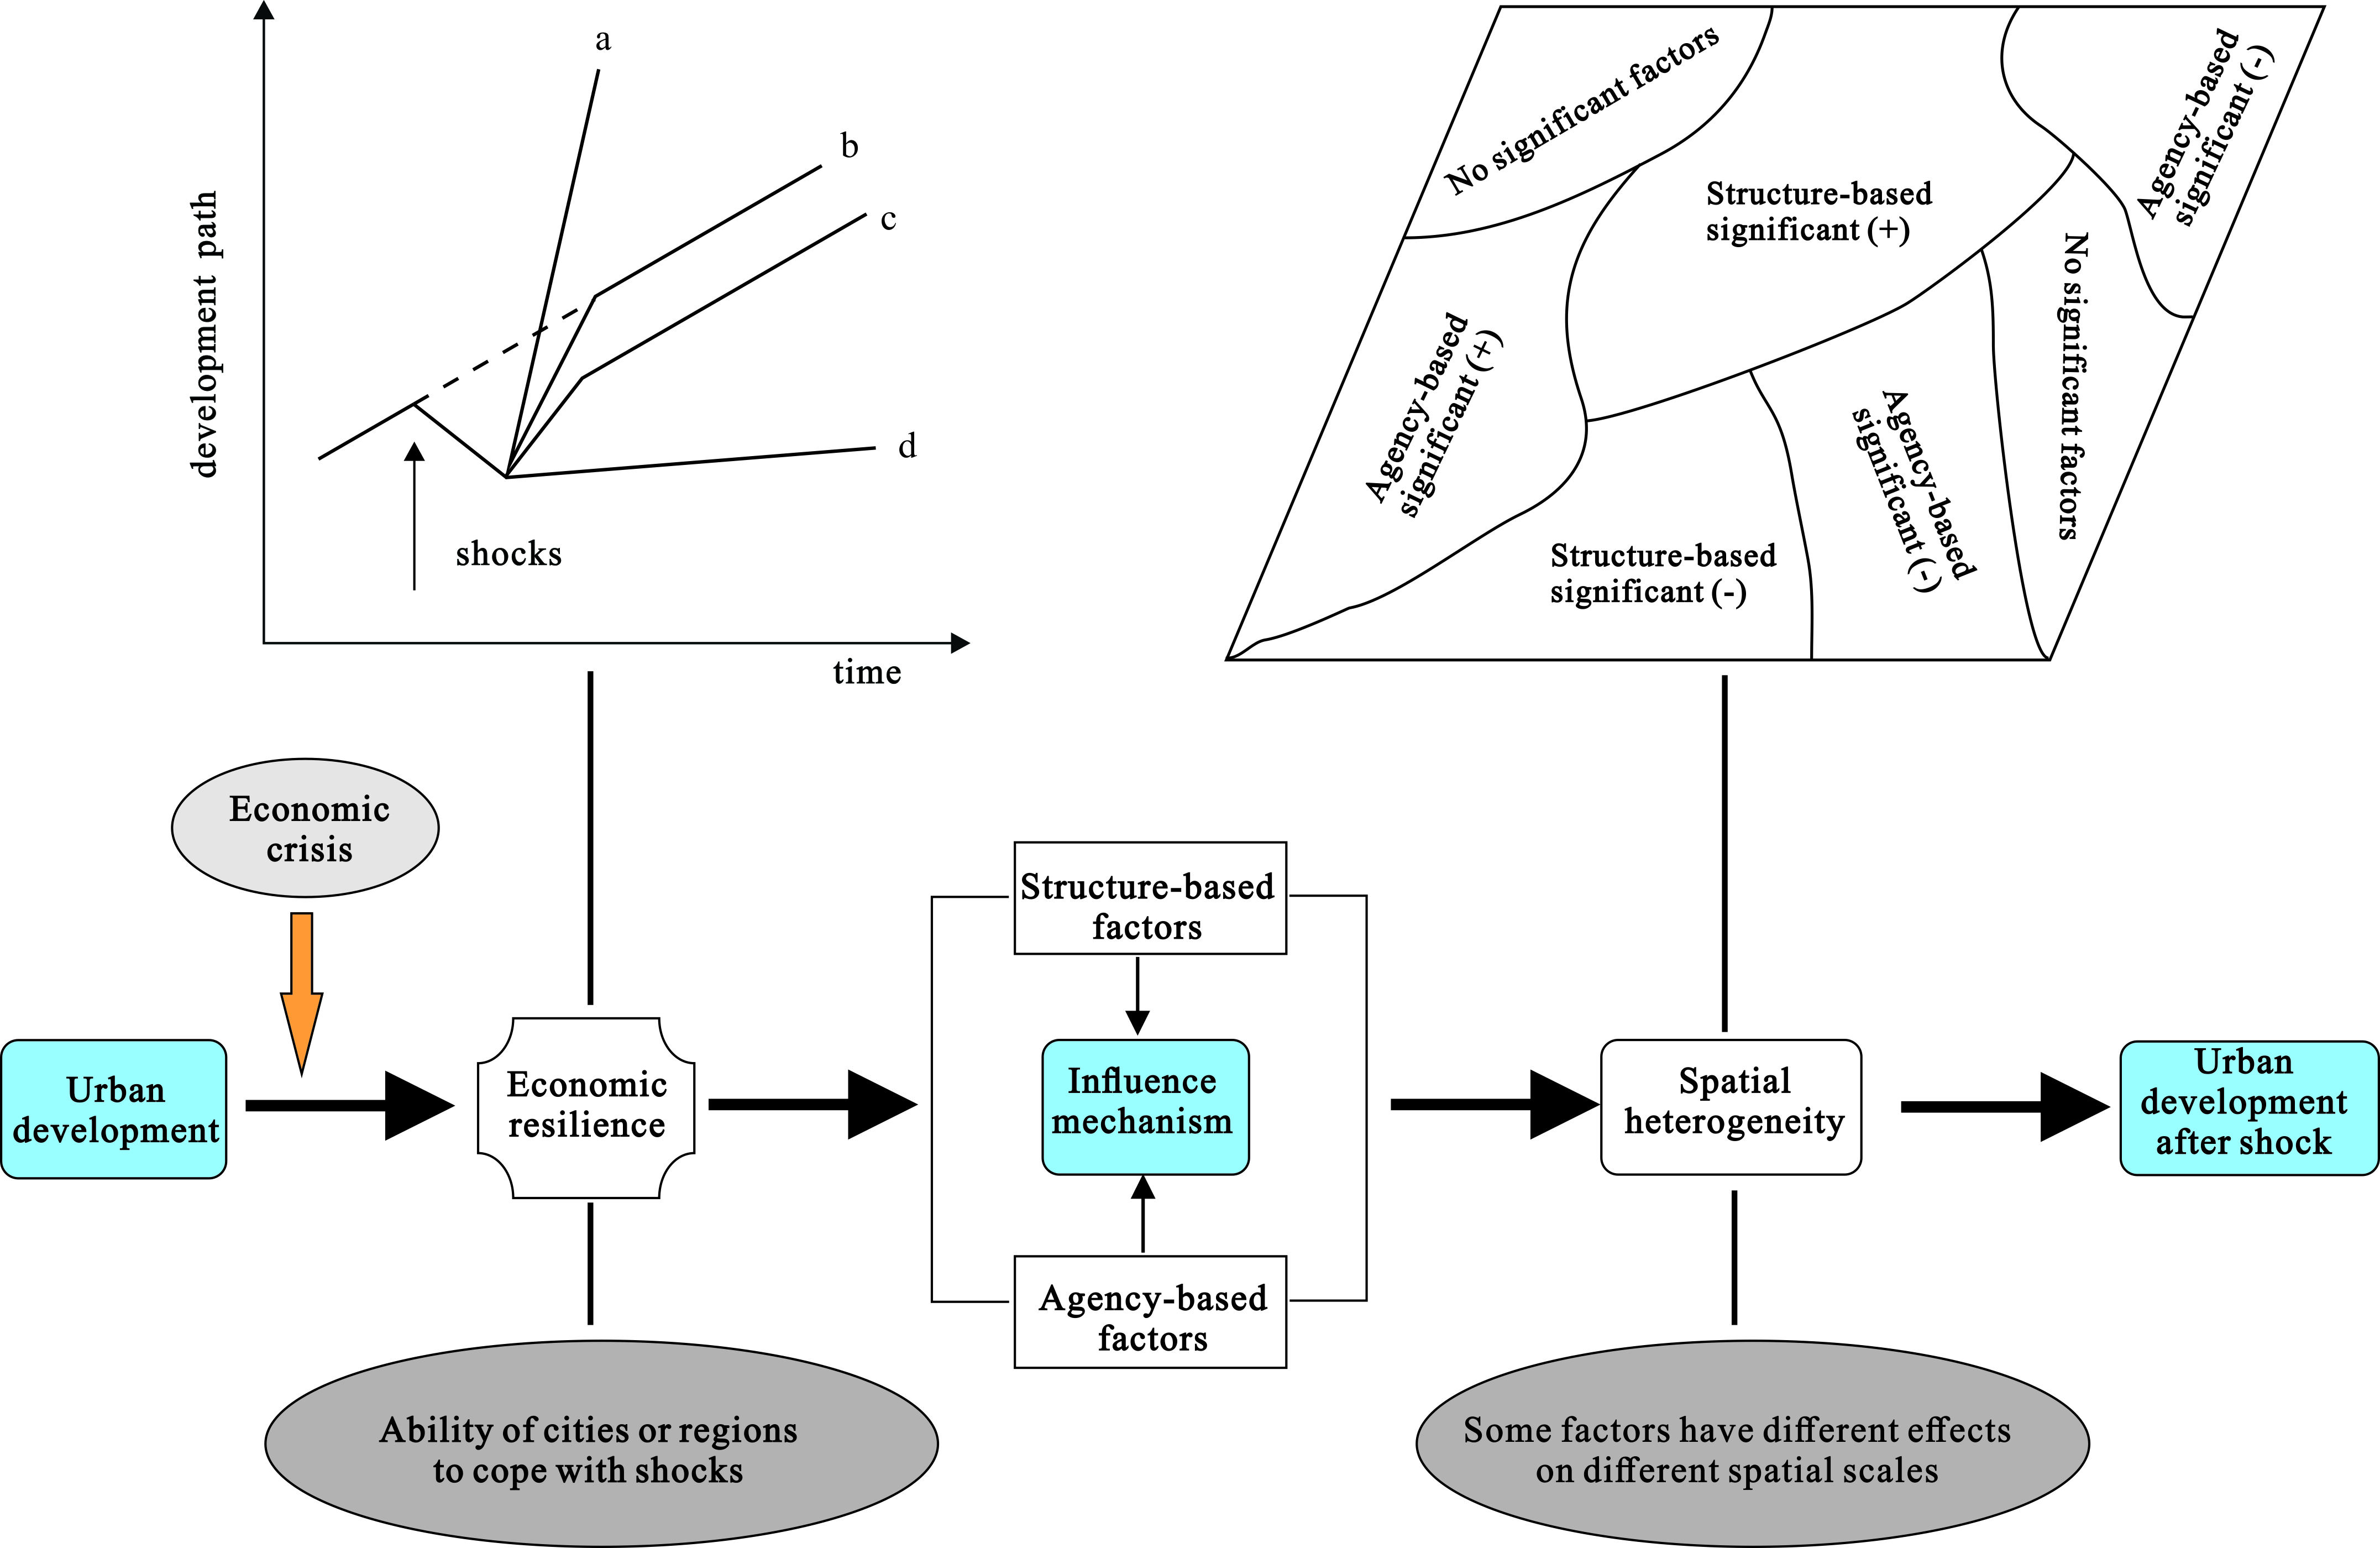
6. Conclusions
- (1)
- The resistance of the Yellow River Basin to the financial crisis was high, and it was less affected by the shock in the early stage, but it showed a small decline. The recoverability of the Yellow River Basin after the shock was weak, showing a significant downward trend with the evolution of time. In the long run, the Yellow River Basin could not adapt to the new environment. The economic resilience of the Yellow River Basin showed significant spatial agglomeration and difference characteristics.
- (2)
- In the resistance period and recovery period, the influence mechanism of economic resilience in the Yellow River Basin was significantly different. However, spatial heterogeneity played a significant role in different periods. Related variety, government agency, environment, and opening to the global economy had a significant effect on economic resilience only in a specific small range, beyond which the impact was small. Specialization, unrelated variety, and location had opposite effects in different regions of the Yellow River Basin.
- (3)
- Structural factors still played a significant role in regional economic resilience, but the influence mechanism was changed in different periods. Specialization limited the area’s resistance to shock but enhanced the recoverability after the shock. Related variety significantly improved the regional ability to cope with the shock by giving full play to the “shock absorber”. Unrelated variety was not conducive to regional resistance to the shock and had opposite effects on the recoverability in different regions.
- (4)
- Government agency and financial market significantly promoted the regional economic resistance and recoverability. Environment pollution and resource-based economic structure significantly limited the regional economic resistance and recoverability. Opening to the global economy and urban hierarchy limited the regional resistance to the shock, but strong economic development had the opposite effect of improved regional resistance. The location in the east of the Yellow River Basin enhanced the recoverability; however, the location in the west limited the recoverability.
7. Discussion
Author Contributions
Funding
Institutional Review Board Statement
Informed Consent Statement
Data Availability Statement
Conflicts of Interest
References
- Chen, Y.; Su, X.; Zhou, Q. Study on the Spatiotemporal Evolution and Influencing Factors of Urban Resilience in the Yellow River Basin. Int. J. Environ. Res. Public Health 2021, 18, 10231. [Google Scholar] [CrossRef] [PubMed]
- Giannakis, E.; Bruggeman, A. Economic crisis and regional resilience: Evidence from Greece. Pap. Reg. Sci. 2017, 96, 451–476. [Google Scholar] [CrossRef]
- Li, L.; Liu, S.; Li, C.; Zhang, P.; Lo, K. What Matters for Regional Economic Resilience Amid Multi Shock Situations: Structural or Agency? Evidence from Resource-Based Cities in China. Sustainability 2022, 14, 5701. [Google Scholar] [CrossRef]
- Martin, R.; Gardiner, B. The resilience of cities to economic shocks: A tale of four recessions (and the challenge of Brexit). Pap. Reg. Sci. 2019, 98, 1801–1832. [Google Scholar] [CrossRef]
- McCartney, G.; Pinto, J.; Liu, M. City resilience and recovery from COVID-19: The case of Macao. Cities 2021, 112, 103130. [Google Scholar] [CrossRef]
- Boschma, R. Towards an Evolutionary Perspective on Regional Resilience. Reg. Stud. 2015, 49, 733–751. [Google Scholar] [CrossRef] [Green Version]
- Balland, P.; Rigby, D.; Boschma, R. The technological resilience of US Cities. Camb. J. Reg. Econ. Soc. 2015, 8, 167–184. [Google Scholar] [CrossRef]
- Martin, R.; Sunley, P.; Gardiner, B.; Tyle, P. How Regions React to Recessions: Resilience and the Role of Economic Structure. Reg. Stud. 2016, 50, 561–585. [Google Scholar] [CrossRef] [Green Version]
- Shi, T.; Qiao, Y.; Zhou, Q.; Zhang, J. The regional differences and random convergence of urban resilience in China. Technol. Econ. Dev. Econ. 2022, 28, 979–1002. [Google Scholar] [CrossRef]
- Martin, R. Regional economic resilience, hysteresis and recessionary shocks. J. Econ. Geogr. 2012, 12, 1–32. [Google Scholar] [CrossRef]
- Hu, X.; Hassink, R. Exploring adaptation and adaptability in uneven economic resilience: A tale of two Chinese mining regions. Camb. J. Reg. Econ. Soc. 2017, 10, 527–541. [Google Scholar] [CrossRef]
- Tan, J.; Hu, X.; Hassink, R.; Ni, J. Industrial structure or agency: What affects regional economic resilience? Evidence from resource-based cities in China. Cities 2020, 106, 102906. [Google Scholar] [CrossRef]
- Martin, R.; Sunley, P. Regional economic resilience: Evolution and evaluation. In Handbook on Regional Economic Resilience; Bristow, G., Healy, A., Eds.; Edward Elgar: Cheltenham, UK, 2020; pp. 10–35. [Google Scholar]
- Hassink, R. Regional resilience: A promising concept to explain differences in regional economic adaptability? Camb. J. Reg. Econ. Soc. 2010, 3, 45–58. [Google Scholar] [CrossRef]
- Reggiani, A.; De Graaff, T.; Nijkamp, P. Resilience: An Evolutionary Approach to Spatial Economic Systems. Netw. Spat. Econ. 2002, 2, 211–229. [Google Scholar] [CrossRef]
- Martin, R.; Gardiner, B. The resilience of Britain’s core cities to the great recession (with implications for the COVID recessionary shock). In Economic Resilience in Regions and Organisations; Wink, R., Ed.; Springer: Berlin/Heidelberg, Germany, 2021; pp. 57–89. [Google Scholar]
- Hu, X.; Li, L.; Dong, K. What matters for regional economic resilience amid COVID-19? Evidence from cities in Northeast China. Cities 2021, 120, 103440. [Google Scholar] [CrossRef] [PubMed]
- Shi, T.; Qiao, Y.; Zhou, Q. Spatiotemporal evolution and spatial relevance of urban resilience: Evidence from cities of China. Growth Chang. 2021, 52, 2364–2390. [Google Scholar] [CrossRef]
- Liu, K.; Qiao, Y.; Shi, T.; Zhou, Q. Study on coupling coordination and spatiotemporal heterogeneity between economic development and ecological environment of cities along the Yellow River Basin. Environ. Sci. Pollut. Res. 2021, 28, 6898–6912. [Google Scholar] [CrossRef]
- Drozdowski, G. Economic calculus qua an instrument to support sustainable development under increasing risk. J. Risk Financ. Manag. 2021, 14, 15. [Google Scholar] [CrossRef]
- Chen, Y.P.; Fu, B.J.; Zhao, Y.; Wang, K.B.; Zhao, M.M.; Ma, J.F.; Wu, J.H.; Xu, C.; Liu, W.G.; Wang, H. Sustainable development in the Yellow River Basin: Issues and strategies. J. Clean. Prod. 2020, 263, 121223. [Google Scholar] [CrossRef]
- Aven, T.; Renn, O. On risk defined as an event where the outcome is uncertain. J. Risk Res. 2009, 12, 1–11. [Google Scholar] [CrossRef]
- Klinke, A. Public understanding of risk and risk governance. J. Risk Res. 2021, 24, 2–13. [Google Scholar] [CrossRef]
- Zhou, Q.; Zhu, M.; Qiao, Y.; Zhang, X.; Chen, J. Achieving resilience through smart cities? Evidence from China. Habitat Int. 2021, 111, 102348. [Google Scholar] [CrossRef]
- Holling, C. Resilience and Stability of Ecological Systems. Annu. Rev. Ecol. Syst. 1973, 4, 1–23. [Google Scholar] [CrossRef] [Green Version]
- Martin, R.; Sunley, P. On the notion of regional economic resilience: Conceptualization and explanation. J. Econ. Geogr. 2015, 15, 1–42. [Google Scholar] [CrossRef] [Green Version]
- Simmie, J.; Martin, R. The economic resilience of regions: Towards an evolutionary approach. Camb. J. Reg. Econ. Soc. 2010, 3, 27–43. [Google Scholar] [CrossRef] [Green Version]
- Hu, X.; Yang, C. Institutional change and divergent economic resilience: Path development of two resource-depleted cities in China. Urban Stud. 2019, 56, 3466–3485. [Google Scholar] [CrossRef]
- Li, L.; Zhang, P.; Li, X. Regional Economic Resilience of the Old Industrial Bases in China—A Case Study of Liaoning Province. Sustainability 2019, 11, 723. [Google Scholar] [CrossRef] [Green Version]
- Kurikka, H.; Grillitsch, M. Resilience in the periphery: What an agency perspective can bring to the table. In Economic Resilience in Regions and Organisations; Wink, R., Ed.; Springer: Berlin/Heidelberg, Germany, 2021; pp. 147–171. [Google Scholar]
- Di Pietro, F.; Lecca, P.; Salotti, S. Regional economic resilience in the European Union: A numerical general equilibrium analysis. Spat. Econ. Anal. 2021, 16, 287–312. [Google Scholar] [CrossRef]
- Ringwood, L.; Watson, P.; Lewin, P. A quantitative method for measuring regional economic resilience to the great recession. Growth Chang. 2019, 50, 381–4022. [Google Scholar] [CrossRef] [Green Version]
- Sensier, M.; Devine, F. Understanding regional economic performance and resilience in the UK: Trends since the global financial crisis. Natl. Inst. Econ. Rev. 2020, 253, 18–28. [Google Scholar] [CrossRef]
- Eraydin, A. Attributes and characteristics of regional resilience: Defining and measuring the resilience of Turkish regions. Reg. Stud. 2016, 50, 600–614. [Google Scholar] [CrossRef]
- Fingleton, B.; Garretsen, H.; Martin, R. Recessionary shocks and regional employment: Evidence on the resilience of UK regions. J. Reg. Sci. 2012, 52, 109–133. [Google Scholar] [CrossRef]
- Giannakis, E.; Bruggeman, A. Regional disparities in economic resilience in the European Union across the urban-rural divide. Reg. Stud. 2020, 54, 1200–1213. [Google Scholar] [CrossRef]
- Tan, J.; Lo, K.; Qiu, F.; Zhang, X.; Zhao, H. Regional economic resilience of resource-based cities and influential factors during economic crises in China. Growth Chang. 2020, 51, 362–381. [Google Scholar] [CrossRef]
- Bruneckiene, J.; Palekienė, O.; Simanavičienė, Ž.; Rapsikevičius, J. Measuring regional resilience to economic shocks by index. Eng. Econ. 2018, 29, 405–418. [Google Scholar] [CrossRef] [Green Version]
- Zhang, Y.; Zhang, J.; Wang, K.; Wu, X. An Empirical Perception of Economic Resilience Responded to the COVID-19 Epidemic Outbreak in Beijing–Tianjin–Hebei Urban Agglomeration, China: Characterization and Interaction. Int. J. Environ. Res. Public Health 2021, 18, 10532. [Google Scholar] [CrossRef]
- Li, L.; Zhang, P.; Lo, K.; Liu, W.; Li, J. The evolution of regional economic resilience in the old industrial bases in China: A case study of Liaoning Province, China. Chin. Geogr. Sci. 2020, 30, 340–351. [Google Scholar] [CrossRef] [Green Version]
- Bristow, G.; Healy, A. Regional resilience: An agency perspective. Reg. Stud. 2014, 48, 923–935. [Google Scholar] [CrossRef]
- Goodchild, M. Models of scale and scales of modelling. In Modelling Scale in Geographical Information Science; Tate, N.J., Atkinson, P.M., Eds.; John Wiley and Sons: Hoboken, NJ, USA, 2001; pp. 3–10. [Google Scholar]
- Song, C.; Yin, G.; Lu, Z.; Chen, Y. Industrial ecological efficiency of cities in the Yellow River Basin in the background of China’s economic transformation: Spatial-temporal characteristics and influencing factors. Environ. Sci. Pollut. Res. 2022, 29, 4334–4349. [Google Scholar] [CrossRef]
- Yu, H.; Fotheringham, A.; Li, Z.; Oshan, T.; Wei, K.; Wolf, L. Inference in multiscale geographically weighted regression. Geogr. Anal. 2019, 52, 87–106. [Google Scholar] [CrossRef]
- Angulo, A.; Mur, F.; Trivez, F. Measuring resilience to economic shocks: An application to Spain. Ann. Reg. Sci. 2018, 60, 349–373. [Google Scholar] [CrossRef]
- Elmqvist, T.; Andersson, E.; Frantzeskaki, N.; McPhearson, T.; Olsson, P.; Gaffney, O.; Takeuchi, K.; Folke, C. Sustainability and resilience for transformation in the urban century. Nat. Sustain. 2019, 2, 267–273. [Google Scholar] [CrossRef]
- Mazzola, F.; Pizzuto, P.; Ruggieri, G. The role of tourism in island economic growth and resilience: A panel analysis for the European Mediterranean countries (2000–2015). J. Econ. Stud. 2019, 46, 1418–1436. [Google Scholar] [CrossRef]
- Di Caro, P. Testing and explaining economic resilience with an application to Italian regions. Pap. Reg. Sci. 2017, 96, 93–113. [Google Scholar] [CrossRef] [Green Version]
- Wang, Z.; Wei, W. Regional economic resilience in China: Measurement and determinants. Reg. Stud. 2021, 55, 1228–1239. [Google Scholar] [CrossRef]
- Ezcurra, R.; Rios, V. Quality of government and regional resilience in the European Union. Evidence from the Great Recession. Pap. Reg. Sci. 2019, 98, 1267–1290. [Google Scholar] [CrossRef]
- Kitsos, T. Economic resilience in Great Britain: An empirical analysis at the local authority district level. In Handbook on Regional Economic Resilience; Bristow, G., Healy, A., Eds.; Edward Elgar: Cheltenham, UK, 2020; pp. 190–207. [Google Scholar]
- Giannakis, E.; Bruggeman, A. Determinants of regional resilience to economic crisis: A European perspective. Eur. Plan. Stud. 2017, 25, 1394–1415. [Google Scholar] [CrossRef]
- Zhou, Q.; Zhong, S.; Shi, T.; Zhang, X. Environmental regulation and haze pollution: Neighbor-companion or neighbor-beggar? Energy Policy 2021, 151, 112183. [Google Scholar] [CrossRef]
- Ženka, J.; Slach, O.; Pavlik, A. Economic resilience of metropolitan, old industrial, and rural regions in two subsequent recessionary shocks. Eur. Plan. Stud. 2019, 27, 2288–2311. [Google Scholar] [CrossRef]


| Variable | Definition | Unit |
|---|---|---|
| Regional economic resilience | Resistance and recoverability index | |
| Specialization | Specialization index (SPC) | |
| Related variety | Related variety index (RV) | |
| Unrelated variety | Unrelated variety index (U-RV) | |
| Openness | Total import and export/GDP (OPE) | % |
| Government agency | Fixed asset investment/GDP (GOV) | % |
| Financial market | Deposits of banking system national/GDP (FIN) | % |
| Resource-based economy | Proportion of employed persons in mining industry (REB) | % |
| Environment | Carbon emissions (ENV) | Million tons |
| Urban hierarchy | 0 for urban population less than 0.5 million, 1 for urban population between 0.5 and 1 million, and 2 for urban population greater than 1 million (CDG) | |
| Urban development | Per capita GDP (GDP) | CNY |
| Urbanization | Ratio of urban population to total population (URB) | % |
| OLS | MGWR | |||
|---|---|---|---|---|
| Coefficient (2008–2009) | Coefficient (2010–2018) | Bandwidth (2008–2009) | Bandwidth (2010–2018) | |
| Constant | 0.000 | 0.000 | 85 | 44 |
| SPC | 0.069 | −0.075 | 44 | 81 |
| RV | 0.124 | 0.252 * | 53 | 79 |
| U-RV | −0.084 | −0.113 | 85 | 44 |
| OPE | −0.336 ** | 0.036 | 57 | 85 |
| GOV | 0.443 *** | 0.109 | 55 | 83 |
| FIN | 0.181 | 0.312 *** | 85 | 85 |
| REB | −0.122 | −0.268 ** | 85 | 85 |
| ENV | 0.064 | −0.086 | 72 | 81 |
| CDG | −0.273 ** | 0.047 | 85 | 85 |
| GDP | 0.273 * | −0.147 | 48 | 85 |
| URB | 0.225 | −0.244 * | 85 | 85 |
| R2 | 0.418 | 0.408 | 0.727 | 0.696 |
| Log-L | −99.901 | −100.624 | −66.952 | −71.678 |
| AIC | 223.802 | 225.247 | 191.099 | 193.483 |
Publisher’s Note: MDPI stays neutral with regard to jurisdictional claims in published maps and institutional affiliations. |
© 2022 by the authors. Licensee MDPI, Basel, Switzerland. This article is an open access article distributed under the terms and conditions of the Creative Commons Attribution (CC BY) license (https://creativecommons.org/licenses/by/4.0/).
Share and Cite
Li, L.; Zhang, P.; Wang, C. What Affects the Economic Resilience of China’s Yellow River Basin Amid Economic Crisis—From the Perspective of Spatial Heterogeneity. Int. J. Environ. Res. Public Health 2022, 19, 9024. https://doi.org/10.3390/ijerph19159024
Li L, Zhang P, Wang C. What Affects the Economic Resilience of China’s Yellow River Basin Amid Economic Crisis—From the Perspective of Spatial Heterogeneity. International Journal of Environmental Research and Public Health. 2022; 19(15):9024. https://doi.org/10.3390/ijerph19159024
Chicago/Turabian StyleLi, Liangang, Pingyu Zhang, and Chengxin Wang. 2022. "What Affects the Economic Resilience of China’s Yellow River Basin Amid Economic Crisis—From the Perspective of Spatial Heterogeneity" International Journal of Environmental Research and Public Health 19, no. 15: 9024. https://doi.org/10.3390/ijerph19159024
APA StyleLi, L., Zhang, P., & Wang, C. (2022). What Affects the Economic Resilience of China’s Yellow River Basin Amid Economic Crisis—From the Perspective of Spatial Heterogeneity. International Journal of Environmental Research and Public Health, 19(15), 9024. https://doi.org/10.3390/ijerph19159024