
European Epidemiological Patterns of Cannabis- and Substance-Related Body Wall Congenital Anomalies: Geospatiotemporal and Causal Inferential Study


Abstract
1. Introduction
2. Methods
2.1. Data
2.1.1. Derived Data
2.1.2. Data Imputation
2.2. Statistics
2.3. Covariate Selection
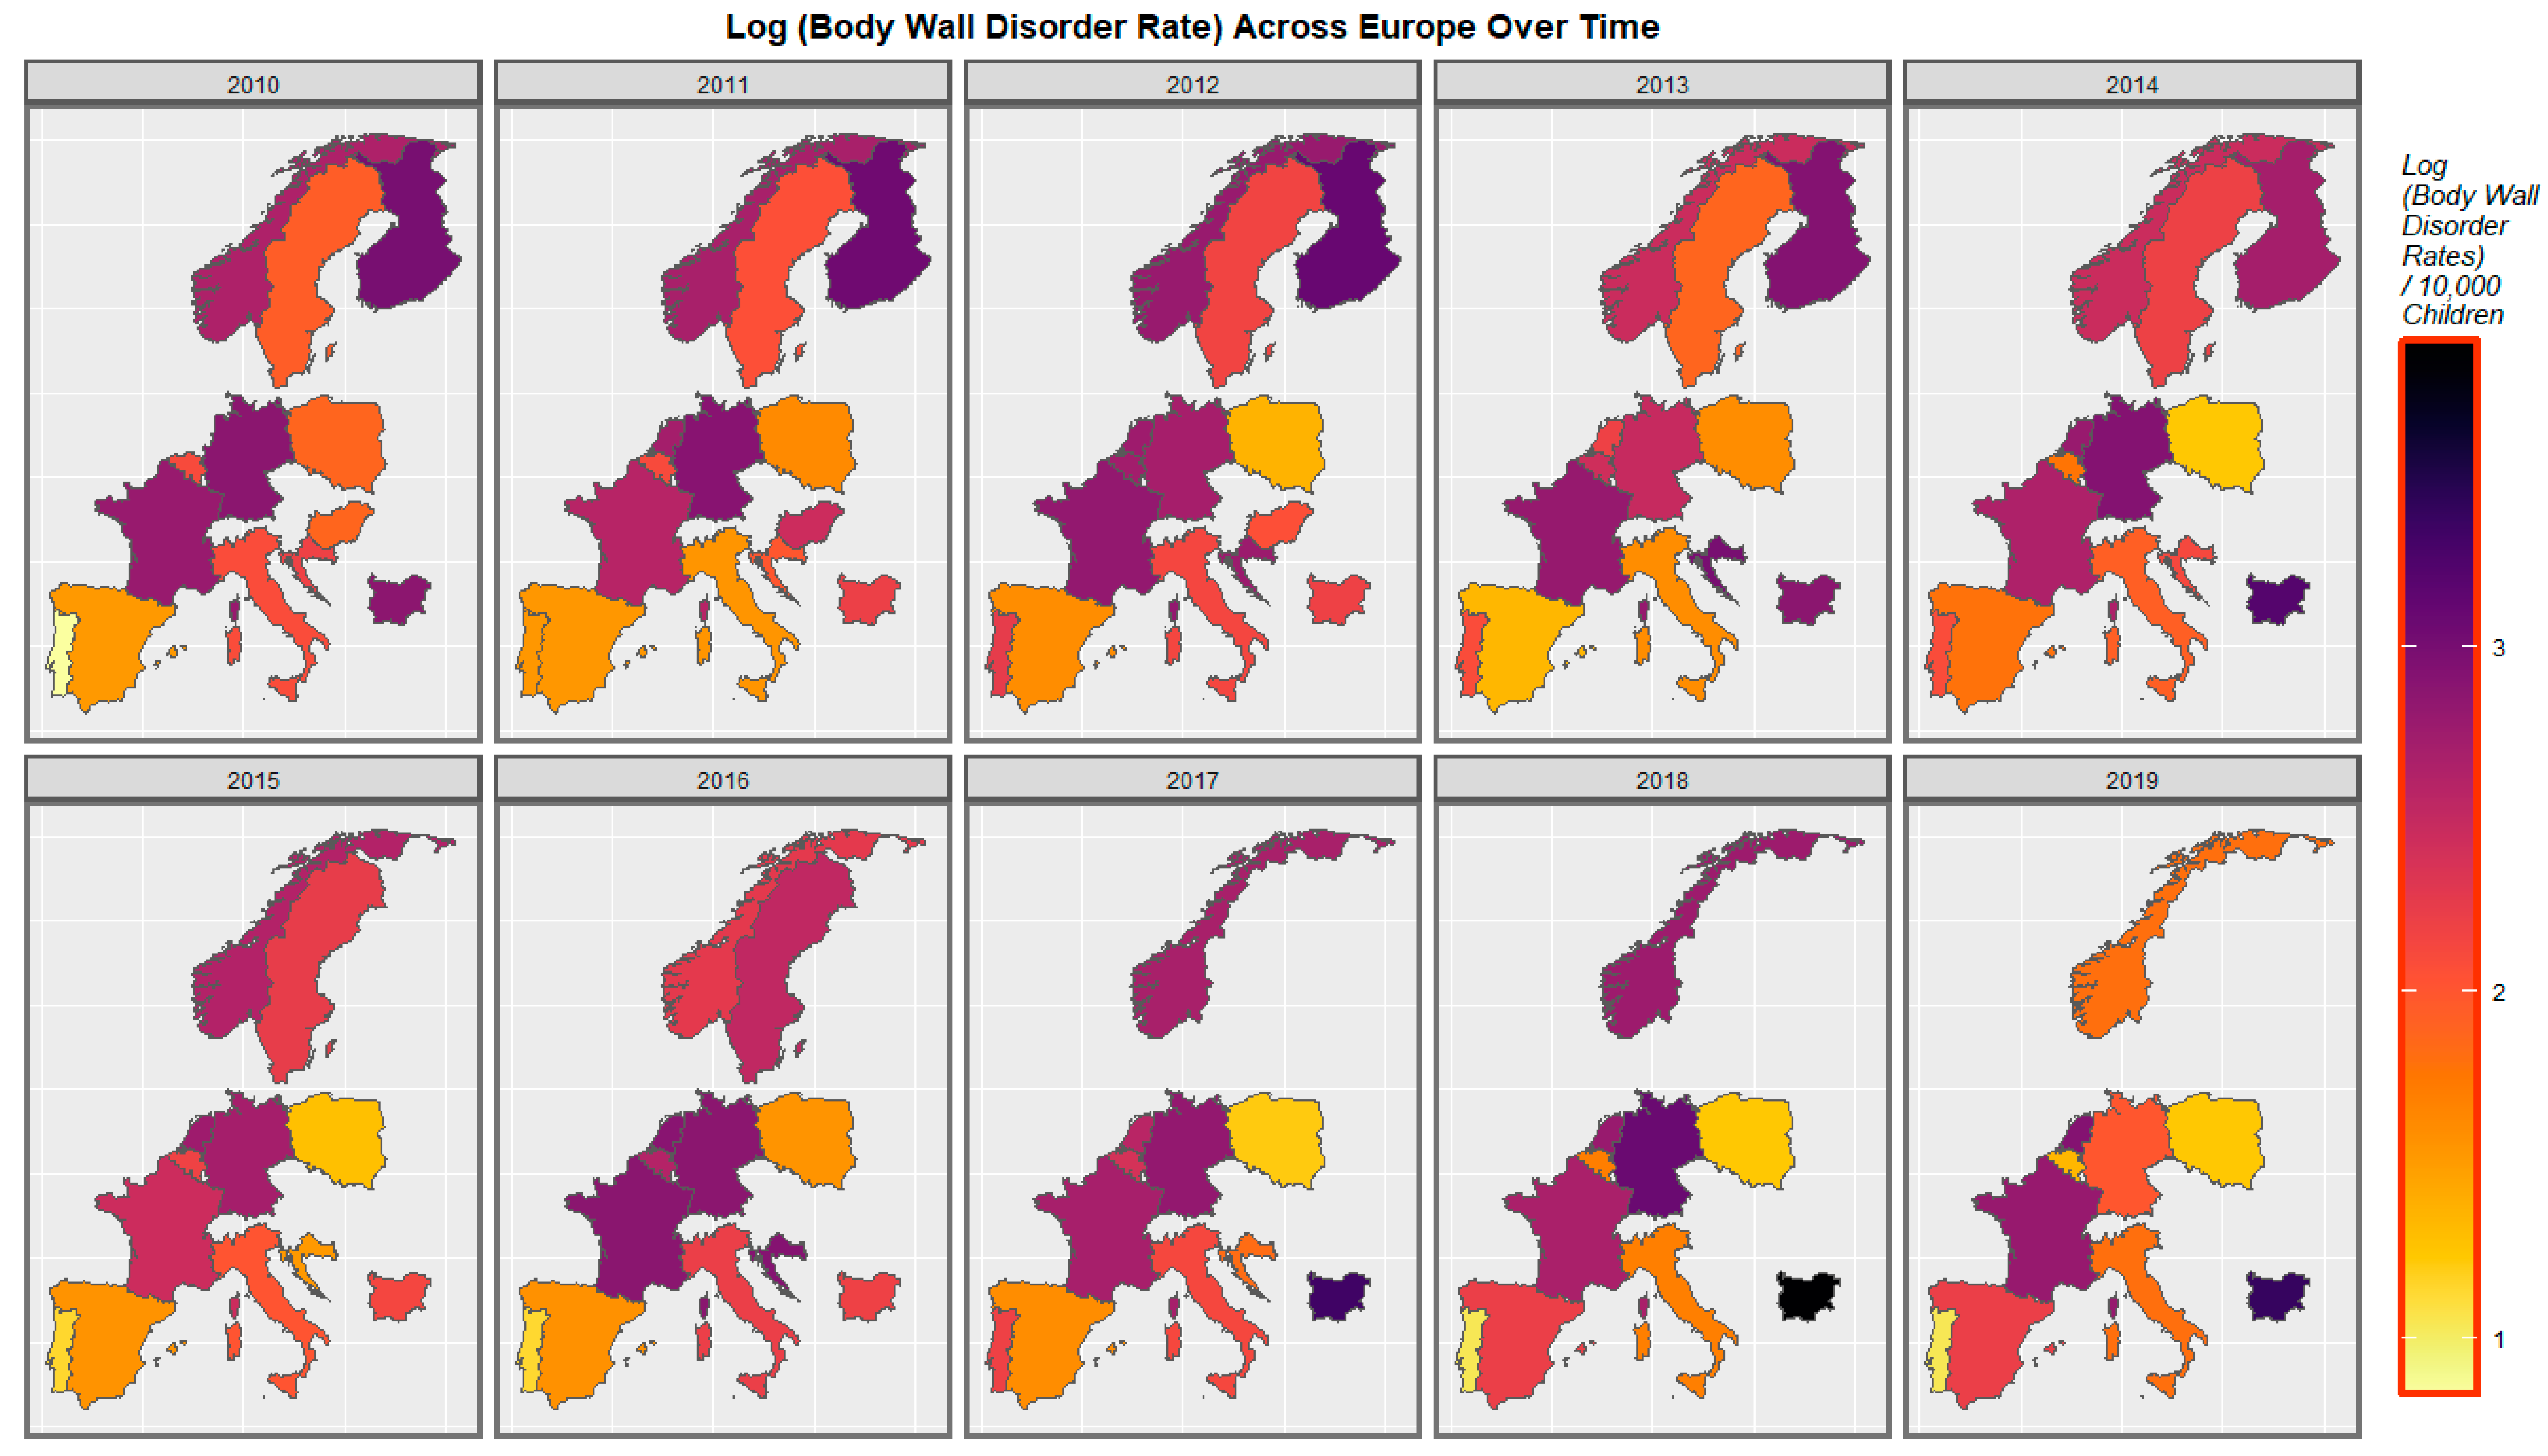
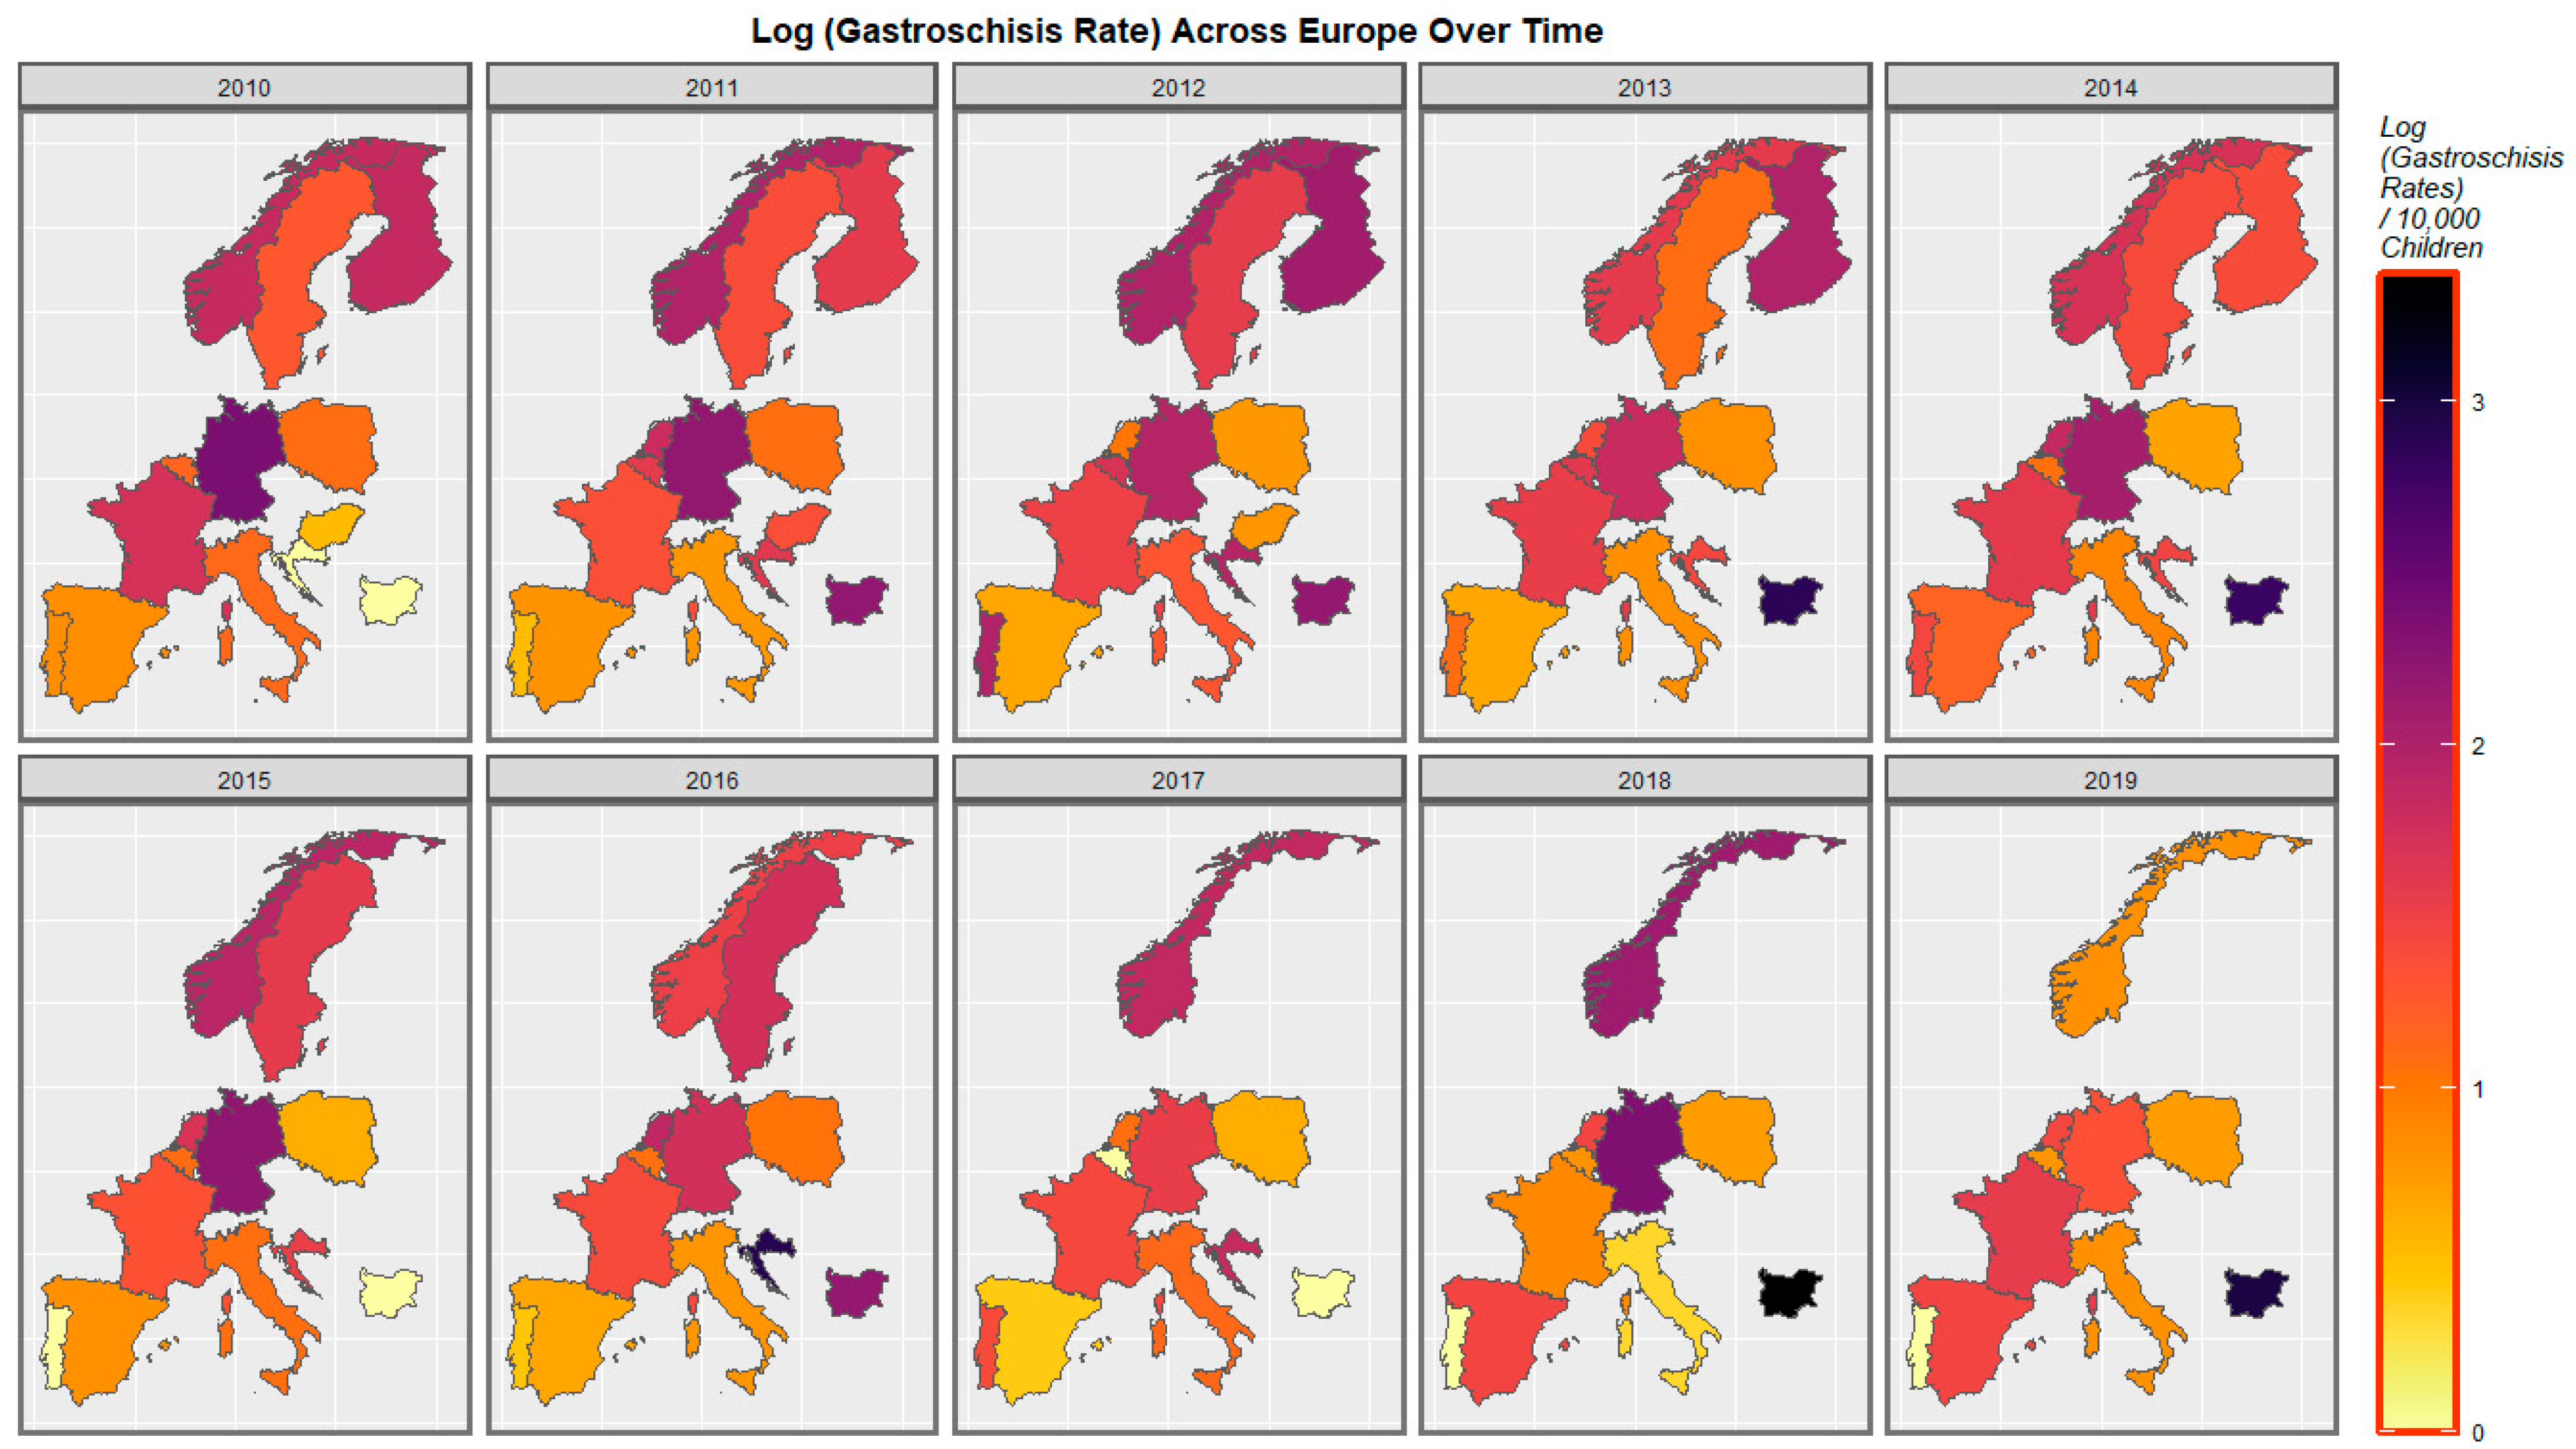
2.4. Panel and Geospatial Analysis
2.5. Causal Inference
2.6. Data Availability
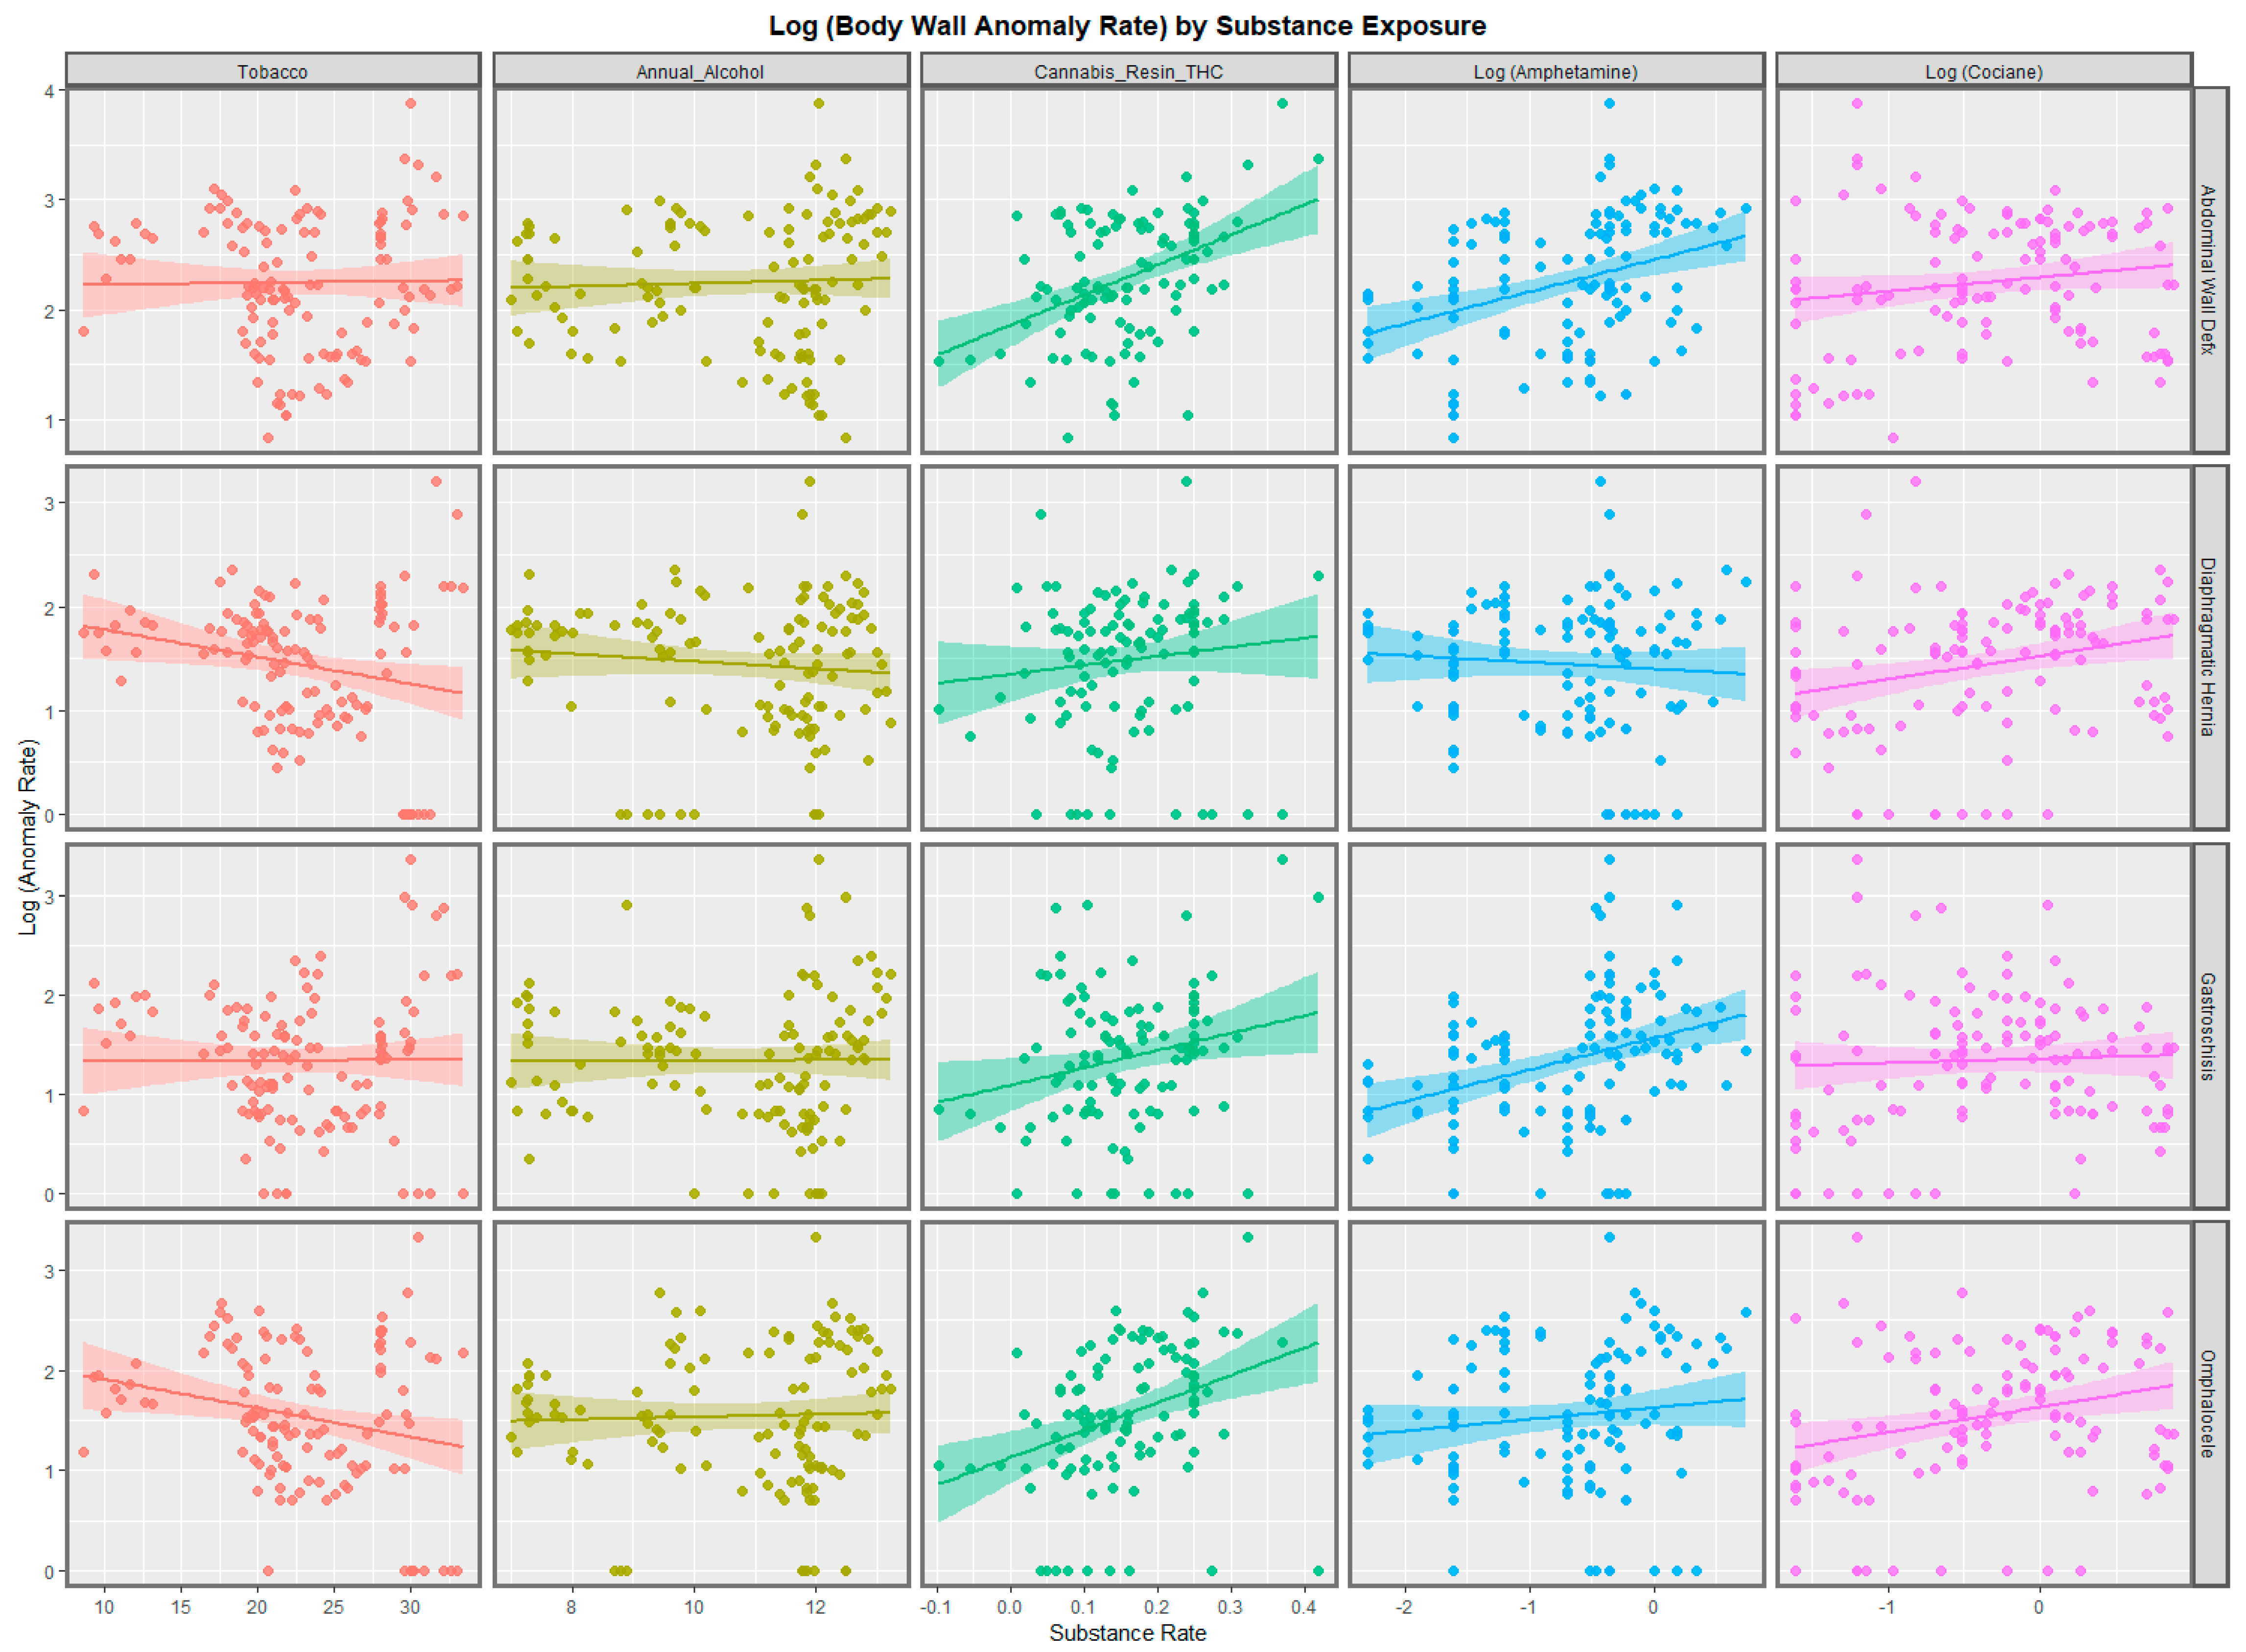
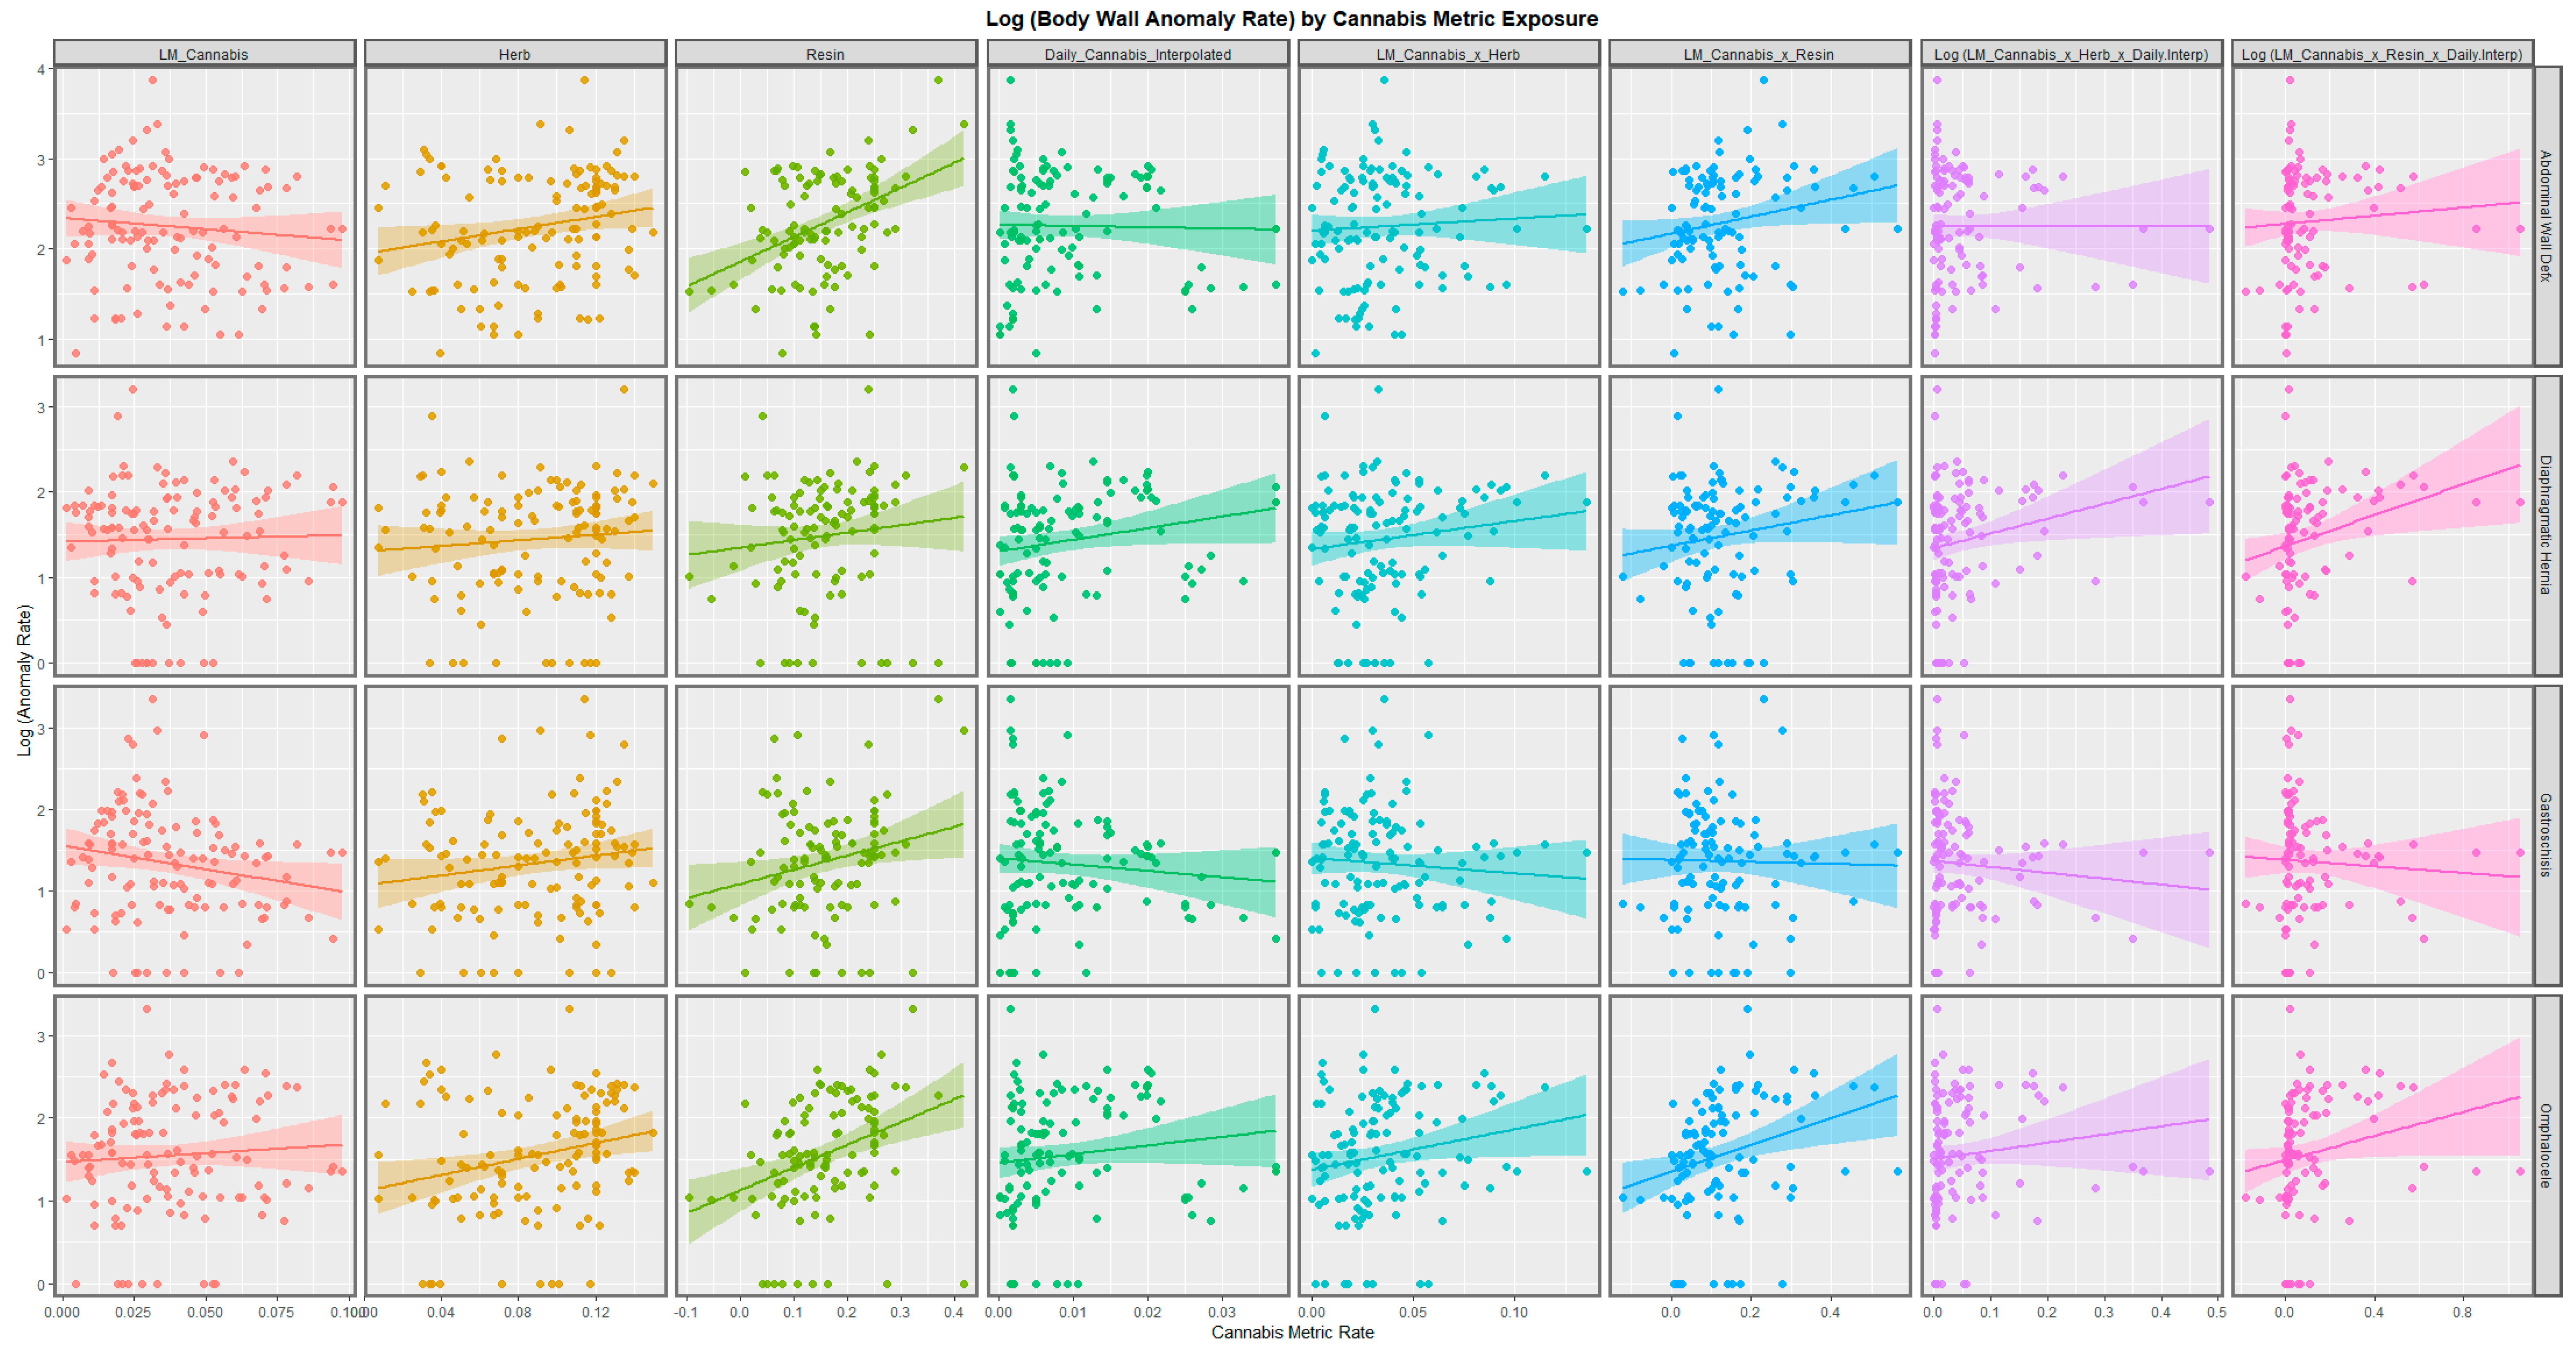
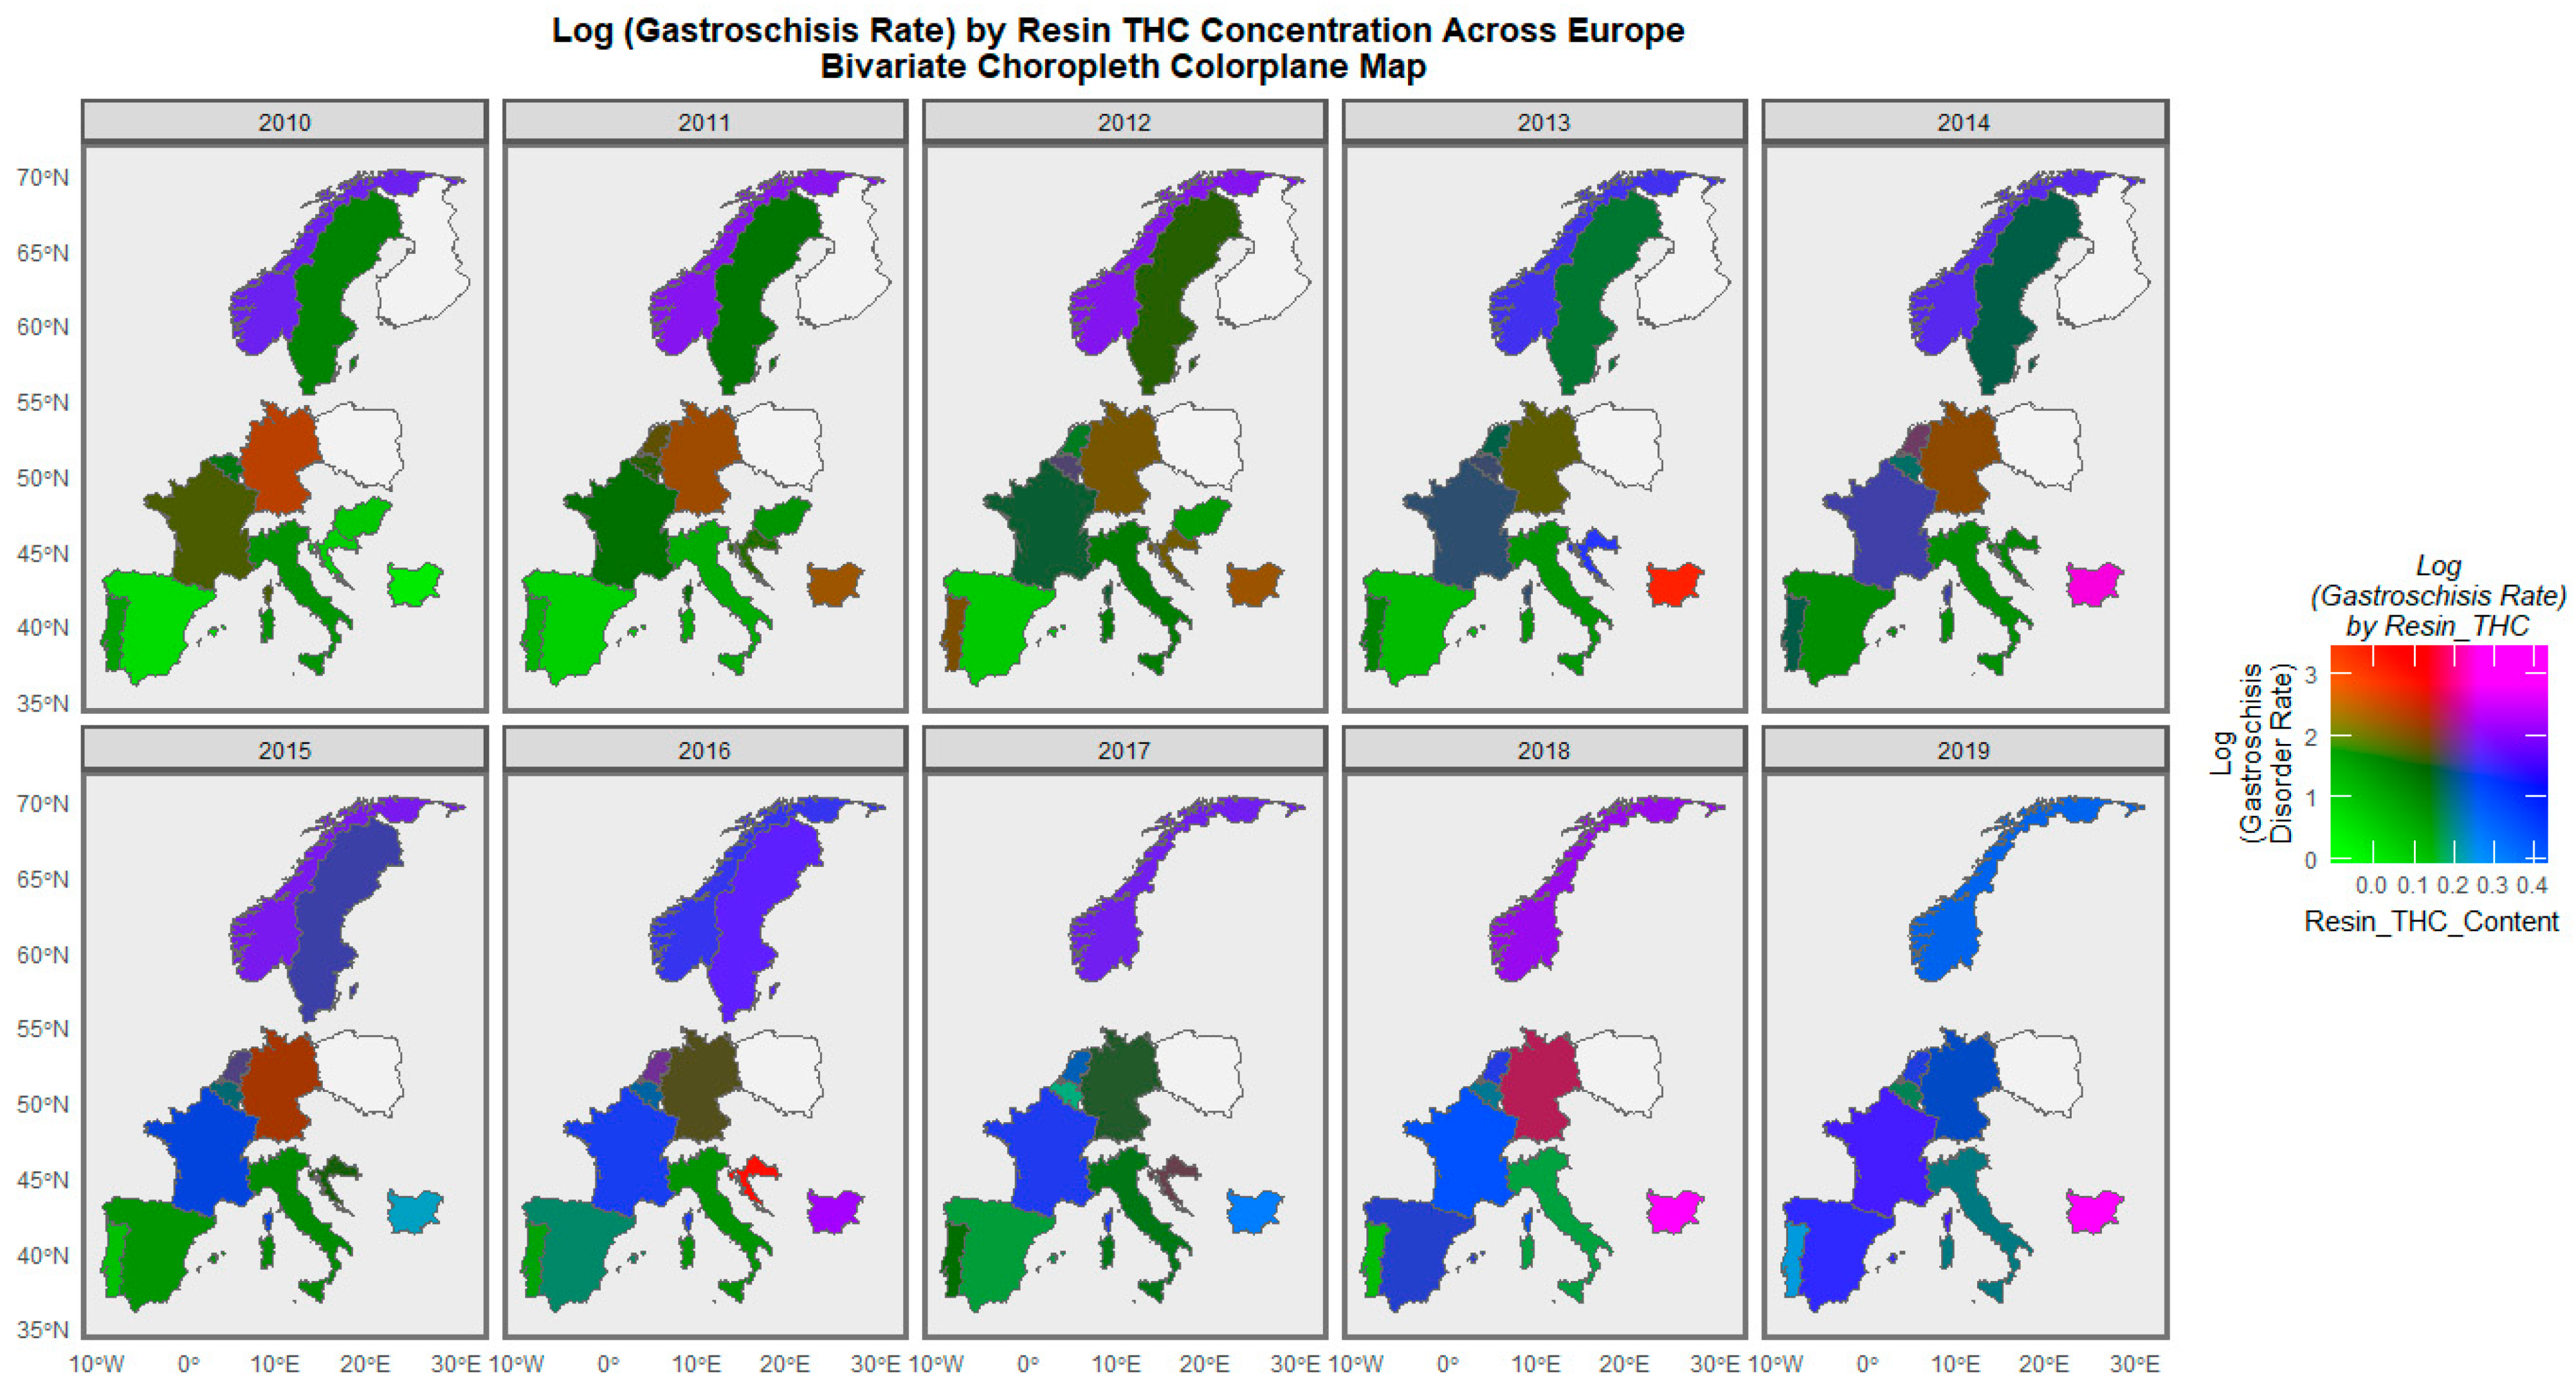
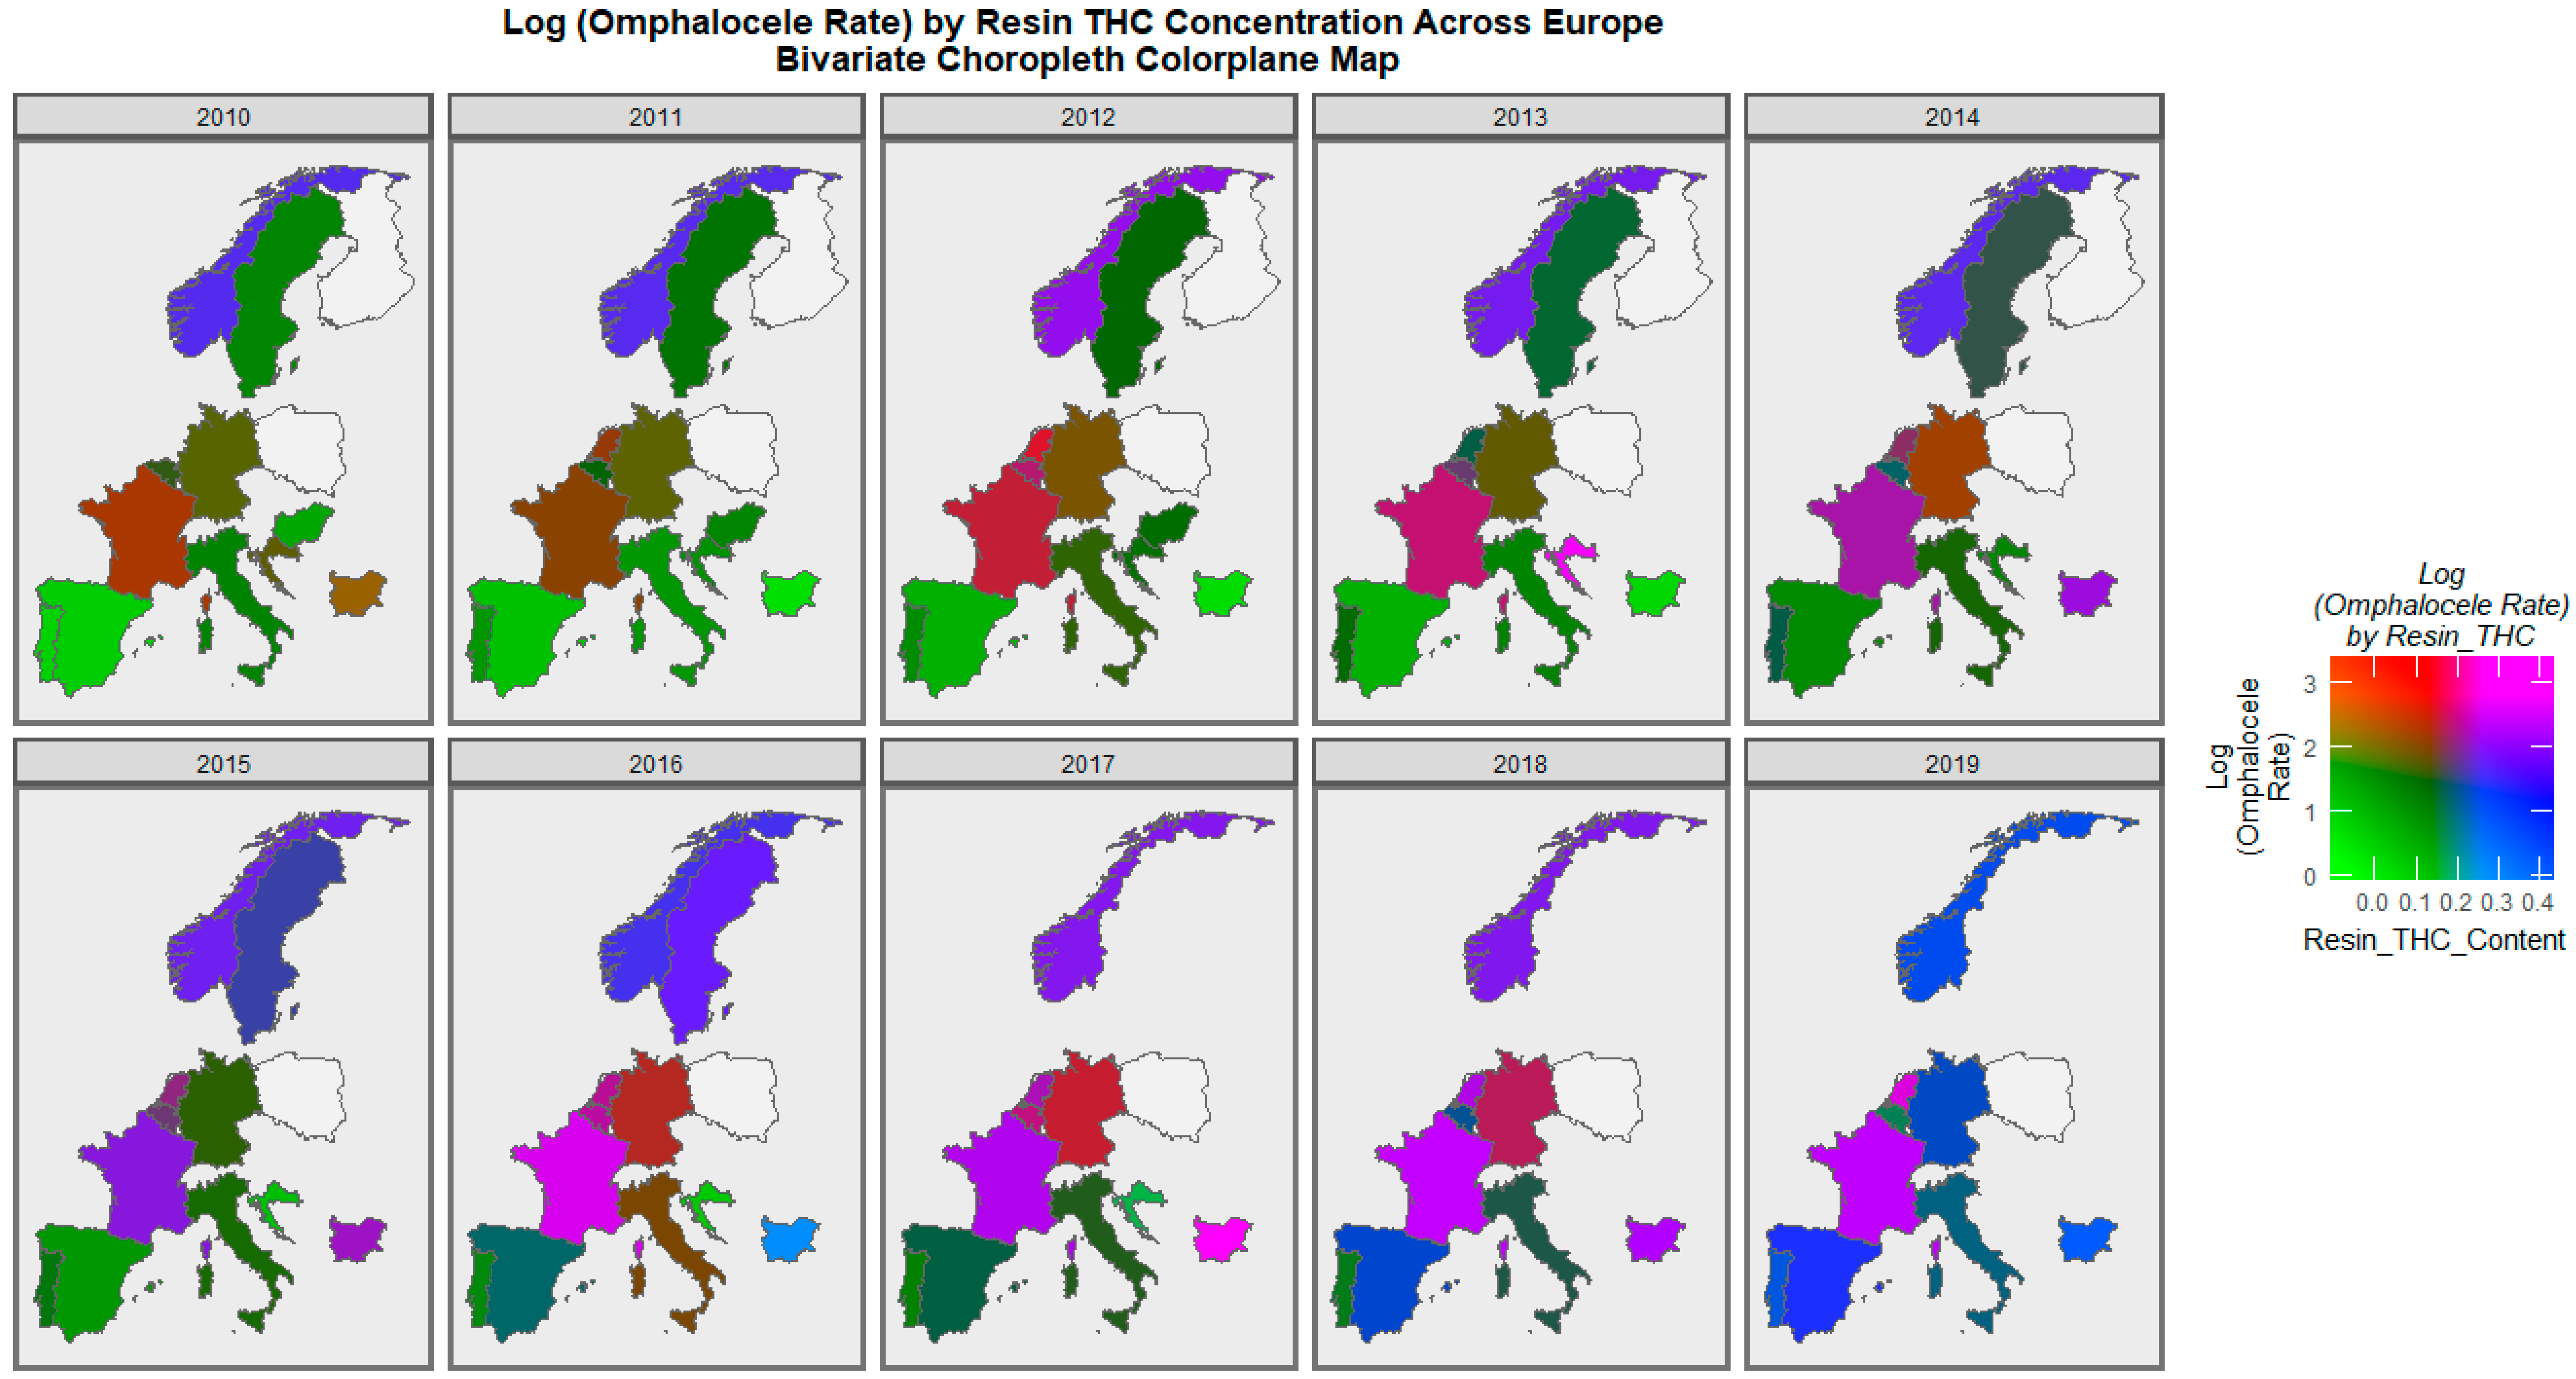
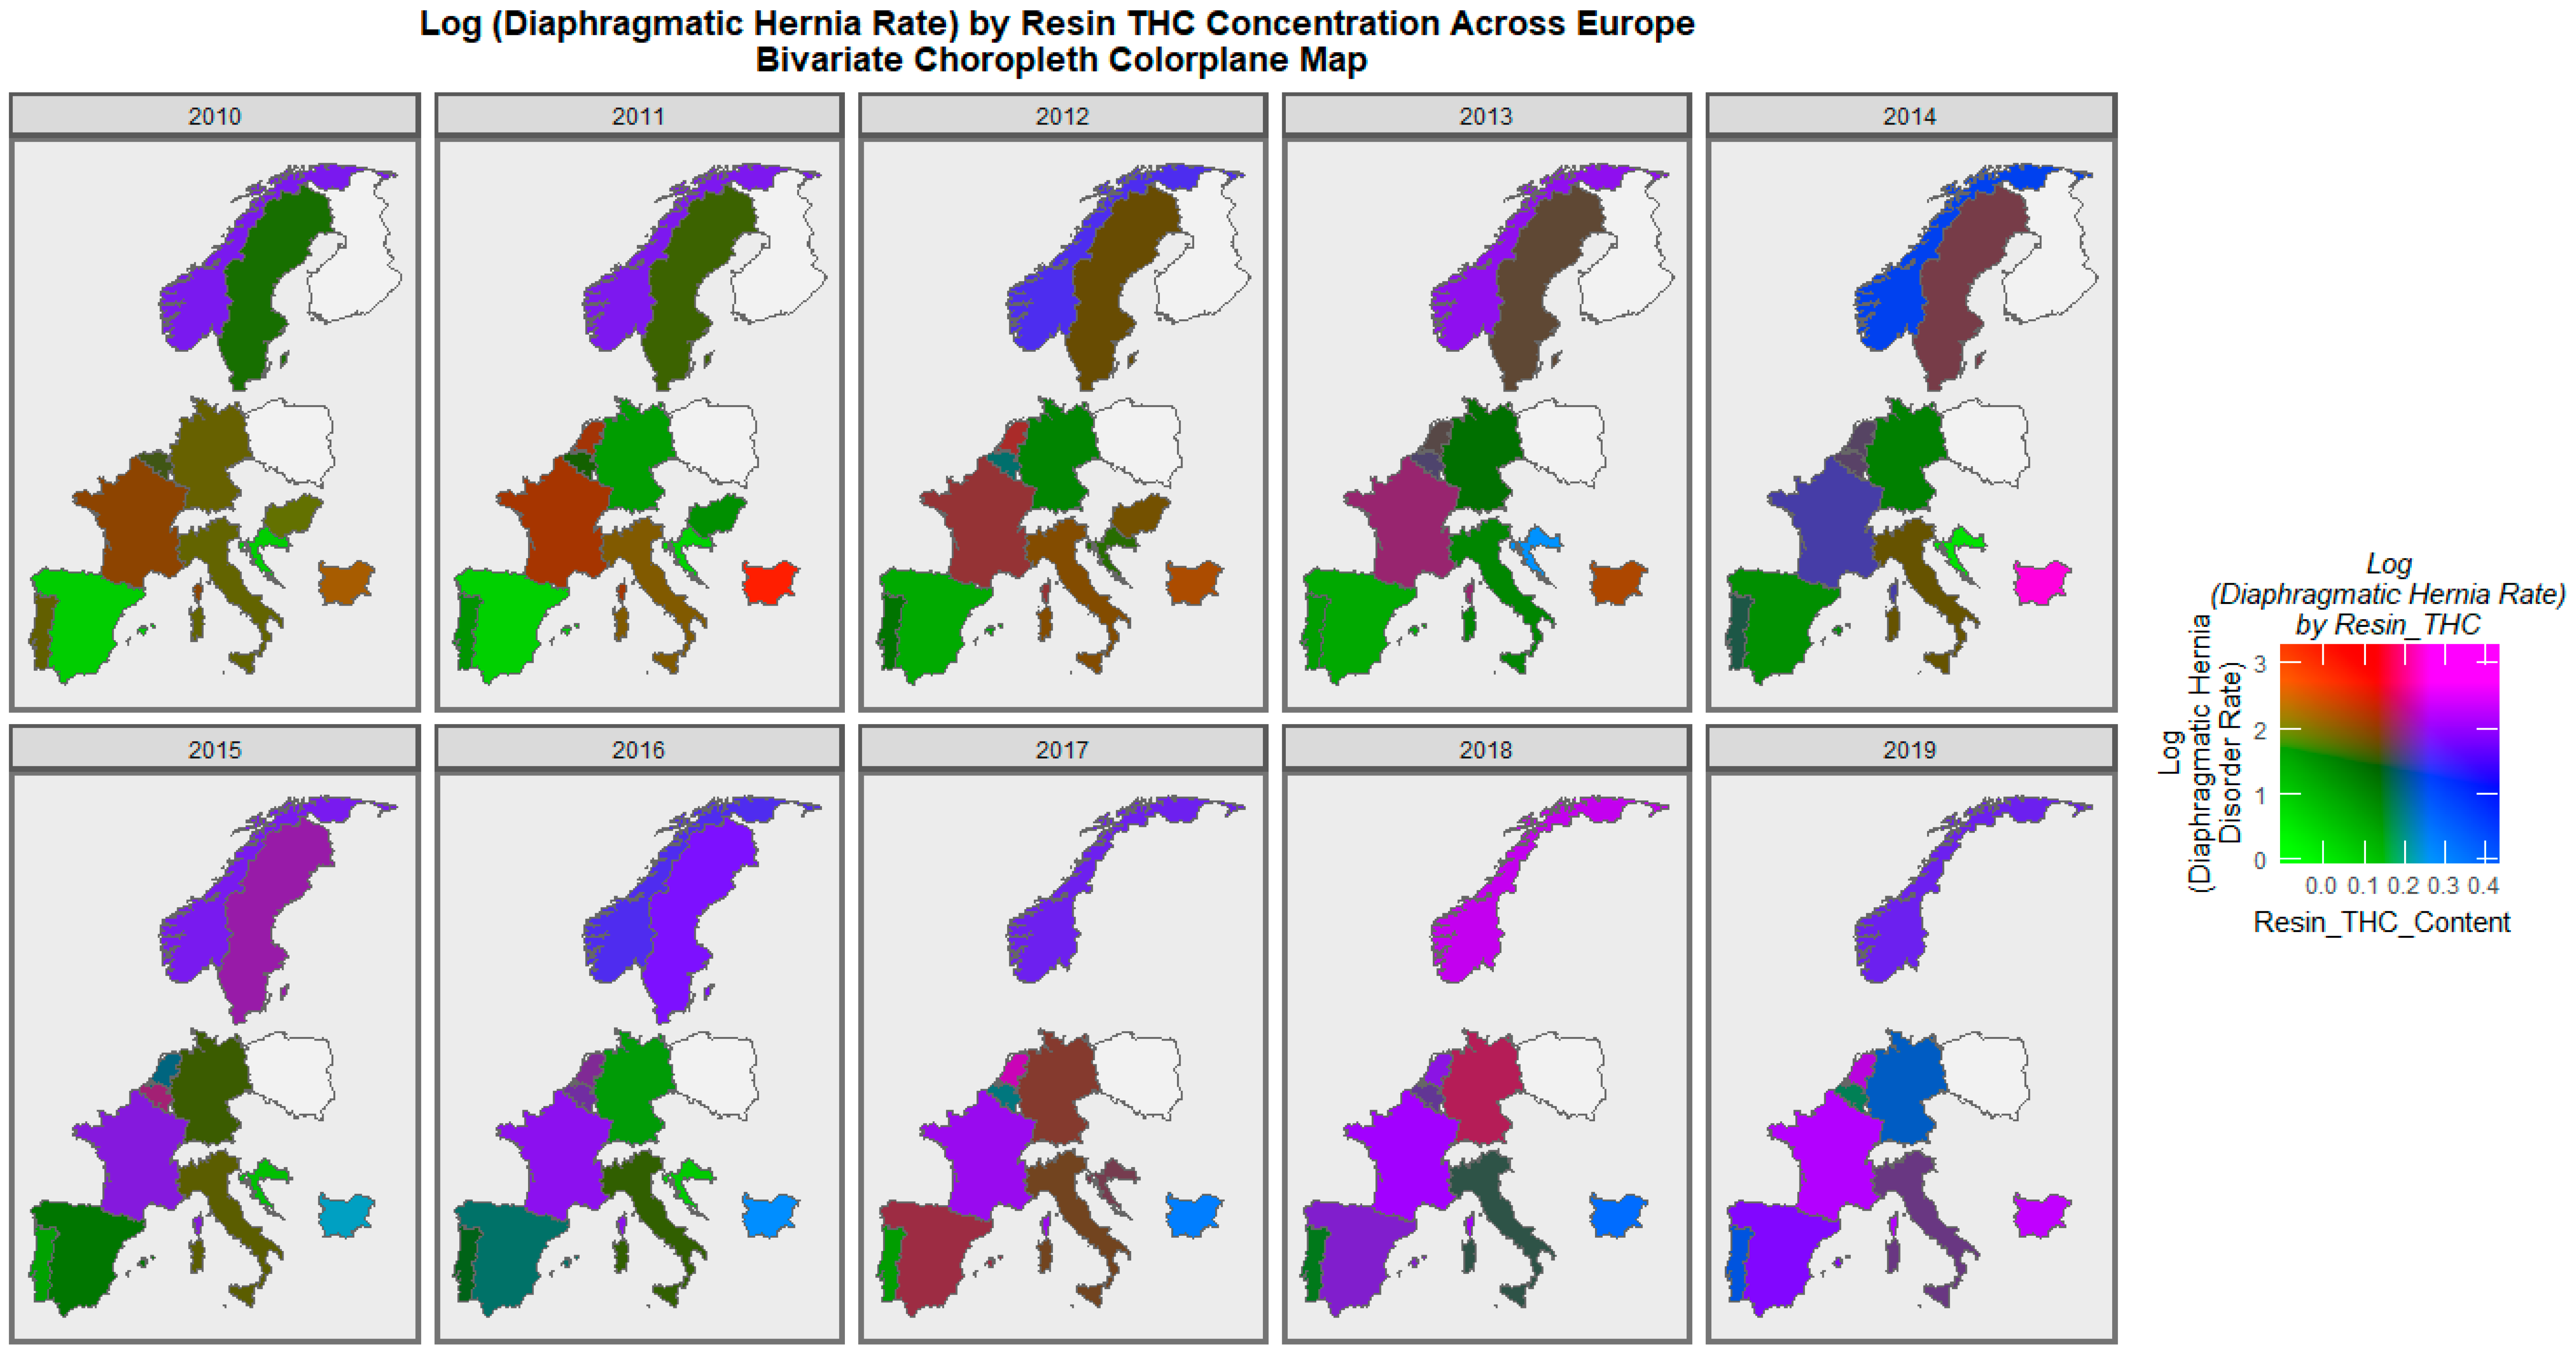
3. Results
4. Discussion
4.1. Main Results
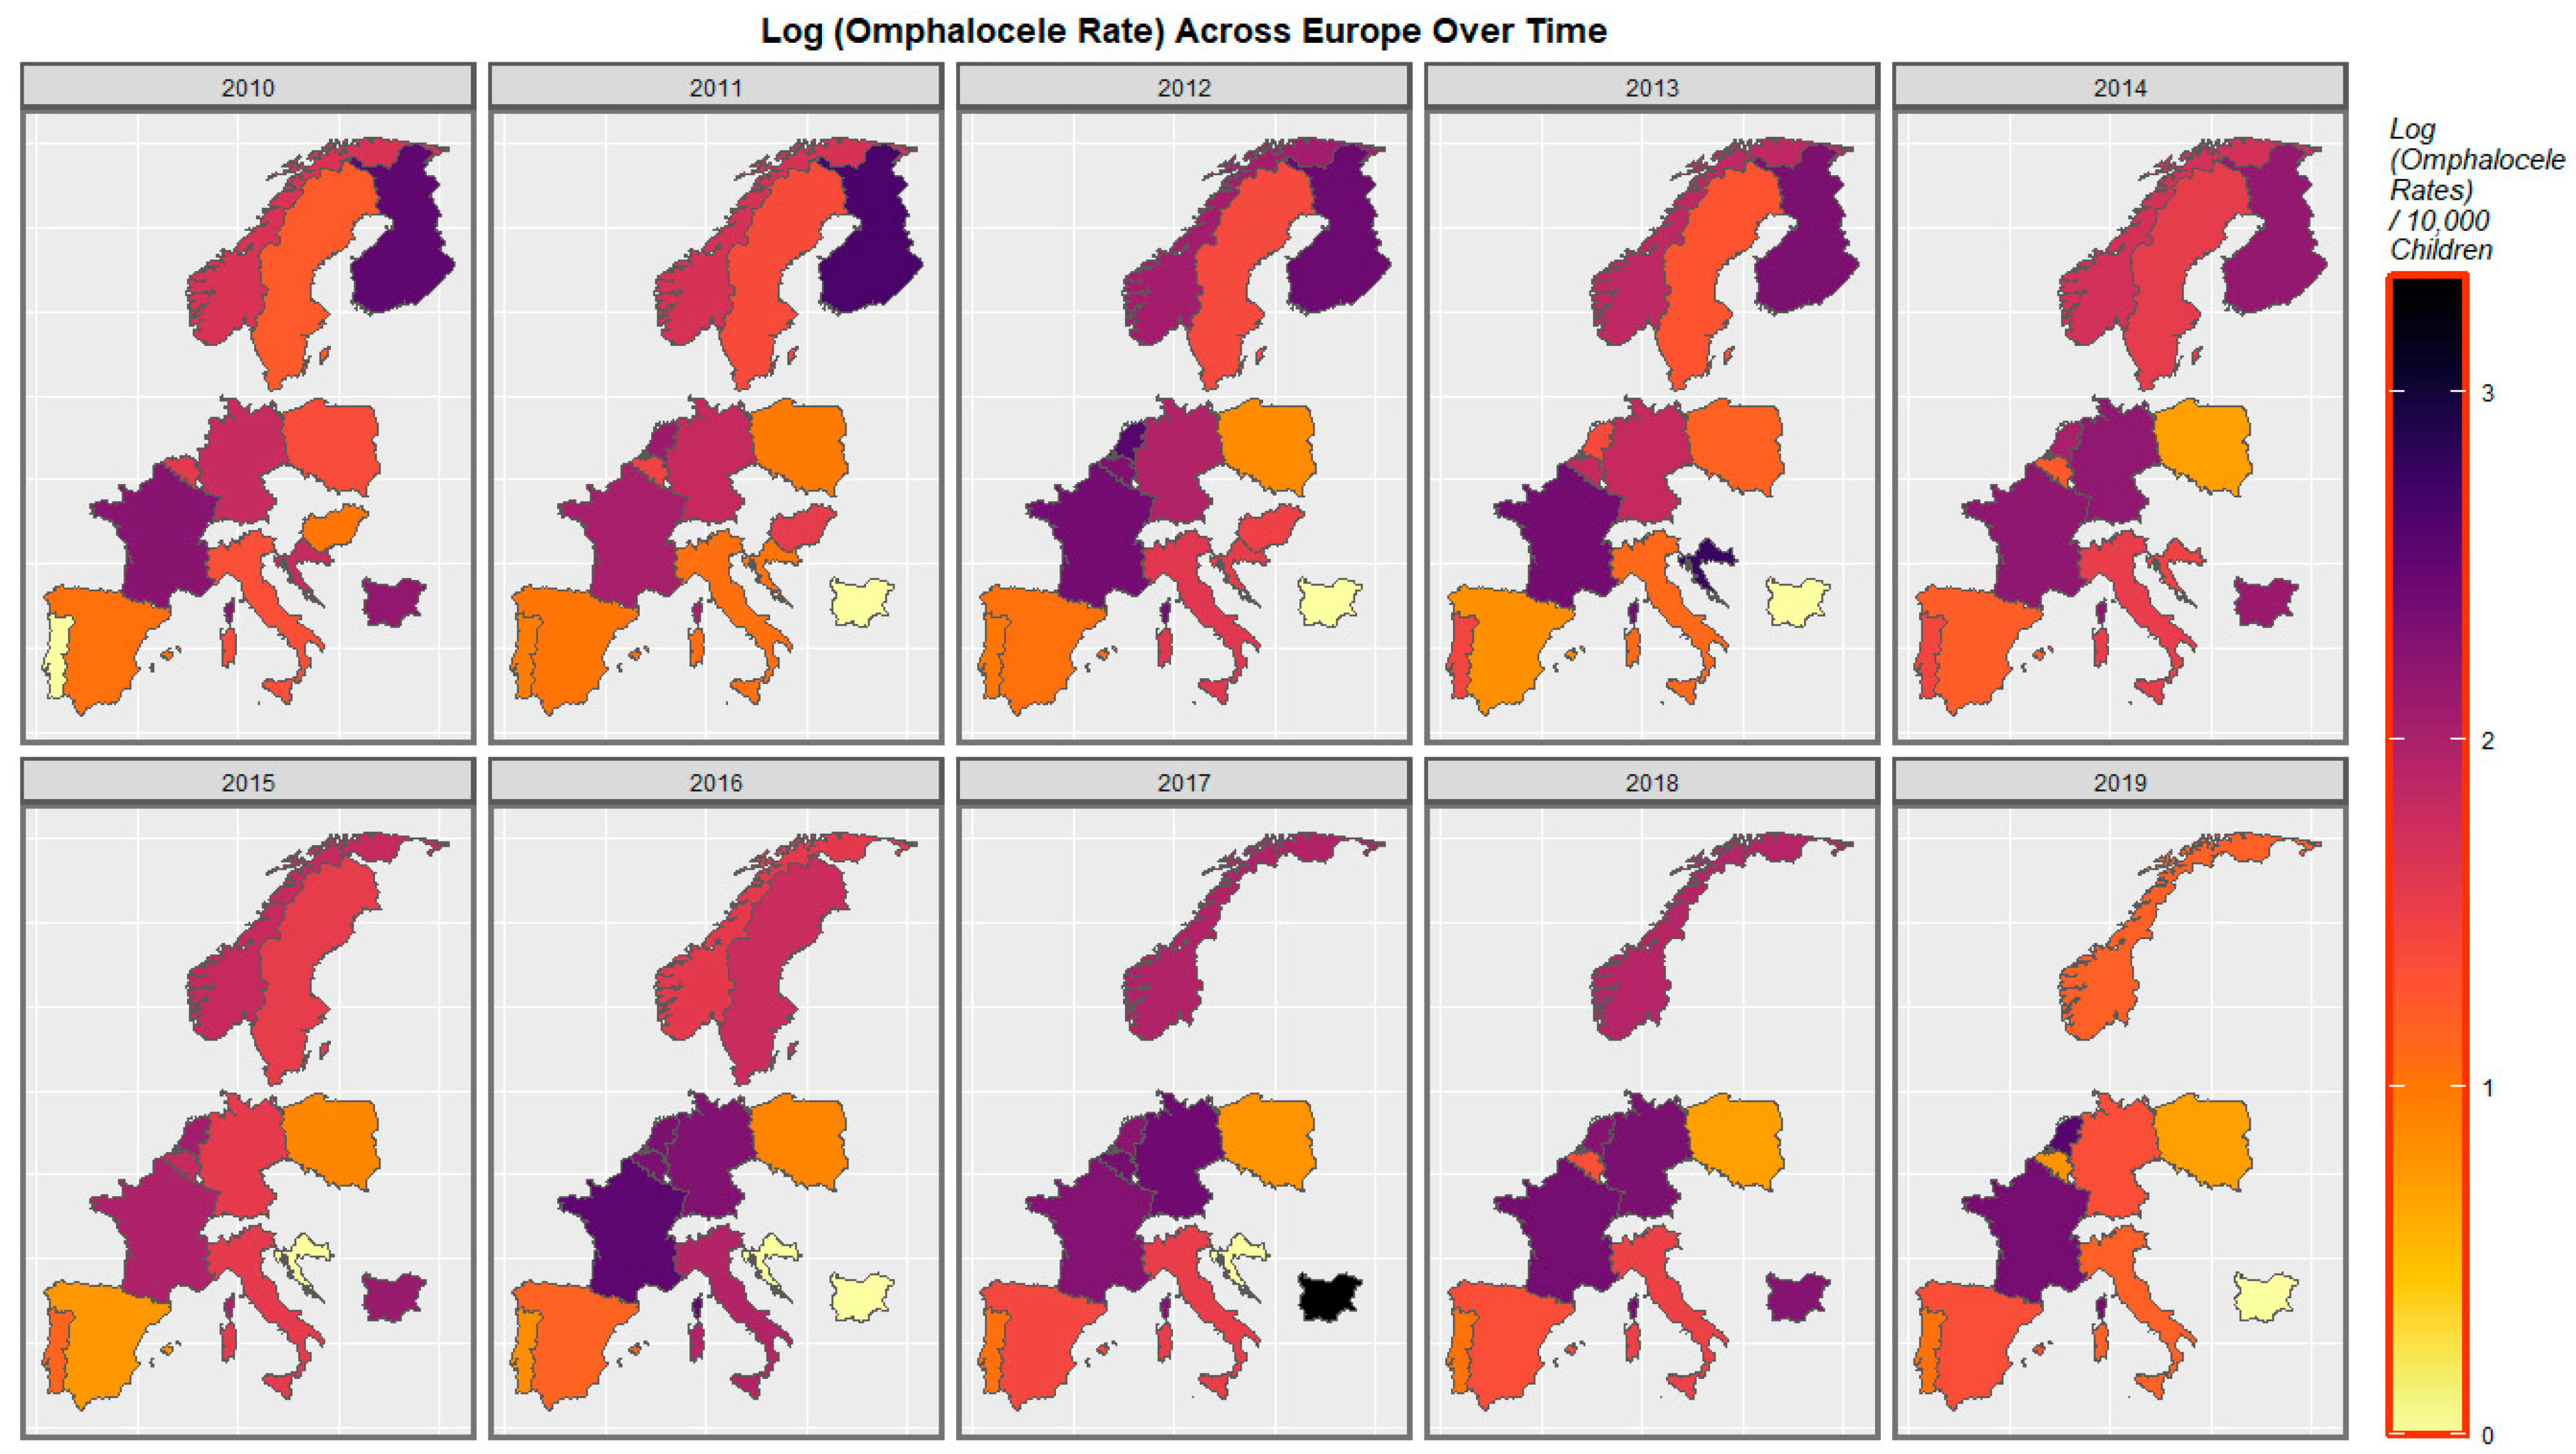
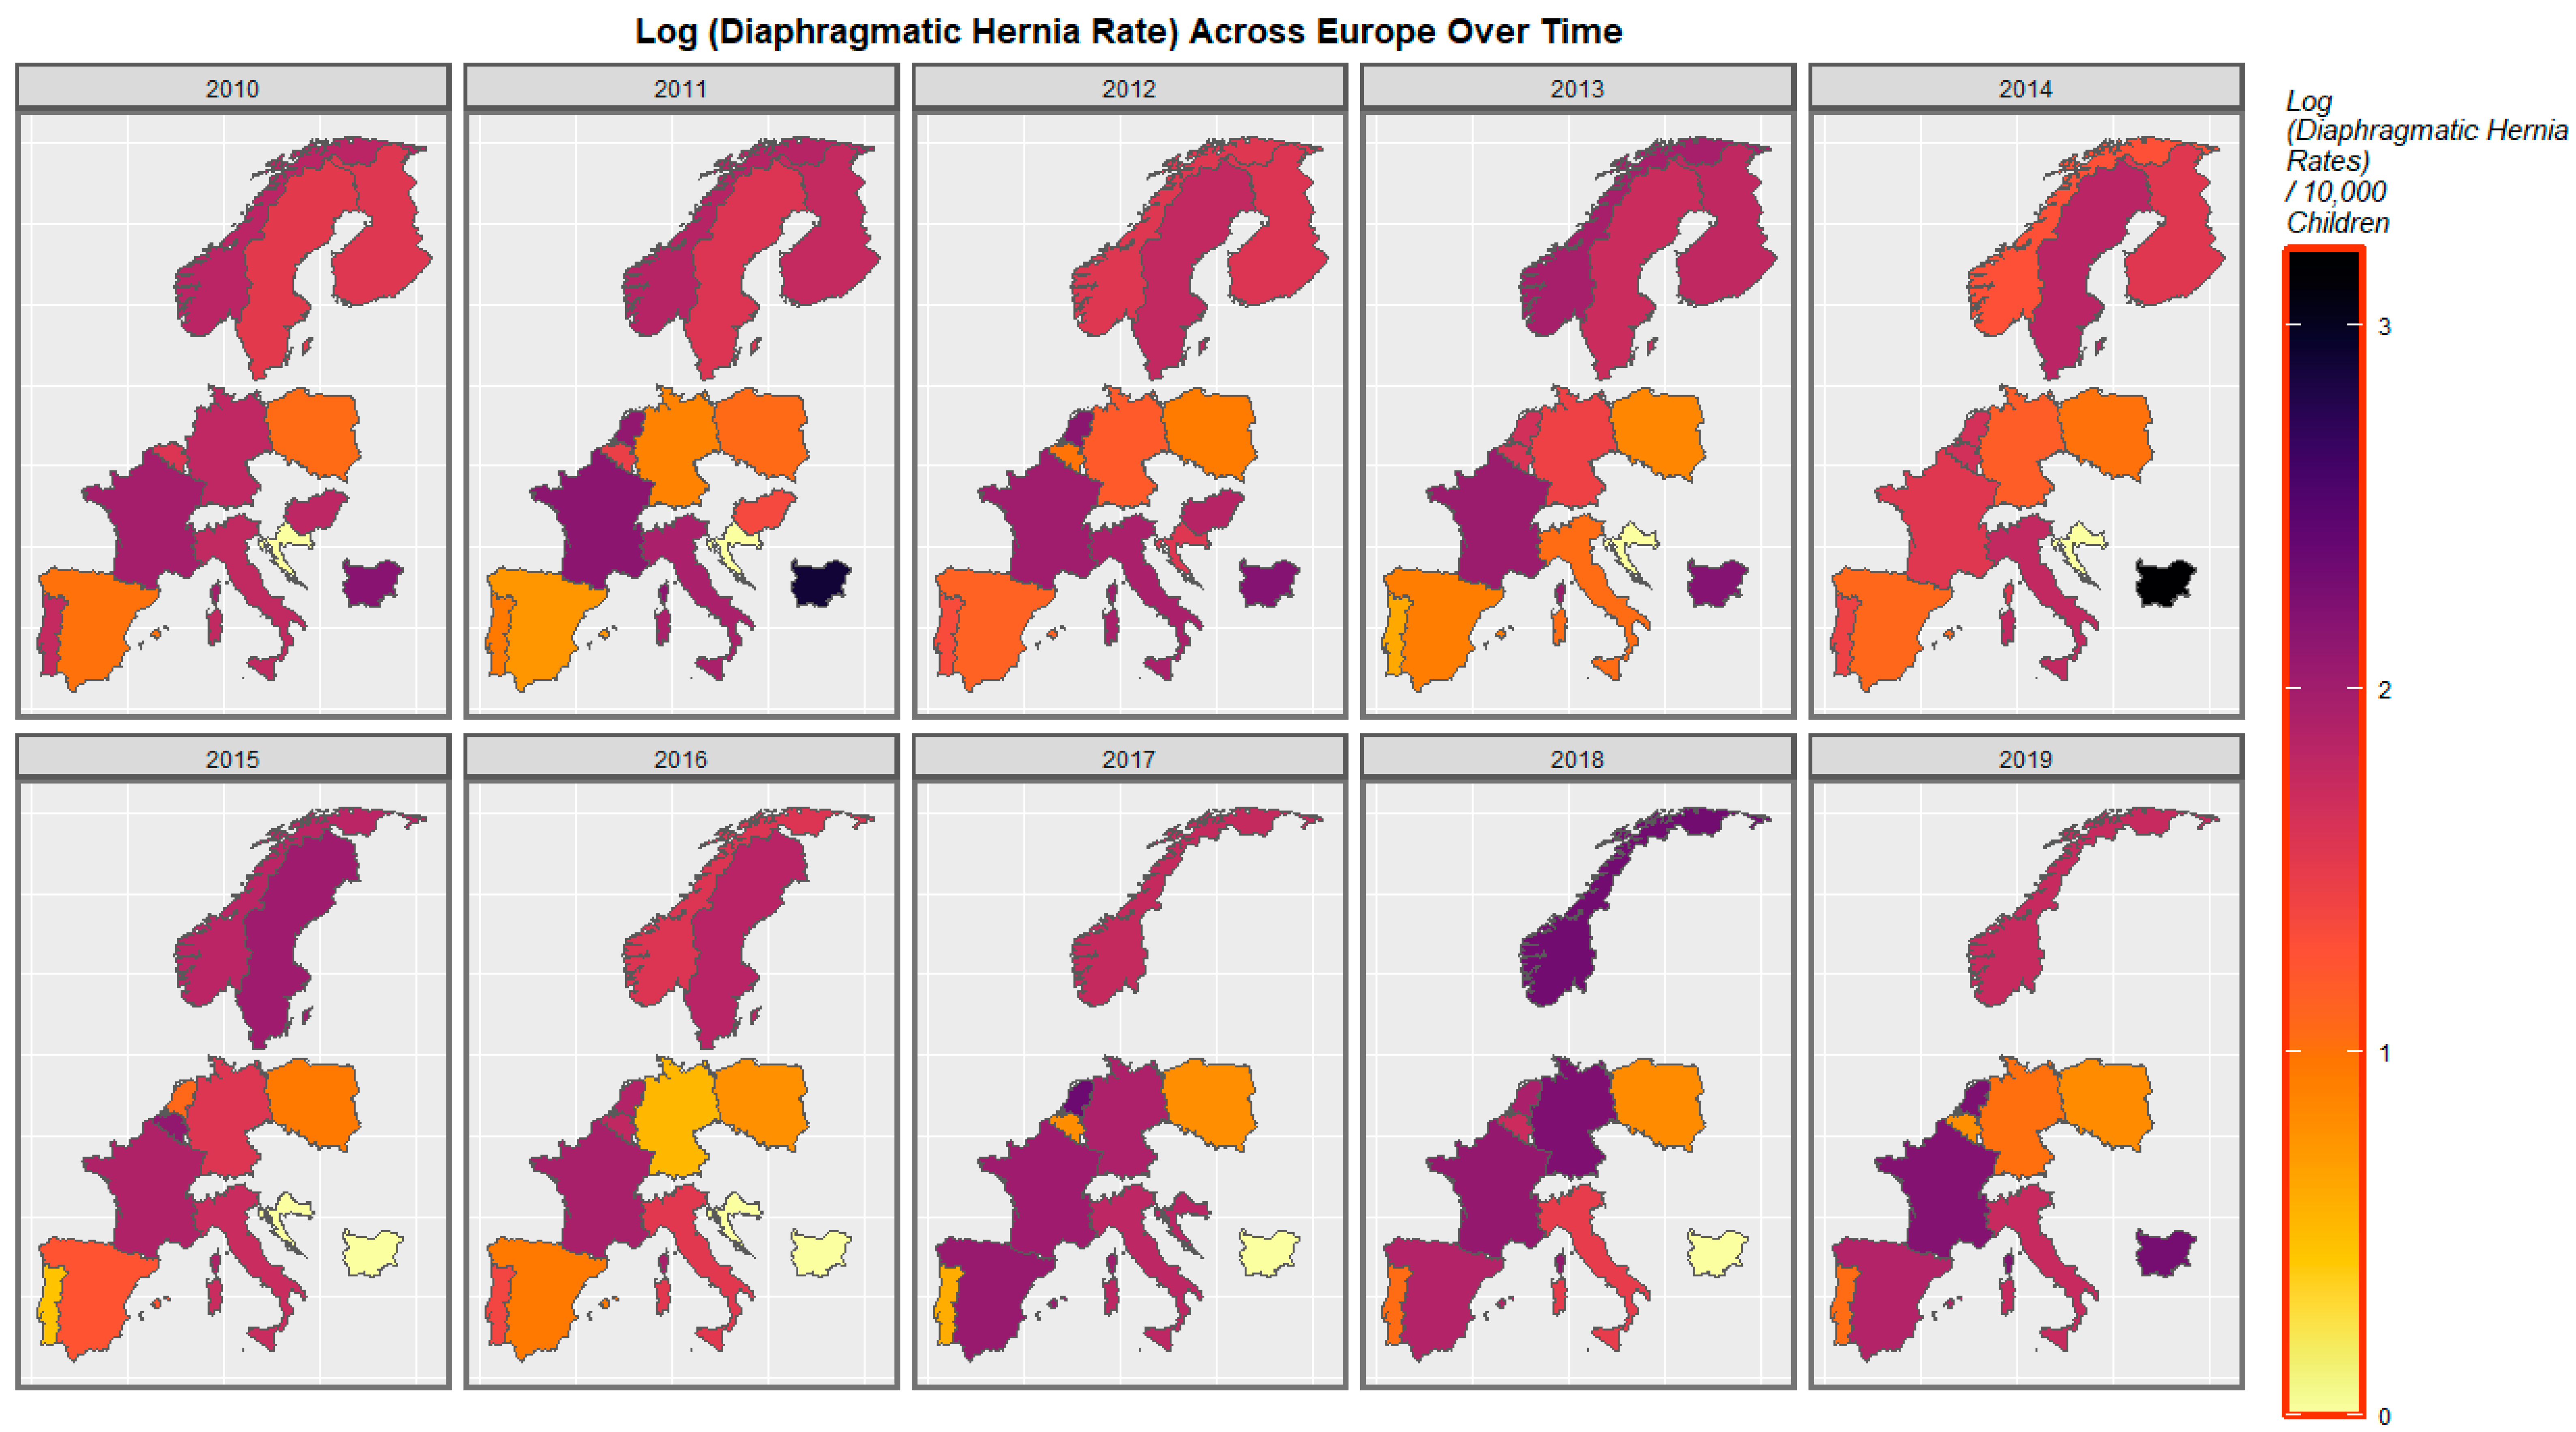
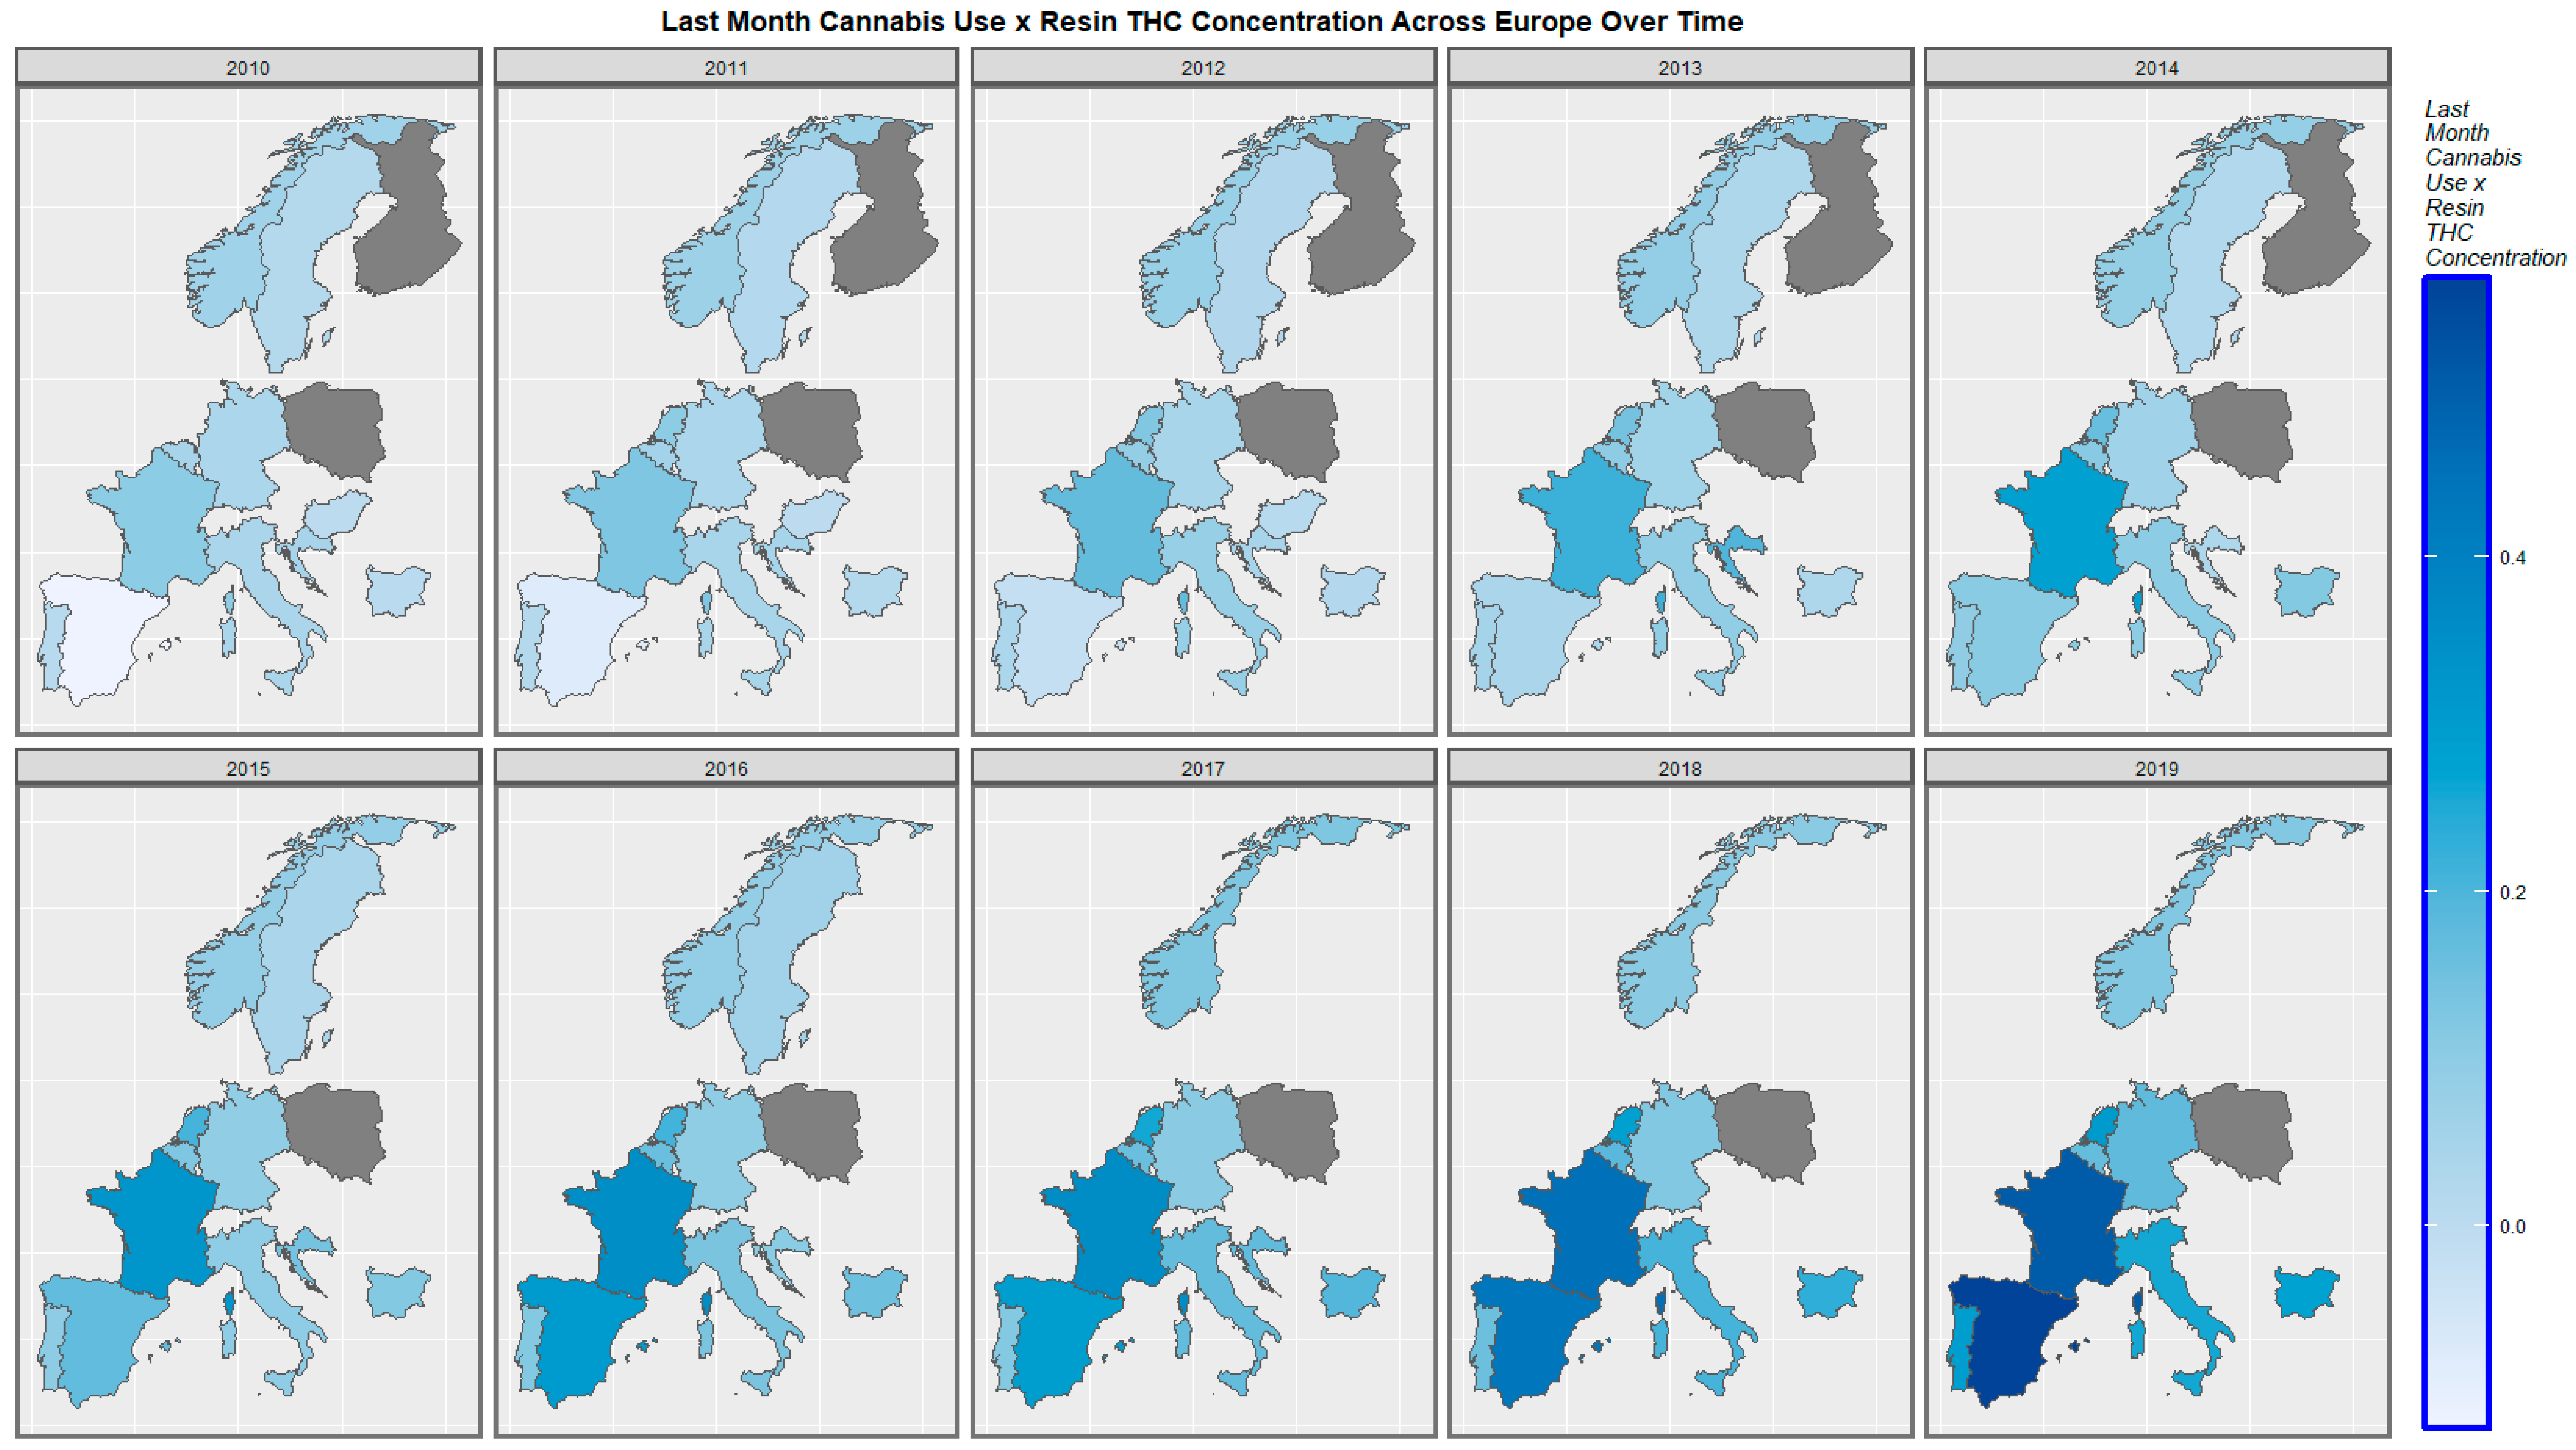
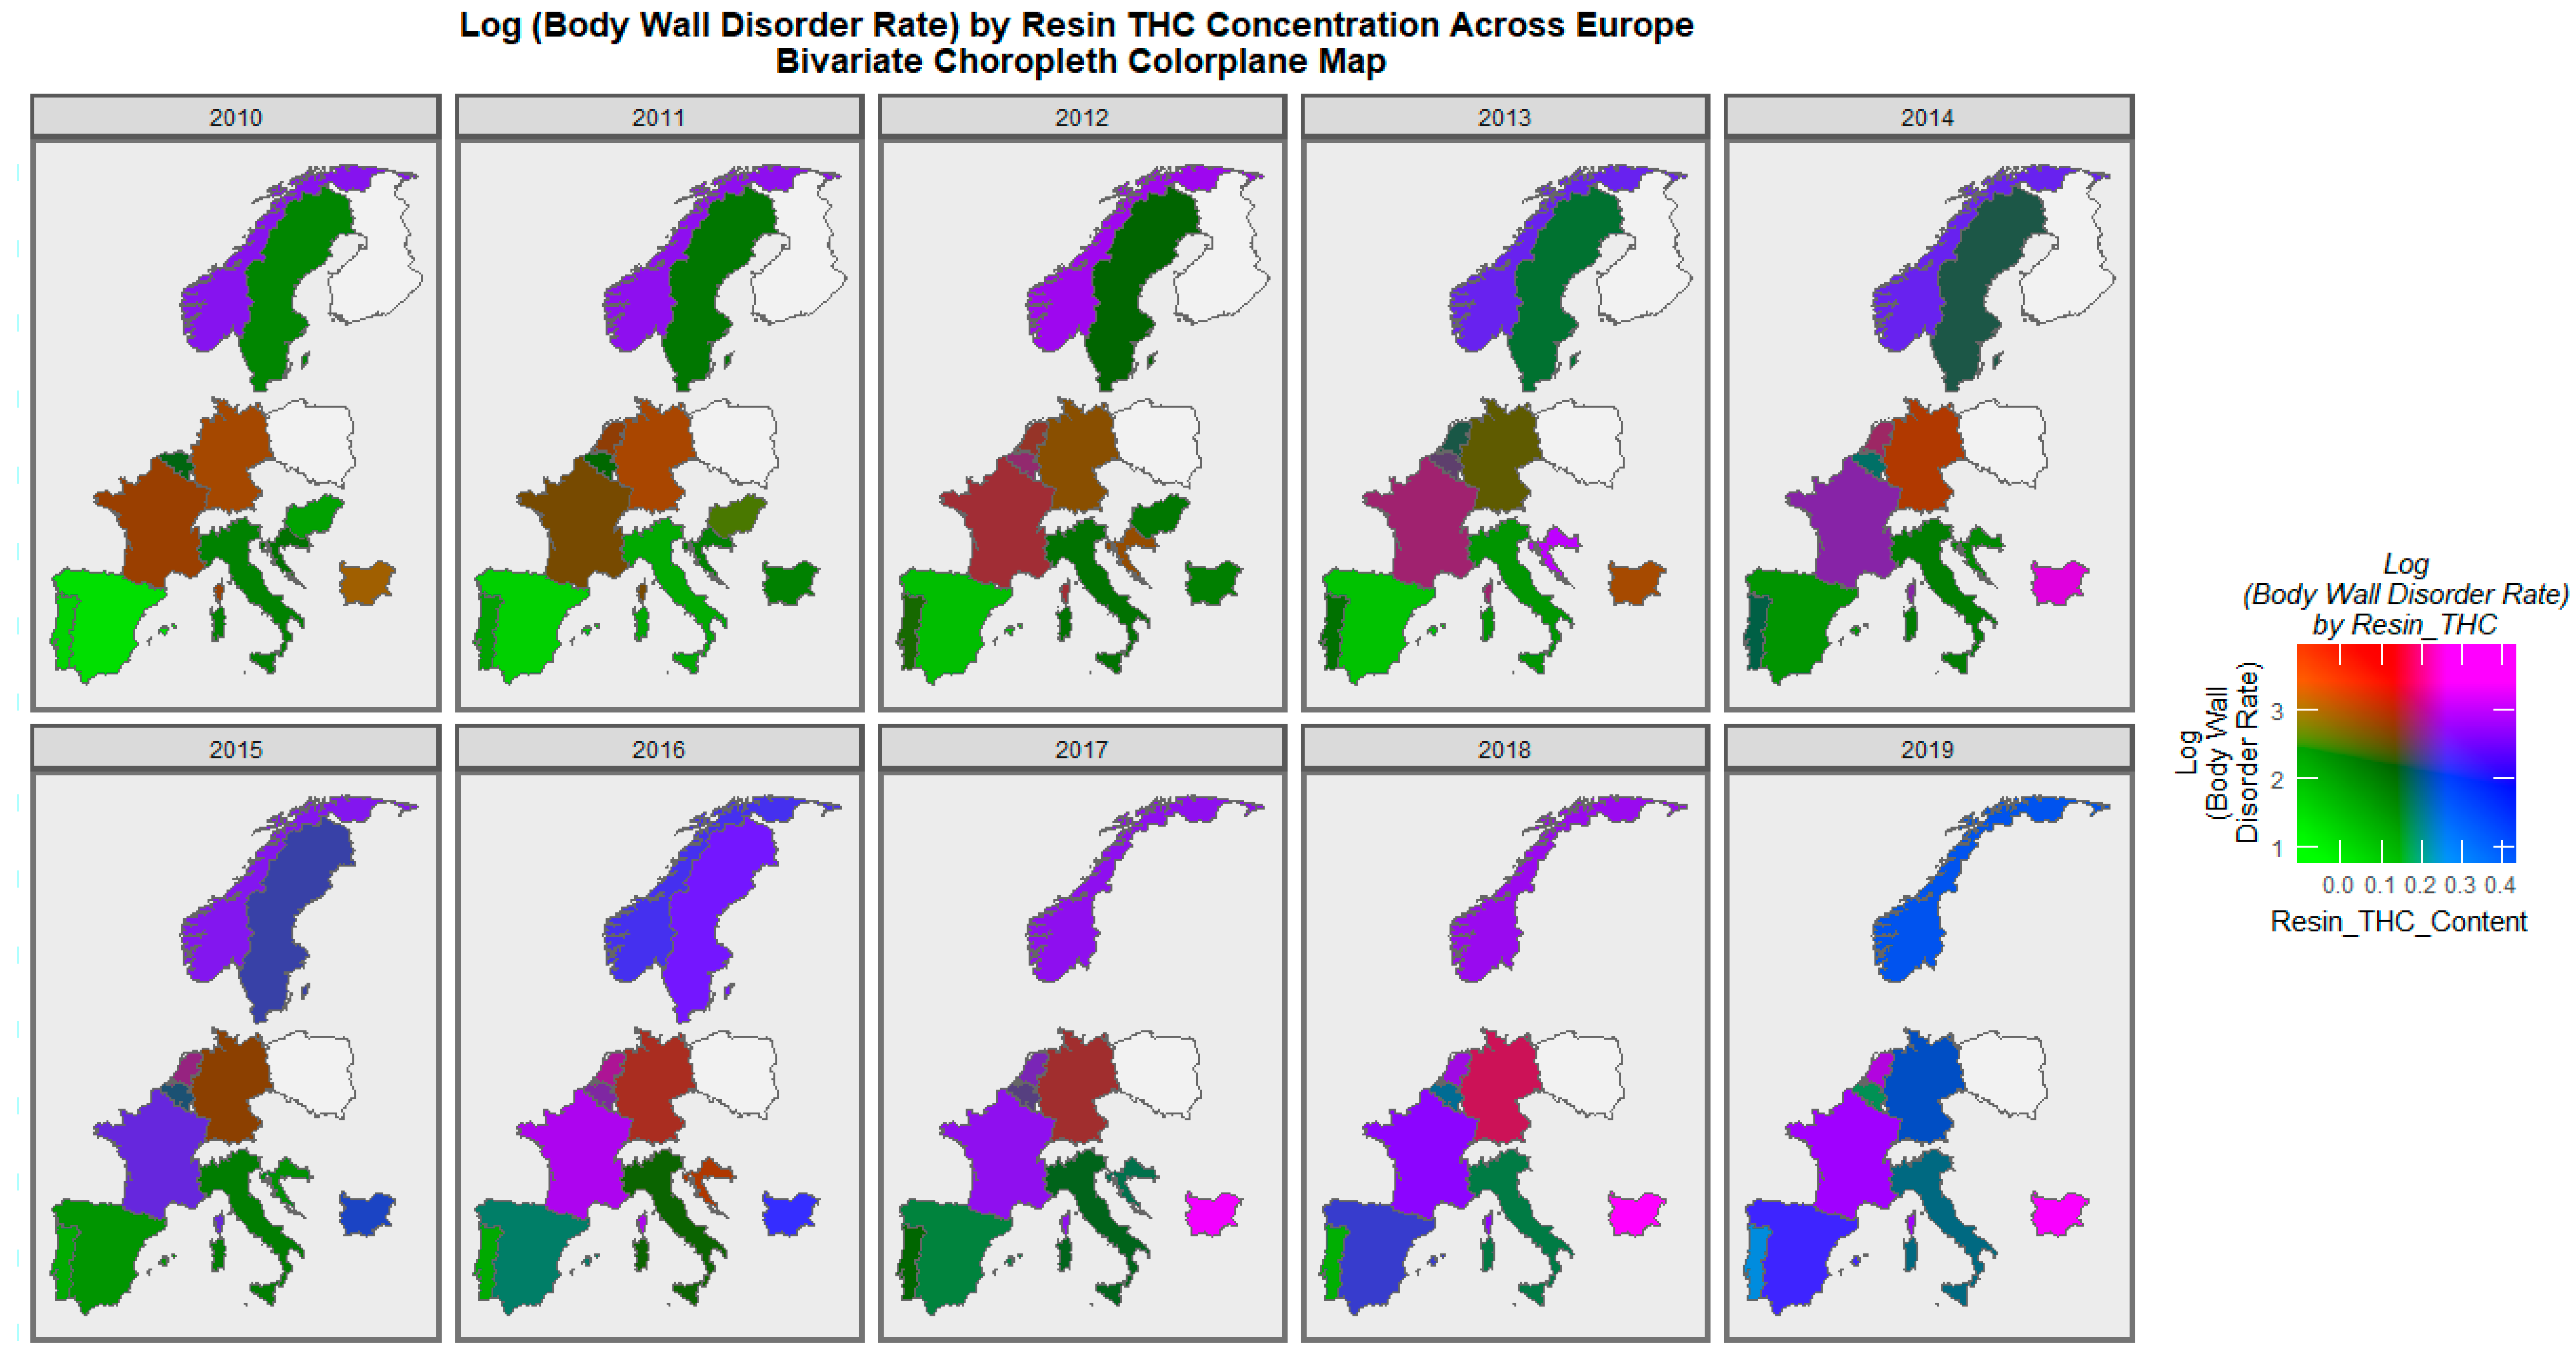
4.2. Detailed Results
4.3. Qualitative Causal Inference
4.4. Quantitative Causal Inference
4.5. Mechanisms
4.6. Cannabinoid Inhibition of Morphogens
4.7. Epigenomic Control of Genes Relevant to Body Wall Development
4.8. Generalizability
5. Strengths and Limitations
6. Conclusions
Supplementary Materials
Author Contributions
Funding
Institutional Review Board Statement
Informed Consent Statement
Data Availability Statement
Acknowledgments
Conflicts of Interest
References
- Geber, W.F.; Schramm, L.C. Teratogenicity of marihuana extract as influenced by plant origin and seasonal variation. Arch. Int. Pharm. Ther. 1969, 177, 224–230. [Google Scholar]
- Geber, W.F.; Schramm, L.C. Effect of marihuana extract on fetal hamsters and rabbits. Toxicol. Appl. Pharmacol. 1969, 14, 276–282. [Google Scholar] [CrossRef]
- Graham, J.D.P. Cannabis and Health. In Cannabis and Health. Volume 1, 1st ed.; Graham, J.D.P., Ed.; Academic Press: Cambridge, MA, USA, 1976; pp. 271–320. [Google Scholar]
- Reece, A.S.; Hulse, G.K. Cannabinoid- and Substance- Relationships of European Congenital Anomaly Patterns: A Space-Time Panel Regression and Causal Inferential Study. Environ. Epigenetics 2022, 8, 1–40. [Google Scholar] [CrossRef] [PubMed]
- Reece, A.S.; Hulse, G.K. Cannabinoid Genotoxicity and Congenital Anomalies: A Convergent Synthesis of European and USA Datasets. In Cannabis, Cannabinoids and Endocannabinoids, Volume 1; Preedy, V., Patel, V., Eds.; Elsevier: London, UK, 2022; in press. [Google Scholar]
- Reece, A.S.; Hulse, G.K. Geotemporospatial and causal inference epidemiological analysis of US survey and overview of cannabis, cannabidiol and cannabinoid genotoxicity in relation to congenital anomalies 2001–2015. BMC Pediatr. 2022, 22, 47. [Google Scholar] [CrossRef]
- Reece, A.S.; Hulse, G.K. Broad Spectrum epidemiological contribution of cannabis and other substances to the teratological profile of northern New South Wales: Geospatial and causal inference analysis. BMC Pharm. Toxicol. 2020, 21, 75. [Google Scholar] [CrossRef]
- Endo, T.; Johnston, T.; Ellerington, J.; Donovan, T. Gastroschisis in Queensland. In Queensland Health; Health Statistics Unit, Ed.; Queensland Health: Brisbane, Australia, 2013; Volume StatBite #57. [Google Scholar]
- David, A.L.; Holloway, A.; Thomasson, L.; Syngelaki, A.; Nicolaides, K.; Patel, R.R.; Sommerlad, B.; Wilson, A.; Martin, W.; Chitty, L.S. A case-control study of maternal periconceptual and pregnancy recreational drug use and fetal malformation using hair analysis. PLoS ONE 2014, 9, e111038. [Google Scholar] [CrossRef]
- Draper, E.S.; Rankin, J.; Tonks, A.M.; Abrams, K.R.; Field, D.J.; Clarke, M.; Kurinczuk, J.J. Recreational drug use: A major risk factor for gastroschisis? Am. J. Epidemiol. 2008, 167, 485–491. [Google Scholar] [CrossRef]
- Forrester, M.B.; Merz, R.D. Risk of selected birth defects with prenatal illicit drug use, Hawaii, 1986–2002. J. Toxicol. Environ. Health 2007, 70, 7–18. [Google Scholar] [CrossRef]
- Skarsgard, E.D.; Meaney, C.; Bassil, K.; Brindle, M.; Arbour, L.; Moineddin, R. Canadian Pediatric Surgery N: Maternal risk factors for gastroschisis in Canada. Birth. Defects Res. Part A Clin. Mol. Teratol. 2015, 103, 111–118. [Google Scholar] [CrossRef]
- Torfs, C.P.; Velie, E.M.; Oechsli, F.W.; Bateson, T.F.; Curry, C.J. A population-based study of gastroschisis: Demographic, pregnancy, and lifestyle risk factors. Teratology 1994, 50, 44–53. [Google Scholar] [CrossRef]
- van Gelder, M.M.; Reefhuis, J.; Caton, A.R.; Werler, M.M.; Druschel, C.M.; Roeleveld, N. National Birth Defects Prevention S: Maternal periconceptional illicit drug use and the risk of congenital malformations. Epidemiology 2009, 20, 60–66. [Google Scholar] [CrossRef] [PubMed]
- Werler, M.M.; Sheehan, J.E.; Mitchell, A.A. Association of vasoconstrictive exposures with risks of gastroschisis and small intestinal atresia. Epidemiology 2003, 14, 349–354. [Google Scholar] [CrossRef]
- Reece, A.S.; Hulse, G.K. Canadian Cannabis Consumption and Patterns of Congenital Anomalies: An Ecological Geospatial Analysis. J. Addict. Med. 2020, 14, e195–e210. [Google Scholar] [CrossRef] [PubMed]
- Van Gelder, M.M.H.J.; Donders, A.R.T.; Devine, O.; Roeleveld, N.; Reefhuis, J. Using bayesian models to assess the effects of under-reporting of cannabis use on the association with birth defects, national birth defects prevention study, 1997–2005. Paediatr. Perinat. Epidemiol. 2014, 28, 424–433. [Google Scholar] [CrossRef] [PubMed]
- Weinsheimer, R.L.; Yanchar, N.L.; Canadian Pediatric Surgical Network. Impact of maternal substance abuse and smoking on children with gastroschisis. J. Pediatr. Surg. 2008, 43, 879–883. [Google Scholar] [CrossRef]
- Werler, M.M.; Mitchell, A.A.; Shapiro, S. First trimester maternal medication use in relation to gastroschisis. Teratology 1992, 45, 361–367. [Google Scholar] [CrossRef]
- Zimmerman, A.M.; Zimmerman, S.; Raj, A.Y. Effects of Cannabinoids on Spermatogensis in Mice. In Marijuana and Medicine, Volume 1, 1st ed.; Nahas, G.G., Sutin, K.M., Harvey, D.J., Agurell, S.T., Eds.; Humana Press: New York, NY, USA, 1999; pp. 347–358. [Google Scholar]
- Huang, H.F.S.; Nahas, G.G.; Hembree, W.C. Effects of Marijuana Inhalation on Spermatogenesis of the Rat. In Marijuana in Medicine, Volume 1; Nahas, G.G., Sutin, K.M., Harvey, D.J., Agurell, S.T., Eds.; Human Press: New York, NY, USA, 1999; pp. 359–366. [Google Scholar]
- Morishima, A. Effects of cannabis and natural cannabinoids on chromosomes and ova. NIDA Res. Monogr. 1984, 44, 25–45. [Google Scholar]
- Russo, C.; Ferk, F.; Mišík, M.; Ropek, N.; Nersesyan, A.; Mejri, D.; Holzmann, K.; Lavorgna, M.; Isidori, M.; Knasmüller, S. Low doses of widely consumed cannabinoids (cannabidiol and cannabidivarin) cause DNA damage and chromosomal aberrations in human-derived cells. Arch. Toxicol. 2019, 93, 179–188. [Google Scholar] [CrossRef]
- Leuchtenberger, C.; Leuchtenberger, R. Morphological and cytochemical effects of marijuana cigarette smoke on epithelioid cells of lung explants from mice. Nature 1971, 234, 227–229. [Google Scholar] [CrossRef]
- Stenchever, M.A.; Kunysz, T.J.; Allen, M.A. Chromosome breakage in users of marihuana. Am. J. Obstet. Gynecol. 1974, 118, 106–113. [Google Scholar] [CrossRef]
- Chioccarelli, T.; Cacciola, G.; Altucci, L.; Lewis, S.E.; Simon, L.; Ricci, G.; Ledent, C.; Meccariello, R.; Fasano, S.; Pierantoni, R.; et al. Cannabinoid receptor 1 influences chromatin remodeling in mouse spermatids by affecting content of transition protein 2 mRNA and histone displacement. Endocrinology 2010, 151, 5017–5029. [Google Scholar] [CrossRef] [PubMed]
- Rossato, M.; Pagano, C.; Vettor, R. The cannabinoid system and male reproductive functions. J. Neuroendocrinol. 2008, 20 (Suppl. 1), 90–93. [Google Scholar] [CrossRef] [PubMed]
- Blevins, R.D.; Regan, J.D. delta-9-Tetrahydrocannabinol: Effect on macromolecular synthesis in human and other mammalian cells. Arch. Toxicol. 1976, 35, 127–135. [Google Scholar] [CrossRef] [PubMed]
- Mon, M.J.; Haas, A.E.; Stein, J.L.; Stein, G.S. Influence of psychoactive and nonpsychoactive cannabinoids on cell proliferation and macromolecular biosynthesis in human cells. Biochem. Pharmacol. 1981, 30, 31–43. [Google Scholar] [CrossRef]
- Mon, M.J.; Jansing, R.L.; Doggett, S.; Stein, J.L.; Stein, G.S. Influence of delta9-tetrahydrocannabinol on cell proliferation and macromolecular biosynthesis in human cells. Biochem. Pharmacol. 1978, 27, 1759–1765. [Google Scholar] [CrossRef]
- Nahas, G.G.; Morishima, A.; Desoize, B. Effects of cannabinoids on macromolecular synthesis and replication of cultured lymphocytes. Fed. Proc. 1977, 36, 1748–1752. [Google Scholar]
- McClean, D.K.; Zimmerman, A.M. Action of delta 9-tetrahydrocannabinol on cell division and macromolecular synthesis in division-synchronized protozoa. Pharmacology 1976, 14, 307–321. [Google Scholar] [CrossRef]
- Wang, J.; Yuan, W.; Li, M.D. Genes and pathways co-associated with the exposure to multiple drugs of abuse, including alcohol, amphetamine/methamphetamine, cocaine, marijuana, morphine, and/or nicotine: A review of proteomics analyses. Mol. Neurobiol. 2011, 44, 269–286. [Google Scholar] [CrossRef]
- DiNieri, J.A.; Wang, X.; Szutorisz, H.; Spano, S.M.; Kaur, J.; Casaccia, P.; Dow-Edwards, D.; Hurd, Y.L. Maternal cannabis use alters ventral striatal dopamine D2 gene regulation in the offspring. Biol. Psychiatry 2011, 70, 763–769. [Google Scholar] [CrossRef]
- Ellis, R.J.; Bara, A.; Vargas, C.A.; Frick, A.L.; Loh, E.; Landry, J.; Uzamere, T.O.; Callens, J.E.; Martin, Q.; Rajarajan, P.; et al. Prenatal Δ(9)-Tetrahydrocannabinol Exposure in Males Leads to Motivational Disturbances Related to Striatal Epigenetic Dysregulation. Biol. Psychiatry 2022, 92, 127–138. [Google Scholar] [CrossRef]
- Szutorisz, H.; Hurd, Y.L. Epigenetic Effects of Cannabis Exposure. Biol. Psychiatry 2016, 79, 586–594. [Google Scholar] [CrossRef] [PubMed]
- Szutorisz, H.; DiNieri, J.A.; Sweet, E.; Egervari, G.; Michaelides, M.; Carter, J.M.; Ren, Y.; Miller, M.L.; Blitzer, R.D.; Hurd, Y.L. Parental THC exposure leads to compulsive heroin-seeking and altered striatal synaptic plasticity in the subsequent generation. Neuropsychopharmacology 2014, 39, 1315–1323. [Google Scholar] [CrossRef] [PubMed]
- Watson, C.T.; Szutorisz, H.; Garg, P.; Martin, Q.; Landry, J.A.; Sharp, A.J.; Hurd, Y.L. Genome-Wide DNA Methylation Profiling Reveals Epigenetic Changes in the Rat Nucleus Accumbens Associated With Cross-Generational Effects of Adolescent THC Exposure. Neuropsychopharmacology 2015, 40, 2993–3005. [Google Scholar] [CrossRef] [PubMed]
- Szutorisz, H.; Hurd, Y.L. High times for cannabis: Epigenetic imprint and its legacy on brain and behavior. Neurosci. Biobehav. Rev. 2018, 85, 93–101. [Google Scholar] [CrossRef]
- Schrott, R.; Murphy, S.K.; Modliszewski, J.L.; King, D.E.; Hill, B.; Itchon-Ramos, N.; Raburn, D.; Price, T.; Levin, E.D.; Vandrey, R.; et al. Refraining from use diminishes cannabis-associated epigenetic changes in human sperm. Environ. Epigenetics 2021, 7, dvab009. [Google Scholar] [CrossRef]
- Murphy, S.K.; Itchon-Ramos, N.; Visco, Z.; Huang, Z.; Grenier, C.; Schrott, R.; Acharya, K.; Boudreau, M.H.; Price, T.M.; Raburn, D.J.; et al. Cannabinoid exposure and altered DNA methylation in rat and human sperm. Epigenetics 2018, 13, 1208–1221. [Google Scholar] [CrossRef]
- Schrott, R.; Acharya, K.; Itchon-Ramos, N.; Hawkey, A.B.; Pippen, E.; Mitchell, J.T.; Kollins, S.H.; Levin, E.D.; Murphy, S.K. Cannabis use is associated with potentially heritable widespread changes in autism candidate gene DLGAP2 DNA methylation in sperm. Epigenetics 2020, 15, 161–173. [Google Scholar] [CrossRef]
- Mon, M.J.; Haas, A.E.; Stein, J.L.; Stein, G.S. Influence of psychoactive and nonpsychoactive cannabinoids on chromatin structure and function in human cells. Biochem. Pharmacol. 1981, 30, 45–58. [Google Scholar] [CrossRef]
- Yang, X.; Hegde, V.L.; Rao, R.; Zhang, J.; Nagarkatti, P.S.; Nagarkatti, M. Histone modifications are associated with Delta9-tetrahydrocannabinol-mediated alterations in antigen-specific T cell responses. J. Biol. Chem. 2014, 289, 18707–18718. [Google Scholar] [CrossRef]
- Reece, A.S.; Hulse, G.K. Quadruple Convergence–Rising cannabis prevalence, intensity, concentration and use disorder treatment. Lancet Reg. Health-Eur. 2021, 10, 100245–100246. [Google Scholar] [CrossRef]
- Manthey, J.; Freeman, T.P.; Kilian, C.; Lopez-Pelayo, H.; Rehm, J. Public health monitoring of cannabis use in Europe: Prevalence of use, cannabis potency, and treatment rates. Lancet Reg. Health-Eur. 2021, 10, 100227–200237. [Google Scholar] [CrossRef] [PubMed]
- Tahir, S.K.; Trogadis, J.E.; Stevens, J.K.; Zimmerman, A.M. Cytoskeletal organization following cannabinoid treatment in undifferentiated and differentiated PC12 cells. Biochem. Cell Biol. 1992, 70, 1159–1173. [Google Scholar] [CrossRef] [PubMed]
- Vela, G.; Martin, S.; Garcia-Gil, L.; Crespo, J.A.; Ruiz-Gayo, M.; Fernandez-Ruiz, J.J.; Garcia-Lecumberri, C.; Pelaprat, D.; Fuentes, J.A.; Ramos, J.A.; et al. Maternal exposure to delta9-tetrahydrocannabinol facilitates morphine self-administration behavior and changes regional binding to central mu opioid receptors in adult offspring female rats. Brain Res. 1998, 807, 101–109. [Google Scholar] [CrossRef]
- Busch, F.W.; Seid, D.A.; Wei, E.T. Mutagenic activity of marihuana smoke condensates. Cancer Lett. 1979, 6, 319–324. [Google Scholar] [CrossRef]
- Koller, V.J.; Ferk, F.; Al-Serori, H.; Misik, M.; Nersesyan, A.; Auwarter, V.; Grummt, T.; Knasmuller, S. Genotoxic properties of representatives of alkylindazoles and aminoalkyl-indoles which are consumed as synthetic cannabinoids. Food Chem. Toxicol. 2015, 80, 130–136. [Google Scholar] [CrossRef]
- Tahir, S.K.; Zimmerman, A.M. Influence of marihuana on cellular structures and biochemical activities. Pharmacol. Biochem. Behav. 1991, 40, 617–623. [Google Scholar] [CrossRef]
- Zimmerman, A.M.; Raj, A.Y. Influence of cannabinoids on somatic cells in vivo. Pharmacology 1980, 21, 277–287. [Google Scholar] [CrossRef]
- Koller, V.J.; Auwarter, V.; Grummt, T.; Moosmann, B.; Misik, M.; Knasmuller, S. Investigation of the in vitro toxicological properties of the synthetic cannabimimetic drug CP-47,497-C8. Toxicol. Appl. Pharmacol. 2014, 277, 164–171. [Google Scholar] [CrossRef]
- Sarafian, T.A.; Habib, N.; Oldham, M.; Seeram, N.; Lee, R.P.; Lin, L.; Tashkin, D.P.; Roth, M.D. Inhaled marijuana smoke disrupts mitochondrial energetics in pulmonary epithelial cells in vivo. Am. J. Physiol. 2006, 290, L1202–L1209. [Google Scholar] [CrossRef]
- Sarafian, T.A.; Kouyoumjian, S.; Khoshaghideh, F.; Tashkin, D.P.; Roth, M.D. Delta 9-tetrahydrocannabinol disrupts mitochondrial function and cell energetics. Am. J. Physiol. 2003, 284, L298–L306. [Google Scholar]
- Hölzel, B.N.; Pfannkuche, K.; Allner, B.; Allner, H.T.; Hescheler, J.; Derichsweiler, D.; Hollert, H.; Schiwy, A.; Brendt, J.; Schaffeld, M.; et al. Following the adverse outcome pathway from micronucleus to cancer using H2B-eGFP transgenic healthy stem cells. Arch. Toxicol. 2020, 94, 3265–3280. [Google Scholar] [CrossRef] [PubMed]
- Singh, N.; Hroudova, J.; Fisar, Z. Cannabinoid-Induced Changes in the Activity of Electron Transport Chain Complexes of Brain Mitochondria. J. Mol. Neurosci. 2015, 56, 926–931. [Google Scholar] [CrossRef] [PubMed]
- Fisar, Z.; Singh, N.; Hroudova, J. Cannabinoid-induced changes in respiration of brain mitochondria. Toxicol. Lett. 2014, 231, 62–71. [Google Scholar] [CrossRef] [PubMed]
- Morimoto, S.; Tanaka, Y.; Sasaki, K.; Tanaka, H.; Fukamizu, T.; Shoyama, Y.; Shoyama, Y.; Taura, F. Identification and characterization of cannabinoids that induce cell death through mitochondrial permeability transition in Cannabis leaf cells. J. Biol. Chem. 2007, 282, 20739–20751. [Google Scholar] [CrossRef]
- Canto, C.; Menzies, K.J.; Auwerx, J. NAD(+) Metabolism and the Control of Energy Homeostasis: A Balancing Act between Mitochondria and the Nucleus. Cell Metab. 2015, 22, 31–53. [Google Scholar] [CrossRef]
- Gant, J. Scientists are baffled by spatter of babies born without hands or arms in France, as investigation fails to discover a cause. In Daily Mail; Daily Mail: London, UK, 2019. [Google Scholar]
- Agence France-Presse in Paris: France to investigate cause of upper limb defects in babies. In The Guardian; The Guardian: London, UK, 2018.
- Willsher, K. Baby arm defects prompt nationwide investigation in France. In Guardian; The Guardian: London, UK, 2018. [Google Scholar]
- Babies Born with Deformed Hands Spark Investigation in Germany. Available online: https://edition.cnn.com/2019/09/16/health/hand-deformities-babies-gelsenkirchen-germany-intl-scli-grm/index.html (accessed on 10 March 2022).
- Eurocat Data: Prevalence Charts and Tables. Available online: https://eu-rd-platform.jrc.ec.europa.eu/eurocat/eurocat-data/prevalence_en (accessed on 10 January 2022).
- Global Health Observatory. Available online: https://www.who.int/data/gho/data/indicators/indicator-details/GHO/total-(recorded-unrecorded)-alcohol-per-capita-(15-)-consumption (accessed on 10 January 2022).
- European Monitoring Centre for Drugs and Drug Addiction (EMCDDA): Statistical Bulletin 2021—Prevalence of Drug Use. Available online: https://www.emcdda.europa.eu/data/stats2021/gps_en (accessed on 10 January 2022).
- The World Bank: Crude Data: Adjusted Net National Income per Capita (Current US$). Available online: https://data.worldbank.org/indicator/NY.ADJ.NNTY.PC.CD (accessed on 10 January 2022).
- R: A Language and Environment for Statistical Computing. Available online: https://cran.r-project.org/ (accessed on 10 January 2022).
- Wickham, H.; Averick, M.; Bryan, J.; Chang, W.; McGowan, L.D.; Francios, R.; Groelmund, G.; Hayes, A.; Henry, L.; Hester, J.; et al. Welcome to the Tidyverse. J. Open Source Softw. 2019, 4, 1686–1691. [Google Scholar] [CrossRef]
- Pebesma, E. Simple Features for R: Standardized Support for Spatial Vector Data. R J. 2018, 10, 439–446. [Google Scholar] [CrossRef]
- Viridis: Default Color Maps from ‘matplotlib’. Available online: https://CRAN.R-project.org/package=viridis (accessed on 10 January 2022).
- Colorplaner: ggplot2 Extension to Visualize Two Variables Per Color Aesthetic through Colorspace Projection. Available online: https://github.com/wmurphyrd/colorplaner (accessed on 10 January 2022).
- Pinheiro, J.; Bates, D.; DebRoy, S.; Sarkar, D.; R Core Team. Nlme: Linear and Nonlinear Mixed Effects Models, vol. 1: R: Comprehensive R Archive Network. Available online: https://cran.r-project.org/web/packages/nlme/index.html (accessed on 10 January 2022).
- Broom.mixed: Tidying Methods for Mixed Models. Available online: http://github.com/bbolker/broom.mixed (accessed on 10 January 2022).
- Broom: Convert Statistical Objects into Tidy Tibbles. Available online: https://CRAN.R-project.org/package=broom (accessed on 10 January 2022).
- Leeper, T.J. Margins: Marginal Effects for Model Objects, R package version 0.3.26; Leeper, T.J., Ed.; Massachusetts Institute of Technology: Cambridge, MA, USA, 2021; Volume 1, pp. 1–36. Available online: https://rdrr.io/cran/margins/ (accessed on 10 January 2022).
- Wright, M.N.; Ziegler, A. Ranger: A Fast Implementation of Random Forests for High Dimensional Data in C++ and R. J. Stat. Softw. 2017, 77, 1–17. [Google Scholar] [CrossRef]
- Greenwell, B.M.; Boehmke, B.C. Variable Importance Plots—An Introduction to the vip Package. R J. 2021, 12, 343–366. [Google Scholar] [CrossRef]
- Package ‘plm’. Available online: https://cran.r-project.org/web/packages/plm/plm.pdf (accessed on 10 January 2022).
- Bivand, R.; Anselin, L.; Berke, O.; Bernat, A.; Carvalho, M.; Chun, Y.; Dormann, C.; Dray, S.; Halbersma, R.; Lewis-Koh, N.; et al. The spdep Package. In CRAN; 2007; pp. 1–143. Available online: https://cran.r-project.org/web/packages/spdep/index.html (accessed on 10 January 2022).
- Millo, G.; Piras, G. Splm: Spatial Panel Data Models in R. J. Stastistical Softw. 2012, 47, 1–38. [Google Scholar]
- Millo, G.; Piras, G. Package ‘splm’; CRAN (Central R-Archive Network): Trieste, Italy, 2018; pp. 1–27. Available online: https://cran.r-project.org/web/packages/splm/splm.pdf (accessed on 10 January 2022).
- Croissant, Y.; Millo, G. Panel Data Econometrics with R. John Wiley and Sons: Oxford, UK, 2019; Volume 1. [Google Scholar]
- Wal, W.; Geskus, R. Ipw: An R Package for Inverse Probability Weighting. J. Stat. Softw. 2011, 43, 1–23. [Google Scholar] [CrossRef]
- VanderWeele, T.J.; Ding, P. Sensitivity Analysis in Observational Research: Introducing the E-Value. Ann. Intern. Med. 2017, 167, 268–274. [Google Scholar] [CrossRef]
- VanderWeele, T.J.; Martin, J.N.; Mathur, M.B. E-values and incidence density sampling. Epidemiology 2020, 31, e51–e52. [Google Scholar] [CrossRef] [PubMed]
- VanderWeele, T.J.; Mathur, M.B. Commentary: Developing best-practice guidelines for the reporting of E-values. Int. J. Epidemiol. 2020, 49, 1495–1497. [Google Scholar] [CrossRef] [PubMed]
- VanderWeele, T.J.; Ding, P.; Mathur, M. Technical Considerations in the Use of the E-Value. J. Causal Inference 2019, 7, 1–11. [Google Scholar] [CrossRef]
- Pearl, J.; Mackaenzie, D. The Book of Why. In The New Science of Cause and Effect; Basic Books: New York, NY, USA, 2019; Volume 1. [Google Scholar]
- Package ‘EValue’. Available online: https://cran.r-project.org/web/packages/EValue/EValue.pdf (accessed on 10 January 2022).
- Howell, S.; Endo, T.; MacLeod, S.; Cornes, S. Congenital Anomalies in Queensland: 1 July 2007 to 30 June 2010. Stat. Anal. Rep. 2011, 1, 1–22. [Google Scholar]
- Reece, A.S.; Hulse, G.K. Chromothripsis and epigenomics complete causality criteria for cannabis- and addiction-connected carcinogenicity, congenital toxicity and heritable genotoxicity. Mutat. Res. 2016, 789, 15–25. [Google Scholar] [CrossRef]
- Reece, A.S.; Hulse, G.K. Impacts of cannabinoid epigenetics on human development: Reflections on Murphy et. Al. ‘cannabinoid exposure and altered DNA methylation in rat and human sperm.’ Epigenetics 2018; 13: 1208–1221. Epigenetics 2019, 14, 1041–1056. [Google Scholar] [CrossRef]
- Reece, A.S.; Hulse, G.K. Geotemporospatial and Causal Inferential Epidemiological Overview and Survey of USA Cannabis, Cannabidiol and Cannabinoid Genotoxicity Expressed in Cancer Incidence 2003–2017: Part 1–Continuous Bivariate Analysis. Arch. Public Health, 2022; in press. [Google Scholar]
- Reece, A.S.; Hulse, G.K. Geotemporospatial and Causal Inferential Epidemiological Overview and Survey of USA Cannabis, Cannabidiol and Cannabinoid Genotoxicity Expressed in Cancer Incidence 2003–2017: Part 2–Categorical Bivariate Analysis and Attributable Fractions. Arch. Public Health, 2022; in press. [Google Scholar]
- Reece, A.S.; Hulse, G.K. Geotemporospatial and Causal Inferential Epidemiological Overview and Survey of USA Cannabis, Cannabidiol and Cannabinoid Genotoxicity Expressed in Cancer Incidence 2003–2017: Part 3–Spatiotemporal, Multivariable and Causal Inferential Pathfinding and Exploratory Analyses of Prostate and Ovarian Cancers. Arch. Public Health, 2022; in press. [Google Scholar]
- Reece, A.S.; Hulse, G.K. Cannabinoid exposure as a major driver of pediatric acute lymphoid Leukaemia rates across the USA: Combined geospatial, multiple imputation and causal inference study. BMC Cancer 2021, 21, 984. [Google Scholar] [CrossRef]
- Reece, A.S.; Hulse, G.K. A geospatiotemporal and causal inference epidemiological exploration of substance and cannabinoid exposure as drivers of rising US pediatric cancer rates. BMC Cancer 2021, 21, 197. [Google Scholar] [CrossRef]
- Reece, A.S.; Hulse, G.K. Causal inference multiple imputation investigation of the impact of cannabinoids and other substances on ethnic differentials in US testicular cancer incidence. BMC Pharm. Toxicol. 2021, 22, 40. [Google Scholar] [CrossRef] [PubMed]
- Reece, A.S. Rapid Response: Known Cannabis Teratogenicity Needs to be Carefully Considered. BMJ 2018, 362, k3357. [Google Scholar]
- Reece, A.S. Rapid Response: Cannabinoid Genotoxic Trifecta-Cancerogenesis, Clinical Teratogenesis and Cellular Ageing. Br. Med. J. 2022, 376, n3114. [Google Scholar]
- Reece, A.S.; Hulse, G.K. Cannabis Genotoxicity Cancer Incidence: A Highly Concordant Synthesis of European and USA Datasets. In Cannabis, Cannabinoids and Endocannabinoids, Volume 1; Preedy, V., Patel, V., Eds.; Elsevier: London, UK, 2022; in press. [Google Scholar]
- Reece, A.S.; Hulse, G.K. Geospatiotemporal and Causal Inference Study of Cannabis and Other Drugs as Risk Factors for Female Breast Cancer USA 2003–2017. Environ. Epigenetics, 2022; in press. [Google Scholar]
- Reece, A.S.; Hulse, G.K. Epidemiological Overview of Cannabis- and Substance- Carcinogenesis in Europe: A Lagged Causal Inferential Panel Regression Modelling and Marginal Effects Study. 2022; manuscript submitted. [Google Scholar]
- Reece, A.S.; Hulse, G.K. Novel Insights into Potential Cannabis-Related Cancerogenesis from Recent Key Whole Epigenome Screen of Cannabis Dependence and Withdrawal: Epidemiological Comment and Explication of Schrott et al. 2022; manuscript submitted. [Google Scholar]
- Reece, A.S.; Hulse, G.K. Cannabis in Pregnancy–Rejoinder, Exposition and Cautionary Tales. Psychiatr. Times 2020, 37. Available online: https://www.bing.com/search?q=Cannabis+in+Pregnancy+%E2%80%93+Rejoinder%82C+Exposition+and+Cautionary+Tales&cvid=22538e20124c04711b92017489c92063214a&aqs=edge..92017469i92017457.92017439j92017480j92017481&pglt=92017443&FORM=ANSPA92017481&PC=U92017531 (accessed on 10 January 2022).
- Reece, A.S.; Hulse, G.K. Epidemiological Overview of Multidimensional Chromosomal and Genome Toxicity of Cannabis Exposure in Congenital Anomalies and Cancer Development. Sci. Rep. 2021, 11, 13892–13912. [Google Scholar]
- Fish, E.W.; Murdaugh, L.B.; Zhang, C.; Boschen, K.E.; Boa-Amponsem, O.; Mendoza-Romero, H.N.; Tarpley, M.; Chdid, L.; Mukhopadhyay, S.; Cole, G.J.; et al. Cannabinoids Exacerbate Alcohol Teratogenesis by a CB1-Hedgehog Interaction. Sci. Rep. 2019, 9, 16057–16075. [Google Scholar] [CrossRef]
- Fraher, D.; Ellis, M.K.; Morrison, S.; McGee, S.L.; Ward, A.C.; Walder, K.; Gibert, Y. Lipid Abundance in Zebrafish Embryos Is Regulated by Complementary Actions of the Endocannabinoid System and Retinoic Acid Pathway. Endocrinology 2015, 156, 3596–3609. [Google Scholar] [CrossRef]
- Kučukalić, S.; Ferić Bojić, E.; Babić, R.; Avdibegović, E.; Babić, D.; Agani, F.; Jakovljević, M.; Kučukalić, A.; Bravo Mehmedbašić, A.; Šabić Džananović, E.; et al. Genetic Susceptibility to Posttraumatic Stress Disorder: Analyses of the Oxytocin Receptor, Retinoic Acid Receptor-Related Orphan Receptor A and Cannabinoid Receptor 1 Genes. Psychiatr. Danub. 2019, 31, 219–226. [Google Scholar] [CrossRef]
- Lee, Y.S.; Jeong, W.I. Retinoic acids and hepatic stellate cells in liver disease. J. Gastroenterol. Hepatol. 2012, 27, 75–79. [Google Scholar] [CrossRef]
- Frampton, G.; Coufal, M.; Li, H.; Ramirez, J.; DeMorrow, S. Opposing actions of endocannabinoids on cholangiocarcinoma growth is via the differential activation of Notch signaling. Exp. Cell Res. 2010, 316, 1465–1478. [Google Scholar] [CrossRef]
- Tanveer, R.; Gowran, A.; Noonan, J.; Keating, S.E.; Bowie, A.G.; Campbell, V.A. The endocannabinoid, anandamide, augments Notch-1 signaling in cultured cortical neurons exposed to amyloid-beta and in the cortex of aged rats. J. Biol. Chem. 2012, 287, 34709–34721. [Google Scholar] [CrossRef] [PubMed]
- Xapelli, S.; Agasse, F.; Sarda-Arroyo, L.; Bernardino, L.; Santos, T.; Ribeiro, F.F.; Valero, J.; Braganca, J.; Schitine, C.; de Melo Reis, R.A.; et al. Activation of type 1 cannabinoid receptor (CB1R) promotes neurogenesis in murine subventricular zone cell cultures. PLoS ONE 2013, 8, e63529. [Google Scholar] [CrossRef] [PubMed]
- Kim, D.; Lim, S.; Park, M.; Choi, J.; Kim, J.; Han, H.; Yoon, K.; Kim, K.; Lim, J.; Park, S. Ubiquitination-dependent CARM1 degradation facilitates Notch1-mediated podocyte apoptosis in diabetic nephropathy. Cell. Signal. 2014, 26, 1774–1782. [Google Scholar] [CrossRef]
- Niu, F.; Zhao, S.; Xu, C.Y.; Sha, H.; Bi, G.B.; Chen, L.; Ye, L.; Gong, P.; Nie, T.H. Potentiation of the antitumor activity of adriamycin against osteosarcoma by cannabinoid WIN-55,212-2. Oncol. Lett. 2015, 10, 2415–2421. [Google Scholar] [CrossRef] [PubMed]
- Vallee, A.; Lecarpentier, Y.; Guillevin, R.; Vallee, J.N. Effects of cannabidiol interactions with Wnt/beta-catenin pathway and PPARgamma on oxidative stress and neuroinflammation in Alzheimer’s disease. Acta Biochim. Biophys. Sin. (Shanghai) 2017, 49, 853–866. [Google Scholar] [CrossRef] [PubMed]
- Nallathambi, R.; Mazuz, M.; Namdar, D.; Shik, M.; Namintzer, D.; Vinayaka, A.C.; Ion, A.; Faigenboim, A.; Nasser, A.; Laish, I.; et al. Identification of Synergistic Interaction Between Cannabis-Derived Compounds for Cytotoxic Activity in Colorectal Cancer Cell Lines and Colon Polyps That Induces Apoptosis-Related Cell Death and Distinct Gene Expression. Cannabis Cannabinoid Res. 2018, 3, 120–135. [Google Scholar] [CrossRef]
- Petko, J.; Tranchina, T.; Patel, G.; Levenson, R.; Justice-Bitner, S. Identifying novel members of the Wntless interactome through genetic and candidate gene approaches. Brain Res. Bull. 2018, 138, 96–105. [Google Scholar] [CrossRef]
- Xian, X.; Tang, L.; Wu, C.; Huang, L. MiR-23b-3p and miR-130a-5p affect cell growth, migration and invasion by targeting CB1R via the Wnt/beta-catenin signaling pathway in gastric carcinoma. OncoTargets Ther. 2018, 11, 7503–7512. [Google Scholar] [CrossRef]
- McKenzie, M.G.; Cobbs, L.V.; Dummer, P.D.; Petros, T.J.; Halford, M.M.; Stacker, S.A.; Zou, Y.; Fishell, G.J.; Au, E. Non-canonical Wnt Signaling through Ryk Regulates the Generation of Somatostatin- and Parvalbumin-Expressing Cortical Interneurons. Neuron 2019, 103, 853–864 e854. [Google Scholar] [CrossRef]
- Nalli, Y.; Dar, M.S.; Bano, N.; Rasool, J.U.; Sarkar, A.R.; Banday, J.; Bhat, A.Q.; Rafia, B.; Vishwakarma, R.A.; Dar, M.J.; et al. Analyzing the role of cannabinoids as modulators of Wnt/beta-catenin signaling pathway for their use in the management of neuropathic pain. Bioorganic Med. Chem. Lett. 2019, 29, 1043–1046. [Google Scholar] [CrossRef]
- Aguado, T.; Romero, E.; Monory, K.; Palazuelos, J.; Sendtner, M.; Marsicano, G.; Lutz, B.; Guzmán, M.; Galve-Roperh, I. The CB1 cannabinoid receptor mediates excitotoxicity-induced neural progenitor proliferation and neurogenesis. J. Biol. Chem. 2007, 282, 23892–23898. [Google Scholar] [CrossRef] [PubMed]
- Williams, E.J.; Walsh, F.S.; Doherty, P. The FGF receptor uses the endocannabinoid signaling system to couple to an axonal growth response. J. Cell Biol. 2003, 160, 481–486. [Google Scholar] [CrossRef]
- Asimaki, O.; Leondaritis, G.; Lois, G.; Sakellaridis, N.; Mangoura, D. Cannabinoid 1 receptor-dependent transactivation of fibroblast growth factor receptor 1 emanates from lipid rafts and amplifies extracellular signal-regulated kinase 1/2 activation in embryonic cortical neurons. J. Neurochem. 2011, 116, 866–873. [Google Scholar] [CrossRef] [PubMed]
- Birerdinc, A.; Jarrar, M.; Stotish, T.; Randhawa, M.; Baranova, A. Manipulating molecular switches in brown adipocytes and their precursors: A therapeutic potential. Prog. Lipid Res. 2013, 52, 51–61. [Google Scholar] [CrossRef] [PubMed]
- Richard, D.; Picard, F. Brown fat biology and thermogenesis. Front. Biosci. (Landmark Ed) 2011, 16, 1233–1260. [Google Scholar] [CrossRef] [PubMed]
- Xu, T.R.; Yang, Y.; Ward, R.; Gao, L.; Liu, Y. Orexin receptors: Multi-functional therapeutic targets for sleeping disorders, eating disorders, drug addiction, cancers and other physiological disorders. Cell. Signal. 2013, 25, 2413–2423. [Google Scholar] [CrossRef]
- Reece, A.S.; Hulse, G.K. Cannabis Consumption Patterns Explain the East-West Gradient in Canadian Neural Tube Defect Incidence: An Ecological Study. Glob. Pediatr. Health 2019, 6, 1–12. [Google Scholar] [CrossRef]
- Reece, A.S.; Hulse, G.K. Cannabis Teratology Explains Current Patterns of Coloradan Congenital Defects: The Contribution of Increased Cannabinoid Exposure to Rising Teratological Trends. Clin. Pediatr. (Phila) 2019, 58, 1085–1123. [Google Scholar] [CrossRef]
- Reece, A.S.; Hulse, G.K. Epigenomic and Other Evidence for Cannabis-Induced Aging Contextualized in a Synthetic Epidemiologic Overview of Cannabinoid-Related Teratogenesis and Cannabinoid-Related Carcinogenesis. 2022; manuscript submitted. [Google Scholar]
- Reece, A.S.; Norman, A.; Hulse, G.K. Cannabis exposure as an interactive cardiovascular risk factor and accelerant of organismal ageing: A longitudinal study. BMJ Open 2016, 6, e011891–e011901. [Google Scholar] [CrossRef]
- Bluhm, E.C.; Daniels, J.; Pollock, B.H.; Olshan, A.F. Maternal use of recreational drugs and neuroblastoma in offspring: A report from the Children’s Oncology Group (United States). Cancer Causes Control 2006, 17, 663–669. [Google Scholar] [CrossRef]
- Hashibe, M.; Straif, K.; Tashkin, D.P.; Morgenstern, H.; Greenland, S.; Zhang, Z.F. Epidemiologic review of marijuana use and cancer risk. Alcohol (Fayetteville, NY) 2005, 35, 265–275. [Google Scholar] [CrossRef] [PubMed]
- Robison, L.L.; Buckley, J.D.; Daigle, A.E.; Wells, R.; Benjamin, D.; Arthur, D.C.; Hammond, G.D. Maternal drug use and risk of childhood nonlymphoblastic leukemia among offspring. An epidemiologic investigation implicating marijuana (a report from the Childrens Cancer Study Group). Cancer 1989, 63, 1904–1911. [Google Scholar] [CrossRef]
- Reece, A.S.; Hulse, G.K. Epidemiological Associations of Various Substances and Multiple Cannabinoids with Autism in USA. Clin. Pediatr. Open Access 2019, 4, 1–20. [Google Scholar] [CrossRef]
- Reece, A.S.; Hulse, G.K. Effect of Cannabis Legalization on US Autism Incidence and Medium Term Projections. Clin. Pediatr. Open Access 2019, 4, 1–17. [Google Scholar] [CrossRef]
- Reece, A.S.; Hulse, G.K. Gastroschisis and Autism-Dual Canaries in the Californian Coalmine. JAMA Surg. 2019, 154, 366–367. [Google Scholar] [CrossRef]
- Brents, L. Correlates and consequences of Prenatal Cannabis Exposure (PCE): Identifying and Characterizing Vulnerable Maternal Populations and Determining Outcomes in Exposed Offspring. In Handbook of Cannabis and Related Pathologies: Biology, Pharmacology, Diagnosis and Treatment, Volume 1; Preedy, V.R., Ed.; Academic Press: London, UK, 2017; pp. 160–170. [Google Scholar]
- Porath, A.J.; Fried, P.A. Effects of prenatal cigarette and marijuana exposure on drug use among offspring. Neurotoxicol. Teratol. 2005, 27, 267–277. [Google Scholar] [CrossRef]
- Smith, A.; Fried, P.; Hogan, M.; Cameron, I. The effects of prenatal and current marijuana exposure on response inhibition: A functional magnetic resonance imaging study. Brain Cogn. 2004, 54, 147–149. [Google Scholar]
- Smith, A.M.; Fried, P.A.; Hogan, M.J.; Cameron, I. Effects of prenatal marijuana on response inhibition: An fMRI study of young adults. Neurotoxicol. Teratol. 2004, 26, 533–542. [Google Scholar] [CrossRef]
- Smith, A.M.; Fried, P.A.; Hogan, M.J.; Cameron, I. Effects of prenatal marijuana on visuospatial working memory: An fMRI study in young adults. Neurotoxicol. Teratol. 2006, 28, 286–295. [Google Scholar] [CrossRef]
- Smith, A.M.; Longo, C.A.; Fried, P.A.; Hogan, M.J.; Cameron, I. Effects of marijuana on visuospatial working memory: An fMRI study in young adults. Psychopharmacology 2010, 210, 429–438. [Google Scholar] [CrossRef]
- Smith, A.M.; Mioduszewski, O.; Hatchard, T.; Byron-Alhassan, A.; Fall, C.; Fried, P.A. Prenatal marijuana exposure impacts executive functioning into young adulthood: An fMRI study. Neurotoxicol. Teratol. 2016, 58, 53–59. [Google Scholar] [CrossRef] [PubMed]


| Anomaly | Substance | Mean Anomaly Rate | Estimate | Std. Error | Sigma | t_Statistic | p-Value | E-Value Estimate | E-Value Lower Bound |
|---|---|---|---|---|---|---|---|---|---|
| Abdominal Wall Defx | Resin | 5.5353 | 2.7392 | 0.5709 | 0.5132 | 4.7978 | 5.33 × 10⁻⁶ | 256.74 | 35.01 |
| Omphalocele | Resin | 2.7816 | 2.7388 | 0.7248 | 0.6516 | 3.7785 | 2.62 × 10⁻⁴ | 91.17 | 12.13 |
| Omphalocele | Herb | 2.7816 | 4.7907 | 1.7523 | 0.6813 | 2.7340 | 0.0072 | 1201.30 | 11.83 |
| Omphalocele | LMCannabis_Resin | 2.7816 | 1.6382 | 0.5575 | 0.6676 | 2.9384 | 0.0041 | 18.14 | 3.64 |
| Abdominal Wall Defx | Herb | 5.5353 | 3.3920 | 1.5215 | 0.5916 | 2.2294 | 0.0276 | 368.45 | 3.20 |
| Gastroschisis | Resin | 2.2386 | 1.7497 | 0.7518 | 0.6759 | 2.3273 | 0.0219 | 20.58 | 2.27 |
| Diaphragmatic Hernia | LM.Cannabis_x_Herb.THC_x_Daily.Interpol. | 2.4082 | 1.7433 | 0.7672 | 0.6550 | 2.2723 | 0.0250 | 22.03 | 2.15 |
| Diaphragmatic Hernia | Daily.Interpol. | 2.4082 | 0.9085 | 0.3604 | 0.6744 | 2.5208 | 0.0133 | 6.27 | 1.96 |
| Abdominal Wall Defx | Log(Amphetamine) | 5.5353 | 0.2919 | 0.0709 | 0.5651 | 4.1184 | 7.04 × 10⁻⁵ | 2.58 | 1.88 |
| Omphalocele | LMCannabis_Herb | 2.7816 | 4.8916 | 2.4053 | 0.6905 | 2.0337 | 0.0442 | 1261.19 | 1.88 |
| Gastroschisis | Log(Amphetamine) | 2.2386 | 0.3202 | 0.0795 | 0.6341 | 4.0274 | 9.93 × 10⁻⁵ | 2.54 | 1.85 |
| Omphalocele | Cocaine | 2.7816 | 0.2500 | 0.0844 | 0.6779 | 2.9621 | 0.0037 | 2.15 | 1.49 |
| Diaphragmatic Hernia | Cocaine | 2.4082 | 0.2261 | 0.0790 | 0.6344 | 2.8624 | 0.0050 | 2.11 | 1.45 |
| Abdominal Wall Defx | LMCannabis_Resin | 5.5353 | 0.9464 | 0.4642 | 0.5558 | 2.0388 | 0.0440 | 8.89 | 1.33 |
| Parameter Values | Model Parameters | ||||
|---|---|---|---|---|---|
| Parameter | Estimate (C.I.) | p-Value | Parameter | Value | Significance |
| Additive | |||||
| Rate~Tobacco + Alcohol + LM.Cannabis_x_Resin.THC + Daily.Interpol. + LM.Cannabis_x_Resin.THC_x_Daily.Interpol. + LM.Cannabis_x_Herb.THC_x_Daily.Interpol. + Amphetamines + Cocaine + Income | |||||
| Tobacco | 0.06 (0.03, 0.09) | 0.0003 | rho | 0.4379 | 0.0111 |
| Daily.Interpol. | −37 (−55.44, −18.56) | 8.58 × 10⁻⁵ | lambda | −0.2487 | 0.141 |
| LM.Cannabis_x_Resin.THC_x_Daily.Interpol. | 1.26 (0.38, 2.14) | 0.0052 | |||
| Amphetamines | 0.26 (0.1, 0.41) | 0.0010 | |||
| Income | 0 (0, 0) | 1.88 × 10⁻⁶ | |||
| Interactive | |||||
| Rate~Tobacco * Daily.Interpol. + LM.Cannabis_x_Resin.THC_x_Daily.Interpol. + LM.Cannabis_x_Herb.THC_x_Daily.Interpol. + LM.Cannabis_x_Resin.THC + Alcohol + Amphetamines + Cocaine + Income | |||||
| Tobacco | 0.08 (0.04, 0.11) | 5.33 × 10⁻⁶ | rho | 0.4924 | 0.000429 |
| LM.Cannabis_x_Herb.THC_x_Daily.Interpol. | 4.36 (1.66, 7.06) | 0.0016 | lambda | −0.3162 | 0.0265 |
| Amphetamines | 0.28 (0.13, 0.43) | 0.0003 | |||
| Income | 0 (0, 0) | 4.39 × 10⁻⁸ | |||
| Tobacco: Daily.Interpol. | −2.28 (−3.34, −1.22) | 2.51 × 10⁻⁵ | |||
| 2 Lags | |||||
| Rate~Tobacco * Daily.Interpol. + LM.Cannabis_x_Resin.THC_x_Daily.Interpol. + LM.Cannabis_x_Resin.THC + LM.Cannabis_x_Herb.THC_x_Daily.Interpol. + Alcohol + Amphetamines + Cocaine + Income | |||||
| Tobacco | 0.16 (0.1, 0.23) | 4.54 × 10⁻⁷ | rho | 0.01062 | 0.975 |
| Daily.Interpol. | 182 (35.2, 328.8) | 0.0153 | lambda | −0.1374 | 0.642 |
| Alcohol | −0.12 (−0.21, −0.03) | 0.0078 | |||
| Amphetamines | 0.21 (0.02, 0.41) | 0.0351 | |||
| Cocaine | −0.59 (−1.04, −0.14) | 0.0102 | |||
| Income | 0 (0, 0) | 4.09 × 10⁻⁸ | |||
| Tobacco: Daily. Interpol. | −6.77 (−12.22, −1.32) | 0.0148 | |||
| Parameter Values | Model Parameters | ||||
|---|---|---|---|---|---|
| Parameter | Estimate (C.I.) | p-Value | Parameter | Value | Significance |
| Additive | |||||
| Rate~Tobacco + Alcohol + LM.Cannabis_x_Resin.THC + Resin + LM.Cannabis_x_Resin.THC_x_Daily.Interpol. + LM.Cannabis_x_Herb.THC_x_Daily.Interpol. + Amphetamines + Cocaine + Income | |||||
| Alcohol | 0.1 (0.05, 0.15) | 5.28 × 10⁻⁵ | rho | 0.71867 | <2 × 10⁻¹⁶ |
| LM.Cannabis_x_Resin.THC | 2.74 (1.56, 3.92) | 5.28 × 10⁻⁶ | lambda | −0.7124 | 2.51 × 10⁻¹⁶ |
| LM.Cannabis_x_Herb.THC_x_Daily.Interpol. | −2.58 (−4.31, −0.85) | 0.0034 | |||
| Amphetamines | −0.14 (−0.26, −0.02) | 0.0258 | |||
| Cocaine | 0.35 (0.16, 0.54) | 0.0003 | |||
| Income | 0 (0, 0) | 0.0001 | |||
| Interactive | |||||
| Rate~Tobacco + LM.Cannabis_x_Resin.THC * Resin + LM.Cannabis_x_Resin.THC_x_Daily.Interpol. + LM.Cannabis_x_Herb.THC_x_Daily.Interpol. + Alcohol + Amphetamines + Cocaine + Income | |||||
| Tobacco | 0.06 (0.03, 0.09) | 1.34 × 10⁻⁵ | rho | −0.69372 | 7.36 × 10⁻¹³ |
| LM.Cannabis_x_Resin.THC | 0.81 (0.29, 1.34) | 0.0024 | lambda | 0.59539 | 1.32 × 10⁻⁹ |
| Income | 0 (0, 0) | 1.92 × 10⁻¹² | |||
| 2 Lags | |||||
| Rate~Tobacco + Resin * LM.Cannabis_x_Resin.THC + LM.Cannabis_x_Resin.THC_x_Daily.Interpol. + LM.Cannabis_x_Herb.THC_x_Daily.Interpol. + Alcohol + Amphetamines + Cocaine + Income | |||||
| Tobacco | 0.04 (0.01, 0.07) | 0.0176 | rho | −0.75365 | 2.49 × 10⁻¹⁶ |
| Resin | −5.02 (−7.55, −2.49) | 9.96 × 10⁻⁵ | lambda | 0.5649 | 1.03 × 10⁻⁷ |
| LM.Cannabis_x_Resin.THC | 6.42 (3.66, 9.18) | 5.36 × 10⁻⁶ | |||
| LM.Cannabis_x_Herb.THC_x_Daily.Interpol. | −5.34 (−8.44, −2.24) | 0.0007 | |||
| Alcohol | 0.07 (0.01, 0.13) | 0.0164 | |||
| Income | 0 (0, 0) | 5.50 × 10⁻¹¹ | |||
| Parameter Values | Model Parameters | ||||
|---|---|---|---|---|---|
| Parameter | Estimate (C.I.) | p-Value | Parameter | Value | Significance |
| Additive | |||||
| Rate~Tobacco + Alcohol + LM.Cannabis + Resin + LM.Cannabis_x_Resin.THC_x_Daily.Interpol. + LM.Cannabis_x_Herb.THC_x_Daily.Interpol. + Amphetamines + Cocaine + Income | |||||
| LM.Cannabis_x_Resin.THC_x_Daily.Interpol. | 0.89 (0.39, 1.4) | 0.0006 | rho | 0.5077 | 0.000167 |
| Income | 0 (0, 0) | 6.01 × 10⁻⁷ | lambda | −0.6497 | 2.38 × 10⁻⁸ |
| Interactive | |||||
| Rate~Tobacco + LM.Cannabis_x_Resin.THC * Resin + LM.Cannabis_x_Resin.THC_x_Daily.Interpol. + LM.Cannabis_x_Herb.THC_x_Daily.Interpol. + Alcohol + Amphetamines + Cocaine + Income | |||||
| LM.Cannabis_x_Resin.THC | 3.18 (2.12, 4.24) | 4.88 × 10⁻⁹ | rho | 0.6876 | <2.2 × 10⁻¹⁶ |
| Resin | −2.7 (−3.9, −1.5) | 1.03 × 10⁻⁵ | lambda | −0.80139 | <2.2 × 10⁻¹⁶ |
| Amphetamines | −0.13 (−0.23, −0.03) | 0.0086 | |||
| Income | 0 (0, 0) | 1.41 × 10⁻⁸ | |||
| 2 Lags | |||||
| Rate~Tobacco + Resin * LM.Cannabis_x_Resin.THC_x_Daily.Interpol. + Resin + LM.Cannabis_x_Herb.THC_x_Daily.Interpol. + Alcohol + Amphetamines + Cocaine + Income | |||||
| LM.Cannabis_x_Resin.THC_x_Daily.Interpol. | 1.61 (0.72, 2.5) | 0.0004 | rho | 0.391 | 0.103 |
| Income | 0 (0, 0) | 7.32 × 10⁻⁵ | lambda | −0.4411 | 0.0539 |
| Anomaly | Model and Term | p-Value | E-Value Estimate | Lower Bound E-Value |
|---|---|---|---|---|
| Gastroschisis | Additive | |||
| LM.Cannabis_x_Resin.THC_x_Daily.Interpol. | 2.45 × 10⁻¹⁴ | 34.18 | 17.78 | |
| Interactive | ||||
| LM.Cannabis_x_Resin.THC_x_Daily.Interpol. | 0.0006 | 216.81 | 15.7 | |
| Tobacco: LM.Cannabis_x_Herb.THC_x_Daily.Interpol. | 0.0043 | 1.78 | 1.35 | |
| Tobacco: LM.Cannabis_x_Resin.THC | 2.01 × 10⁻⁶ | 4.51 | 2.92 | |
| LM.Cannabis_x_Herb.THC_x_Daily.Interpol.: LM.Cannabis_x_Resin.THC | 7.50 × 10⁻⁵ | 2.11 × 1063 | 2.14 × 1060 | |
| 1 Lag | ||||
| Tobacco: LM.Cannabis_x_Herb.THC_x_Daily.Interpol. | 9.54 × 10⁻⁶ | 2.46 | 1.88 | |
| Tobacco: LM.Cannabis_x_Resin.THC | 0.0002 | 1.91 | 1.53 | |
| LM.Cannabis_x_Herb.THC_x_Daily.Interpol.: LM.Cannabis_x_Resin.THC | 9.28 × 10⁻⁶ | 7.52 × 1095 | 8.16 × 1055 | |
| 2 Lags | ||||
| Tobacco: LM.Cannabis_x_Herb.THC_x_Daily.Interpol. | 0.0097 | 1.7 | 1.27 | |
| Tobacco: LM.Cannabis_x_Resin.THC | 0.0003 | 6.75 | 3.13 | |
| LM.Cannabis_x_Herb.THC_x_Daily.Interpol.: LM.Cannabis_x_Resin.THC | 9.78 × 10⁻¹¹ | 1.86 × 10¹⁶ | 9.25 × 10¹¹ | |
| Omphalocele | Additive | |||
| LM.Cannabis_x_Resin.THC | 4.77 × 10⁻⁷ | 5.77 | 3.56 | |
| Interactive | ||||
| LM.Cannabis_x_Resin.THC | 0.0059 | 4.10 × 10⁵ | 80.95 | |
| 2 Lags | ||||
| LM.Cannabis_x_Resin.THC | 2.30 × 10⁻⁶ | 7.04 | 3.95 | |
| Diaphragmatic Hernia | Additive | |||
| LM.Cannabis_x_Resin.THC_x_Daily.Interpol. | 0.0162 | 3.38 | 1.55 | |
| LM.Cannabis | 0.0044 | 7.92 × 10⁷ | 600.88 | |
| Interactive | ||||
| LM.Cannabis_x_Herb.THC | 5.96 × 10⁻⁵ | 7.48 × 10²¹ | 5.55 × 10¹¹ | |
| Tobacco: LM.Cannabis_x_Herb.THC_x_Daily.Interpol.: LM.Cannabis_x_Herb.THC | 0.0281 | 3.67 | 1.41 | |
| 2 Lags | ||||
| LM.Cannabis_x_Resin.THC_x_Daily.Interpol. | <2.2 × 10⁻¹⁶ | 16.79 | 10.92 |
| Anomaly | Model and Term | p-Value | E-Value Estimate | Lower Bound E-Value |
|---|---|---|---|---|
| Gastroschisis | Additive | |||
| LM.Cannabis_x_Resin.THC_x_Daily.Interpol. | 0.0052 | 17.08 | 3.24 | |
| Interactive | ||||
| LM.Cannabis_x_Herb.THC_x_Daily.Interpol. | 0.0016 | 4.07 × 10³ | 35.65 | |
| 2 Lags | ||||
| Daily.Interpol. | 0.0153 | Infinity | 9.23 × 1044 | |
| Omphalocele | Additive | |||
| LM.Cannabis_x_Resin.THC | 5.28 × 10⁻⁶ | 772.14 | 59.28 | |
| Interactive | ||||
| LM.Cannabis_x_Resin.THC | 0.0024 | 8.41 | 2.80 | |
| 2 Lags | ||||
| LM.Cannabis_x_Resin.THC | 5.36 × 10⁻⁶ | 9.84 × 10⁵ | 3.51 × 10³ | |
| Diaphragmatic Hernia | Additive | |||
| LM.Cannabis_x_Resin.THC_x_Daily.Interpol. | 0.0006 | 10.29 | 3.57 | |
| Interactive | ||||
| LM.Cannabis_x_Resin.THC | 4.88 × 10⁻⁹ | 2.54 × 10³ | 232.68 | |
| 2 Lags | ||||
| LM.Cannabis_x_Resin.THC_x_Daily.Interpol. | 0.0004 | 30.22 | 6.19 |
| No. | Anomaly | Regression | Model Type | Term | Group | p-Value | E-Value Estimate | Lower Bound E-Value |
|---|---|---|---|---|---|---|---|---|
| 1 | Gastroschisis | Panel | Interactive | LM.Cannabis_x_Herb.THC_x_Daily.Interpol.: LM.Cannabis_x_Resin.THC | Herb | 7.50 × 10⁻⁵ | 2.11 × 1063 | 2.14 × 1060 |
| 2 | Gastroschisis | Panel | 1 Lag | LM.Cannabis_x_Herb.THC_x_Daily.Interpol.: LM.Cannabis_x_Resin.THC | Herb | 9.28 × 10⁻⁶ | 7.52 × 1095 | 8.16 × 1055 |
| 3 | Gastroschisis | Spatial | 2 Lags | Daily.Interpol. | Daily | 0.0153 | Infinity | 9.23 × 1044 |
| 4 | Diaphragmatic Hernia | Panel | Additive | LM.Cannabis | Herb | 0.0044 | 7.92 × 10⁷ | 600.88 |
| 5 | Diaphragmatic Hernia | Panel | Interactive | LM.Cannabis_x_Herb.THC | Herb | 5.96 × 10⁻⁵ | 7.48 × 10²¹ | 5.55 × 10¹¹ |
| 6 | Gastroschisis | Spatial | Interactive | LM.Cannabis_x_Herb.THC_x_Daily.Interpol. | Herb | 0.0016 | 4.07 × 10³ | 35.65 |
| 7 | Gastroschisis | Panel | 2 Lags | LM.Cannabis_x_Herb.THC_x_Daily.Interpol.: LM.Cannabis_x_Resin.THC | Herb | 9.78 × 10⁻¹¹ | 1.86 × 10¹⁶ | 9.25 × 10¹¹ |
| 8 | Omphalocele | Spatial | 2 Lags | LM.Cannabis_x_Resin.THC | Resin | 5.36 × 10⁻⁶ | 9.84 × 10⁵ | 3.51 × 10³ |
| 9 | Diaphragmatic Hernia | Spatial | Interactive | LM.Cannabis_x_Resin.THC | Resin | 4.88 × 10⁻⁹ | 2.54 × 10³ | 232.68 |
| 10 | Omphalocele | Panel | Interactive | LM.Cannabis_x_Resin.THC | Resin | 0.0059 | 4.10 × 10⁵ | 80.95 |
| 11 | Omphalocele | Spatial | Additive | LM.Cannabis_x_Resin.THC | Resin | 5.28 × 10⁻⁶ | 772.14 | 59.28 |
| 12 | Omphalocele | Panel | 2 Lags | LM.Cannabis_x_Resin.THC | Resin | 2.30 × 10⁻⁶ | 7.04 | 3.95 |
| 13 | Omphalocele | Panel | Additive | LM.Cannabis_x_Resin.THC | Resin | 4.77 × 10⁻⁷ | 5.77 | 3.56 |
| 14 | Omphalocele | Spatial | Interactive | LM.Cannabis_x_Resin.THC | Resin | 0.0024 | 8.41 | 2.80 |
| 15 | Gastroschisis | Panel | Additive | LM.Cannabis_x_Resin.THC_x_Daily.Interpol. | Resin | 2.45 × 10⁻¹⁴ | 34.18 | 17.78 |
| 16 | Gastroschisis | Panel | Interactive | LM.Cannabis_x_Resin.THC_x_Daily.Interpol. | Resin | 0.0006 | 216.81 | 15.7 |
| 17 | Diaphragmatic Hernia | Panel | 2 Lags | LM.Cannabis_x_Resin.THC_x_Daily.Interpol. | Resin | <2.2 × 10⁻¹⁶ | 16.79 | 10.92 |
| 18 | Diaphragmatic Hernia | Spatial | 2 Lags | LM.Cannabis_x_Resin.THC_x_Daily.Interpol. | Resin | 0.0004 | 30.22 | 6.19 |
| 19 | Diaphragmatic Hernia | Spatial | Additive | LM.Cannabis_x_Resin.THC_x_Daily.Interpol. | Resin | 0.0006 | 10.29 | 3.57 |
| 20 | Gastroschisis | Spatial | Additive | LM.Cannabis_x_Resin.THC_x_Daily.Interpol. | Resin | 0.0052 | 17.08 | 3.24 |
| 21 | Diaphragmatic Hernia | Panel | Additive | LM.Cannabis_x_Resin.THC_x_Daily.Interpol. | Resin | 0.0162 | 3.38 | 1.55 |
| 22 | Gastroschisis | Panel | 1 Lag | Tobacco: LM.Cannabis_x_Herb.THC_x_Daily.Interpol. | Herb | 9.54 × 10⁻⁶ | 2.46 | 1.88 |
| 23 | Gastroschisis | Panel | Interactive | Tobacco: LM.Cannabis_x_Herb.THC_x_Daily.Interpol. | Herb | 0.0043 | 1.78 | 1.35 |
| 24 | Gastroschisis | Panel | 2 Lags | Tobacco: LM.Cannabis_x_Herb.THC_x_Daily.Interpol. | Herb | 0.0097 | 1.7 | 1.27 |
| 25 | Diaphragmatic Hernia | Panel | Interactive | Tobacco: LM.Cannabis_x_Herb.THC_x_Daily.Interpol.: LM.Cannabis_x_Herb.THC | Herb | 0.0281 | 3.67 | 1.41 |
| 26 | Gastroschisis | Panel | 2 Lags | Tobacco: LM.Cannabis_x_Resin.THC | Resin | 0.0003 | 6.75 | 3.13 |
| 27 | Gastroschisis | Panel | Interactive | Tobacco: LM.Cannabis_x_Resin.THC | Resin | 2.01 × 10⁻⁶ | 4.51 | 2.92 |
| 28 | Gastroschisis | Panel | 1 Lag | Tobacco: LM.Cannabis_x_Resin.THC | Resin | 0.0002 | 1.91 | 1.53 |
| No. | E-Value Estimate | Lower Bound E-Value |
|---|---|---|
| 1 | Infinity | 2.14 × 1060 |
| 2 | 7.52 × 1095 | 8.16 × 1055 |
| 3 | 2.11 × 1063 | 9.23 × 1044 |
| 4 | 7.48 × 10²¹ | 9.25 × 10¹¹ |
| 5 | 1.86 × 10¹⁶ | 5.55 × 10¹¹ |
| 6 | 7.92 × 10⁷ | 3.51 × 10³ |
| 7 | 9.84 × 10⁵ | 600.88 |
| 8 | 4.10 × 10⁵ | 232.68 |
| 9 | 4.07 × 10³ | 80.95 |
| 10 | 2.54 × 10³ | 59.28 |
| 11 | 772.14 | 35.65 |
| 12 | 216.81 | 17.78 |
| 13 | 34.18 | 15.7 |
| 14 | 30.22 | 10.92 |
| 15 | 17.08 | 6.19 |
| 16 | 16.79 | 3.95 |
| 17 | 10.29 | 3.57 |
| 18 | 8.41 | 3.56 |
| 19 | 7.04 | 3.24 |
| 20 | 6.75 | 3.13 |
| 21 | 5.77 | 2.92 |
| 22 | 4.51 | 2.80 |
| 23 | 3.67 | 1.88 |
| 24 | 3.38 | 1.55 |
| 25 | 2.46 | 1.53 |
| 26 | 1.91 | 1.41 |
| 27 | 1.78 | 1.35 |
| 28 | 1.7 | 1.27 |
| No. | Anomaly | Regression | Model Type | Term | Group | p-Value | E-Value Estimate | Lower Bound E-Value |
|---|---|---|---|---|---|---|---|---|
| 1 | Diaphragmatic Hernia | Panel | Additive | LM.Cannabis | Herb | 0.0044 | 7.92 × 10⁷ | 600.88 |
| 2 | Diaphragmatic Hernia | Panel | Interactive | LM.Cannabis_x_Herb.THC | Herb | 5.96 × 10⁻⁵ | 7.48 × 10²¹ | 5.55 × 10¹¹ |
| 3 | Diaphragmatic Hernia | Spatial | Interactive | LM.Cannabis_x_Resin.THC | Resin | 4.88 × 10⁻⁹ | 2.54 × 10³ | 232.68 |
| 4 | Diaphragmatic Hernia | Panel | 2 Lags | LM.Cannabis_x_Resin.THC_x_Daily.Interpol. | Resin | <2.2 × 10⁻¹⁶ | 16.79 | 10.92 |
| 5 | Diaphragmatic Hernia | Spatial | 2 Lags | LM.Cannabis_x_Resin.THC_x_Daily.Interpol. | Resin | 0.0004 | 30.22 | 6.19 |
| 6 | Diaphragmatic Hernia | Spatial | Additive | LM.Cannabis_x_Resin.THC_x_Daily.Interpol. | Resin | 0.0006 | 10.29 | 3.57 |
| 7 | Diaphragmatic Hernia | Panel | Additive | LM.Cannabis_x_Resin.THC_x_Daily.Interpol. | Resin | 0.0162 | 3.38 | 1.55 |
| 8 | Diaphragmatic Hernia | Panel | Interactive | Tobacco: LM.Cannabis_x_Herb.THC_x_Daily.Interpol.: LM.Cannabis_x_Herb.THC | Herb | 0.0281 | 3.67 | 1.41 |
| 9 | Gastroschisis | Panel | Interactive | LM.Cannabis_x_Herb.THC_x_Daily.Interpol.: LM.Cannabis_x_Resin.THC | Herb | 7.50 × 10⁻⁵ | 2.11 × 1063 | 2.14 × 1060 |
| 10 | Gastroschisis | Panel | 1 Lag | LM.Cannabis_x_Herb.THC_x_Daily.Interpol.: LM.Cannabis_x_Resin.THC | Herb | 9.28 × 10⁻⁶ | 7.52 × 1095 | 8.16 × 1055 |
| 11 | Gastroschisis | Spatial | 2 Lags | Daily.Interpol. | Daily | 0.0153 | Infinity | 9.23 × 1044 |
| 12 | Gastroschisis | Spatial | Interactive | LM.Cannabis_x_Herb.THC_x_Daily.Interpol. | Herb | 0.0016 | 4.07 × 10³ | 35.65 |
| 13 | Gastroschisis | Panel | 2 Lags | LM.Cannabis_x_Herb.THC_x_Daily.Interpol.: LM.Cannabis_x_Resin.THC | Herb | 9.78 × 10⁻¹¹ | 1.86 × 10¹⁶ | 9.25 × 10¹¹ |
| 14 | Gastroschisis | Panel | Additive | LM.Cannabis_x_Resin.THC_x_Daily.Interpol. | Resin | 2.45 × 10⁻¹⁴ | 34.18 | 17.78 |
| 15 | Gastroschisis | Panel | Interactive | LM.Cannabis_x_Resin.THC_x_Daily.Interpol. | Resin | 0.0006 | 216.81 | 15.7 |
| 16 | Gastroschisis | Spatial | Additive | LM.Cannabis_x_Resin.THC_x_Daily.Interpol. | Resin | 0.0052 | 17.08 | 3.24 |
| 17 | Gastroschisis | Panel | 1 Lag | Tobacco: LM.Cannabis_x_Herb.THC_x_Daily.Interpol. | Herb | 9.54 × 10⁻⁶ | 2.46 | 1.88 |
| 18 | Gastroschisis | Panel | Interactive | Tobacco: LM.Cannabis_x_Herb.THC_x_Daily.Interpol. | Herb | 0.0043 | 1.78 | 1.35 |
| 19 | Gastroschisis | Panel | 2 Lags | Tobacco: LM.Cannabis_x_Herb.THC_x_Daily.Interpol. | Herb | 0.0097 | 1.7 | 1.27 |
| 20 | Gastroschisis | Panel | 2 Lags | Tobacco: LM.Cannabis_x_Resin.THC | Resin | 0.0003 | 6.75 | 3.13 |
| 21 | Gastroschisis | Panel | Interactive | Tobacco: LM.Cannabis_x_Resin.THC | Resin | 2.01 × 10⁻⁶ | 4.51 | 2.92 |
| 22 | Gastroschisis | Panel | 1 Lag | Tobacco: LM.Cannabis_x_Resin.THC | Resin | 0.0002 | 1.91 | 1.53 |
| 23 | Omphalocele | Spatial | 2 Lags | LM.Cannabis_x_Resin.THC | Resin | 5.36 × 10⁻⁶ | 9.84 × 10⁵ | 3.51 × 10³ |
| 24 | Omphalocele | Panel | Interactive | LM.Cannabis_x_Resin.THC | Resin | 0.0059 | 4.10 × 10⁵ | 80.95 |
| 25 | Omphalocele | Spatial | Additive | LM.Cannabis_x_Resin.THC | Resin | 5.28 × 10⁻⁶ | 772.14 | 59.28 |
| 26 | Omphalocele | Panel | 2 Lags | LM.Cannabis_x_Resin.THC | Resin | 2.30 × 10⁻⁶ | 7.04 | 3.95 |
| 27 | Omphalocele | Panel | Additive | LM.Cannabis_x_Resin.THC | Resin | 4.77 × 10⁻⁷ | 5.77 | 3.56 |
| 28 | Omphalocele | Spatial | Interactive | LM.Cannabis_x_Resin.THC | Resin | 0.0024 | 8.41 | 2.80 |
| Anomaly | Number | Mean Minimum E-Value | Median Minimum E-Value | Min Minimum E-Value | Max Minimum E-Value | Mean E-Value Estimate | Median E-Value Estimate | Min E-Value Estimate | Max E-Value Estimate |
|---|---|---|---|---|---|---|---|---|---|
| Omphalocele | 6 | 610.09 | 31.62 | 2.80 | 3510 | 2.32 × 10⁵ | 390.28 | 5.77 | 9.84 × 10⁵ |
| Gastroschisis | 14 | 1.53 × 1059 | 9.47 | 1.27 | 2.14 × 1060 | 1.07 × 10306 | 25.63 | 1.70 | 1.50 × 10307 |
| Diaphragmatic Hernia | 8 | 6.94 × 10¹⁰ | 8.56 | 1.41 | 5.55 × 10¹¹ | 9.35 × 10²⁰ | 23.51 | 3.38 | 7.48 × 10²¹ |
| Anomaly | Regression | Model Type | Term | Group | p-Value | E-Value Estimate | Lower Bound E-Value |
|---|---|---|---|---|---|---|---|
| Gastroschisis | Panel | Interactive | LM.Cannabis_x_Herb.THC_x_Daily.Interpol.: LM.Cannabis_x_Resin.THC | Herb | 7.50 × 10⁻⁵ | 2.11 × 1063 | 2.14 × 1060 |
| Gastroschisis | Panel | 1 Lag | LM.Cannabis_x_Herb.THC_x_Daily.Interpol.: LM.Cannabis_x_Resin.THC | Herb | 9.28 × 10⁻⁶ | 7.52 × 1095 | 8.16 × 1055 |
| Gastroschisis | Spatial | 2 Lags | Daily.Interpol. | Daily | 0.0153 | Infinity | 9.23 × 1044 |
| Diaphragmatic Hernia | Panel | Additive | LM.Cannabis | Herb | 0.0044 | 7.92 × 10⁷ | 600.88 |
| Diaphragmatic Hernia | Panel | Interactive | LM.Cannabis_x_Herb.THC | Herb | 5.96 × 10⁻⁵ | 7.48 × 10²¹ | 5.55 × 10¹¹ |
| Gastroschisis | Spatial | Interactive | LM.Cannabis_x_Herb.THC_x_Daily.Interpol. | Herb | 0.0016 | 4.07 × 10³ | 35.65 |
| Gastroschisis | Panel | 2 Lags | LM.Cannabis_x_Herb.THC_x_Daily.Interpol.: LM.Cannabis_x_Resin.THC | Herb | 9.78 × 10⁻¹¹ | 1.86 × 10¹⁶ | 9.25 × 10¹¹ |
| Omphalocele | Spatial | 2 Lags | LM.Cannabis_x_Resin.THC | Resin | 5.36 × 10⁻⁶ | 9.84 × 10⁵ | 3.51 × 10³ |
| Diaphragmatic Hernia | Spatial | Interactive | LM.Cannabis_x_Resin.THC | Resin | 4.88 × 10⁻⁹ | 2.54 × 10³ | 232.68 |
| Omphalocele | Panel | Interactive | LM.Cannabis_x_Resin.THC | Resin | 0.0059 | 4.10 × 10⁵ | 80.95 |
| Omphalocele | Spatial | Additive | LM.Cannabis_x_Resin.THC | Resin | 5.28 × 10⁻⁶ | 772.14 | 59.28 |
| Omphalocele | Panel | 2 Lags | LM.Cannabis_x_Resin.THC | Resin | 2.30 × 10⁻⁶ | 7.04 | 3.95 |
| Omphalocele | Panel | Additive | LM.Cannabis_x_Resin.THC | Resin | 4.77 × 10⁻⁷ | 5.77 | 3.56 |
| Omphalocele | Spatial | Interactive | LM.Cannabis_x_Resin.THC | Resin | 0.0024 | 8.41 | 2.80 |
| Gastroschisis | Panel | Additive | LM.Cannabis_x_Resin.THC_x_Daily.Interpol. | Resin | 2.45 × 10⁻¹⁴ | 34.18 | 17.78 |
| Gastroschisis | Panel | Interactive | LM.Cannabis_x_Resin.THC_x_Daily.Interpol. | Resin | 0.0006 | 216.81 | 15.7 |
| Diaphragmatic Hernia | Panel | 2 Lags | LM.Cannabis_x_Resin.THC_x_Daily.Interpol. | Resin | <2.2 × 10⁻¹⁶ | 16.79 | 10.92 |
| Diaphragmatic Hernia | Spatial | 2 Lags | LM.Cannabis_x_Resin.THC_x_Daily.Interpol. | Resin | 0.0004 | 30.22 | 6.19 |
| Diaphragmatic Hernia | Spatial | Additive | LM.Cannabis_x_Resin.THC_x_Daily.Interpol. | Resin | 0.0006 | 10.29 | 3.57 |
| Gastroschisis | Spatial | Additive | LM.Cannabis_x_Resin.THC_x_Daily.Interpol. | Resin | 0.0052 | 17.08 | 3.24 |
| Diaphragmatic Hernia | Panel | Additive | LM.Cannabis_x_Resin.THC_x_Daily.Interpol. | Resin | 0.0162 | 3.38 | 1.55 |
| Gastroschisis | Panel | 1 Lag | Tobacco: LM.Cannabis_x_Herb.THC_x_Daily.Interpol. | Herb | 9.54 × 10⁻⁶ | 2.46 | 1.88 |
| Gastroschisis | Panel | Interactive | Tobacco: LM.Cannabis_x_Herb.THC_x_Daily.Interpol. | Herb | 0.0043 | 1.78 | 1.35 |
| Gastroschisis | Panel | 2 Lags | Tobacco: LM.Cannabis_x_Herb.THC_x_Daily.Interpol. | Herb | 0.0097 | 1.7 | 1.27 |
| Diaphragmatic Hernia | Panel | Interactive | Tobacco: LM.Cannabis_x_Herb.THC_x_Daily.Interpol.: LM.Cannabis_x_Herb.THC | Herb | 0.0281 | 3.67 | 1.41 |
| Gastroschisis | Panel | 2 Lags | Tobacco: LM.Cannabis_x_Resin.THC | Resin | 0.0003 | 6.75 | 3.13 |
| Gastroschisis | Panel | Interactive | Tobacco: LM.Cannabis_x_Resin.THC | Resin | 2.01 × 10⁻⁶ | 4.51 | 2.92 |
| Gastroschisis | Panel | 1 Lag | Tobacco: LM.Cannabis_x_Resin.THC | Resin | 0.0002 | 1.91 | 1.53 |
| Group | Number | Mean Minimum E-Value | Median Minimum E-Value | Minimum Minimum E-Value | Maximum Minimum E-Value | Mean E-Value Estimate | Median E-Value Estimate | Minimum E-Value Estimate | Maximum E-Value Estimate |
|---|---|---|---|---|---|---|---|---|---|
| Daily | 6 | 9.23 × 1044 | 9.23 × 1044 | 9.23 × 1044 | 9.23 × 1044 | 1.50 × 10307 | 1.50 × 10307 | 1.50 × 10307 | 1.50 × 10307 |
| Herb | 14 | 2.14 × 1059 | 318.265 | 1.27 | 2.14 × 1060 | 7.52 × 1094 | 3.96 × 10⁷ | 1.7 | 7.52 × 1095 |
| Resin | 8 | 232.93 | 3.95 | 1.53 | 3510 | 82216.19 | 16.79 | 1.91 | 9.84 × 10⁵ |
Publisher’s Note: MDPI stays neutral with regard to jurisdictional claims in published maps and institutional affiliations. |
© 2022 by the authors. Licensee MDPI, Basel, Switzerland. This article is an open access article distributed under the terms and conditions of the Creative Commons Attribution (CC BY) license (https://creativecommons.org/licenses/by/4.0/).
Share and Cite
Reece, A.S.; Hulse, G.K. European Epidemiological Patterns of Cannabis- and Substance-Related Body Wall Congenital Anomalies: Geospatiotemporal and Causal Inferential Study. Int. J. Environ. Res. Public Health 2022, 19, 9027. https://doi.org/10.3390/ijerph19159027
Reece AS, Hulse GK. European Epidemiological Patterns of Cannabis- and Substance-Related Body Wall Congenital Anomalies: Geospatiotemporal and Causal Inferential Study. International Journal of Environmental Research and Public Health. 2022; 19(15):9027. https://doi.org/10.3390/ijerph19159027
Chicago/Turabian StyleReece, Albert Stuart, and Gary Kenneth Hulse. 2022. "European Epidemiological Patterns of Cannabis- and Substance-Related Body Wall Congenital Anomalies: Geospatiotemporal and Causal Inferential Study" International Journal of Environmental Research and Public Health 19, no. 15: 9027. https://doi.org/10.3390/ijerph19159027
APA StyleReece, A. S., & Hulse, G. K. (2022). European Epidemiological Patterns of Cannabis- and Substance-Related Body Wall Congenital Anomalies: Geospatiotemporal and Causal Inferential Study. International Journal of Environmental Research and Public Health, 19(15), 9027. https://doi.org/10.3390/ijerph19159027