The Significance of OCTA in Studying Vessel Density and Retinal Thickness in Individuals with Myopia

 , ,
, ,
Abstract
1. Introduction
2. Materials and Methods
2.1. Study Participants
2.2. Optical Coherence Tomography Angiography
2.3. Statistical Analysis
3. Results
4. Discussion
Author Contributions
Funding
Institutional Review Board Statement
Informed Consent Statement
Data Availability Statement
Conflicts of Interest
References
- Holden, B.A.; Fricke, T.R.; Wilson, D.A.; Jong, M.; Naidoo, K.S.; Sankaridurg, P.; Wong, T.Y.; Naduvilath, T.J.; Resnikoff, S. Global prevalence of myopia and high myopia and temporal trends from 2000 through 2050. Ophthalmology 2016, 123, 1036–1042. [Google Scholar] [CrossRef] [PubMed]
- Abdellah, M.M.; Amer, A.A.; Eldaly, Z.H.; Anber, M.A. Optical coherence tomography angiography of the macula of high myopia in children and adolescents. Int. J. Retin. Vitr. 2024, 10, 17. [Google Scholar] [CrossRef]
- Cao, Y.; Gu, X.; Zhang, Y.; Zhao, J.; Zhu, D. Assessment of the effects of myopic and hyperopic anisometropia on choroidal vascular structure in children using SS-OCTA. Ophthalmic Physiol. Opt. 2024, 44, 525–536. [Google Scholar] [CrossRef] [PubMed]
- Zheng, F.; Chua, J.; Ke, M.; Tan, B.; Yu, M.; Hu, Q.; Cheung, C.M.G.; Ang, M.; Lee, S.Y.; Wong, T.Y.; et al. Quantitative OCT angiography of the retinal microvasculature and choriocapillaris in highly myopic eyes with myopic macular degeneration. Br. J. Ophthalmol. 2022, 106, 681–688. [Google Scholar] [CrossRef]
- Zhang, W.; Li, C.; Gong, Y.; Liu, N.; Cao, Y.; Li, Z.; Zhang, Y. Advanced ultrawide-field optical coherence tomography angiography identifies previously undetectable changes in biomechanics-related parameters in nonpathological myopic fundus. Front. Bioeng. Biotechnol. 2022, 10, 920197. [Google Scholar] [CrossRef] [PubMed]
- Ucak, T.; Icel, E.; Yilmaz, H.; Karakurt, Y.; Tasli, G.; Ugurlu, A.; Bozkurt, E. Alterations in optical coherence tomography angiography findings in patients with high myopia. Eye 2020, 34, 1129–1135. [Google Scholar] [CrossRef]
- Ikuno, Y. Overview of the complications of high myopia. Retina 2017, 37, 2347–2351. [Google Scholar] [CrossRef]
- Yang, Y.S.; Koh, J.W. Choroidal blood flow change in eyes with high myopia. Korean J. Ophthalmol. 2015, 29, 309–314. [Google Scholar] [CrossRef]
- Shi, Y.; Ye, L.; Chen, Q.; Hu, G.; Yin, Y.; Fan, Y.; Zhu, J.; He, J.; Zheng, Z.; Zou, H.; et al. Macular vessel density changes in young adults with high myopia: A longitudinal study. Front. Med. 2021, 8, 648644. [Google Scholar] [CrossRef]
- Yang, Y.; Wang, J.; Jiang, H.; Yang, X.; Feng, L.; Hu, L.; Wang, L.; Lu, F.; Shen, M. Retinal microvasculature alteration in high myopia. Investig. Ophthalmol. Vis. Sci. 2016, 57, 6020–6030. [Google Scholar] [CrossRef]
- Spaide, R.F.; Fujimoto, J.G.; Waheed, N.K.; Sadda, S.R.; Staurenghi, G. Optical coherence tomography angiography. Prog. Retin. Eye Res. 2018, 64, 1–55. [Google Scholar] [CrossRef] [PubMed]
- de Carlo, T.E.; Romano, A.; Waheed, N.K.; Duker, J.S. A review of optical coherence tomography angiography (OCTA). Int. J. Retin. Vitr. 2015, 1, 5. [Google Scholar] [CrossRef]
- Kashani, A.H.; Chen, C.L.; Gahm, J.K.; Zheng, F.; Richter, G.M.; Rosenfeld, P.J.; Shi, Y.; Wang, R.K. Optical coherence tomography angiography: A comprehensive review of current methods and clinical applications. Prog. Retin. Eye Res. 2017, 60, 66–100. [Google Scholar] [CrossRef]
- Tan, A.C.S.; Tan, G.S.; Denniston, A.K.; Keane, P.A.; Ang, M.; Milea, D.; Chakravarthy, U.; Cheung, C.M.G. An overview of the clinical applications of optical coherence tomography angiography. Eye 2018, 32, 262–286. [Google Scholar] [CrossRef]
- Kraus, M.F.; Potsaid, B.; Mayer, M.A.; Bock, R.; Baumann, B.; Liu, J.J.; Hornegger, J.; Fujimoto, J.G. Motion correction in optical coherence tomography volumes on a per A-scan basis using orthogonal scan patterns. Biomed. Opt. Express 2012, 3, 1182–1199. [Google Scholar] [CrossRef] [PubMed]
- Huang, D.; Jia, Y.; Gao, S.S.; Lumbroso, B.; Rispoli, M. Optical coherence tomography angiography using the Optovue device. Dev. Ophthalmol. 2016, 56, 6–12. [Google Scholar] [PubMed]
- Khan, M.H.; Lam, A.K.C.; Armitage, J.A.; Hanna, L.; To, C.-h.; Gentle, A. Impact of axial eye size on retinal microvasculature density in the macular region. J. Clin. Med. 2020, 9, 2539. [Google Scholar] [CrossRef]
- Sun, J.T.; An, M.; Yan, X.B.; Li, G.H.; Wang, D.B. Prevalence and related factors for myopia in school-aged children in Qingdao. J. Ophthalmol. 2018, 2018, 9781987. [Google Scholar] [CrossRef]
- Ohno-Matsui, K.; Ikuno, Y.; Lai, T.Y.Y.; Cheung, C.M.G. Diagnosis and treatment guideline for myopic choroidal neovascularization due to pathologic myopia. Prog. Retin. Eye Res. 2018, 63, 92–106. [Google Scholar] [CrossRef]
- Lu, X.; Zhang, G.; Cen, L.; Du, Y.; Liu, L.; Jin, C.; Chen, H. Choroidal vascular density quantification in high myopia with or without choroidal neovascularization using optical coherence tomography angiography. J. Ophthalmol. 2023, 2023, 1504834. [Google Scholar] [CrossRef]
- Chen, S.; Wang, B.; Dong, N.; Ren, X.; Zhang, T.; Xiao, L. Macular measurements using spectral-domain optical coherence tomography in Chinese myopic children. Invest. Ophthalmol. Vis. Sci. 2014, 55, 7410–7416. [Google Scholar] [CrossRef] [PubMed]
- Si, Y.; Pang, K.; Song, Y.; Zhang, X.; Yang, H.; Cui, Y. Observation of structural and vascular features of retina and choroid in myopia using ultra-widefield SS-OCTA. BMC Ophthalmol. 2024, 24, 208. [Google Scholar] [CrossRef] [PubMed]
- Liu, M.; Wang, P.; Hu, X.; Zhu, C.; Yuan, Y.; Ke, B. Myopia-related stepwise and quadrant retinal microvascular alteration and its correlation with axial length. Eye 2021, 35, 2196–2205. [Google Scholar] [CrossRef]
- Moon, J.Y.; Garg, I.; Cui, Y.; Katz, R.; Zhu, Y.; Le, R.; Lu, Y.; Lu, E.S.; Ludwig, C.A.; Elze, T.; et al. Wide-field swept-source optical coherence tomography angiography in the assessment of retinal microvasculature and choroidal thickness in patients with myopia. Br. J. Ophthalmol. 2023, 107, 102–108. [Google Scholar] [CrossRef] [PubMed]
- Li, M.; Yang, Y.; Jiang, H.; Gregori, G.; Roisman, L.; Zheng, F.; Ke, B.; Qu, D.; Wang, J. Retinal microvascular network and microcirculation assessments in high myopia. Am. J. Ophthalmol. 2017, 174, 56–67. [Google Scholar] [CrossRef]
- Meng, W.; Butterworth, J.; Malecaze, F.; Calvas, P. Axial length of myopia: A review of current research. Ophthalmologica 2011, 225, 127–134. [Google Scholar] [CrossRef]
- Benavente-Perez, A. Evidence of vascular involvement in myopia: A review. Front. Med. 2023, 10, 1112996. [Google Scholar] [CrossRef]
- Milani, P.; Montesano, G.; Rossetti, L.; Bergamini, F.; Pece, A. Vessel density, retinal thickness, and choriocapillaris vascular flow in myopic eyes on OCT angiography. Graefes Arch. Clin. Exp. Ophthalmol. 2018, 256, 1419–1427. [Google Scholar] [CrossRef]
- Dan, Y.S.; Cheong, K.X.; Lim, S.Y.; Wong, Q.Y.; Chong, R.S.; Wong, C.W.; Hoang, Q.V. Quantitative assessment of the choroidal vasculature in myopic macular degeneration with optical coherence tomographic angiography. Front. Ophthalmol. 2023, 3, 1202445. [Google Scholar] [CrossRef]
- Baksh, J.; Lee, D.; Mori, K.; Zhang, Y.; Torii, H.; Jeong, H.; Hou, J.; Negishi, K.; Tsubota, K.; Kurihara, T. Myopia is an ischemic eye condition: A review from the perspective of choroidal blood flow. J. Clin. Med. 2024, 13, 2777. [Google Scholar] [CrossRef]
- McDougal, D.H.; Gamlin, P.D. Autonomic control of the eye. Compr. Physiol. 2015, 5, 439–473. [Google Scholar] [PubMed]
- Guo, Y.; Sung, M.S.; Park, S.W. Assessment of superficial retinal microvascular density in healthy myopia. Int. Ophthalmol. 2019, 39, 1861–1870. [Google Scholar] [CrossRef] [PubMed]
- Gołębiewska, J.; Biała-Gosek, K.; Czeszyk, A.; Hautz, W. Optical coherence tomography angiography of superficial retinal vessel density and foveal avascular zone in myopic children. PLoS ONE 2019, 14, e0219785. [Google Scholar] [CrossRef] [PubMed]
- Scarinci, F.; Nesper, P.L.; Fawzi, A.A. Deep retinal capillary nonperfusion is associated with photoreceptor disruption in diabetic macular ischemia. Am. J. Ophthalmol. 2016, 168, 129–138. [Google Scholar] [CrossRef]
- Garrity, S.T.; Paques, M.; Gaudric, A.; Freund, K.B.; Sarraf, D. Considerations in the understanding of venous outflow in the retinal capillary plexus. Retina 2017, 37, 1809–1812. [Google Scholar] [CrossRef]
- Yao, H.; Xin, D.; Li, Z. The deep vascular plexus density is closely related to myopic severity. Ophthalmic Res. 2022, 65, 455–465. [Google Scholar] [CrossRef]
- Shimada, N.; Ohno-Matsui, K.; Harino, S.; Yoshida, T.; Yasuzumi, K.; Kojima, A.; Kobayashi, K.; Futagami, S.; Tokoro, T.; Mochizuki, M. Reduction of retinal blood flow in high myopia. Graefes Arch. Clin. Exp. Ophthalmol. 2004, 242, 284–288. [Google Scholar] [CrossRef]
- Al-Sheikh, M.; Phasukkijwatana, N.; Dolz-Marco, R.; Rahimi, M.; Iafe, N.A.; Freund, K.B.; Sadda, S.R.; Sarraf, D. Quantitative OCT angiography of the retinal microvasculature and the choriocapillaris in myopic eyes. Investig. Ophthalmol. Vis. Sci. 2017, 58, 2063–2069. [Google Scholar] [CrossRef]
- Fan, H.; Chen, H.Y.; Ma, H.J.; Chang, Z.; Yin, H.Q.; Ng, D.S.; Cheung, C.Y.; Hu, S.; Xiang, X.; Tang, S.B.; et al. Reduced macular vascular density in myopic eyes. Chin. Med. J. 2017, 130, 445–451. [Google Scholar] [CrossRef]
- Lin, F.; Zhao, Z.; Li, F.; Qiu, Z.; Gao, X.; Song, Y.; Wang, P.; Xiong, J.; Cheng, W.; Hu, K.; et al. Longitudinal macular retinal and choroidal microvasculature changes in high myopia. Investig. Ophthalmol. Vis. Sci. 2021, 62, 1. [Google Scholar] [CrossRef]
- Yoshikawa, Y.; Shoji, T.; Kanno, J.; Ibuki, H.; Weinreb, R.N.; Araie, M.; Shinoda, K. Glaucomatous vertical vessel density asymmetry of the temporal raphe detected with optical coherence tomography angiography. Sci. Rep. 2020, 10, 6845. [Google Scholar] [CrossRef]
- He, J.; Chen, Q.; Yin, Y.; Zhou, H.; Fan, Y.; Zhu, J.; Zou, H.; Xu, X. Association between retinal microvasculature and optic disc alterations in high myopia. Eye 2019, 33, 1494–1503. [Google Scholar] [CrossRef] [PubMed]
- Yun, Y.I.; Kim, Y.W.; Lim, H.B.; Lee, D.H.; Kim, J.H.; Oh, B.L.; Jeoung, J.W.; Park, K.H. Peripapillary vessel parameters and mean ocular perfusion pressure in young healthy eyes: OCT angiography study. Br. J. Ophthalmol. 2021, 105, 862–868. [Google Scholar] [CrossRef] [PubMed]
- Sampson, D.M.; Gong, P.; An, D.; Menghini, M.; Hansen, A.; Mackey, D.A.; Sampson, D.D.; Chen, F.K. Axial length variation impacts on superficial retinal vessel density and foveal avascular zone area measurements using optical coherence tomography angiography. Investig. Ophthalmol. Vis. Sci. 2017, 58, 3065–3072. [Google Scholar] [CrossRef] [PubMed]
- Zhu, Q.; Chen, C.; Yao, J. Vessel density and retinal thickness from optical coherence tomography angiography as new indexes in adolescent myopia. J. Ophthalmol. 2021, 2021, 6069833. [Google Scholar] [CrossRef]
- Jiang, Y.; Lou, S.; Li, Y.; Chen, Y.; Lu, T.C. High myopia and macular vascular density: An optical coherence tomography angiography study. BMC Ophthalmol. 2021, 21, 407. [Google Scholar] [CrossRef]

| EM | LM | MM | HM | EM-LM | EM-MM | EM-HM | LM-MM | LM-HM | MM-HM | |
|---|---|---|---|---|---|---|---|---|---|---|
| Whole | 48.12 ± 2.21 | 47.34 ± 1.27 | 47.21 ± 2.45 | 47.22 ± 4.22 | ns | ns | ns | ns | ns | ns |
| Fovea | 29.33 ± 4.54 | 28.56 ± 1.45 | 28.54 ± 8.21 | 27.78 ± 3.66 | ns | ns | ns | ns | ns | ns |
| Parafovea | 51.43 ± 6.86 | 50.34 ± 5.97 | 49.44 ± 3.91 | 48.21 ± 4.48 | ns | ns | ns | ns | ns | ns |
| Paratemporal | 50.35 ± 3.98 | 50.76 ± 2.32 | 50.55 ± 4.99 | 50.22 ± 6.11 | ns | ns | ns | ns | ns | ns |
| Parasuperior | 50.72 ± 5.54 | 50.55 ± 6.45 | 49.21 ± 3.65 | 48.56 ± 3.28 | ns | ns | ns | ns | ns | ns |
| Paranasal | 50.65 ± 2.23 | 50.21 ± 6.23 | 49.43 ± 5.43 | 48.45 ± 6.28 | ns | 0.017 | 0.001 | ns | ns | ns |
| Parainferior | 48.91 ± 7.21 | 49.23 ± 5.44 | 49.01 ± 5.82 | 48.87 ± 6.32 | ns | ns | ns | ns | ns | ns |
| Perifovea | 45.67 ± 2.02 | 45.21 ± 3.89 | 44.51 ± 3.54 | 44.27 ± 4.32 | ns | ns | ns | ns | ns | ns |
| Peritemporal | 46.21 ± 3.33 | 45.92 ± 4.44 | 45.33 ± 6.07 | 44.23 ± 2.28 | ns | 0.006 | 0.001 | ns | 0.004 | 0.032 |
| Perisuperior | 47.45 ± 6.56 | 46.69 ± 4.21 | 46.21 ± 2.89 | 45.55 ± 5.33 | ns | 0.005 | 0.001 | ns | 0.027 | ns |
| Perinasal | 49.83 ± 8.21 | 49.44 ± 6.45 | 48.87 ± 4.77 | 48.56 ± 5.55 | ns | ns | ns | ns | ns | ns |
| Peri-inferior | 48.32 ± 3.91 | 47.89 ± 8.21 | 47.21 ± 7.22 | 46.67 ± 3.79 | ns | 0.03 | 0.008 | ns | 0.004 | 0.012 |
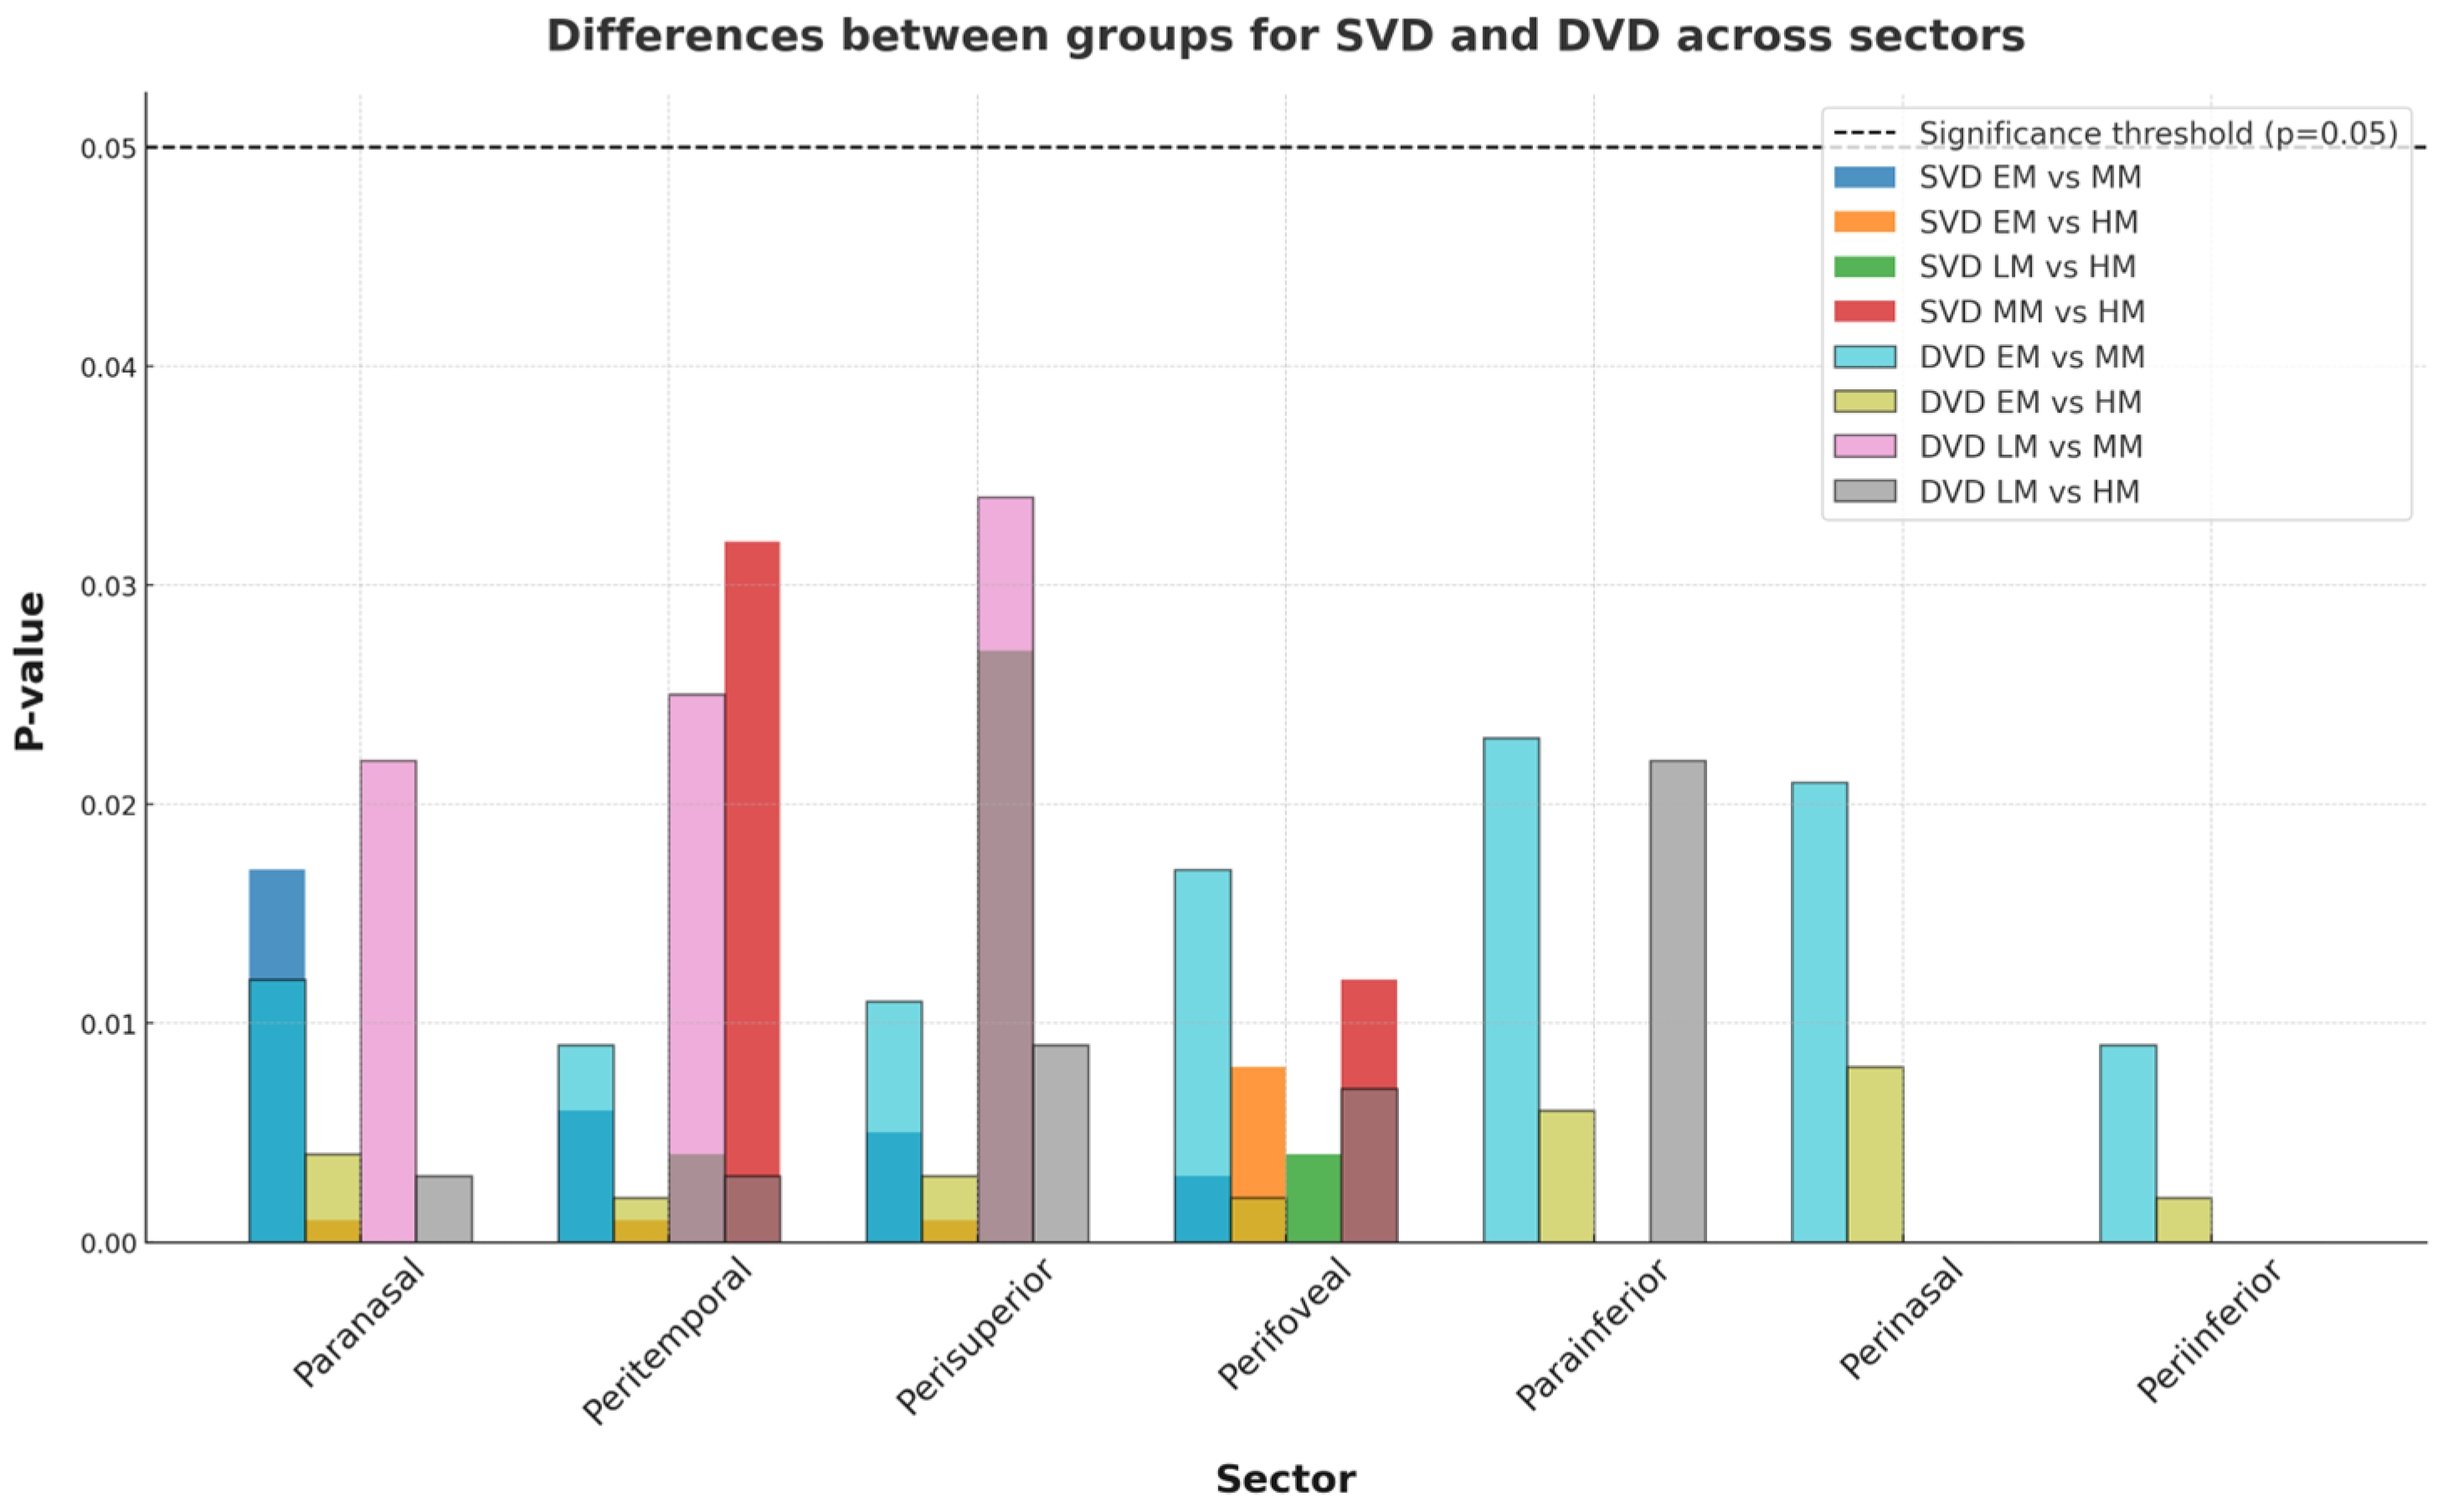
| EM | LM | MM | HM | EM-LM | EM-MM | EM-HM | LM-MM | LM-HM | MM-HM | |
|---|---|---|---|---|---|---|---|---|---|---|
| Whole | 49.21 ± 3.21 | 48.65 ± 1.22 | 48.33 ± 2.33 | 47.41 ± 3.22 | ns | 0.03 | 0.001 | ns | 0.003 | ns |
| Fovea | 31.21 ± 2.89 | 30.45 ± 3.33 | 30.87 ± 2.62 | 30.76 ± 4.34 | ns | ns | ns | ns | ns | ns |
| Parafovea | 51.21 ± 7.56 | 50.87 ± 1.33 | 50.45 ± 1.35 | 50.35 ± 6.67 | ns | ns | ns | ns | ns | ns |
| Paratemporal | 50.89 ± 5.54 | 50.67 ± 5.51 | 50.32 ± 4.44 | 50.56 ± 8.22 | ns | ns | ns | ns | ns | ns |
| Parasuperior | 51.32 ± 3.78 | 51.11 ± 4.98 | 50.89 ± 6.89 | 50.78 ± 7.33 | ns | ns | ns | ns | ns | ns |
| Paranasal | 53.98 ± 4.45 | 52.61 ± 3.33 | 51.34 ± 5.57 | 49.33 ± 6.77 | ns | 0.012 | 0.004 | 0.022 | 0.003 | ns |
| Parainferior | 51.87 ± 8.21 | 51.45 ± 6.32 | 50.67 ± 3.29 | 49.23 ± 7.23 | ns | 0.023 | 0.006 | ns | ns | 0.032 |
| Perifovea | 50.23 ± 2.46 | 49.67 ± 6.72 | 48.89 ± 6.53 | 47.33 ± 3.45 | ns | 0.017 | 0.002 | ns | 0.007 | ns |
| Peritemporal | 50.32 ± 5.32 | 48.21 ± 3.38 | 47.77 ± 2.87 | 46.89 ± 2.32 | ns | 0.009 | 0.002 | 0.025 | 0.003 | 0.026 |
| Perisuperior | 50.78 ± 7.56 | 49.21 ± 4.44 | 48.01 ± 8.32 | 47.11 ± 3.45 | ns | 0.011 | 0.003 | 0.034 | 0.009 | ns |
| Perinasal | 50.97 ± 6.33 | 49.56 ± 8.22 | 48.85 ± 6.33 | 47.65 ± 6.61 | ns | 0.021 | 0.008 | ns | ns | ns |
| Peri-inferior | 49.21 ± 5.55 | 48.45 ± 3.44 | 47.55 ± 5.22 | 45.78 ± 3.39 | ns | 0.009 | 0.002 | ns | 0.008 | 0.022 |
| EM | LM | MM | HM | EM-LM | EM-MM | EM-HM | LM-MM | LM-HM | MM-HM | |
|---|---|---|---|---|---|---|---|---|---|---|
| Whole | 303.23 ± 10.12 | 299.45 ± 13.13 | 295.32 ± 16.28 | 291.34 ± 15.72 | ns | ns | <0.001 | ns | 0.023 | ns |
| Fovea | 255.67 ± 13.26 | 250.32 ± 11.82 | 247.11 ± 14.96 | 243.34 ± 12.95 | ns | <0.001 | <0.001 | ns | <0.001 | ns |
| Parafovea | 323.45 ± 14.23 | 319.87 ± 17.34 | 315.56 ± 10.18 | 310.98 ± 10.54 | ns | 0.007 | <0.001 | ns | 0.002 | ns |
| Paratemporal | 315.22 ± 11.21 | 311.12 ± 14.82 | 309.43 ± 12.15 | 306.12 ± 11.71 | ns | 0.027 | <0.001 | ns | 0.014 | ns |
| Parasuperior | 332.23 ± 15.53 | 325.25 ± 15.23 | 320.38 ± 13.45 | 316.32 ± 10.65 | 0.002 | <0.001 | <0.001 | 0.032 | 0.003 | ns |
| Paranasal | 328.75 ± 11.78 | 323.76 ± 10.92 | 318.39 ± 15.23 | 308.18 ± 16.04 | ns | 0.006 | <0.001 | ns | 0.001 | ns |
| Parainferior | 316.32 ± 10.76 | 310.87 ± 16.23 | 306.33 ± 10.13 | 302.56 ± 12.36 | 0.023 | 0.008 | <0.001 | ns | 0.032 | ns |
| Perifovea | 322.22 ± 14.92 | 316.43 ± 12.53 | 310.89 ± 10.76 | 304.76 ± 13.27 | 0.031 | 0.004 | <0.001 | 0.002 | 0.021 | ns |
| Peritemporal | 287.65 ± 15.13 | 275.43 ± 11.62 | 260.32 ± 11.32 | 264.65 ± 14.92 | 0.012 | <0.001 | <0.001 | 0.001 | 0.008 | ns |
| Perisuperior | 278.43 ± 13.62 | 273.32 ± 13.56 | 271.28 ± 13.78 | 266.23 ± 15.07 | 0.027 | 0.032 | <0.001 | ns | 0.007 | ns |
| Perinasal | 294.32 ± 14.03 | 287.32 ± 12.69 | 282.28 ± 14.63 | 277.56 ± 10.91 | 0.033 | 0.007 | <0.001 | 0.022 | 0.025 | ns |
| Peri-inferior | 301.45 ± 11.01 | 290.33 ± 10.65 | 282.34 ± 16.45 | 278.45 ± 12.26 | 0.007 | <0.001 | <0.001 | 0.012 | <0.001 | ns |
| EM | LM | MM | HM | EM-LM | EM-MM | EM-HM | LM-MM | LM-HM | MM-HM | |
|---|---|---|---|---|---|---|---|---|---|---|
| Whole | 324 ± 12.13 | 318 ± 13.43 | 305 ± 15.15 | 294 ± 11.44 | ns | <0.001 | <0.001 | 0.023 | <0.001 | ns |
| Fovea | 334 ± 13.42 | 332 ± 13.78 | 325 ± 17.06 | 322 ± 12.23 | ns | ns | 0.014 | 0.021 | ns | ns |
| Parafovea | 310 ± 15.87 | 305 ± 15.62 | 290 ± 11.86 | 285 ± 13.72 | ns | 0.031 | 0.005 | ns | 0.007 | ns |
| Paratemporal | 308 ± 10.35 | 300 ± 16.34 | 280 ± 16.67 | 270 ± 16.43 | ns | <0.001 | <0.001 | 0.023 | 0.012 | 0.022 |
| Parasuperior | 322 ± 11.56 | 312 ± 14.54 | 280 ± 11.12 | 278 ± 15.03 | 0.022 | <0.001 | <0.001 | 0.007 | <0.001 | ns |
| Paranasal | 303 ± 10.98 | 295 ± 18.67 | 292 ± 14.18 | 290 ± 10.82 | 0.025 | 0.007 | ns | ns | ns | ns |
| Parainferior | 315 ± 14.15 | 310 ± 15.06 | 303 ± 16.09 | 295 ± 12.49 | ns | 0.03 | 0.005 | 0.032 | 0.007 | ns |
| Perifovea | 303 ± 12.43 | 302 ± 10.89 | 278 ± 10.51 | 274 ± 11.92 | ns | 0.006 | <0.001 | 0.007 | <0.001 | ns |
| Peritemporal | 310 ± 14.56 | 306 ± 12.23 | 285 ± 12.63 | 282 ± 12.23 | ns | 0.007 | <0.001 | 0.006 | <0.001 | ns |
| Perisuperior | 315 ± 15.89 | 310 ± 12.76 | 282 ± 13.36 | 278 ± 15.82 | ns | 0.003 | <0.001 | 0.004 | <0.001 | ns |
| Perinasal | 320 ± 11.31 | 303 ± 13.41 | 290 ± 16.48 | 273 ± 13.35 | 0.013 | <0.001 | <0.001 | ns | <0.001 | 0.004 |
| Peri-inferior | 323 ± 17.34 | 301 ± 10.91 | 292 ± 11.72 | 275 ± 12.07 | 0.007 | <0.001 | <0.001 | ns | <0.001 | 0.012 |
Disclaimer/Publisher’s Note: The statements, opinions and data contained in all publications are solely those of the individual author(s) and contributor(s) and not of MDPI and/or the editor(s). MDPI and/or the editor(s) disclaim responsibility for any injury to people or property resulting from any ideas, methods, instructions or products referred to in the content. |
© 2025 by the authors. Published by MDPI on behalf of the Lithuanian University of Health Sciences. Licensee MDPI, Basel, Switzerland. This article is an open access article distributed under the terms and conditions of the Creative Commons Attribution (CC BY) license (https://creativecommons.org/licenses/by/4.0/).
Share and Cite
Veselinović, M.; Trenkić, M.; Čanadanović, V.; Jovanović, P.; Veselinović, A.; Petrović, M.; Kasumović Bećirović, A. The Significance of OCTA in Studying Vessel Density and Retinal Thickness in Individuals with Myopia. Medicina 2025, 61, 532. https://doi.org/10.3390/medicina61030532
Veselinović M, Trenkić M, Čanadanović V, Jovanović P, Veselinović A, Petrović M, Kasumović Bećirović A. The Significance of OCTA in Studying Vessel Density and Retinal Thickness in Individuals with Myopia. Medicina. 2025; 61(3):532. https://doi.org/10.3390/medicina61030532
Chicago/Turabian StyleVeselinović, Marija, Marija Trenkić, Vladimir Čanadanović, Predrag Jovanović, Aleksandar Veselinović, Maja Petrović, and Aida Kasumović Bećirović. 2025. "The Significance of OCTA in Studying Vessel Density and Retinal Thickness in Individuals with Myopia" Medicina 61, no. 3: 532. https://doi.org/10.3390/medicina61030532
APA StyleVeselinović, M., Trenkić, M., Čanadanović, V., Jovanović, P., Veselinović, A., Petrović, M., & Kasumović Bećirović, A. (2025). The Significance of OCTA in Studying Vessel Density and Retinal Thickness in Individuals with Myopia. Medicina, 61(3), 532. https://doi.org/10.3390/medicina61030532