1. Introduction
Cognitive impairment, encompassing conditions such as mild cognitive impairment or neurocognitive disorders such as Alzheimer’s disease (AD), poses significant challenges to public health due to its increasing prevalence as the population ages and its impact on individuals’ quality of life [
1,
2]. Early detection and understanding of the underlying neural mechanisms are crucial for developing effective interventions if possible and further assistance to the patients and their relatives [
3]. Neuroimaging studies have utilized structural magnetic resonance imaging (MRI) to investigate brain morphometry, including cortical thickness, curvature measurements, surface area, brain volume, and more, in cognitive disorders [
4,
5,
6]. Among various morphometric measures, cortical curvature has emerged as a potential biomarker for neurodegenerative diseases [
7].
While techniques such as structural MRI for volumetric analysis, functional MRI (fMRI) for functional connectivity, diffusion tensor imaging (DTI) for white matter integrity, and proton magnetic resonance spectroscopy for metabolic analysis provide valuable insights into cognitive disorders, there is an increasing potential in morphometric measures, one of which is cortex curvature [
8,
9,
10].
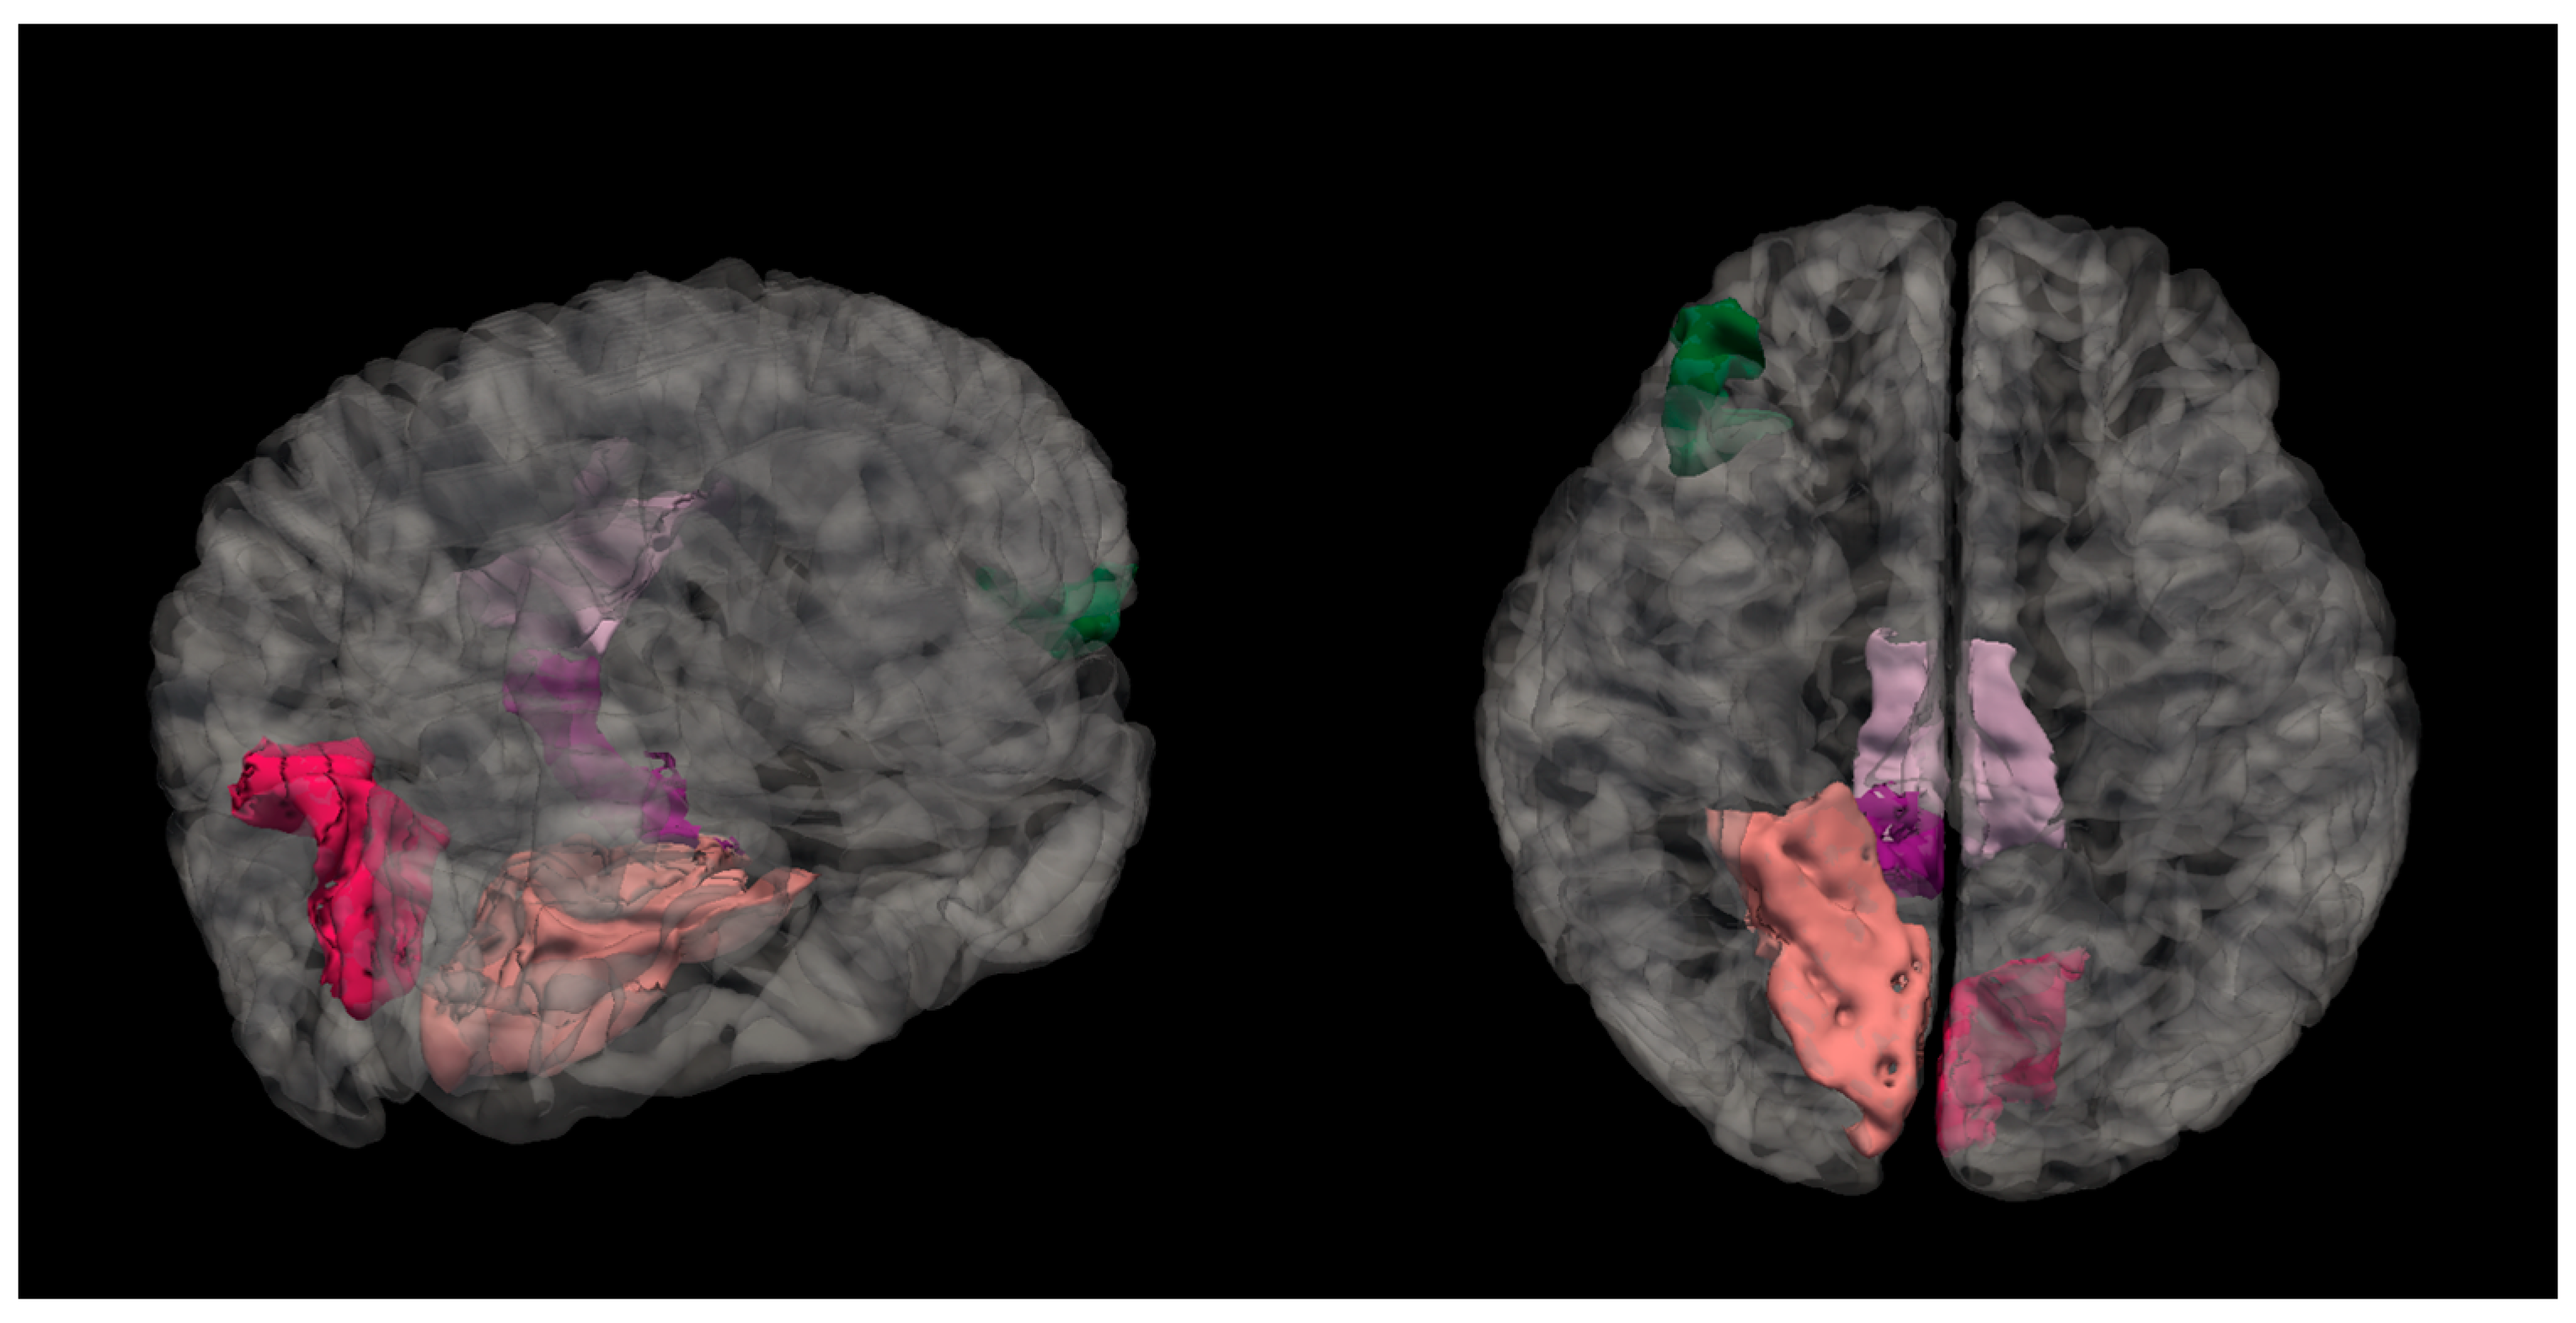
Cortical curvature refers to the degree of folding of the cerebral cortex, and it is further explained in
Figure 1.
Studies have indicated that the cortical curvature may show early cytoarchitectural changes [
12,
13,
14], which could serve as an early biomarker for cognitive impairment. Changes in cortical folding patterns have been associated with aging and neurodegenerative processes. For instance, a study by De Moraes et al. (2024) [
7] demonstrated that changes in cortical folding correlate with the progression of Alzheimer’s disease, suggesting that cortical curvature could serve as an indicator of disease progression.
The cortical curvature as a measurement is interrelated with brain volume and atrophy. One study analyzed patients with mild traumatic brain injury and showed that 50% bilateral cortical regions had an increased mean cortical curvature [
15]. These alterations in curvature related to reductions in both gray and white matter volume, suggesting that regional atrophy contributed to cortical surface deformations [
15]. Similarly, studies on healthy aging have found that while cortical thickness and white matter volume decrease with aging, surface area and mean curvature remain relatively stable, further showing that atrophy affects cortical thickness rather than the surface morphology [
16]. Research on brain size and cortical structure further reveals that as brain size increases, the cortex thickens but very minimally, while the sulcal convolution increases significantly [
17]. These findings highlight the complex and still not fully understood relationship between brain atrophy, volume changes, and alterations in mean cortical curvature.
By using advanced software tool such as FreeSurfer, cortical curvature analysis enables a detailed examination of curvature patterns across different brain regions. While previous neuroimaging techniques have primarily focused on volumetric and functional connectivity, cortical curvature may provide complementary information for early detection and potentially tracking of cognitive decline [
7]. A better understanding of these morphometric changes may help in complementing diagnostic criteria, enabling earlier detection of neurodegenerative disorders. As a result, this could facilitate more timely and targeted interventions, such as cognitive therapies or pharmacological treatments, as a result improving patient outcomes.
Regional variations of cortical curvature may be linked to specific cognitive functions. Research has shown that certain brain regions such as the cingulate region, the entorhinal cortex, and the orbital frontal cortex exhibit distinct curvature patterns that correlate with cognitive performance [
8,
18]. For instance, differences in mean curvature have been observed in regions implicated in memory and executive functions, which are often affected in mild cognitive impairments [
7,
19].
Despite the studies that have already touched upon curvature analysis of the brain and its potential relation to cognitive impairments, this relationship between both variables remains complex. There are studies that have found significant associations between decreased mean curvature and cognitive decline; however, there are not many studies that have investigated this field, and furthermore, it is important to take into consideration methodology differences in the existing studies [
7,
14]. For instance, differences in methodology—such as in the study by McCarthy (2015), which compared FreeSurfer-generated output with and without manual intervention [
20]—revealed that manual corrections led to differences, particularly in brain regions primarily affected by Alzheimer’s disease and schizophrenia.
In this context, this study aims to investigate whether mean cortical curvature can potentially serve as a biomarker for distinguishing cognitively impaired individuals from healthy controls. Specifically, we sought to determine if alterations in cortical curvature are associated with different levels of cognitive performance and whether these changes correlate with established measures of cognitive decline. Understanding these structural brain changes is essential for developing targeted interventions and improving diagnostic accuracy in cognitive disorders.
2. Materials and Methods
This study was conducted as a cross-sectional study, and it included 58 participants. Initially, participants were divided into two groups—those who were cognitively impaired (CI) (MoCA score ≤ 25) and those who did not have cognitive impairment, i.e., normal cognition (NC) (MoCA score ≥ 26)—to broadly assess differences in cortical curvature between individuals with and without cognitive impairment. However, given that cognitive decline occurs on a spectrum, a second classification was applied, dividing participants into three groups: normal cognition (NC), moderate cognitive performance (MPG), and low cognitive performance (LPG) based on MoCA scores. This finer categorization allowed for a more detailed analysis of cortical curvature changes across varying degrees of cognitive impairment, providing insights into potential alterations in brain morphology. An overview of participant age, sex, and MoCA scores is visualized in
Table 1.
A Chi-square test was performed on sex between the groups, and the results showed that there was a statistically significant difference between both groups (χ2 = 5.007, p = 0.025). To analyze differences in age and MoCA scores between the two groups, the Mann–Whitney U test was performed. The results indicated that there was no statistically significant difference in age between the groups (U = 367.500, p = 0.752). However, a statistically significant difference was found in MoCA scores (U = 0.000, p < 0.001), confirming distinct cognitive performance levels between the groups.
For further analysis the patients were divided into three groups: the normal cognition group (NC) with MoCA scores ≥26, the moderate cognitive performance group (MPG) with MoCA scores ≥15 and ≤25, and the low cognitive performance group (LPG) with MoCA scores ≤14 [
21]. An overview of participant age, sex, and MoCA scores is visualized in
Table 2.
A Chi-square test on sex was performed and did not show statistical significance among the three groups (X2 = 5.013, p = 0.082). To determine whether there were any statistically significant differences for age and MoCA scores among three groups, a Kruskal–Wallis test was performed and showed that there were statistically significant differences among groups for MoCA scores (H(2) = 48.176, p < 0.001); by performing Dunn’s post hoc test, there were statistically significant differences found between MPG-NC groups (p < 0.001 after Bonferroni and Holm correction statistical significance was maintained), MPG-LPG groups (p < 0.001 after Bonferroni and Holm correction statistical significance was maintained) and NC-LPG (p < 0.001 after Bonferroni and Holm correction statistical significance was maintained). With regards to age, there was no statistical significance among the three groups (H(2) = 0.111, p = 0.964).
2.1. Participant Selection
As part of this study, individuals were referred for assessment by a board-certified neurologist with an expertise in cognitive impairment due to either self-reported cognitive concerns or suspected cognitive decline. All participants selected for inclusion were right-hand dominant.
The exclusion criteria included significant neurological disorders such as brain tumors, major strokes, intracerebral lobar hemorrhages, congenital malformations, Parkinson’s disease, and multiple sclerosis. Additionally, individuals with a history of substance or alcohol abuse, major depressive disorder, schizophrenia, or other severe psychiatric conditions were excluded. Those with documented significant vascular diseases were also not eligible for participation. Patients were included if MRI findings did not indicate any other substantial pathological abnormalities among the study participants.
2.2. MRI Data Acquisition and Analysis
MRI was performed using a 3.0 Tesla MRI scanner (GE Healthcare, Mumbai, MA, USA) in a university hospital setting. For post-processing, 3D T1-weighted axial images were acquired using the following parameters: flip angle of 11, TE set to minimum full, TI of 400, field of view (FOV) of 25.6, and a slice thickness of 1 mm. Additional imaging sequences, including T2, 3D FLAIR, DWI, ADC, and SWI, were utilized to exclude other clinically significant pathologies.
2.3. Data Parcellation and Segmentation
Cortical reconstruction was carried out using FreeSurfer 7.2.0 image analysis software, which is well documented and freely available for download at
http://surfer.nmr.mgh.harvard.edu/, accessed on 7 February 2025. Further descriptions on morphometric analysis used within the FreeSurfer program are published on the FreeSurfer website. The methodological specifics of these procedures have been detailed in previous publications [
11,
15,
22,
23,
24,
25,
26]. For data parcellation, FreeSurfer uses two main atlases—the Desikan–Killiany cortical atlas, which is gyral based, and the Destrieux atlas, which looks more into the gyri and banks of sulci and ultimately provides information on curvature [
27,
28].
2.4. Statistical Analysis
Statistical analyses were conducted using JASP 0.19.1 (Eric-Jan Wagenmakers, Amsterdam, The Netherlands) [
29]. The analysis included descriptive statistics, the Chi-square test, the Mann–Whitney U test, the Kruskal–Wallis test, and Dunn’s post hoc analysis. These tests were chosen due to the non-parametric nature of the data—the initial assessment of data normality was performed using the Shapiro–Wilk test for age and MoCA score, which indicated that non-parametric tests were most appropriate to use; furthermore, each group consisted of
n < 30, which also was an indication to use a non-parametric test.
Descriptive statistics were used to summarize general variables and assess differences between groups. The Chi-square test was applied to examine associations between categorical variables. The Mann–Whitney U test was used to determine statistically significant differences between individuals without cognitive impairment and those with impaired cognitive function, as assessed by the MoCA. The Kruskal–Wallis test was utilized to assess significant differences among the NC, MPG, and LPG groups. When significant differences were detected, Dunn’s post hoc test was conducted to determine pairwise group differences, with additional Bonferroni and Holm corrections applied to mitigate the risk of type I errors (false positive).
4. Discussion
While brain morphometric biomarkers are still at a comparatively early stage of research, they could indicate cognitive impairment at early stages to employ interventions where possible. In recent years, cortical curvature has gained more attention as a potential neuroimaging marker that extends beyond the traditional measures such as cortical thickness and volume analysis [
30,
31]. This study further looked at the association between cortical curvature and cognitive impairment (based on MoCA score results), identifying the brain regions where mean curvature reductions were statistically significantly linked to cognitive impairment. This section examines this study’s findings in relation to previous research and outlines potential future research directions.
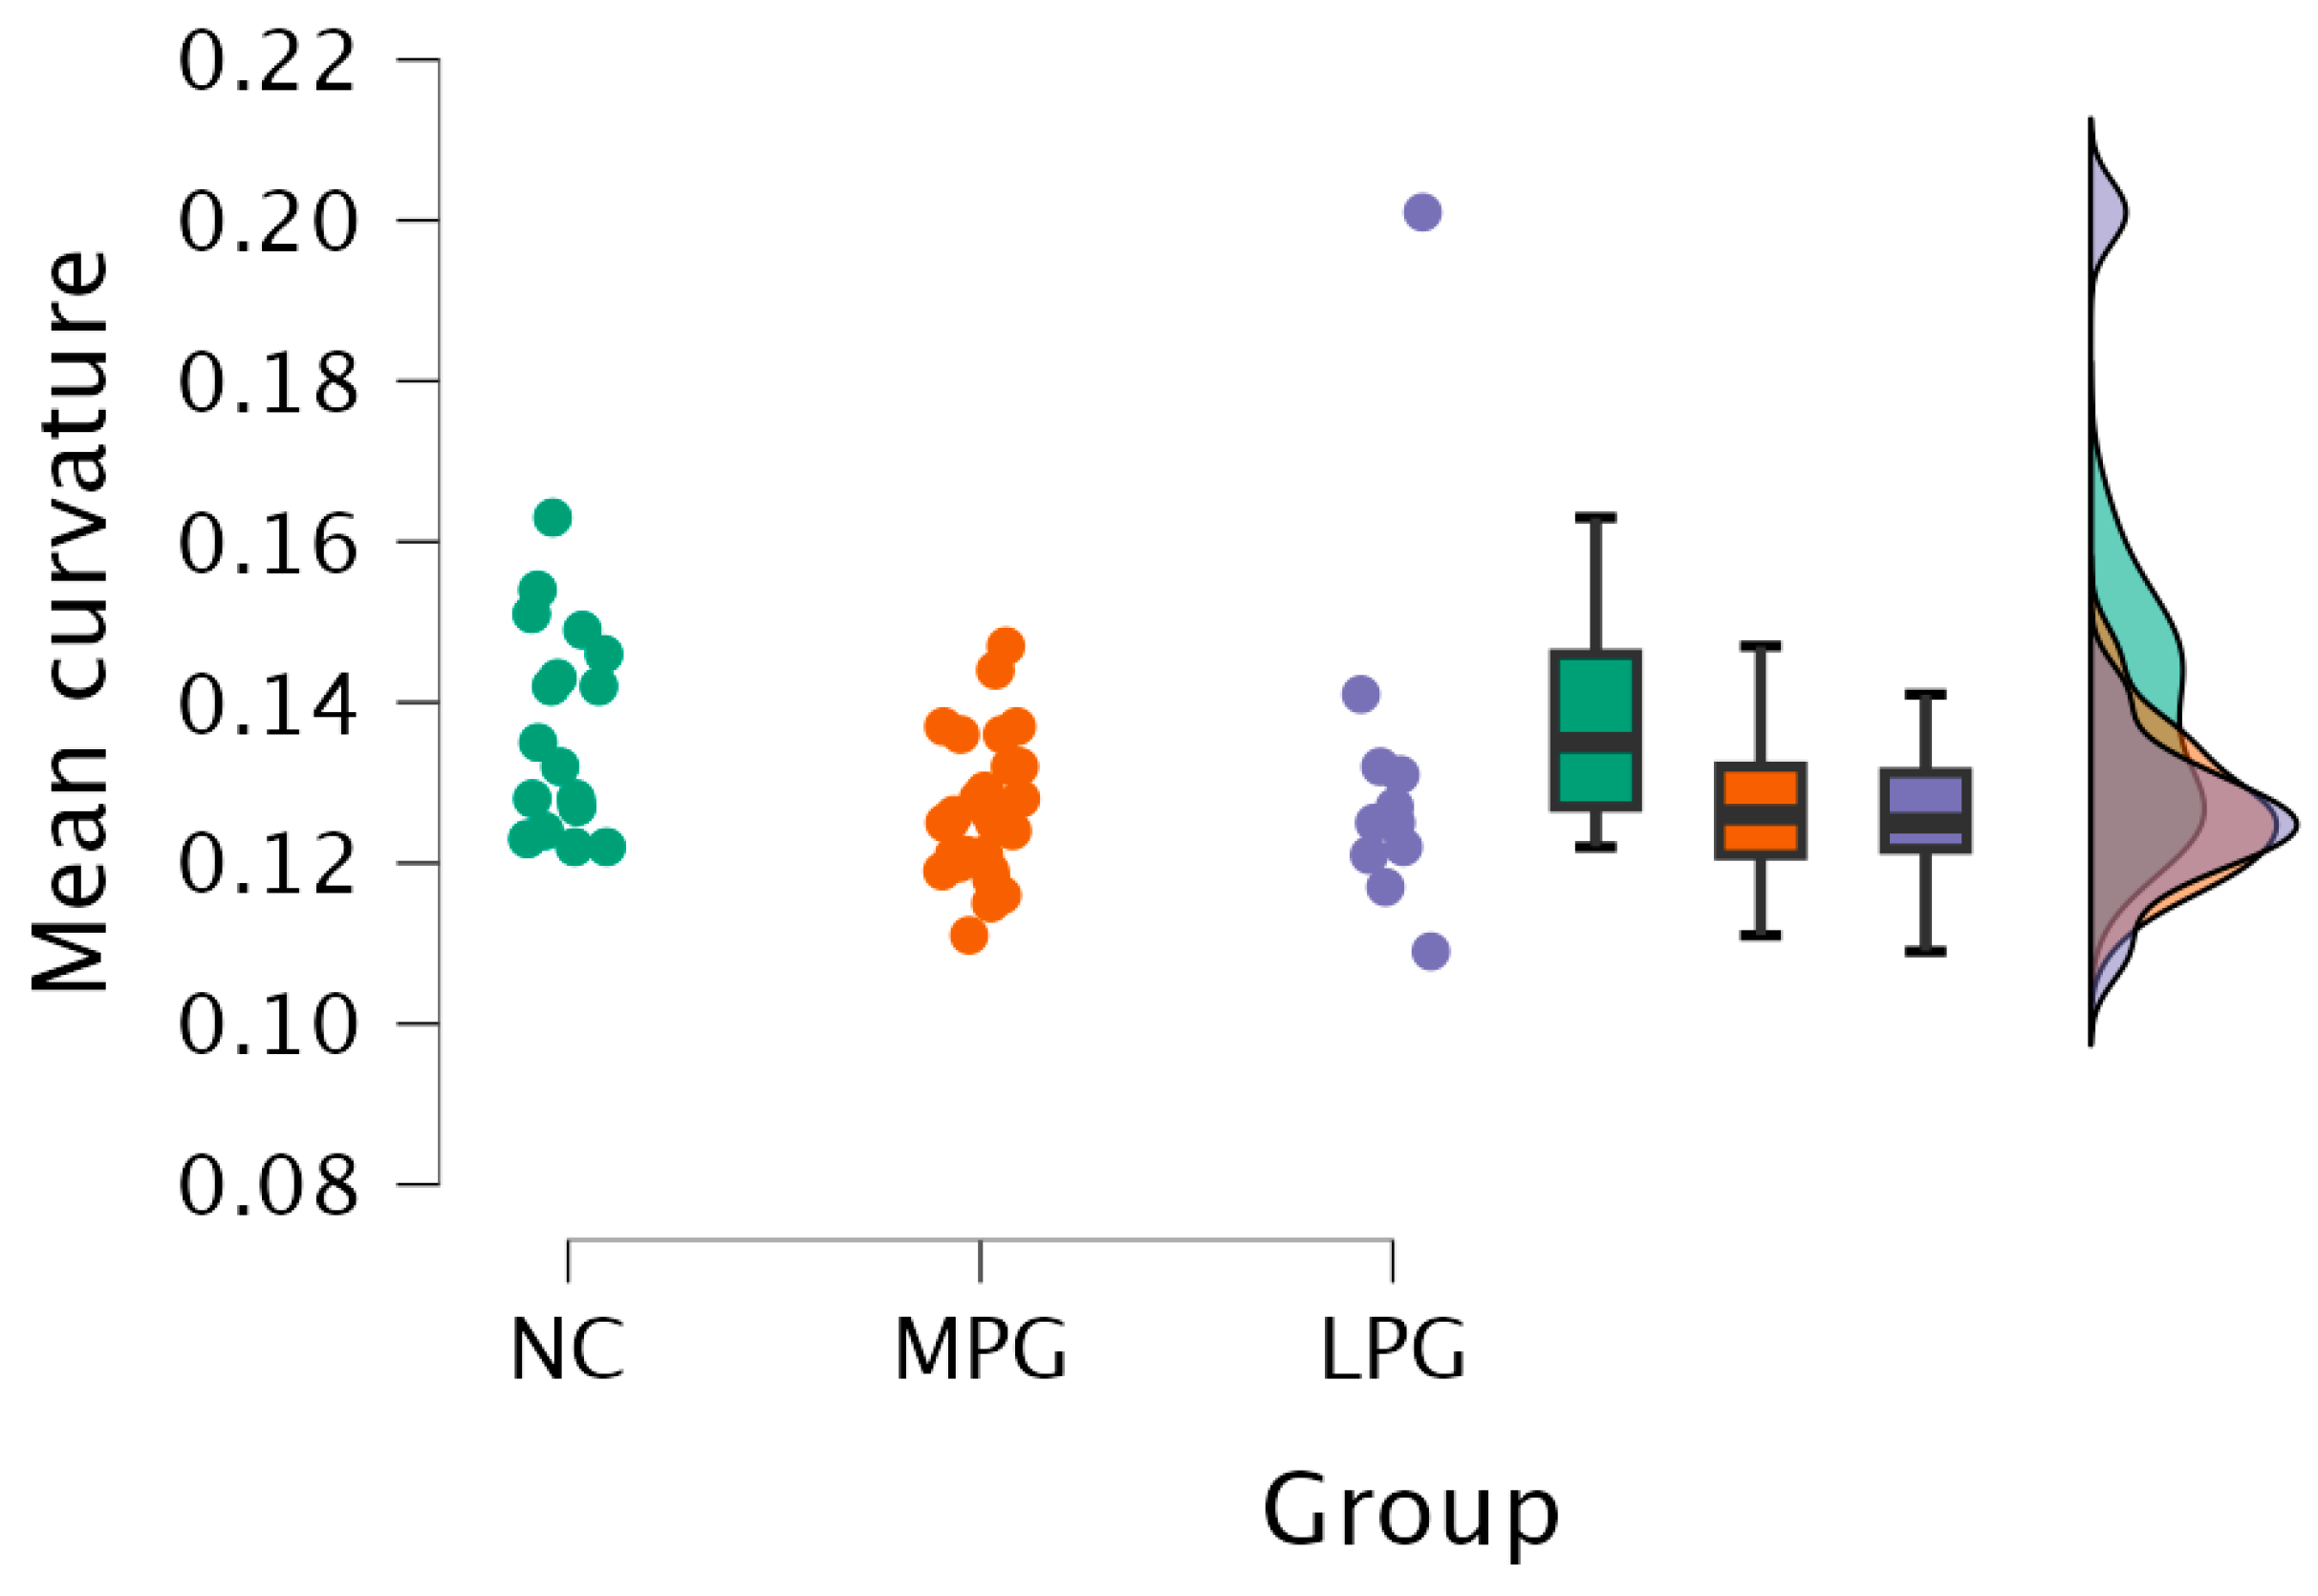
This study provides analysis of specific cortical region mean curvature alterations and their association with cognitive impairment, particularly in regions involved in memory consolidation, executive functions, and visuospatial processing. The results demonstrated that there were statistically significant differences among cognitively impaired patients in the posterior cingulate, isthmus cingulate, lingual, pars orbitalis, and cuneus regions. These findings aligned with previous research showing that changes in cortical folding may serve as an early neurodegenerative indicator [
7]. Specifically, the posterior cingulate region plays a crucial role in memory retrieval and attention [
32].
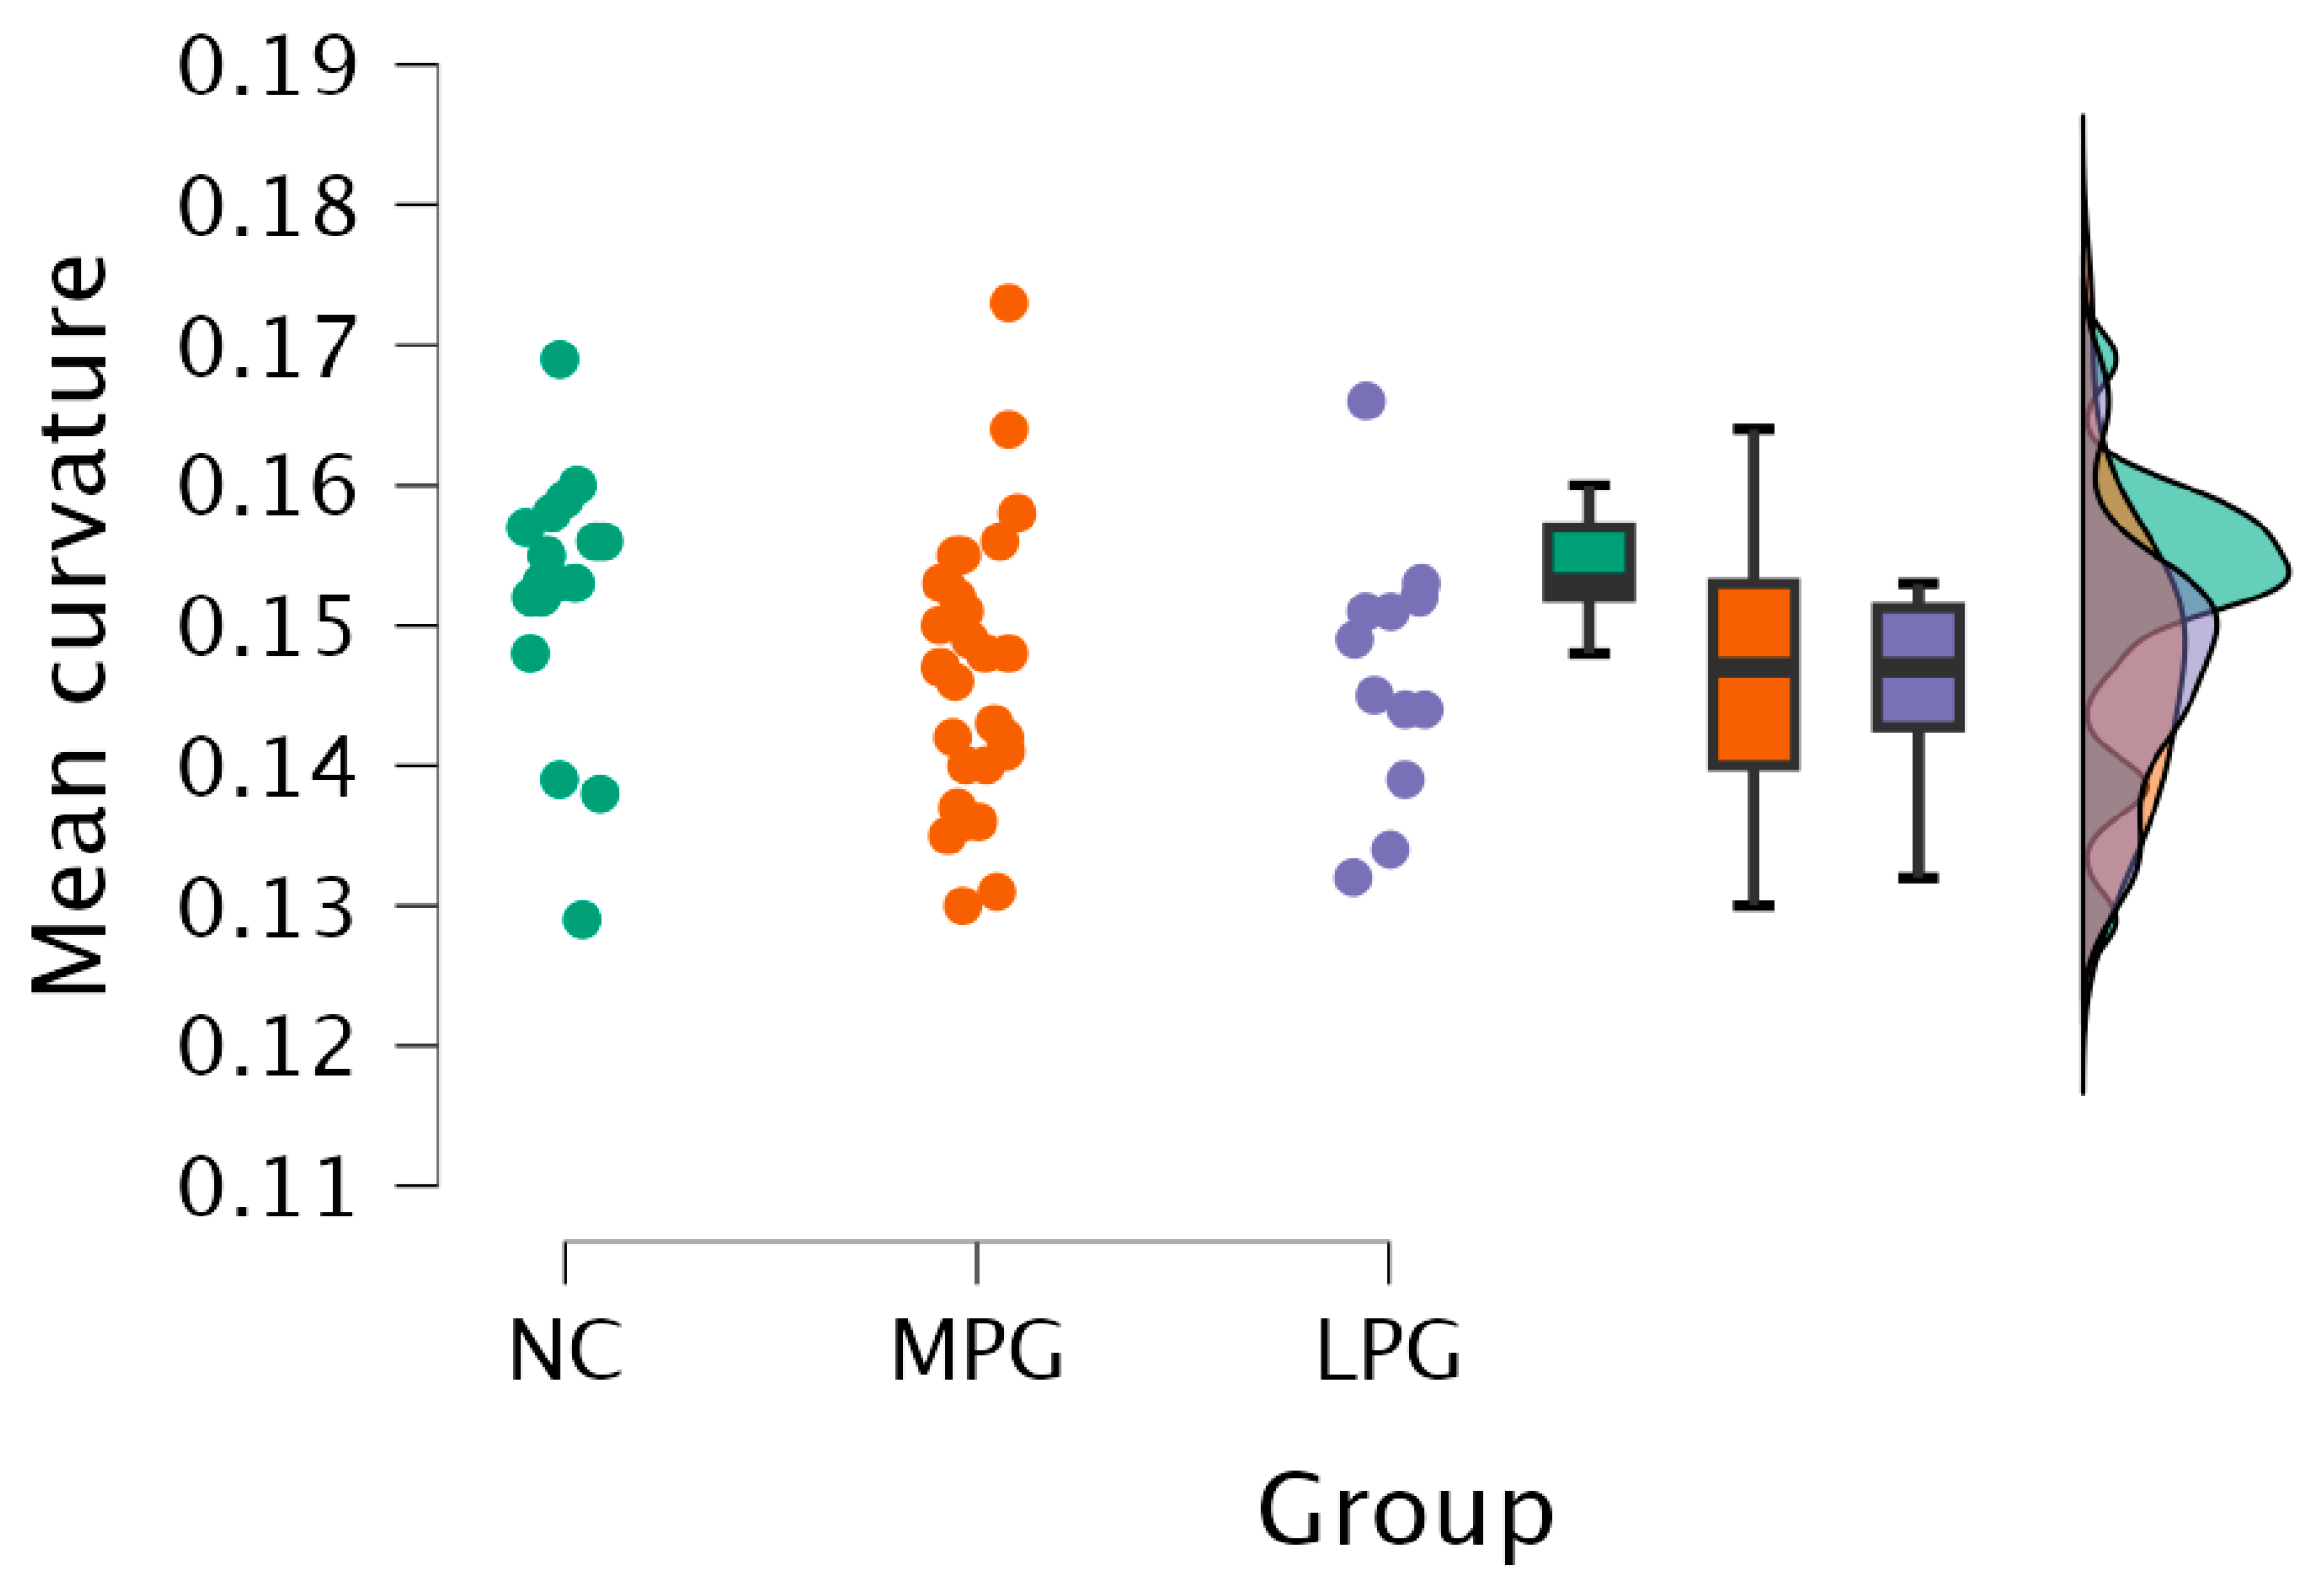
Similarly, structural changes in the isthmus cingulate and lingual regions suggested disruptions in memory-related and visual spatial processing function [
7,
33]. The isthmus cingulate region is linked to the hippocampus and medial temporal lobe and is susceptible to neurodegeneration [
34]. On the other hand, the lingual region, associated with visual memory and object recognition, has been indicated in an early-stage cognitive decline [
35]. Thus, the structural changes could potentially contribute to functional impairments manifesting as early cognitive decline.
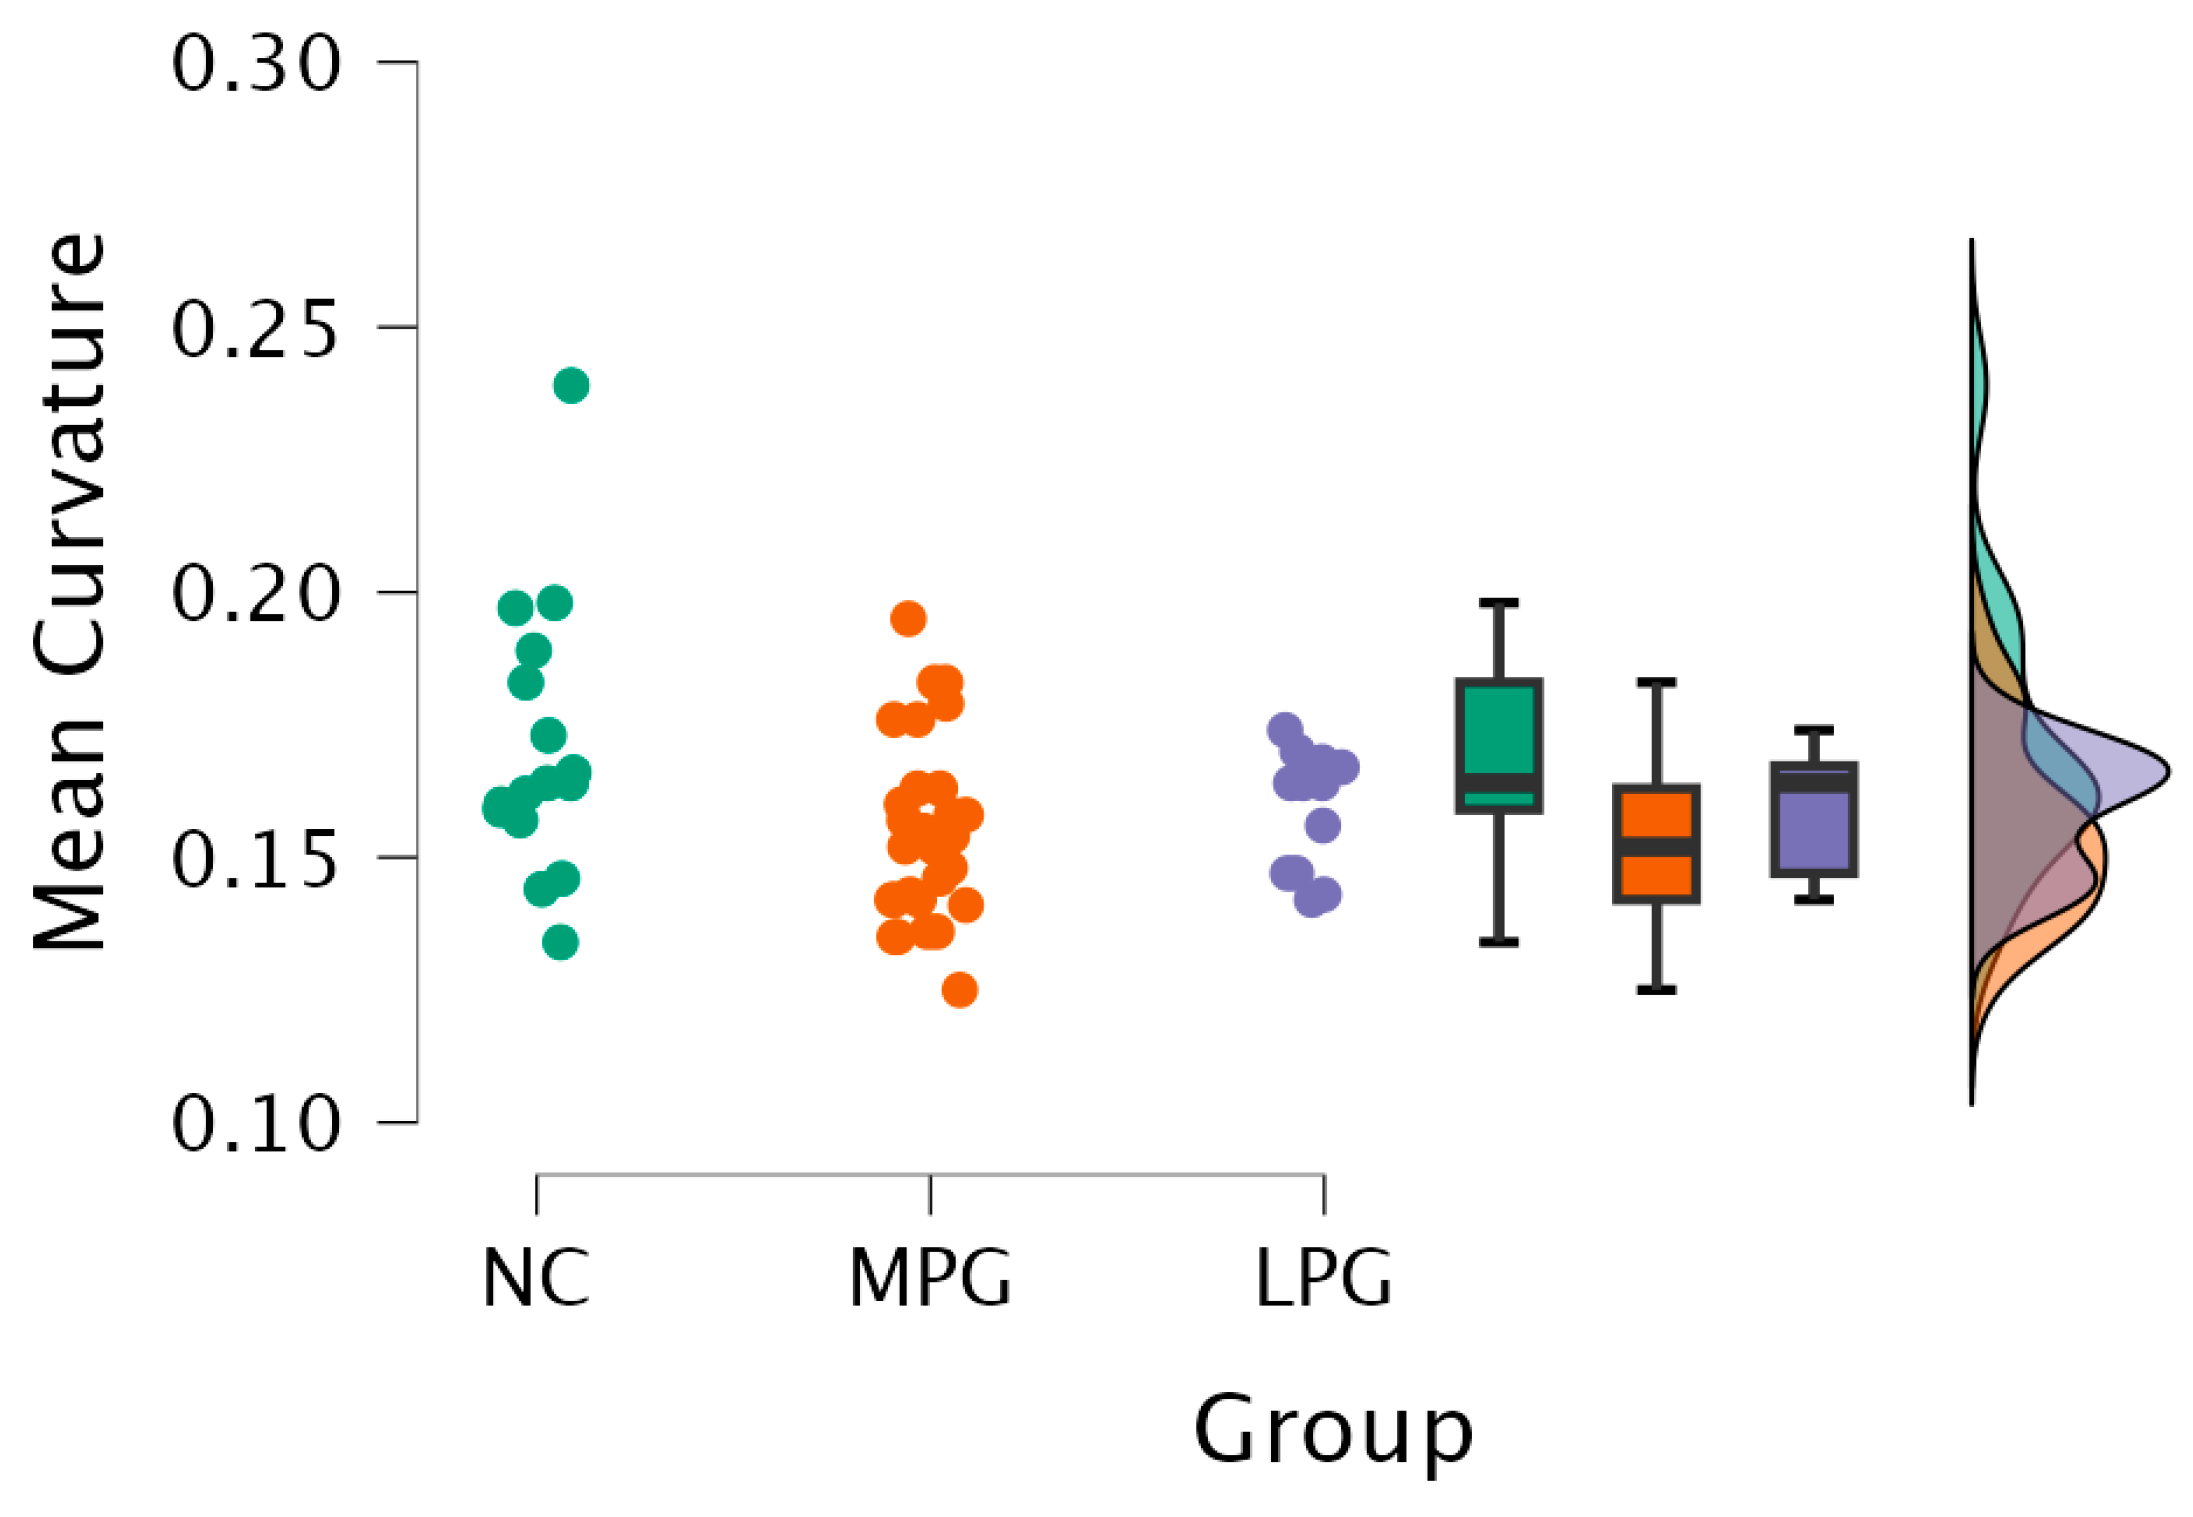
Additionally, the pars orbitalis region that is part of the inferior frontal gyrus also presented curvature changes with cognitive impairment. This region plays a role in executive functioning, verbal fluency, and decision making [
36]. The findings of this study were consistent with prior research showing that frontal lobe involvement in cognitive impairment correlated with deficits in working memory and inhibitory control [
37].
Several mechanisms that could explain the changes in cortical curvature were observed in this study. One hypothesis, known as the tension-based folding theory, demonstrates that cortical gyrification is driven by axonal tension with underlying white matter tracts [
38]. Disruption in the integrity of white matter, as is often observed in cognitive decline, can lead to a loss of cortical tension and thus reduction in gyrification and flattening of the cortex, which subsequently alters the curvature of the cortex [
39].
Another theory that could explain the changes is the synaptic density, which assumes that cortical curvature is related to the density and organization of neuronal synapses [
40]. High-curvature regions are more likely to exhibit significant synaptic density, and neurodegenerative mechanisms with lessening synaptic density and dentritic retraction could contribute to reductions in curvature over time [
40]. This explanation is also in line with the evidence that high-curvature cortical areas are metabolically more active and thus more vulnerable to degeneration (e.g., amyloid-beta accumulation) [
41]. For example, the posterior cingulate has one of the highest baseline metabolic rates in the brain, which makes it particularly sensitive to neurodegeneration [
32,
42].
This study’s results highlight the potential utility of mean cortical curvature as an additional tool for earlier detection of cognitive impairment. Traditional neuroimaging biomarkers, such as the hippocampal atrophy and ventricular enlargement, are often detected after significant neurodegenerative damage has occurred [
43]. Mean curvature may detect subtle morphometric changes at an earlier stage. From a clinical perspective, incorporating mean curvature analysis into neuroimaging diagnostics may enhance accuracy in diagnosing MCI and early-stage Alzheimer disease. Furthermore, adding other biomarkers such as PET imaging for amyloid detection, cortical thickness, volumetric measurements, and functional connectivity measures could increase the sensitivity and specificity of diagnosing cognitive impairment [
44,
45].
While this study provides insights into potential additional biomarkers for cognitive impairment, there are several limitations that have to be taken into consideration. First, the cross-sectional study design does not allow further conclusions regarding the dynamics of cortical curvature changes. A longitudinal study would be useful in determining the prediction or risk of future cognitive decline and progression of disease. Second, the sample size is relatively small, which further limits generalizing our findings. A study with a larger and more diverse population could confirm and potentially provide further insights into the viability of mean curvature as a biomarker of cognitive decline, especially for early cognitive decline. Third, this study focused on structural alterations; however, performing also DTI and fMRI could give more insights in understanding the relationship between cortical mean curvature and cognitive decline.
5. Conclusions
Our study provided evidence that reductions in mean cortical curvature in the posterior cingulate, isthmus cingulate, and lingual regions may be associated with cognitive impairment. These findings reinforced the importance of cortical folding patterns in neurodegenerative disease progression. However, while cortical curvature metrics showed significant differences at the group level, their variability limited their use as standalone biomarkers for individual diagnoses. Future research should investigate whether combining cortical curvature with other neuroimaging or cognitive biomarkers can enhance early detection at the individual level.
While there are limitations to this study, it shows the potential and the need to further investigate morphometric measurement such as mean curvature to detect cognitive decline early on. As indicated beforehand, there should be a larger cohort of participants in the longitudinal study to further ground the results that have been shown as part of this study.

 ,
, 


