
Role of PNPLA3 in the Assessment and Monitoring of Hepatic Steatosis and Fibrosis in Patients with Chronic Hepatitis C Infection Who Achieved a Sustained Virologic Response

 , ,
, ,  and
and
Abstract
:1. Introduction
2. Materials and Methods
3. Results
3.1. Baseline Characteristic of the Patients
3.2. Evolution of Steatosis and Fibrosis Three Months Post-SVR
3.3. Correlation between PNPLA3 Polymorphism, Steatosis and Fibrosis Pre-Treatment (T0)
3.4. Correlation between PNPLA3 Polymorphism and Steatosis and Fibrosisthree Monthspost-SVR (T3)
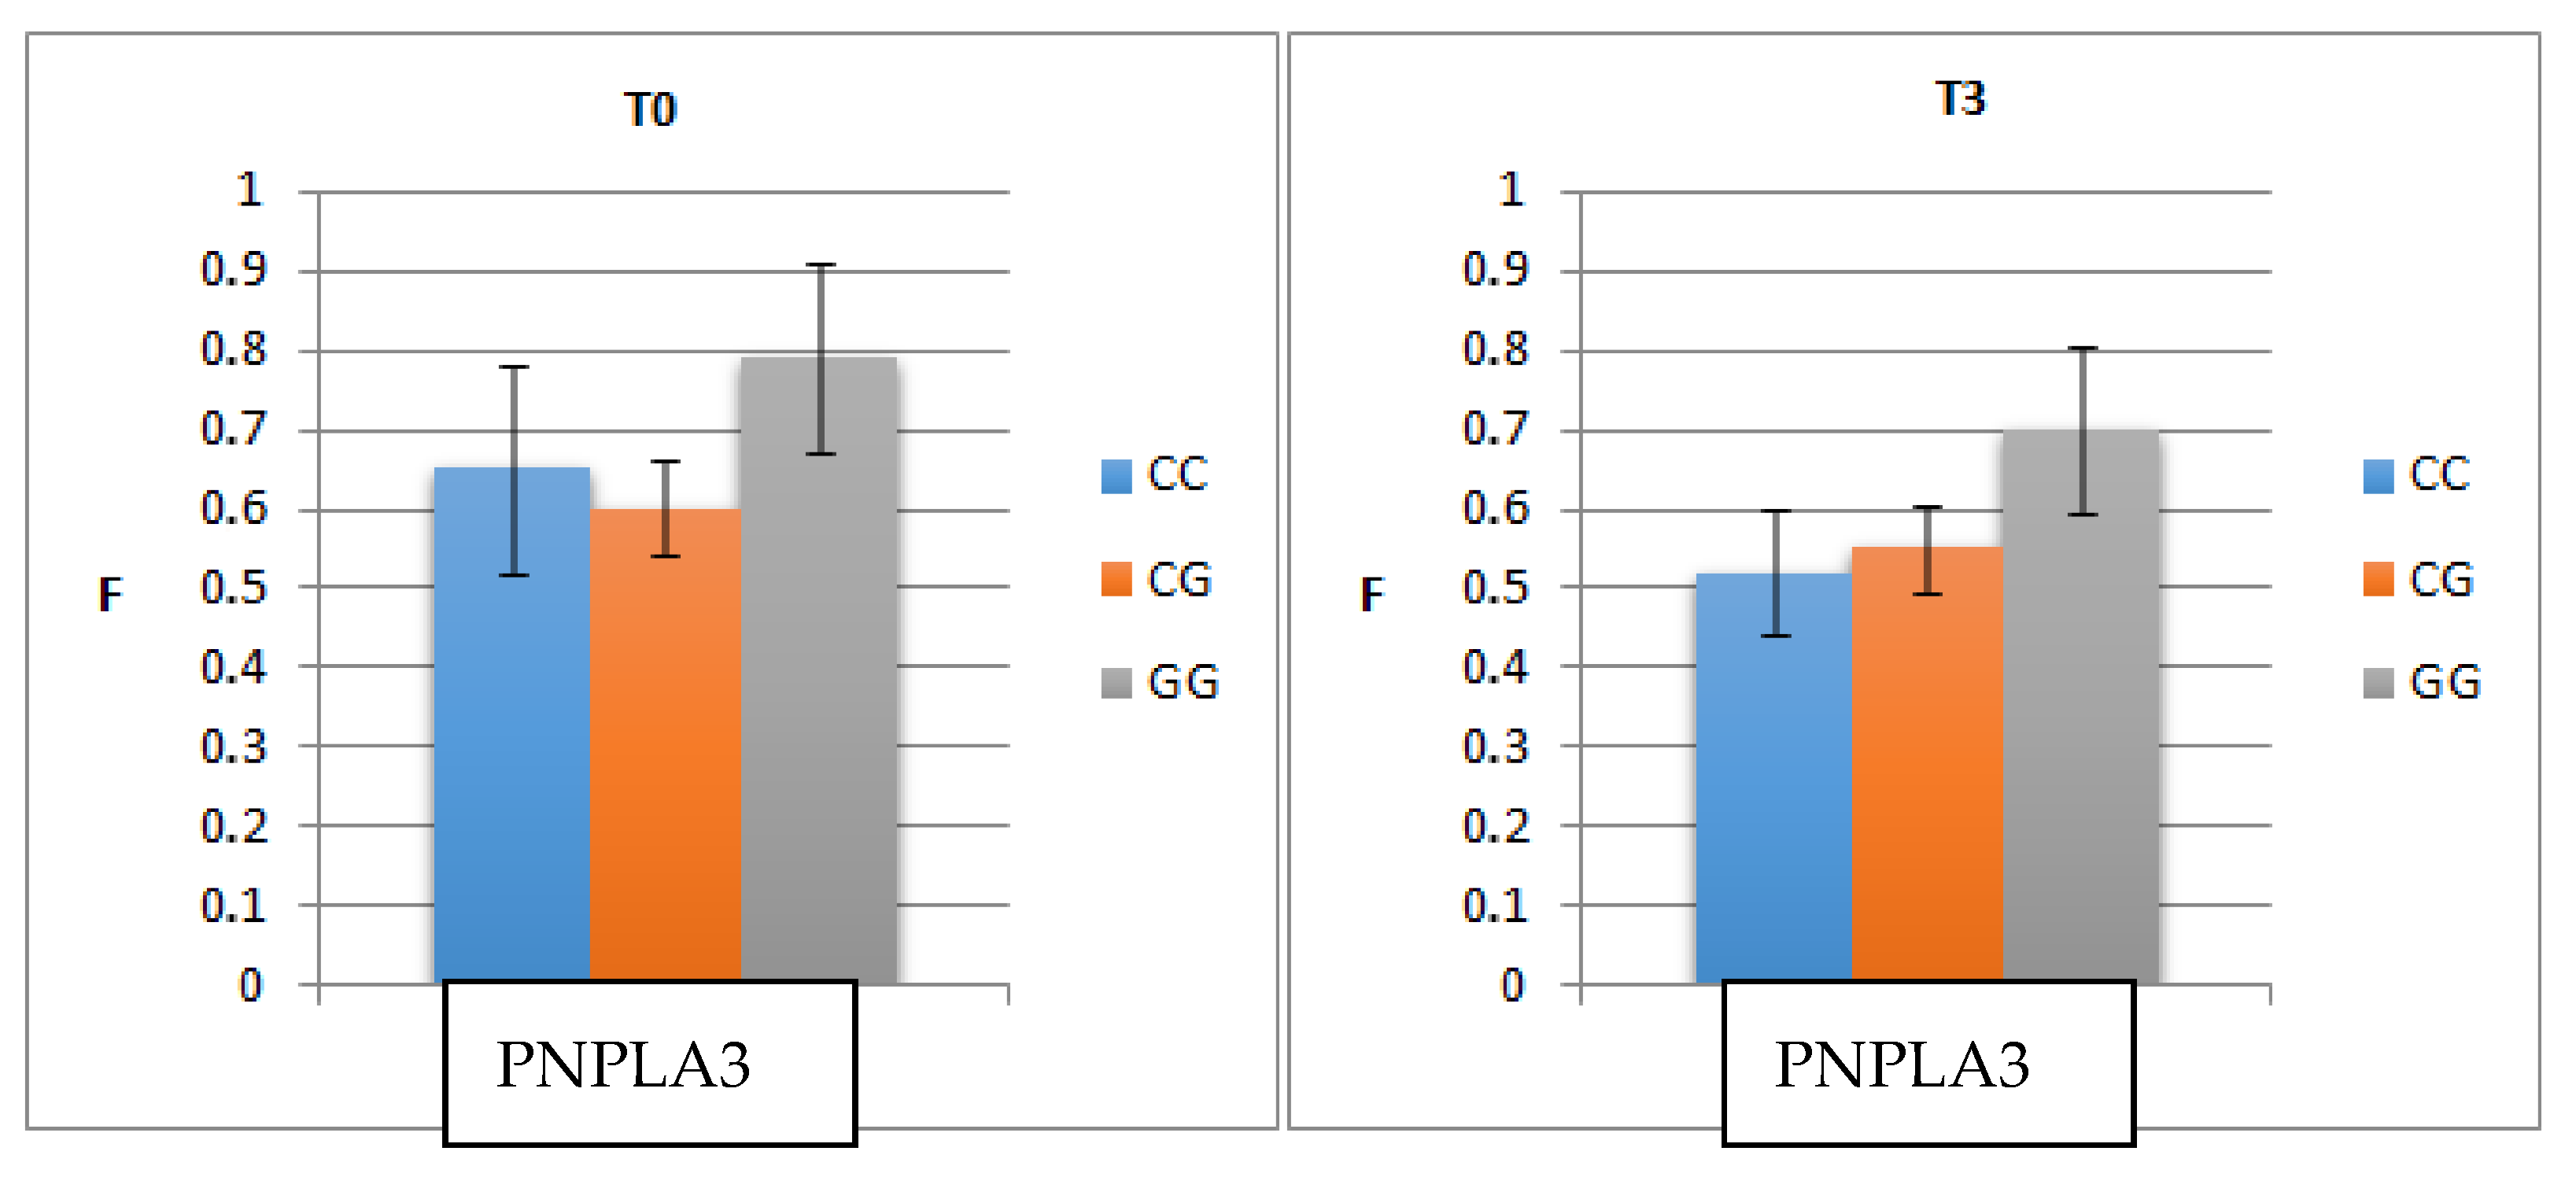
- The mean level of F before treatment was higher in patients with GG (0.79) than in those with CC (0.65) or CG (0.60) (p = 0.006).
- The mean level of fibrosis decreased three monthspost-SVR but remained significantly higher in patients with GG (0.70) than in those with CC (0.50) or CG (0.55) (p = 0.004).
4. Discussion
5. Conclusions
Author Contributions
Funding
Institutional Review Board Statement
Informed Consent Statement
Data Availability Statement
Conflicts of Interest
References
- Meryem, J.; Bisma, R.; Harunor, R.; Thao, L.; Shafquat, R. Update on global epidemiology of viral hepatitis and preventive strategies. World J. Clin. Cases 2018, 6, 589–599. [Google Scholar]
- Trotter, J. Liver transplantation around the world. Liver Transpl. 2017, 22, 123–127. [Google Scholar] [CrossRef] [PubMed]
- Romeo, S.; Kozlitina, J.; Xing, C.; Pertsemlidis, A.; Cox, D.; Pennacchio, L.A.; Boerwinkle, E.; Cohen, J.C.; Hobbs, H.H. Genetic variation in PNPLA3 confers susceptibility to nonalcoholic fatty liver disease. Nat. Genet. 2008, 40, 1461–1465. [Google Scholar] [CrossRef] [Green Version]
- Choudhary, N.S.; Duseja, A. Genetic and epigenetic disease modifiers: Non-alcoholic fatty liver disease (NAFLD) and alcoholic liver disease (ALD). Transl. Gastroenterol. Hepatol. 2021, 5, 2. [Google Scholar] [CrossRef] [PubMed]
- Valenti, L.; Rumi, M.; Galmozzi, E.; Aghemo, A.; del Menico, B.; de Nicola, S.; Dongiovanni, P.; Maggioni, M.; Fracanzani, A.L.; Rametta, R.; et al. Patatin-like phospholipase domain-containing 3 I148M polymorphism, steatosis, and liver damage in chronic hepatitis C. Hepatology 2011, 53, 791–799. [Google Scholar] [PubMed]
- Pan, J.J.; Bao, F.; Du, E.; Skillin, C.; Frenette, C.T.; Waalen, J.; Alaparthi, L.; Goodman, Z.D.; Pockros, P.J. Morphometry Confirms Fibrosis Regression From Sustained Virologic Response to Direct-Acting Antivirals for Hepatitis C. Hepatol. Commun. 2018, 21, 1320–1330. [Google Scholar] [CrossRef] [PubMed] [Green Version]
- Huang, R.; Rao, H.; Yang, M.; Gao, Y.; Wang, J.; Jin, Q.; Ma, D.; Wei, L. Noninvasive Measurements Predict Liver Fibrosis Well in Hepatitis C Virus Patients After Direct-Acting Antiviral Therapy. Dig. Dis. Sci. 2020, 65, 1491–1500. [Google Scholar] [PubMed]
- Laursen, T.L.; Siggaard, C.B.; Kazankov, K.; Sandahl, T.D.; Møller, H.J.; Tarp, B.; Kristensen, L.H.; Laursen, A.L.; Leutscher, P.; Grønbæk, H. Time-dependent improvement of liver inflammation, fibrosis and metabolic liver function after successful direct-acting antiviral therapy of chronic hepatitis C. J. Viral Hepat. 2020, 27, 28–35. [Google Scholar] [CrossRef] [PubMed]
- Colussi, G.; Donnini, D.; Brizzi, R.F.; Maier, S.; Valenti, L.; Catena, C.; Cavarape, A.; Sechi, L.A.; Soardo, G. Sustained virologic response to direct-acting antiviral agents predicts better outcomes in hepatitis C virus-infected patients: A retrospective study. World J. Gastroenterol. 2019, 28, 6094–6106. [Google Scholar] [CrossRef]
- Regev, A.; Berho, M.; Jeffers, L.J.; Milikowski, C.; Molina, E.G.; Pyrsopoulos, N.T.; Feng, Z.; Reddy, K.R.; Schiff, E.R. Sampling error and intraobservervaria-tion in liver biopsy in patients with chronic HCV infection. Am. J. Gastroenterol. 2002, 97, 2614–2698. [Google Scholar] [PubMed]
- Tachi, Y.; Hirai, T.; Miyata, A.; Ohara, K.; Iida, T.; Ishizu, Y.; Honda, T.; Kuzuya, T.; Hayashi, K.; Ishigami, M.; et al. Progressive fibrosis significantly correlates with hepatocellular carcinoma in patients with a sustained virological response. Hepatol. Res. 2015, 21, 238–246. [Google Scholar]
- Shina, G.; Soliman, R.; Mikhail, N.; Ibrahim, A.; Serwah, A.H.; Khattab, M. Changes in hepatic fibrosis stages after achieving SVR following direct-acting anti-viral treatment: A prospective stud. GastroHep 2020, 18, 39–48. [Google Scholar]
- Lledó, G.M.; Carrasco, I.; Benítez-Gutiérrez, L.M.; Arias, A.; Royuela, A.; Requena, S.; Cuervas-Mons, V.; de Mendoza, C. Regression of liver fibrosis after curing chronic hepatitis C with oral antivirals in patients with and without HIV coinfection. AIDS 2018, 23, 2347–2352. [Google Scholar] [CrossRef] [PubMed]
- Dolmazashvili, E.; Abutidze, A.; Chkhartishvili, N.; Krchava, M.; Shardvaze, L.; Tsertsvadze, T. Regression of liver fibrosis over a 24-week period after completing direct-acting antiviral therapy in patients with chronic hepatitis C receiving care within the national hepatitis C elimination program in Georgia: Results of hepatology clinic HEPA experience. Eur. J. Gastroenterol. Hepatol. 2017, 29, 1223–1230. [Google Scholar] [PubMed]
- Noureddin, M.; Wong, M.M.; Todo, T.; Lu, S.C.; Sanyal, A.J.; Mena, E.A. Fatty liver in hepatitis C patients post-sustained virological response with direct-acting antivirals. World J. Gastroenterol. 2018, 21, 1269–1277. [Google Scholar]
- Rosso, C.; Caviglia, G.P.; Younes, R.; Ribaldone, D.G.; Fagoonee, S.; Pellicano, R.; Bugianesi, E. Molecular mechanisms of hepatic fibrosis in chronic liver diseases. Minerva Biotecnol 2020, 32, 121–127. [Google Scholar] [CrossRef]
- Jiménez-Sousa, M.Á.; Gómez-Moreno, A.Z.; Pineda-Tenor, D.; Sánchez-Ruano, J.J.; Fernández-Rodríguez, A.; Artaza-Varasa, T.; Gómez-Sanz, A.; Martín-Vicente, M.; Vázquez-Morón, S.; Resino, S. PNPLA3 rs738409 polymorphism is associated with liver fibrosis progression in patients with chronic hepatitis C: A repeated measures study. J. Clin. Virol. 2018, 103, 71–74. [Google Scholar] [PubMed]
- Manchiero, C.; Nunes, A.K.d.; Magri, M.C.; Dantas, B.P.; Mazza, C.C.; Barone, A.A.; Tengan, F.M. The rs738409 polymorphism of the PNPLA3 gene is associated with hepatic steatosis and fibrosis in Brazilian patients with chronic hepatitis C. BMC Infect. Dis. 2017, 19, 780. [Google Scholar]
- BasuRay, S.; Wang, Y.; Smagris, E.; Cohen, J.C.; Hobbs, H.H. Accumulation of PNPLA3 on lipid droplets is the basis of associated hepatic steatosis. Proc. Natl. Acad. Sci. USA 2019, 116, 9521–9526. [Google Scholar] [CrossRef] [Green Version]
- Dong, X.C. PNPLA3-A Potential Therapeutic Target for Personalized Treatment of Chronic Liver Disease. Front Med. 2019, 17, 304. [Google Scholar]
- Mazo, D.F.; Malta, F.M.; Stefano, J.T.; Salles, A.P.M.; Gomes-Gouvea, M.S.; Nastri, A.C.S.; Almeida, J.R.; Pinho, J.R.R.; Carrilhoa, F.J.; Oliveira, C.P. Validation of PNPLA3 polymorphisms as risk factor for NAFLD and liver fibrosis in an admixed population. Ann. Hepatol. 2019, 18, 466–471. [Google Scholar] [CrossRef]
- Kawagishi, N.; Suda, G.; Nakamura, A.; Kimura, M.; Maehara, O.; Suzuki, K.; Nakamura, A.; Ohara, M.; Izumi, T.; Umemura, M.; et al. Liver steatosis and dyslipidemia after HCV eradication by direct acting antiviral agents are synergistic risks of atherosclerosis. PLoS ONE 2018, 21, e0209615. [Google Scholar] [CrossRef] [Green Version]

| Parameter | Value |
|---|---|
| Gender | |
| Male (%) | 35.0 |
| Female (%) | 65.0 |
| Age | |
| Average ± SD | 60.74 ± 8.58 |
| Min–max/median/Skewness test values | 35–77/61/−0.512 |
| Fibrosis | |
| Average ± SD | 0.65± 0.18 |
| Min–max/median/Skewness test values | 0.32–0.96/0.65/−0.080 |
| Degree of liver fibrosis | |
| F2 (%) | 36.0 |
| F3 (%) | 21.0 |
| F4 (%) | 43.0 |
| Steatosis | |
| Average ± SD | 0.50± 0.18 |
| Min–max/median/Skewness test values | 0.11–0.89/0.49/−0.015 |
| Degree of liver steatosis | |
| S0 (%) | 12.0 |
| S1 (%) | 32.0 |
| S2 (%) | 37.0 |
| S3 (%) | 19.0 |
| Parameters | CC (n = 58) | CG (n = 29) | GG (n = 13) | Test Statistics | p |
|---|---|---|---|---|---|
| Age | 0.85 | ||||
| Average ± SD | 61.16 ± 9.66 | 60.24 ± 6.61 | 60.00 ± 7.72 | F ANOVA test | |
| BMI | 0.548 | ||||
| Average ± SD | 27.52 ± 4.74 | 26.43 ± 3.23 | 27.67 ± 6.50 | F ANOVA test | |
| Gender | 0.896 | ||||
| Male (%) | 20 (34.5%) | 11 (37.9%) | 4 (30.8%) | Kruskal–Wallistests | |
| Female (%) | 38 (65.5%) | 18 (62.1%) | 9 (69.2%) | ||
| Fibrosis | 0.024 | ||||
| F2 (%) | 20 (34.5%) | 15 (51.7%) | 1 (7.7%) | Kruskal–Wallistests | |
| F3 (%) | 10 (17.2%) | 7 (24.1%) | 4 (30.8%) | ||
| F4 (%) | 28 (48.3%) | 7 (24.1%) | 8 (61.5%) | ||
| Steatosis | 0.013 | ||||
| S0 (%) | 9 (15.5%) | 3 (10.3%) | 0 (0.0%) | Kruskal–Wallistests | |
| S1 (%) | 19 (32.8%) | 8 (27.6%) | 5 (38.5%) | ||
| S2 (%) | 14 (24.1%) | 16 (55.2%) | 7 (53.8%) | ||
| S3 (%) | 16 (27.6%) | 2 (6.9%) | 1 (7.7%) | ||
| ALT | 0.878 | ||||
| Average ± SD | 94.50 ± 64.24 | 87.92 ± 63.18 | 82.17 ± 51.02 | F ANOVA test | |
| AST | 0.422 | ||||
| Average ± SD | 69.02 ± 36.66 | 68.69 ± 44.00 | 91.00 ± 39.82 | F ANOVA test | |
| GammaGT | 0.286 | ||||
| Average ± SD | 63.67 ± 42.59 | 66.00 ± 49.69 | 35.00 ± 16.81 | F ANOVA test | |
| ALP | 0.114 | ||||
| Average ± SD | 84.86 ± 22.55 | 103.80 ± 39.70 | 89.69 ± 11.50 | F ANOVA test | |
| Totalbilirubin | 0.001 | ||||
| Average ± SD | 0.77 ± 0.33 | 0.94 ± 0.63 | 1.90 ± 1.29 | F ANOVA test | |
| ApolipoproteinA1 | 0.129 | ||||
| Average ± SD | 1.43 ± 0.29 | 1.36 ± 0.27 | 1.18 ± 0.29 | F ANOVA test | |
| Alfa-2-macroglobulin | 0.072 | ||||
| Average ± SD | 3.52 ± 0.56 | 3.18 ± 0.70 | 3.00 ± 0.85 | F ANOVA test | |
| Heptoglobulin | 0.08 | ||||
| Average ± SD | 0.72 ± 0.34 | 0.85 ± 0.57 | 0.40 ± 0.29 | F ANOVA test | |
| TotalCholesterol | 0.019 | ||||
| Average ± SD | 154.14 ± 27.78 | 147.62 ± 35.13 | 115.33 ± 34.72 | F ANOVA test | |
| Triglicerides | 0.689 | ||||
| Average ± SD | 90.49 ± 32.70 | 97.15 ± 24.37 | 85.50 ± 18.64 | F ANOVA test | |
| Fasting glucose | 0.094 | ||||
| Average ± SD | 99.54 ± 9.94 | 97.85 ± 9.56 | 90.00 ± 9.42 | F ANOVA test |
| T0 | T3 | Paired Samples Statistics | |
|---|---|---|---|
| Fibrosis F2–F4 | 0.66 ± 0.18 | 0.55 ± 0.18 | 0.001 |
| F2 | 0.45 ± 0.07 | 0.43 ± 0.13 | 0.205 |
| F3 | 0.65 ± 0.04 | 0.51 ± 0.09 | 0.001 |
| F4 | 0.82 ± 0.08 | 0.67 ± 0.16 | 0.001 |
| Steatosis S0–S3 | 0.50 ± 0.18 | 0.34 ± 0.14 | 0.001 |
| S0 | 0.33 ± 0.14 | 0.30 ± 0.14 | 0.481 |
| S1 | 0.34 ± 0.08 | 0.25 ± 0.11 | 0.001 |
| S2 | 0.58 ± 0.06 | 0.40 ± 0.12 | 0.001 |
| S3 | 0.76 ± 0.05 | 0.45 ± 0.11 | 0.001 |
| F Pre-Treatment | S Pre-Treatment | |||||
|---|---|---|---|---|---|---|
| CC | CG | GG | CC | CG | GG | |
| mean ±SD | 0.65 ± 0.18 | 0.60 ± 0.17 | 0.79 ± 0.12 | 0.51 ± 0.20 | 0.48 ± 0.17 | 0.52 ± 0.16 |
| CC | - | p = 0.459 | p = 0.042 | - | p = 0.999 | p = 0.999 |
| CG | p = 0.459 | - | p = 0.004 | p = 0.999 | - | p = 0.999 |
| GG | p = 0.042 | p = 0.004 | - | p = 0.999 | p = 0.999 | - |
| F Three Monthspost-SVR | S Three Monthspost-SVR | |||||
|---|---|---|---|---|---|---|
| CC | CG | GG | CC | CG | GG | |
| mean ±SD | 0.52 ± 0.17 (a) | 0.55 ± 0.18 (b) | 0.70 ± 0.15 (b) | 0.33 ± 0.14 (a) | 0.35 ± 0.13 (a) | 0.37 ± 0.18 (b) |
| CC | - | p = 0.999 | p = 0.003 | - | p = 0.999 | p = 0.916 |
| CG | p = 0.999 | - | p = 0.027 | p = 0.999 | - | p = 0.999 |
| GG | p = 0.003 | p = 0.027 | - | p = 0.916 | p = 0.999 | - |
| Parameters | CC (n=58) | CG (n=29) | GG (n=13) | Test Statistics | p |
|---|---|---|---|---|---|
| Fibrosis | 0.050 | ||||
| F1 (%) | 5 (8.6%) | 2 (6.9%) | 0 (0.0%) | Kruskal–Wallistests | |
| F2 (%) | 35 (60.3%) | 15 (51.7%) | 2 (15.4%) | ||
| F3 (%) | 11 (19.0%) | 8 (27.6%) | 6 (46.2%) | ||
| F4 (%) | 7 (12.1%) | 4 (13.8%) | 5 (38.5%) | ||
| Steatosis | 0.035 | ||||
| S0 (%) | 23 (39.7%) | 9 (31.0%) | 5 (38.5%) | Kruskal–Wallistests | |
| S1 (%) | 27 (46.6%) | 16 (55.2%) | 4 (30.8%) | ||
| S2 (%) | 8 (13.8%) | 4 (13.8%) | 3 (23.1%) | ||
| S3 (%) | 0 (0.0%) | 0 (0.0%) | 1 (7.7%) |
Publisher’s Note: MDPI stays neutral with regard to jurisdictional claims in published maps and institutional affiliations. |
© 2021 by the authors. Licensee MDPI, Basel, Switzerland. This article is an open access article distributed under the terms and conditions of the Creative Commons Attribution (CC BY) license (https://creativecommons.org/licenses/by/4.0/).
Share and Cite
Gavril, O.I.; Arhire, L.I.; Gavrilescu, O.; Dranga, M.; Barboi, O.; Gavril, R.S.; Popescu, R.; Cijevschi Prelipcean, C.; Trifan, A.-V.; Mihai, C. Role of PNPLA3 in the Assessment and Monitoring of Hepatic Steatosis and Fibrosis in Patients with Chronic Hepatitis C Infection Who Achieved a Sustained Virologic Response. Medicina 2021, 57, 1153. https://doi.org/10.3390/medicina57111153
Gavril OI, Arhire LI, Gavrilescu O, Dranga M, Barboi O, Gavril RS, Popescu R, Cijevschi Prelipcean C, Trifan A-V, Mihai C. Role of PNPLA3 in the Assessment and Monitoring of Hepatic Steatosis and Fibrosis in Patients with Chronic Hepatitis C Infection Who Achieved a Sustained Virologic Response. Medicina. 2021; 57(11):1153. https://doi.org/10.3390/medicina57111153
Chicago/Turabian StyleGavril, Oana Irina, Lidia Iuliana Arhire, Otilia Gavrilescu, Mihaela Dranga, Oana Barboi, Radu Sebastian Gavril, Roxana Popescu, Cristina Cijevschi Prelipcean, Anca-Victorita Trifan, and Catalina Mihai. 2021. "Role of PNPLA3 in the Assessment and Monitoring of Hepatic Steatosis and Fibrosis in Patients with Chronic Hepatitis C Infection Who Achieved a Sustained Virologic Response" Medicina 57, no. 11: 1153. https://doi.org/10.3390/medicina57111153
APA StyleGavril, O. I., Arhire, L. I., Gavrilescu, O., Dranga, M., Barboi, O., Gavril, R. S., Popescu, R., Cijevschi Prelipcean, C., Trifan, A.-V., & Mihai, C. (2021). Role of PNPLA3 in the Assessment and Monitoring of Hepatic Steatosis and Fibrosis in Patients with Chronic Hepatitis C Infection Who Achieved a Sustained Virologic Response. Medicina, 57(11), 1153. https://doi.org/10.3390/medicina57111153