Abstract
Background/Objectives: Amyloid-β (Aβ) plaque accumulation, oxidative stress, and cholinergic dysfunction are hallmarks of Alzheimer’s disease (AD), a neurodegenerative disability that progresses over time, ultimately resulting in the loss of neurons. The side effects and limitations of current synthetic drugs have shifted attention toward natural alternatives. This study investigates the ethanolic extract of Aegle marmelos (L.) Corrêa fruits for their antioxidant, AChE-inhibitory, and anti-amyloidogenic properties, as well as their neuroprotective effects against amyloid beta-peptide (Aβ1–42). Methods: Phytochemical constituents were identified through HR-LCMS analysis and their antioxidant (DPPH, FRAP) and neuroprotective activities (AChE inhibition, ThT binding, MTT assay, ROS reduction, MMP restoration, and AD-related gene expression via qRT-PCR) were assessed using SHSY-5Y neuroblastoma cells. Results: The extract revealed the existence of flavonoids, phenols, and other bioactive substances. In vitro assays demonstrated strong antioxidant and AChE-inhibitory activities, while the ThT binding assay showed protection against amyloid-β aggregation. The extract exhibited no cytotoxicity in SHSY-5Y cells, even at a concentration of 500 μg/mL, whereas Aβ1–42 at 20 μM induced significant cytotoxicity. Co-treatment with Aβ1–42 (10 μM and 20 μM) and the extract improved cell viability (˃50%) and reduced ROS levels. Additionally, the extract restored mitochondrial membrane potential in Aβ1–42 treated cells, highlighting its role in preserving mitochondrial function. Conclusions: These findings suggest that A. marmelos fruits serve as a powerful source of natural antioxidants, AChE inhibitors, and anti-amyloidogenic agents, positioning them as a compelling option for AD treatment.
1. Introduction
Alzheimer’s disease (AD) is a prevalent neurodegenerative disorder marked by progressive memory impairment, cognitive decline, and alterations in behavior throughout its development [1]. It is well established that AD is the major disorder that develops into dementia. Millions of people around the globe suffer from this disease, and global health systems face an enormous challenge as a result [2,3]. Although decades of research have concentrated on revealing the exact etiology of AD, the causes of its onset and progression remain obscure, but it is widely accepted that genetics, environmental factors, and lifestyle factors are all associated with the emergence and advancement of AD [4,5]. Aside from the build-up of amyloid-β peptides, a key feature of AD is the creation of amyloid-β plaque in the brain [6,7]. As a result of these plaques, neuronal communication is disrupted, inflammatory responses are triggered, and neuronal death is caused. Being one of the pathological characteristics of AD, neurofibrillary tangles are formed as a result of hyperphosphorylated tau protein and act as further signs and symptoms of the disease [8,9]. These tangles worsen neuronal dysfunction and are a major driver in the progression of the disease [10]. The amyloid cascade hypothesis proposes that amyloid peptide deposition is a key factor in AD pathogenesis, triggering multiple neurotoxic events such as oxidative stress, mitochondrial dysfunction, and synaptic loss [11].
Oxidative stress is a major contributing aspect in the pathophysiology of AD. As the brain contains a high content of monounsaturated fatty acids and is highly metabolic, it is prone to oxidative damage [12]. Aβ peptides can enhance the synthesis of ROS, which subsequently harms cellular components like lipids, proteins, and DNA. This oxidative damage impairs neuronal activity and contributes to the neurodegenerative process [13]. Moreover, the mitochondria, the powerhouse of the cell, are also adversely affected by Aβ peptides. Mitochondrial dysfunction, resulting from impaired energy metabolism and elevated ROS production, intensifies neuronal damage and promotes apoptosis [14].
Current therapeutic strategies for AD mainly aim at improving symptoms instead of addressing the fundamental mechanisms of the disease [15]. The current drug treatment methods, which include N-methyl-D-aspartate (NMDA) receptor antagonists and acetylcholinesterase inhibitors, have numerous negative side effects in addition to their limited therapeutic benefits [16]. Therefore, it is imperative that new therapeutic agents are developed that can successfully target the diverse pathological processes that promote AD. Natural compounds derived from medicinal plants have gained increased attention recently as methods to promote neuroprotection [17,18]. There are a wide range of biological activities associated with these compounds, such as antioxidant, anti-inflammatory, and anti-apoptotic effects [19,20]. Among the various plants studied, A. marmelos, often called Bael, has historically been utilized in Ayurvedic medicine for its diverse therapeutic properties. According to studies, the fruit of A. marmelos contains a rich content of phytochemical constituents like phenols, flavonoids, coumarins, terpenoids, etc., which are capable of exhibiting potent antioxidant and neuroprotective properties, as well as being a potential food source [21,22].
An important group of polyphenols found in A. marmelos are flavonoids, which scavenge free radicals and chelate metal ions, helping to combat oxidative stress [23,24]. Additionally, flavonoids can modulate metabolic pathways that are important for cell survival and apoptosis, providing a protective effect against various neurotoxic damage [25,26]. Coumarins and terpenoids, also found in A. marmelos, reportedly possess neuroprotective and anti-inflammatory activities. In addition, these compounds prevent AD from progressing by reducing the release of pro-inflammatory cytokines and microglial activation, which cooperate to cause neuroinflammation, a key contributor to this disease [27,28].
The neuroprotective potential of A. marmelos fruits and other parts have been explored in a few studies. Several studies have demonstrated that the natural extracts are capable of protecting neuronal cells from oxidative stress, reducing neuroinflammation, and enhancing cognitive function in animal models of neurodegeneration, with the conclusions that the extracts are beneficial to neuronal cells [27,28]. However, the mechanism responsible for A. marmelos fruits’ neuroprotective actions, particularly against Aβ peptide-induced toxicity, remain to be entirely revealed. In view of this, the present study was undertaken to evaluate whether AMFE possesses any neuroprotective properties towards toxicity induced by Aβ peptides in human neuroblastoma SH-SY5Y cells. This cell line is commonly utilized as an in vitro model for studying neurodegenerative processes and drug screening, as it possesses many of the biochemical and morphological characteristics of mature neurons [28,29,30]. The hypothesis was that the possible presence of several bioactive compounds in AMFE may alleviate Aβ-derived neurotoxicity by improving cell viability, reducing damage caused by ROS, and maintaining the activity of mitochondria. For the purpose of testing this hypothesis, a treatment of SH-SY5Y cells was carried out with Aβ peptides, both when AMFE was present or absent. The cytoprotective effects of the extract on cellular survival were assessed using the MTT assay, which detects the metabolic function of cells as an indicator of cell health. Additionally, the antioxidant activity of the extract was determined by the content of intracellular ROS and the effect of the extract on mitochondrial function by analyzing the mitochondrial membrane potential.
Moreover, currently, AD remains a significant public health challenge due to the lack of effective disease-modifying treatments. Current pharmacological interventions including cholinesterase inhibitors and NMDA receptor antagonists provide only symptomatic relief and fail to halt disease progression [16]. Emerging evidence suggests that oxidative stress, mitochondrial dysfunction, and cholinergic deficits play critical roles in AD pathogenesis, highlighting the need for therapeutic agents that target multiple pathological pathways [14]. Despite the growing interest in plant-derived bioactive compounds with neuroprotective properties, limited studies have explored the potential of AMFE in mitigating Aβ-induced toxicity. Given its antioxidant, anti-inflammatory, and acetylcholinesterase (AChE) inhibitory properties, AMFE presents a promising candidate for AD intervention [27,28]. However, the precise mechanisms by which AMFE exerts its neuroprotective effects remain poorly understood. This study aims to address this gap by evaluating the multifaceted protective effects of AMFE against Aβ1–42 induced toxicity in SH-SY5Y cells, thereby advancing the current knowledge on potential natural therapeutic approaches to AD management.
2. Results
2.1. Phytochemical Screening and Content Analysis
As a result of the primary phytochemical analysis of AMFE, alkaloids, saponins, terpenoids, flavonoids, and phenolic compounds were detected. Previous studies indicate that there is an inherent relationship between flavonoid content and phenolic content and antioxidant activity. These natural compounds are known to mitigate the progression of neurological diseases in both in vitro and in vivo assays. The overall contents of phenolic and flavonoid compounds in the AMFE were quantified via calibration curves for gallic acid and quercetin, respectively. The phenol content in the dry extract was 32.47 mg/mL gallic acid equivalents, while the content of flavonoid content was 20.59 mg/mL quercetin equivalents.
2.2. UV-VIS Analysis
The UV-VIS spectral analysis of AMFE was conducted across a wavelength range of 200–1000 nm (Figure 1A). The analysis revealed the probability of the presence of different phytoconstituents based on their absorption peaks. Flavonoids and their derivatives exhibit distinct absorption peaks within the range of 200 and 400 nm, with prominent maxima occurring within the 230–285 nm and 300–350 nm ranges. Moreover, alkaloids, flavanols, flavonoids, and phenolic acids are detectable across a broader absorption spectrum, extending from 270 to 670 nm. These findings indicate the presence of a range of phytochemicals in AMFE.
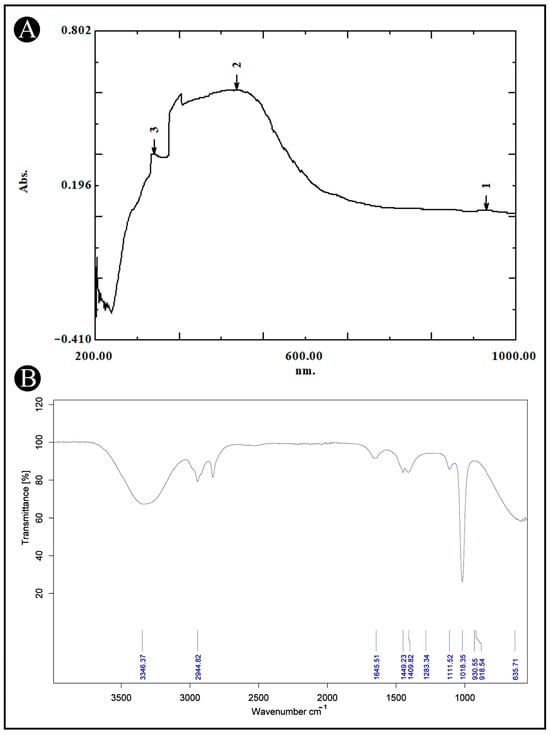
Figure 1.
UV-VIS and FT-IR analysis of AMFE. (A) The UV-VIS spectrum shows the absorption peaks of AMFE, indicating the presence of specific bioactive compounds within the extract. (B) The FT-IR spectrum displays characteristic functional groups present in AMFE.
2.3. FTIR Analysis
AMFE was analyzed using FTIR to determine its functional groups and chemical components. The FTIR spectra, shown in (Figure 1B), reveal bands within the range of 4000–500 cm−1. These bands correspond to various functional groups, including O-H, indicative of alcohols and phenols. The results confirm the presence of several functional groups such as, 635.71 cm−1 for C-I (haloalkane), 1018.35–1283.34 cm−1 for C-F (haloalkane), 1409.82–1449.23 cm−1 for C-O or C-F (alcohols, ethers, esters and haloalkane), 1645.51 cm−1 for C=O (saturated acid), 2944.82 cm−1 for C-H (aromatic), and 33,362.37 cm−1 for O-H (alcohol and phenols). These groups are characteristic of plant secondary metabolites.
2.4. LC-MS Analysis of AMFE
The LC-MS analysis of AMFE, as depicted in (Figure 2A,B), revealed multiple peaks corresponding to various phytochemical constituents. The comparison of these masses with the Mass Bank library confirmed the presence of different classes of compounds listed in (Table 1 and Table 2).
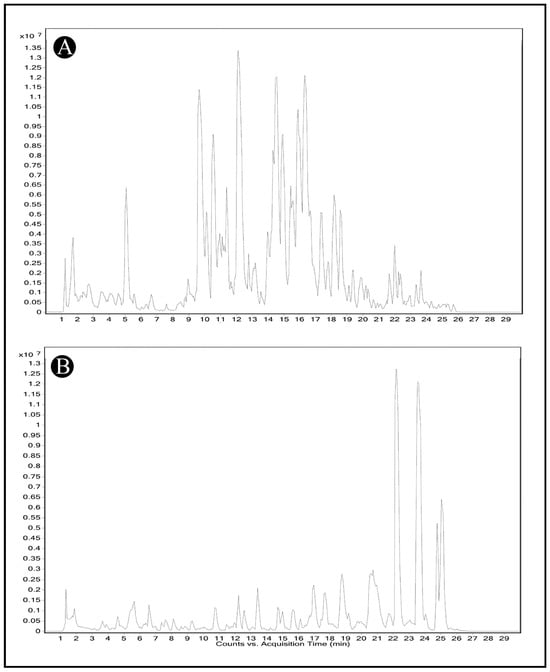
Figure 2.
Identification of phytochemical constituents from AMFE via HR-LCMS analysis. (A) Chromatogram obtained in positive mode of analysis. (B) Chromatogram obtained in negative mode of analysis.

Table 1.
List of compounds identified from AMFE in positive mode of analysis via HR-LCMS. The table includes the compound name, molecular formula, mass and mass-to-charge ratio (m/z) values, and respective retention time (RT).
Table 2.
List of compounds identified from AMFE in negative mode of analysis via HR-LCMS. The table includes the compound name, molecular formula, mass and mass-to-charge ratio (m/z) values, and respective retention time (RT).
2.5. Antioxidant Activity
Oxidative stress markers are recognized for their role in triggering neurodegeneration, resulting in cellular damage and death. To assess antioxidant activity, both the DPPH and FRAP assays were utilized. The DPPH assay detects free radicals by measuring absorbance at 515 nm, while the FRAP assay measures absorbance at 593 nm. A notable color change from deep violet to pale yellow in the DPPH assay indicates antioxidant activity, while the FRAP assay showed an increase in the Fe2+-TPTZ complex, suggesting effective electron donation by the extracts. The AMFE demonstrated concentration-dependent antioxidant activity. This activity was comparable to that of quercetin, a known antioxidant. The results indicate that AMFE is effective in scavenging free radicals and donating electrons, contributing to their potent antioxidant properties (Figure 3A,B).
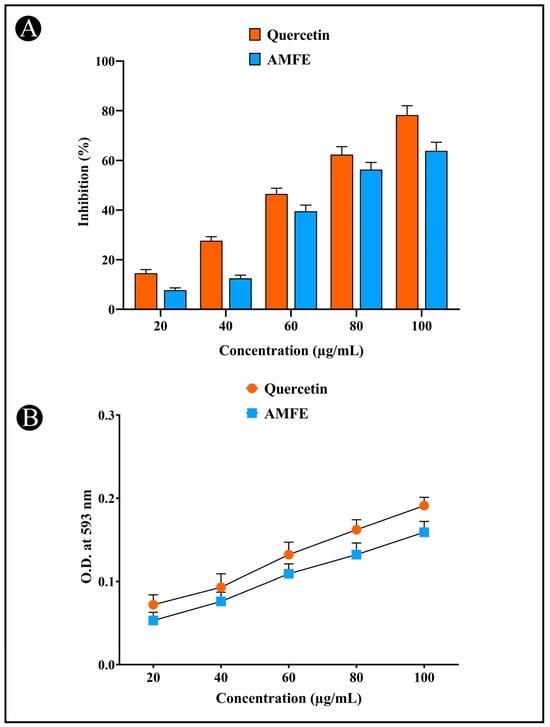
Figure 3.
Determination of antioxidant potential of AMFE. (A) DPPH (2,2-diphenyl-1-picrylhydrazyl) radical scavenging activity. (B) Ferric reducing antioxidant power (FRAP) assay.
2.6. Inhibition of Acetylcholinesterase (AChE) and the Potential for Thioflavin T (ThT) Binding
The AChE inhibitory activity of AMFE is illustrated in (Figure 4A). The concentration-dependent inhibition (20, 40, 60, 80, 100, and 120 μg/mL) of AChE by AMFE was demonstrated. A number of phytochemicals, including phenolic and flavonoid compounds, have been shown to have neuroprotective properties as they are found to inhibit AChE activity, which represents an effective strategy for treating AD. The neuroprotective potential of AMFE was further evaluated using the ThT fluorescence assay (Figure 4B). The results demonstrate that AMFE inhibited the binding of ThT to amyloid, indicating its effectiveness in preventing amyloid-β aggregation.
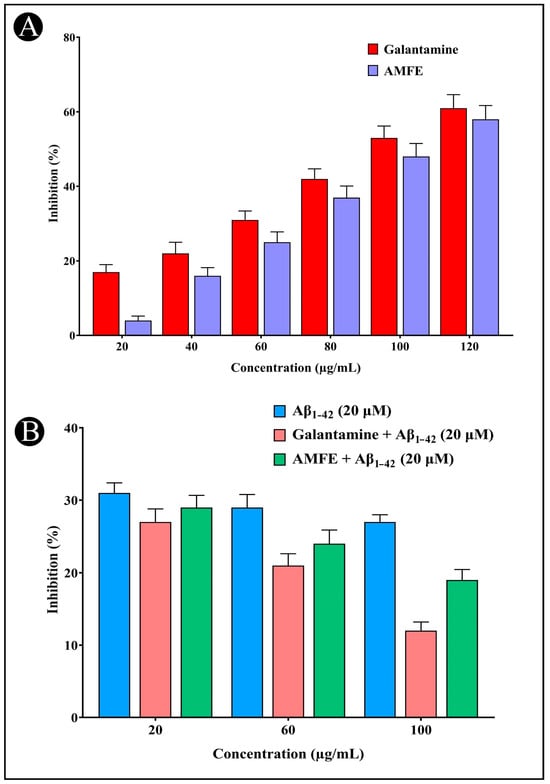
Figure 4.
Assessment of AChE inhibition and amyloid aggregation using the Thioflavin-T assay. (A) AChE inhibition activity of different concentrations of AMFE and positive control (galantamine). (B) Results of the Thioflavin-T assay activity of Aβ1–42, different concentrations of AMFE and positive control (galantamine).
2.7. MTT Assay and Cell Viability
When various concentrations of AMFE (15.62, 31.25, 62.5, 125, 250 and 500 μg/mL) were evaluated for their cytotoxicity against SH-SY5Y cells, no significant changes were observed in cell viability or cell morphology. Even at very high concentrations (500 μg/mL), only a slight reduction in cell viability was noted, indicating that AMFE exhibits minimal cytotoxicity towards SH-SY5Y cells (Figure 5A–F and Figure 6A). Treatment with Aβ1–42 at varying concentrations (1.25, 2.5, 5, 10 and 20 μM) exhibited different levels of cytotoxicity on SH-SY5Y cells. The IC50 concentration of Aβ1–42 for SH-SY5Y cells was found to be 18.54 µM. Specifically, Aβ1–42 at 20 μM caused significant cytotoxicity, leading to changes such as cell loss, shrinkage, and altered cell morphology, as observed through microscopic examination (Figure 6B and Figure 7A–F). Whereas, as a result of exposure to Aβ1–42 in SHSY-5Y cells (10 μM and 20 μM) with different concentrations of AMFE (15.62, 31.25, 62.5 μg/mL) for 24 h, the MTT assay was used to assess cell survival. Groups exposed to amyloid beta demonstrated that the viability of cells was significantly reduced, with toxicity escalating in a dose-dependent way. However, the administration of different concentrations of AMFE in conjugation with Aβ1–42 (10 and 20 μM) for 24 h markedly enhanced cell viability compared to the groups treated solely with Aβ1–42 (10 and 20 μM), thereby confirming its neuroprotective properties (Figure 8A–I).
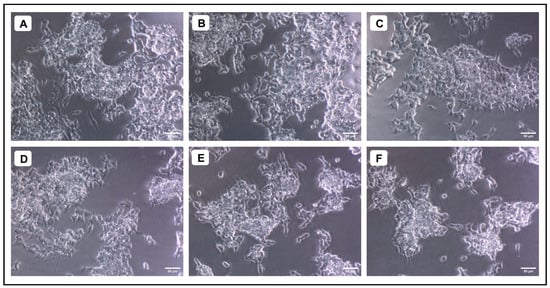
Figure 5.
Evaluation of the cytotoxicity of different concentrations of A. marmelos fruit extract against SH-SY5Y cells; (A) 15.625 (µg/mL), (B) 31.25 (µg/mL), (C) 62.5 (µg/mL), (D) 125 (µg/mL), (E) 250 (µg/mL), and (F) 500 (µg/mL).
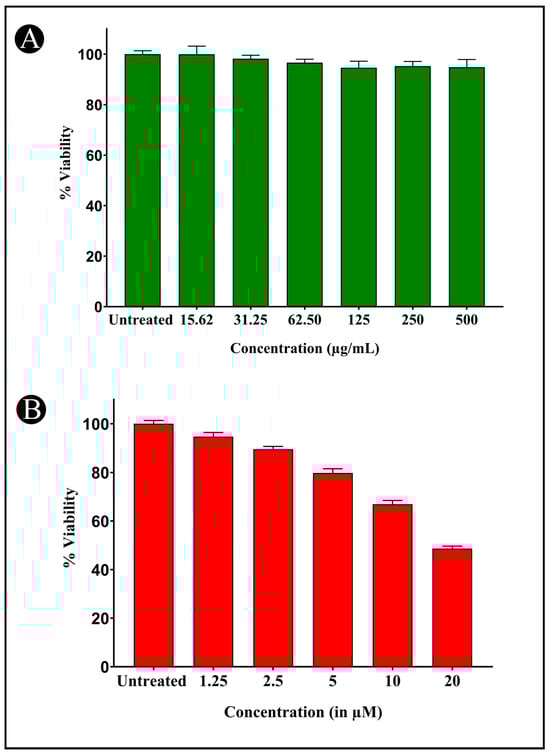
Figure 6.
Cytotoxicity assessment of AMFE and Aβ1-42 against SH-SY5Y cells using the MTT assay. (A) Cell viability (%) of SH-SY5Y cells exposed to various concentrations of AMFE for 24 h. (B) Cell viability (%) of SH-SY5Y cells exposed to different concentrations of Aβ1–42 for 24 h.
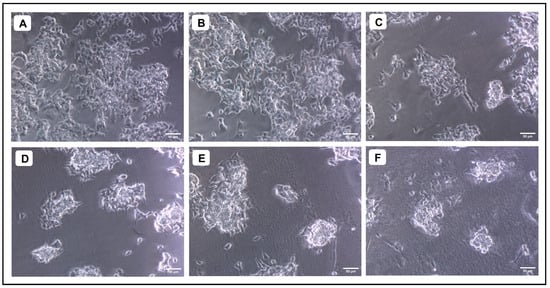
Figure 7.
Evaluation of the cytotoxicity of different concentrations of Aβ1–42 against SH-SY5Y cells. (A) Untreated, (B) 1.25 µM, (C) 2.5 µM, (D) 5 µM (E) 10 µM, (F) 20 µM.
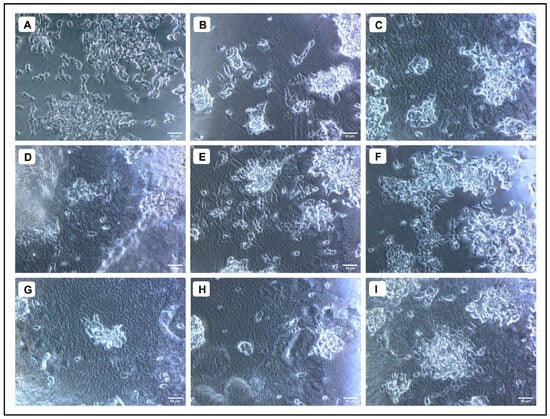
Figure 8.
Neuroprotective effect of AMFE against Aβ1–42-induced cytotoxicity in SH-SY5Y cells. (A) Untreated cells, (B) Aβ1–42 (10 µM), (C) Aβ1–42 (20 µM), (D) Aβ1–42 (10 µM) + AMFE (15.62 µg/mL) (E) Aβ1–42 (10 µM) + AMFE (31.25 µg/mL), (F) Aβ1–42 (10 µM) + AMFE (62.50 µg/mL), (G) Aβ1–42 (20 µM) + AMFE (15.62 µg/mL), (H) Aβ1–42 (20 µM) + AMFE (31.25 µg/mL), (I) Aβ1–42 (20 µM) + AMFE (62.50 µg/mL).
2.8. Effect of AMFE on ROS Production
It is widely recognized that oxidative stress induced by Aβ plays a pivotal role in the progression of AD. Oxidative stress not only stimulates the generation of amyloid-β but also exacerbates the pathology. In the present study, ROS generation was measured via H2DCFDA staining, which fluoresces upon reacting with ROS. SH-SY5Y cells were exposed to 20 μM Aβ1–42, both with and without AMFE, for 24 h. The findings demonstrated a substantial reduction in ROS levels in the groups treated with Aβ1–42 (20 μM) combined with AMFE at concentrations of 62.5 μg/mL. The obtained results suggest that AMFE effectively prevented Aβ1–42-induced ROS production, as demonstrated by the remarkable reduction in ROS levels in the treated groups (Figure 9A–D). These results were obtained using flow cytometry, where an increase in cellular ROS generation corresponded with an increase in H2DCFDA fluorescence intensity. The AMFE inhibited Aβ1–42 (20 μM) derived toxicity, as detected via a reduction in fluorescent intensity, underscoring the potential of AMFE in suppressing ROS production.
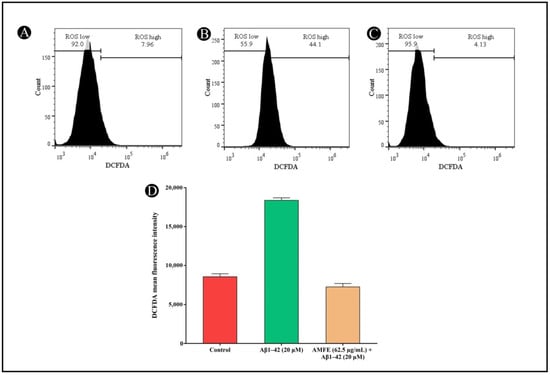
Figure 9.
Measurement of intracellular ROS levels in SH-SY5Y cells using H2DCFDA dye via flow cytometry. (A) Untreated cells showing baseline ROS levels. (B) SH-SY5Y cells treated with Aβ1–42 (20 µM) showing elevated ROS levels. (C) SH-SY5Y cells pre-treated with AMFE (62.50 µg/mL) followed by Aβ1–42 (20 µM), showing reduced ROS levels. (D) Quantitative analysis of H2DCFDA fluorescence intensity for each treatment group, indicating the effects of AMFE on reducing ROS generation induced by Aβ1–42.
2.9. Effects of AMFE on MMP
The MMP (Δψ) in SH-SY5Y cells was analyzed via the JC-1 dye after pre-treatment with AMFE, followed by Aβ1–42 (20 μM) exposure. Cells pre-treated with AMFE (62.5 μg/mL) displayed a substantial rise in healthy cells exhibiting a high mitochondrial membrane potential (Δψ), compared to the group treated solely with β-Amyloid. Within Aβ1–42-treated cells, a notable increase in cells with depolarized Δψ was observed, indicating mitochondrial dysfunction. This depolarization was evidenced by a reduction in JC-1 red fluorescence, corresponding to a reduction in healthy mitochondrial activity. A significant reduction within the mean fluorescence intensity (MFI) of red fluorescence was noted, along with an increased population of cells in the apoptotic gate, indicating low red fluorescence and higher mitochondrial depolarization. In contrast, AMFE pre-treated cells demonstrated a restoration of MMP, reflected by an enhancement in red fluorescence. JC-1 green fluorescence (indicative of depolarized mitochondria) was collected using the FL1 detector (525 nm bandpass filter), while JC-1 red fluorescence (indicative of polarized mitochondria) was collected using the FL3 detector (620 nm bandpass filter). These results suggest that AMFE pre-treatment mitigates mitochondrial depolarization induced by Aβ1–42, enhancing cell survival and maintaining mitochondrial function (Figure 10A–D).
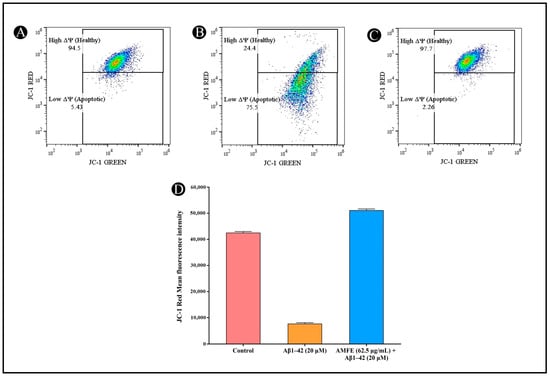
Figure 10.
Measurement of mitochondrial membrane potential (Δψ) in SH-SY5Y cells using JC-1 staining and flow cytometry. (A) Untreated cells showing intact mitochondrial membrane potential. (B) SH-SY5Y cells treated with Aβ1–42 (20 µM), showing depolarized mitochondrial membrane potential. (C) SH-SY5Y cells pre-treated with AMFE (62.50 µg/mL) followed by Aβ1–42 (20 µM), showing partial restoration of mitochondrial membrane potential. (D) Quantitative analysis of JC-1 red fluorescence intensity, representing mitochondrial membrane integrity for each treatment group.
2.10. Impact of AMFE on Expression of AD-Related Genes
The mRNA expression levels of several key genes (ACHE, APOE, GSK3β, and MAPT) associated with AD were examined to assess the neuroprotective effects of AMFE. Figure 11 shows that SH-SY5Y cells treated with Aβ1–42 showed an upregulation in the mRNA expression of the ACHE, GSK3β, and MAPT genes (which encode the microtubule-associated protein tau) and a decrease in the APOE, relative to the untreated control group. Pre-treating the cells with 62.5 µg/mL of AMFE for 30 min effectively inhibited the overexpression of ACHE, GSK3β, and MAPT genes and enhanced the expression of APOE gene. The MAPT gene is responsible for producing tau protein, which, when hyperphosphorylated, becomes the primary component of neurofibrillary tangles, structures implicated in the advancement of AD. The hyperphosphorylation of tau is recognized as a key aspect in Aβ-induced neurodegeneration. In this study, it was found that AMFE could provide neuroprotection to SH-SY5Y cells by preventing overexpression of MAPT, potentially reducing the development of neurofibrillary tangles that contribute to oxidative stress, cell damage, and subsequent neurodegeneration. Further research, such as proteomic analyses, are required to validate these results.
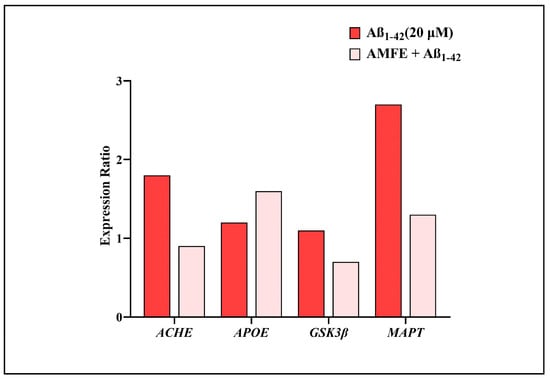
Figure 11.
Impact of AMFE on the mRNA expression of genes associated with AD. mRNA levels were quantified using RT-qPCR, with results presented as expression ratios normalized to reference genes.
3. Discussion
A primary contributing factor to dementia, AD presents with the following characteristics, such as a progressive deterioration of cognitive functions, memory impairment, and neuropathological traits, including the build-up of Aβ-plaques, neurofibrillary tangles, synaptic dysfunction, and neuronal degeneration [31]. The accretion of Aβ plaques is crucial in triggering a series of neurotoxic actions that eventually result in neuronal degeneration in the brain [32]. One of the primary pathways through which Aβ exerts its neurotoxicity is by inducing oxidative stress and the impairment of mitochondrial function, which in turn result in neuronal death and cognitive deficits [33]. Additionally, cholinergic dysfunction, marked by increased acetylcholinesterase (AChE) activity, contributes significantly to the memory loss observed in AD patients [34]. Given the multifaceted pathogenesis of AD, targeting multiple pathways involved in Aβ-induced neurotoxicity may present an effective treatment strategy. In the present study, to induce neurotoxicity in the SH-SY5Y neuroblastoma cells, 10 and 20 µM concentrations of Aβ1–42 were utilized. This selection was based on a thorough review of the existing literature, which has shown these concentrations to effectively model Aβ1–42 toxicity in this cell line. These concentrations are frequently employed to induce significant, yet sub-lethal, neuronal damage, mimicking the early stages of amyloid plaque formation in AD [35,36]. Specifically, numerous studies have demonstrated that within this range, Aβ1–42 induces measurable reductions in cell viability, increases in oxidative stress, and disruptions in mitochondrial function, consistent with the pathological hallmarks of AD. Furthermore, these concentrations allow for the observation of the dose-dependent effects of potential neuroprotective agents, facilitating a clear assessment of their efficacy [37,38]. This range was opted for in the present study rather than lower concentrations because while lower concentrations may be more physiologically relevant to the very early stages of AD, they often do not produce a strong and quantifiable level of cellular stress in the in vitro model, which is necessary to properly evaluate the effect of a neuroprotective substance. As part of the current investigation, the neuroprotective potential of AMFE (15.62 to 500 µg/mL) was evaluated towards Aβ1–42 cytotoxicity in SH-SY5Y cells, focusing on AChE inhibition, ROS generation, and MMP disruption. The AMFE dose range was determined through a preliminary series of experiments to establish a non-toxic concentration range for SH-SY5Y cells. A broader range of concentrations were initially tested, which resulted in those concentrations above 500 µg/mL exhibiting significant cytotoxicity towards SH-SY5Y cells. Therefore, a concentration of 15.62 to 500 µg/mL was used to ensure that the observed neuroprotective effects were not confounded by inherent toxicity. This range also aligns with a previous study investigating the neuroprotective potential of AMFE against Aβ toxicity in a transgenic Caenorhabditis elegans [30]. The results of the current study reveal that AMFE exerts significant neuroprotective effects, indicating its promise in AD treatment options.
The cholinergic system is vital for learning and memory, and its impairment is among the initial indicators of AD [34]. Acetylcholinesterase (AChE) is an enzyme that is responsible for converting acetylcholine into a neurotransmitter necessary for cognition. Elevated AChE activity leads to reduced acetylcholine levels, contributing to the cognitive deficits characteristic of AD [39]. Current pharmacological therapies for AD include medications like donepezil and rivastigmine and aim to inhibit AChE activity, thereby increasing acetylcholine availability and improving cognitive function. However, these treatments only offer symptomatic relief and are associated with various side effects, highlighting the need for safer and more effective alternatives [40,41]. In this study, we demonstrated that AMFE significantly inhibits AChE activity in SH-SY5Y cells. This finding is particularly important because it suggests that AMFE has the potential to enhance cholinergic neurotransmission by preserving acetylcholine levels in the brain. Moreover, the natural origin of A. marmelos fruits could offer a safer alternative to synthetic AChE inhibitors, with fewer side effects. The AChE inhibitory activity observed in the current study aligns with published studies on the neuroprotective potential of plant-derived compounds, particularly those rich in phenolic and flavonoid content [27,40,42]. There have been many studies highlighting the importance of plant-based antioxidants in modulating cholinergic function and protecting neurons from Aβ-induced toxicity [43,44,45]. The ability of AMFE to inhibit AChE activity underscores its promise, presenting it as a therapeutic approach for AD by addressing cholinergic dysfunction.
It is well known that oxidative stress plays a crucial role in the development of AD. Numerous studies have demonstrated that the Aβ peptide facilitates the production of ROS, resulting in oxidative harm to lipids, proteins, and DNA [13,46,47]. Activated ROS induce cellular damage by being highly reactive molecules. They are thought to contribute to the progression of various neurodegenerative diseases, including AD [13]. The brain exhibits a specific susceptibility to oxidative stress because of its abundance of lipids and high oxygen consumption. The increase in ROS disrupts neuronal homeostasis, resulting in mitochondrial dysfunction, activation of apoptotic pathways, and, ultimately, neuronal death [48,49]. In the current study, exposure to Aβ1–42 in SH-SY5Y cells resulted in a marked elevation of ROS levels, confirming the oxidative stress-inducing potential of Aβ. However, co-treatment with AMFE significantly reduced ROS levels in the cells, indicating its potent antioxidant activity. The antioxidant properties of A. marmelos can be ascribed to the abundance of phytoconstituents, including flavonoids and phenolic compounds, that are known to effectively neutralize free radicals and alleviate oxidative stress in a variety of models [23]. Previous studies have reported that plant-based antioxidants can effectively reduce ROS production and protect neurons from Aβ-induced oxidative damage [50,51]. The reduction in ROS levels observed in this study suggests that AMFE may act by neutralizing free radicals and preventing oxidative damage, thereby protecting neurons from Aβ-induced cytotoxicity. The capacity to diminish oxidative stress is crucial for neuroprotection, given that oxidative damage is a major factor in the neurodegenerative processes detected in AD [50,52,53]. Thus, the antioxidant activity of AMFE further supports the possibility of using it as a therapy for AD.
Cellular energy is generated by mitochondria, which are essential in contributing to neuronal function and health. However, mitochondria are also a major target of oxidative stress and their dysfunction is closely linked to neurodegenerative diseases, including AD [54,55]. A key early indicator of mitochondrial dysfunction in AD is the reduction in MMP, which is essential for sustaining mitochondrial activity and ATP synthesis. The loss of MMP leads towards the activation and release of pro-apoptotic factors, activation of caspases, and, ultimately, neuronal apoptosis [56]. In the current investigation, treatment through Aβ1–42 resulted in a notable decrease in MMP in SH-SY5Y cells, suggesting mitochondrial dysfunction. However, co-treatment with AMFE effectively restored MMP, suggesting that the extract mitigates mitochondrial damage and preserves mitochondrial function. The restoration of MMP is indicative of the protective effects of AMFE on mitochondrial integrity, which is necessary to maintain cellular energy metabolism and prevent apoptosis. The ability of AMFE to restore MMP may be linked to its antioxidant properties, as oxidative stress is a major contributor to mitochondrial dysfunction [13,46]. By reducing ROS levels, AMFE may protect mitochondria from oxidative damage, thereby preserving MMP and preventing the activation of apoptotic pathways. Several studies have reported similar findings, where plant-derived compounds were able to restore MMP and protect neurons from Aβ-induced mitochondrial dysfunction [57,58].
Furthermore, the neuroprotective potential of AMFE was further confirmed by analyzing the mRNA expression of ACHE, APOE, GSK3β, and MAPT genes linked to AD. The obtained results show that SH-SY5Y cells exposed to Aβ1–42 exhibited elevated mRNA levels in contrast to the control group. Notably, pre-treatment with AMFE at a very low concentration significantly suppressed the overexpression of these genes. The MAPT gene, which encodes the tau protein, is crucial in the progression of AD, as hyperphosphorylated tau forms the core of neurofibrillary tangles [59]. These tangles are closely associated with Aβ-induced neurodegeneration [60]. The results suggest that AMFE exerts a neuroprotective effect by mitigating the overexpression of MAPT, thereby potentially limiting the development of neurofibrillary tangles, oxidative stress, and subsequent neuronal damage. However, additional studies, such as proteomic analyses, are necessary to further corroborate these findings.
Overall, the neuroprotective potential of AMFE demonstrated in this study is multifaceted, primarily driven by the presence of flavonoids, phenols, and other bioactive compounds targeting several key pathways involved in Aβ-induced neurotoxicity. The ability to inhibit AChE activity suggests that AMFE may enhance cholinergic neurotransmission and improve cognitive function in AD. AChE inhibition prolongs the availability of acetylcholine at the synapses, which is essential for maintaining cognitive function in AD. Furthermore, AChE has been implicated in promoting Aβ aggregation and plaque formation [61]. By inhibiting AChE activity, AMFE not only supports cholinergic function but also indirectly reduces the aggregation of amyloid fibrils, further contributing to neuroprotection. The results of the ThT binding assay confirm that AMFE prevents Aβ aggregation, indicating its ability to interfere with the amyloidogenic cascade and reduce the formation of toxic oligomers and fibrils, which are known to trigger neurodegenerative processes in AD [62,63]. Apart from this, one of the key mechanisms involves the strong antioxidant activity of AMFE, which effectively neutralizes the excessive ROS generated due to Aβ1–42 toxicity [64]. Elevated ROS levels lead to oxidative stress, lipid peroxidation, and mitochondrial dysfunction, culminating in neuronal apoptosis [65,66,67]. By scavenging ROS and reducing oxidative stress, AMFE prevents mitochondrial damage and preserves cellular homeostasis, which is reflected in the restoration of MMP in Aβ1–42-treated cells. This mitochondrial protection is likely mediated by the inhibition of mitochondrial permeability transition pore opening, preventing the release of pro-apoptotic factors and maintaining cellular energy production [68,69]. This preservation of mitochondrial integrity protects against caspase activation and subsequent apoptosis, contributing to improved cell viability observed in co-treated cells. The ability of AMFE to significantly improve cell viability under Aβ-induced cytotoxicity conditions determines its potential as a potent neuroprotective agent. There is consistency between these findings and previous research on the neuroprotective effects of plant-derived compounds, particularly those rich in antioxidants [42,51,70]. Research has been conducted extensively on the potential of natural products to prevent or treat neurodegenerative diseases, and many plant-based compounds have shown promise in protecting neurons from Aβ-induced toxicity [18,71]. AMFE, with its diverse range of bioactive compounds, contributes towards the increasing research findings that supports the utilization of natural antioxidants as potential therapeutics for AD. Moreover, it is noteworthy that dysfunctions in both neurons and oligodendrocytes contribute to the progression of several neurodegenerative diseases [72]. Given the multifaceted neuroprotective effects of AMFE, future investigations should explore its potential impact on oligodendrocyte function and myelination, which may further enhance its therapeutic relevance in neurodegenerative disorders.
Although the findings of this study are encouraging, additional research is necessary to thoroughly clarify the mechanisms that contribute to the protective effects on the neuronal health of AMFE. Future studies should concentrate on identifying the exact bioactive molecules that account for the observed effects and identifying their exact molecular targets. Furthermore, animal studies and clinical trials are essential to evaluate the safety, efficacy, and pharmacokinetics of AMFE in humans. The development of natural substances as treatment options for AD holds significant potential, as they offer a safer alternative to synthetic drugs and may provide a more comprehensive approach to targeting the complex nature of the condition. AMFE stands out as a promising option for further advancement, and its neuroprotective properties warrant continued investigation.
4. Materials and Methods
4.1. Collection and Extract Preparation
The plant material was sourced from the local market. Further, 50 g of fruit powder and 500 mL of 85% ethanol were combined to yield AMFE, which was then continuously shaken at 110 rpm for 48 h at 37 °C. The ethanol phase was filtered using Whatman No. 1 filter paper, and the filtrate was then concentrated using a rotary evaporator (Rotavapor® R-300, Büchi Labortechnik AG, Flawil, Switzerland) to yield a dry residue. The dried extract was kept in brown bottles at room temperature to ensure its reliability and safety [73].
4.2. Screening for Phytochemicals
The AMFE was subjected to a phytochemical screening to identify various compounds, including flavonoids, saponins, terpenoids, alkaloids, phenolic compounds, and others. The screening was conducted following the method previously described by Pratap and Shantaram (2022) [74].
4.3. UV-VIS and FTIR Analysis
The functional groups present in AMFE were identified using UV-VIS analysis (UV-2600, Shimadzu, Kyoto, Japan) and FTIR analysis (Bruker®, Billerica, MA, USA). A wavelength between 200 and 1000 nm was scanned at a resolution of 1 nm for UV-VIS analysis, whereas in FTIR, spectra were scanned within the 4000–500 cm−1 range with 32 scans and a resolution of 4 cm−1. A comparison of the intensity bands resulting from the analysis was then carried out with standard reference values to identify the functional groups [74].
4.4. Estimation of Total Flavonoids
The assay was carried out using a colorimetric method to determine the total flavonoid content in the AMFE, as mentioned by Sugimoto et al. (2000) [75]. To prepare the solution, 200 µL of AMFE (1 mg/mL) and 0.5 mL of 2% AlCl3 solution were combined in a clean test tube. Incubation was enabled at 37 °C for 1 h before absorbance at 510 nm was taken. For the analysis of total flavonoids, quercetin (1 mg/g) was used as a standard.
4.5. Estimation of Total Phenolics
The total phenolic content was assessed with minor modifications, according to the method outlined by Johari and Khong (2019) [76]. A test tube was filled with 100 µL of AMFE and 500 µL of Folin–Ciocalteu reagent, which were mixed together and diluted with 6 mL of D/W. After the mixture had been mixed, it was left at 37 °C for 5 min. After that, 1.5 mL of 20% sodium carbonate (Na2CO3) was mixed in the tubes and the contents were gently shaken to ensure that the contents had been mixed well. After 90 min of mixing, the absorbance at 725 nm was measured using an ultraviolet-visible spectrophotometer. The standard reference was gallic acid, on the basis of which a calibration curve was prepared.
4.6. LC-MS Analysis
To analyze the phytochemical composition of AMFE, the HR-LCMS1290 Infinity UHPLC System with a PDA detector (Agilent Technologies, Santa Clara, CA, USA) was used. The system included a column compartment, quadrupole Time-of-Flight Mass Spectrometer (Q-TOF MS) with Agilent Jet Stream Electrospray ions, HiP sampler, and a binary gradient solvent pump. In the SB-C18 column (2.1 × 50 mm, 1.8 µm particle size), separation was performed. At a flow rate of 0.350 mL/min, 1% formic acid in deionized water (solvent A) and acetonitrile (solvent B) served as the mobile phase. Compound identification was based on the fragmentation patterns and mass spectra obtained from Q-TOF MS. Phytochemical constituents were identified using databases such as Compound Discoverer 2.1, ChemSpider, and PubChem [77].
4.7. Antioxidant Assay
4.7.1. DPPH Assay
Antiradical activity was evaluated using a DPPH assay, following the procedure outlined via Brand-Williams et al. (1999) [78]. To prepare a fresh DPPH solution, 7.8 mg of DPPH was added in (20 mL) and freshly used. The assay involved mixing 1 mL of 0.1 mM DPPH with 100 μL of AMFE at varying solutions (20–100 μg/mL). After incubating for 15 min in a dark condition, the absorbance was measured at 517 nm. As a standard, quercetin was used and the percentage inhibition was calculated using the following formula.
Inhibition of DPPH radical (%) = Ab − As/Ab × 100
4.7.2. FRAP (Ferric-Reducing Antioxidant Power) Assay
According to Benzie and Strain (1996) [79], the antioxidant capacity of AMFE was further assessed via the FRAP assay. The assay mixture was created by mixing 30 mM ferric chloride hexahydrate (FeCl3·6H2O), 10 mM TPTZ (2,4,6-tripyridyl-s-triazine), and 150 mM acetate buffer (pH—3.6) in 40 mM hydrochloric acid at a ratio of 10:1:1 at room temperature. Then, 3.95 mL of freshly made FRAP reagent was added to this combination along with 5 μL of various concentrations (20–100 μg/mL). After that, a 30 min room-temperature incubation period was observed. A blue-colored ferrous TPTZ complex was developed during this period as a result of ferric ions being reduced to ferrous ions in the presence of AMFE. Lastly, at 593 nm, the solution’s absorbance was measured.
4.8. AChE Inhibition
The AChE inhibition activity was assessed via the Ellman spectrophotometric method [80]. In the test, 3 mL of 0.1 M Tris-HCl buffer (pH 8.0) was mixed with 20 μL of AChE solution (3 U/mL). After adding 100 μL of AMFE at different doses (20–100 μg/mL) to this mixture, it was incubated for 15 min at room temperature. This was followed by the addition of 50 μL of 3 mM DTNB. The reaction was started by adding 50 μL of 15 mM acetylthiocholine iodide (AChI) as soon as a yellow color appeared. As a positive control, galantamine (1 mg/mL) was used. The solution’s absorbance was determined at 412 nm using a UV-visible spectrophotometer (UV-2600, Shimadzu, Japan). Based on a comparison of enzyme activity with a negative control, the following equation was used to calculate the percentage inhibition.
Inhibition (%) = A0 − A1 × 100
4.9. Thioflavin T (ThT) Assay
This method is widely employed to assess the rate of fibrillogenesis associated with amyloid development. ThT emits fluorescence upon binding to amyloid fibrils, making it an effective tool for monitoring in vitro amyloid fibril aggregation [81]. In this study, different concentrations of AMFE were combined with 20 μM of Aβ1–42 in a volume of 40 μL and incubated at 37 °C for 24 h. Afterwards, 100 μL of ThT solution was added to the mixture. As part of the analysis, the fluorescence intensities of the samples were measured using a FP-6200 spectrofluorometer (Shimadzu, RF-5000). Measurements were taken following a 30 min incubation with the excitation and emission wavelengths set at 450 nm and 483 nm, respectively. A positive control consisting of galantamine in combination with Aβ1–42 was included for comparison.
4.10. Neuroprotective Effects of the AMFE
4.10.1. Preparation of AMFE Stock Solution
Stock solutions of the test samples were prepared in culture media at 1000 µg/mL and filtered through a 0.2-micron PES membrane syringe filter. In different wells, different concentrations of this solution were added to attain a 15.625–500 µg/mL concentration.
4.10.2. Aβ1–42 Stock Solution and Working Solution
The Aβ1–42 was dissolved in D/W to a concentration of 1 mM. Treatments were conducted using a working solution of 100 μM in cell culture medium containing 10% FBS. After adding this solution to each well, a final concentration of 0.625–20 µM was achieved.
4.10.3. Cell Culture
Using human SH-SY5Y neuroblastoma cells from the National Center for Cell Science in Pune, India, these studies were conducted. The DMEM medium containing non-essential amino acids (1X NEAA) and 10% Fetal Bovine Serum (FBS) was used for the growth of cells in a 5% CO2 condition at 37 °C. When the cells reached 80% confluence, experiments were conducted.
4.10.4. Assessment of Cell Viability
Cell viability was evaluated via a modified MTT assay, as previously detailed [75], with all experiments conducted in triplicate. Cells grown in T-25 flasks were harvested by trypsinization and transferred into a 5 mL centrifuge tube. The cell pellet was collected by centrifuging at 300× g, and the resulting cells were resuspended in DMEM-HG medium. The cell concentration was adjusted to ensure that 200 μL of the suspension contained approximately 15,000 cells. A suspension of cells (200 μL per well) was placed into a 96-well microtiter plate and incubated at 37 °C in a humidified environment with 5% CO2 for 24 h. Following this incubation, the medium was gently removed and 200 μL of varying concentrations of AMFE was added to the designated wells. After that, the plate was put back in the incubator for a further 24 h period under the same settings. Following the second incubation, the medium was delicately removed, and 200 μL of new medium containing 10% MTT reagent was added to each well, resulting in a final MTT concentration of 0.5 mg/mL. The plate was incubated at 37 °C with 5% CO2 for three hours. The media was once more removed following incubation, leaving the MTT crystals undisturbed. Each well was added with the 100 μL of DMSO to dissolve the formazan crystals, and the plate was then well mixed by placing it on a gyratory shaker. Using a microplate reader, absorbance at 570 and 630 nm was measured to determine the viability of the cells. Background absorbance was subtracted and the percentage of growth inhibition was calculated. The IC50 value, indicating the concentration of the test compound required to reduce cell growth by 50%, was determined from the dose–response curve for the cell line.
4.10.5. Assessment of Cytoprotective Activity
The protective effect of AMFE against Aβ1–42-induced toxicity was evaluated via the MTT assay, as previously outlined [82]. Cells were seeded into a 96-well plate and incubated for 24 h under the previously mentioned conditions. After this period, the medium was carefully aspirated from the wells. A volume of 100 μL of varying concentrations of AMFE was then added to the designated wells and incubated at 37 °C in a 5% CO2 atmosphere for 4 h. After this treatment, 100 μL of 10 μM and 20 μM β-Amyloid (prepared as a 2X solution) was supplemented to the respective wells, and the plate was incubated again under the same conditions for a period of 48 h. The media was taken out of each well after the incubation was finished, and 200 μL of new medium containing 10% MTT reagent was added, bringing the final MTT concentration to 0.5 mg/mL. The plate was incubated in 5% CO2 for three hours at 37 °C. The media was cautiously extracted after incubation, preserving the MTT crystals. In order to completely dissolve the formazan crystals, 100 μL of DMSO was added to each well, and the plate was gently shaken on a gyratory shaker. The absorbance was determined with a microplate reader at 570 and 630 nm.
4.10.6. Mitochondrial Membrane Potential (ΔCm) Assay
First, cells were plated into 6-well plates at a density of 3 × 10⁵ cells per 2 mL. They were then left to adhere overnight at 37 °C in a CO2 incubator. The cells were cultured for a further 4 h after the culture medium was replaced with 2 mL of media containing 62.5 µg/mL of AMFE after 24 h. After that, the cells were exposed to 20 μM of Aβ1–42 and incubated for an additional 96 h. At room temperature, the cells were collected after the treatment by centrifuging them at 300× g for 5 min. After discarding the supernatant, the pellet underwent two PBS washes. After that, the cell pellet was again suspended in 0.5 mL of the freshly produced JC-1 working solution. To ensure uniform suspension, the cells were gently mixed using a pipette. After incubation in JC-1 solution for 10–15 min at 37 °C in a CO2 incubator, the cells were washed with 1X assay buffer, resuspended and immediately subjected to flow cytometric analysis [83,84].
4.10.7. ROS Estimation by H2DCFDA Staining
At a density of 3 × 10⁵ cells per 2 mL, cells were plated in 6-well plates and incubated for 24 h at 37 °C in a CO2 incubator. The cells were treated with 62.5 µg/mL of AMFE in 2 mL of fresh culture media for 4 h after this initial incubation. After that, the cells were cultured for an extra 96 h at a concentration of 20 μM Aβ1–42. After the incubation period ended, each well was provided with 5 μL of 10 μM H2DCFDA, and the plate was incubated for 1 h at 37 °C. Following the incubation period, the cells were separated by trypsinization and gathered into 5 mL tubes in preparation for flow cytometric examination. The cells were pelleted by centrifugation at 300× g for 5 min at room temperature, the supernatant was removed, and the cells were washed twice with PBS. The final cell pellet was resuspended in 500 μL of pre-warmed DPBS and flow cytometry analysis was conducted with an excitation wavelength of 488 nm and detection at 525 nm (FL1) [85,86].
4.10.8. Quantification of mRNA Using RT-qPCR
Cells were seeded and treated in 6-well plates as per the previously described method. Total RNA extraction was carried out using the Tri-Pure Isolation Reagent (Sigma-Aldrich®, Bangalore, India), according to the manufacturer’s protocol. RNA purity and concentration were measured using a NanoDrop Lite spectrophotometer (Thermo Scientific, Waltham, MA, USA), while RNA quality and integrity were assessed through denaturing agarose gel electrophoresis. Reverse transcription was performed with the RT First Strand Synthesis Kit (Qiagen, Valencia, CA, USA). The quantification of gene expression was achieved using SYBR Green-based quantitative real-time PCR (qRT-PCR) on the Applied Biosystems® 7500 Fast Real-Time PCR system (Foster City, CA, USA). The qPCR procedure included an initial 2 min incubation at 50 °C, followed by denaturation at 95 °C for 5 min, and then 45 amplification cycles (20 s at 95 °C, 30 s at 60 °C, and 20 s at 72 °C). After amplification, a melt curve analysis was performed to confirm specificity, with the temperature increased from 50 °C to 98 °C, holding for 5 s at each 0.5 °C step. The reaction efficiency was evaluated using Lin-RegPCR software [87,88]. GAPDH served as the reference gene and the target genes analyzed included ACHE, APOE, GSK3β, and MAPT.
5. Conclusions
In conclusion, the present study demonstrates that AMFE exhibits significant neuroprotective potential towards the toxicity produced by Aβ1–42 in SH-SY5Y cells. Its capacity to block AChE activity, reduce ROS production, and restore MMP suggests that AMFE targets multiple pathways involved in AD pathogenesis. These results highlight the promise of AMFE as a natural treatment option for AD, warranting further validation through in vivo studies. Future research should focus on the determination of AMFE efficacy using relevant animal models, such as transgenic mice expressing human amyloid precursor protein and presenilin 1 mutations, to check its impact on AD-related neuropathology and cognitive decline. Other important parameters including optimal dosages, administration routes, and long-term effects should be determined to ensure translational relevance. Moreover, well-designed clinical trials are also essential to check the safety and efficacy of AMFE in AD patients, incorporating comprehensive evaluations of cognitive function, AD biomarkers, and the quality of life. Investigating the potential synergistic effects of AMFE with existing AD therapies, such as cholinesterase inhibitors or memantine, could provide valuable insights.
Author Contributions
Conceptualization, M.A. and M.P.; methodology, M.A., M.P., M.S. and A.J.S.; validation, F.B., R.B., M.S. and A.J.S.; formal analysis, M.P. and M.A.; investigation, F.B., R.B., M.S. and A.J.S.; data curation, F.B., R.B., M.S. and A.J.S.; writing—original draft preparation, M.A. and M.P.; writing—review and editing, M.A. and F.B.; visualization, M.S. and A.J.S.; supervision, M.A.; project administration, M.A. and M.P.; funding acquisition, M.A. All authors have read and agreed to the published version of the manuscript.
Funding
This research was funded by King Salman Center for Disability Research for funding this work through Research Group No. KSRG-2024-263.
Institutional Review Board Statement
Not applicable.
Informed Consent Statement
Not applicable.
Data Availability Statement
All data are included in this manuscript.
Acknowledgments
The authors extend their appreciation to the King Salman Center for Disability Research for funding this work through Research Group No. KSRG-2024-263.
Conflicts of Interest
The authors declare no conflicts of interest. The funders had no role in the design of the study; in the collection, analyses, or interpretation of data; in the writing of the manuscript; or in the decision to publish the results.
References
- Vejandla, B.; Savani, S.; Appalaneni, R.; Veeravalli, R.S.; Gude, S.S. Alzheimer’s disease: The past, present, and future of a globally progressive disease. Cureus 2024, 16, e51705. [Google Scholar] [PubMed]
- Ciurea, V.A.; Covache-Busuioc, R.-A.; Mohan, A.G.; Costin, H.P.; Voicu, V. Alzheimer’s disease: 120 years of research and progress. J. Med. Life 2023, 16, 173. [Google Scholar] [PubMed]
- Hermann, P.; Zerr, I. Rapidly progressive dementias—Aetiologies, diagnosis and management. Nat. Rev. Neurol. 2022, 18, 363–376. [Google Scholar]
- Liu, P.-P.; Xie, Y.; Meng, X.-Y.; Kang, J.-S. History and progress of hypotheses and clinical trials for Alzheimer’s disease. Signal Transduct. Target. Ther. 2019, 4, 29. [Google Scholar]
- Sheppard, O.; Coleman, M. Alzheimer’s Disease: Etiology, Neuropathology and Pathogenesis; Exon Publications: Brisbane City, Australia, 2020; pp. 1–21. [Google Scholar]
- Gouras, G.K.; Olsson, T.T.; Hansson, O. β-Amyloid peptides and amyloid plaques in Alzheimer’s disease. Neurotherapeutics 2015, 12, 3–11. [Google Scholar]
- Sehar, U.; Rawat, P.; Reddy, A.P.; Kopel, J.; Reddy, P.H. Amyloid beta in aging and Alzheimer’s disease. Int. J. Mol. Sci. 2022, 23, 12924. [Google Scholar] [CrossRef] [PubMed]
- Rajmohan, R.; Reddy, P.H. Amyloid-beta and phosphorylated tau accumulations cause abnormalities at synapses of Alzheimer’s disease neurons. J. Alzheimer’s Dis. 2017, 57, 975–999. [Google Scholar]
- Medeiros, R.; Baglietto-Vargas, D.; LaFerla, F.M. The role of tau in Alzheimer’s disease and related disorders. CNS Neurosci. Ther. 2011, 17, 514–524. [Google Scholar]
- Maccioni, R.B.; Farías, G.; Morales, I.; Navarrete, L. The revitalized tau hypothesis on Alzheimer’s disease. Arch. Med. Res. 2010, 41, 226–231. [Google Scholar]
- Ricciarelli, R.; Fedele, E. The amyloid cascade hypothesis in Alzheimer’s disease: It’s time to change our mind. Curr. Neuropharmacol. 2017, 15, 926–935. [Google Scholar]
- Singh, A.; Kukreti, R.; Saso, L.; Kukreti, S. Oxidative stress: A key modulator in neurodegenerative diseases. Molecules 2019, 24, 1583. [Google Scholar] [CrossRef] [PubMed]
- Cheignon, C.m.; Tomas, M.; Bonnefont-Rousselot, D.; Faller, P.; Hureau, C.; Collin, F. Oxidative stress and the amyloid beta peptide in Alzheimer’s disease. Redox Biol. 2018, 14, 450–464. [Google Scholar] [PubMed]
- Guo, C.; Sun, L.; Chen, X.; Zhang, D. Oxidative stress, mitochondrial damage and neurodegenerative diseases. Neural Regen. Res. 2013, 8, 2003–2014. [Google Scholar] [PubMed]
- Peng, Y.; Jin, H.; Xue, Y.-h.; Chen, Q.; Yao, S.-y.; Du, M.-q.; Liu, S. Current and future therapeutic strategies for Alzheimer’s disease: An overview of drug development bottlenecks. Front. Aging Neurosci. 2023, 15, 1206572. [Google Scholar]
- Ruangritchankul, S.; Chantharit, P.; Srisuma, S.; Gray, L.C. Adverse drug reactions of acetylcholinesterase inhibitors in older people living with dementia: A comprehensive literature review. Ther. Clin. Risk Manag. 2021, 17, 927–949. [Google Scholar]
- Liu, J.; Li, T.; Zhong, G.; Pan, Y.; Gao, M.; Su, S.; Liang, Y.; Ma, C.; Liu, Y.; Wang, Q. Exploring the therapeutic potential of natural compounds for Alzheimer’s disease: Mechanisms of action and pharmacological properties. Biomed. Pharmacother. 2023, 166, 115406. [Google Scholar]
- Rahman, M.H.; Bajgai, J.; Fadriquela, A.; Sharma, S.; Trinh, T.T.; Akter, R.; Jeong, Y.J.; Goh, S.H.; Kim, C.-S.; Lee, K.-J. Therapeutic potential of natural products in treating neurodegenerative disorders and their future prospects and challenges. Molecules 2021, 26, 5327. [Google Scholar] [CrossRef]
- Mucha, P.; Skoczyńska, A.; Małecka, M.; Hikisz, P.; Budzisz, E. Overview of the antioxidant and anti-inflammatory activities of selected plant compounds and their metal ions complexes. Molecules 2021, 26, 4886. [Google Scholar] [CrossRef]
- Ullah, A.; Munir, S.; Badshah, S.L.; Khan, N.; Ghani, L.; Poulson, B.G.; Emwas, A.-H.; Jaremko, M. Important flavonoids and their role as a therapeutic agent. Molecules 2020, 25, 5243. [Google Scholar] [CrossRef]
- Baliga, M.S.; Bhat, H.P.; Joseph, N.; Fazal, F. Phytochemistry and medicinal uses of the bael fruit (Aegle marmelos Correa): A concise review. Food Res. Int. 2011, 44, 1768–1775. [Google Scholar]
- Seth, E.; Kaushal, S.; Ahsan, A.U.; Sharma, V.L.; Chopra, M. Neuroprotective effects of Aegle marmelos (L.) Correa against cadmium toxicity by reducing oxidative stress and maintaining the histoarchitecture of neural tissue in BALB/c mice. Indian J. Biochem. Biophys. 2018, 55, 95–104. [Google Scholar]
- Monika, S.; Thirumal, M.; Kumar, P. Phytochemical and biological review of Aegle marmelos Linn. Future Sci. OA 2023, 9, FSO849. [Google Scholar]
- Dhanda, T.; Madan, V.; Beniwal, R.K. Quantitative analysis of phenols, flavonoids in different parts of Aegle marmelos (Bael) along with the evaluation of Antioxidant potential using different extracts. J. Pharmacogn. Phytochem. 2020, 9, 1192–1198. [Google Scholar]
- Sharma, P.; Sharma, V.; Agarwal, N. Characterization of Phytoconstituents, Total Flavonoids and Anti-Oxidant Activity of Aegle marmelos Correa. Curr. Res. Nutr. Food Sci. J. 2023, 11, 1192–1203. [Google Scholar]
- Mansuri, M.L.; Parihar, P.; Solanki, I.; Parihar, M.S. Flavonoids in modulation of cell survival signalling pathways. Genes Nutr. 2014, 9, 400. [Google Scholar]
- Bellavite, P. Neuroprotective potentials of flavonoids: Experimental studies and mechanisms of action. Antioxidants 2023, 12, 280. [Google Scholar] [CrossRef]
- Raheja, S.; Girdhar, A.; Kamboj, A.; Lather, V.; Pandita, D. Aegle marmelos leaf extract ameliorates the cognitive impairment and oxidative stress induced by intracerebroventricular streptozotocin in male rats. Life Sci. 2019, 221, 196–203. [Google Scholar] [PubMed]
- Hoffmann, L.F.; Martins, A.; Majolo, F.; Contini, V.; Laufer, S.; Goettert, M.I. Neural regeneration research model to be explored: SH-SY5Y human neuroblastoma cells. Neural Regen. Res. 2023, 18, 1265–1266. [Google Scholar] [PubMed]
- Keowkase, R.; Kijmankongkul, N.; Sangtian, W.; Poomborplab, S.; Santa-Ardharnpreecha, C.; Weerapreeyakul, N.; Sitthithaworn, W. Protective effect and mechanism of fruit extract of Aegle marmelos against amyloid-β toxicity in a transgenic Caenorhabditis elegans. Nat. Prod. Commun. 2020, 15, 1934578X20933511. [Google Scholar]
- DeTure, M.A.; Dickson, D.W. The neuropathological diagnosis of Alzheimer’s disease. Mol. Neurodegener. 2019, 14, 32. [Google Scholar]
- Sadigh-Eteghad, S.; Sabermarouf, B.; Majdi, A.; Talebi, M.; Farhoudi, M.; Mahmoudi, J. Amyloid-beta: A crucial factor in Alzheimer’s disease. Med. Princ. Pract. 2015, 24, 1–10. [Google Scholar] [CrossRef] [PubMed]
- Tamagno, E.; Guglielmotto, M.; Vasciaveo, V.; Tabaton, M. Oxidative stress and beta amyloid in Alzheimer’s disease. Which comes first: The chicken or the egg? Antioxidants 2021, 10, 1479. [Google Scholar] [CrossRef]
- Chen, Z.-R.; Huang, J.-B.; Yang, S.-L.; Hong, F.-F. Role of cholinergic signaling in Alzheimer’s disease. Molecules 2022, 27, 1816. [Google Scholar] [CrossRef]
- Sedighi, M.; Baluchnejadmojarad, T.; Roghani, M. Linagliptin protects human SH-SY5Y neuroblastoma cells against amyloid-β cytotoxicity via the activation of Wnt1 and suppression of IL-6 release. Iran. Biomed. J. 2020, 25, 343. [Google Scholar]
- Song, Z.; He, C.; Yu, W.; Yang, M.; Li, Z.; Li, P.; Zhu, X.; Xiao, C.; Cheng, S. Baicalin Attenuated Aβ1-42-Induced Apoptosis in SH-SY5Y Cells by Inhibiting the Ras-ERK Signaling Pathway. BioMed Res. Int. 2022, 2022, 9491755. [Google Scholar] [CrossRef] [PubMed]
- Hsieh, L.-S.; Hsu, Y.-C.; Chiang, W.-D. Neuroprotective peptides isolated from flavourzyme-pea protein hydrolysate protect human SH-SY5Y cells from Aβ1-42 induced apoptosis. J. Funct. Foods 2023, 108, 105755. [Google Scholar] [CrossRef]
- Kenchappa, P.G.; Karthik, Y.; Vijendra, P.D.; Hallur, R.L.; Khandagale, A.S.; Pandurangan, A.K.; Jayanna, S.G.; Alshehri, M.A.; Alasmari, A.; Sayed, S. In vitro evaluation of the neuroprotective potential of Olea dioica against Aβ peptide-induced toxicity in human neuroblastoma SH-SY5Y cells. Front. Pharmacol. 2023, 14, 1139606. [Google Scholar]
- García-Ayllón, M.-S.; Small, D.H.; Avila, J.; Sáez-Valero, J. Revisiting the role of acetylcholinesterase in Alzheimer’s disease: Cross-talk with P-tau and β-amyloid. Front. Mol. Neurosci. 2011, 4, 22. [Google Scholar]
- Grossberg, G.T. Cholinesterase inhibitors for the treatment of Alzheimer’s disease: Getting on and staying on. Curr. Ther. Res. 2003, 64, 216–235. [Google Scholar]
- Marucci, G.; Buccioni, M.; Dal Ben, D.; Lambertucci, C.; Volpini, R.; Amenta, F. Efficacy of acetylcholinesterase inhibitors in Alzheimer’s disease. Neuropharmacology 2021, 190, 108352. [Google Scholar] [CrossRef]
- Kumar, G.P.; Khanum, F. Neuroprotective potential of phytochemicals. Pharmacogn. Rev. 2012, 6, 81. [Google Scholar]
- Lobine, D.; Sadeer, N.; Jugreet, S.; Suroowan, S.; Keenoo, B.S.; Imran, M.; Venugopala, K.N.; Ibrahim, F.M.; Zengin, G.; Mahomoodally, M.F. Potential of medicinal plants as neuroprotective and therapeutic properties against amyloid-β-related toxicity, and glutamate-induced excitotoxicity in human neural cells. Curr. Neuropharmacol. 2021, 19, 1416. [Google Scholar] [CrossRef]
- Pilipović, K.; Jurišić Grubešić, R.; Dolenec, P.; Kučić, N.; Juretić, L.; Mršić-Pelčić, J. Plant-based antioxidants for prevention and treatment of neurodegenerative diseases: Phytotherapeutic potential of Laurus nobilis, Aronia melanocarpa, and celastrol. Antioxidants 2023, 12, 746. [Google Scholar] [CrossRef] [PubMed]
- Pritam, P.; Deka, R.; Bhardwaj, A.; Srivastava, R.; Kumar, D.; Jha, A.K.; Jha, N.K.; Villa, C.; Jha, S.K. Antioxidants in Alzheimer’s disease: Current therapeutic significance and future prospects. Biology 2022, 11, 212. [Google Scholar] [CrossRef]
- Tönnies, E.; Trushina, E. Oxidative stress, synaptic dysfunction, and Alzheimer’s disease. J. Alzheimer’s Dis. 2017, 57, 1105–1121. [Google Scholar] [CrossRef] [PubMed]
- Zhao, Y.; Zhao, B. Oxidative stress and the pathogenesis of Alzheimer′ s disease. Oxidative Med. Cell. Longev. 2013, 2013, 316523. [Google Scholar]
- Cenini, G.; Lloret, A.; Cascella, R. Oxidative stress in neurodegenerative diseases: From a mitochondrial point of view. Oxidative Med. Cell. Longev. 2019, 2019, 2105607. [Google Scholar]
- Lee, K.H.; Cha, M.; Lee, B.H. Neuroprotective effect of antioxidants in the brain. Int. J. Mol. Sci. 2020, 21, 7152. [Google Scholar] [CrossRef]
- Ashok, A.; Andrabi, S.S.; Mansoor, S.; Kuang, Y.; Kwon, B.K.; Labhasetwar, V. Antioxidant therapy in oxidative stress-induced neurodegenerative diseases: Role of nanoparticle-based drug delivery systems in clinical translation. Antioxidants 2022, 11, 408. [Google Scholar] [CrossRef]
- Cui, X.; Lin, Q.; Liang, Y. Plant-derived antioxidants protect the nervous system from aging by inhibiting oxidative stress. Front. Aging Neurosci. 2020, 12, 209. [Google Scholar]
- Huang, W.J.; Zhang, X.; Chen, W.W. Role of oxidative stress in Alzheimer’s disease. Biomed. Rep. 2016, 4, 519–522. [Google Scholar] [CrossRef] [PubMed]
- Olufunmilayo, E.O.; Gerke-Duncan, M.B.; Holsinger, R.D. Oxidative stress and antioxidants in neurodegenerative disorders. Antioxidants 2023, 12, 517. [Google Scholar] [CrossRef]
- Aran, K.R. Mitochondrial dysfunction and oxidative stress in Alzheimer’s disease-A step towards mitochondria based therapeutic strategies. Aging Health Res. 2023, 3, 100169. [Google Scholar] [CrossRef]
- Picca, A.; Calvani, R.; Coelho-Junior, H.J.; Landi, F.; Bernabei, R.; Marzetti, E. Mitochondrial dysfunction, oxidative stress, and neuroinflammation: Intertwined roads to neurodegeneration. Antioxidants 2020, 9, 647. [Google Scholar] [CrossRef]
- Bell, S.M.; Barnes, K.; De Marco, M.; Shaw, P.J.; Ferraiuolo, L.; Blackburn, D.J.; Venneri, A.; Mortiboys, H. Mitochondrial dysfunction in Alzheimer’s disease: A biomarker of the future? Biomedicines 2021, 9, 63. [Google Scholar] [CrossRef]
- Chen, Q.; Ruan, D.; Shi, J.; Du, D.; Bian, C. The multifaceted roles of natural products in mitochondrial dysfunction. Front. Pharmacol. 2023, 14, 1093038. [Google Scholar]
- Shoaib, S.; Ansari, M.A.; Fatease, A.A.; Safhi, A.Y.; Hani, U.; Jahan, R.; Alomary, M.N.; Ansari, M.N.; Ahmed, N.; Wahab, S. Plant-derived bioactive compounds in the management of neurodegenerative disorders: Challenges, future directions and molecular mechanisms involved in neuroprotection. Pharmaceutics 2023, 15, 749. [Google Scholar] [CrossRef] [PubMed]
- Sun, W.; Jia, J. The +347 C promoter allele up-regulates MAPT expression and is associated with Alzheimer’s disease among the Chinese Han. Neurosci. Lett. 2009, 450, 340–343. [Google Scholar]
- Zeng, K.-W.; Ko, H.; Yang, H.O.; Wang, X.-M. Icariin attenuates β-amyloid-induced neurotoxicity by inhibition of tau protein hyperphosphorylation in PC12 cells. Neuropharmacology 2010, 59, 542–550. [Google Scholar] [CrossRef]
- Sobha, A.; Ganapathy, A.; Mohan, S.; Madhusoodanan, N.; Babysulochana, A.D.; Alaganandan, K.; Somappa, S.B. Novel Small Molecule-Based Acetylcholinesterase (AChE) Inhibitors: From Biological Perspective to Recent Developments. Eur. J. Med. Chem. Rep. 2024, 12, 100237. [Google Scholar]
- Mirzaei-Behbahani, B.; Meratan, A.A.; Moosakhani, B.; Mohammad-Zaheri, M.; Mousavi-Jarrahi, Z.; Nikfarjam, N.; Shahsavani, M.B.; Saboury, A.A. Efficient inhibition of amyloid fibrillation and cytotoxicity of α-synuclein and human insulin using biosynthesized silver nanoparticles decorated by green tea polyphenols. Sci. Rep. 2024, 14, 3907. [Google Scholar]
- Sharma, S.; Deep, S. Inhibition of fibril formation by polyphenols: Molecular mechanisms, challenges, and prospective solutions. Chem. Commun. 2024, 60, 6717–6727. [Google Scholar] [CrossRef]
- Karapetyan, G.; Fereshetyan, K.; Harutyunyan, H.; Yenkoyan, K. The synergy of β amyloid 1-42 and oxidative stress in the development of Alzheimer’s disease-like neurodegeneration of hippocampal cells. Sci. Rep. 2022, 12, 17883. [Google Scholar]
- Hong, Y.; Boiti, A.; Vallone, D.; Foulkes, N.S. Reactive oxygen species signaling and oxidative stress: Transcriptional regulation and evolution. Antioxidants 2024, 13, 312. [Google Scholar] [CrossRef] [PubMed]
- Kong, J.; Fan, R.; Zhang, Y.; Jia, Z.; Zhang, J.; Pan, H.; Wang, Q. Oxidative stress in the brain–lung crosstalk: Cellular and molecular perspectives. Front. Aging Neurosci. 2024, 16, 1389454. [Google Scholar]
- Zong, Y.; Li, H.; Liao, P.; Chen, L.; Pan, Y.; Zheng, Y.; Zhang, C.; Liu, D.; Zheng, M.; Gao, J. Mitochondrial dysfunction: Mechanisms and advances in therapy. Signal Transduct. Target. Ther. 2024, 9, 124. [Google Scholar]
- Baev, A. Mitochondrial permeability transition, cell death and neurodegeneration. Cells 2024, 13, 648. [Google Scholar] [CrossRef]
- Robichaux, D.J.; Harata, M.; Murphy, E.; Karch, J. Mitochondrial permeability transition pore-dependent necrosis. J. Mol. Cell. Cardiol. 2023, 174, 47–55. [Google Scholar]
- Teleanu, R.I.; Chircov, C.; Grumezescu, A.M.; Volceanov, A.; Teleanu, D.M. Antioxidant therapies for neuroprotection—A review. J. Clin. Med. 2019, 8, 1659. [Google Scholar] [CrossRef]
- Goyal, R.; Mittal, P.; Gautam, R.K.; Kamal, M.A.; Perveen, A.; Garg, V.; Alexiou, A.; Saboor, M.; Haque, S.; Farhana, A. Natural products in the management of neurodegenerative diseases. Nutr. Metab. 2024, 21, 26. [Google Scholar]
- Chen, M.-Y.; Chi, C.-Y.; Zheng, C.-W.; Wang, C.-H.; Chiu, I.-M. Coordinated Actions of Neurogenesis and Gliogenesis in Nerve Injury Repair and Neuroregeneration. Int. J. Transl. Med. 2024, 4, 810–830. [Google Scholar] [CrossRef]
- Adnan, M.; Patel, M.; Deshpande, S.; Alreshidi, M.; Siddiqui, A.J.; Reddy, M.N.; Emira, N.; De Feo, V. Effect of Adiantum philippense extract on biofilm formation, adhesion with its antibacterial activities against foodborne pathogens, and characterization of bioactive metabolites: An in vitro-in silico approach. Front. Microbiol. 2020, 11, 823. [Google Scholar]
- Pratap, G.; Nagaraju, P.G.; Danagoudar, A.; Joshi, C.G.; CG, P.P.; Mohammed, Y.H.I.; Koodlur, L.; Shantaram, M. Neuroprotective, lifespan and memory enhancing potential, and molecular docking studies of natural compound from Curculigo orchioides: A study on Alzheimer’s disease model of appl-GAL4 Drosophila melanogaster. S. Afr. J. Bot. 2022, 149, 60–66. [Google Scholar]
- Sugimoto, H.; Yamanish, Y.; Iimura, Y.; Kawakami, Y. Donepezil hydrochloride (E2020) and other acetylcholinesterase inhibitors. Curr. Med. Chem. 2000, 7, 303–339. [Google Scholar]
- Johari, M.A.; Khong, H.Y. Total phenolic content and antioxidant and antibacterial activities of Pereskia bleo. Adv. Pharmacol. Pharm. Sci. 2019, 2019, 7428593. [Google Scholar]
- Reddy, M.N.; Adnan, M.; Alreshidi, M.M.; Saeed, M.; Patel, M. Evaluation of anticancer, antibacterial and antioxidant properties of a medicinally treasured fern Tectaria coadunata with its phytoconstituents analysis by HR-LCMS. Anti-Cancer Agents Med. Chem. Former. Curr. Med. Chem.-Anti-Cancer Agents 2020, 20, 1845–1856. [Google Scholar]
- Brand-Williams, W. Use of a free radical method to evaluate antioxidant activity. Food Sci. Technol. 1999, 28, 1231–1237. [Google Scholar]
- Benzie, I.F.; Strain, J.J. The ferric reducing ability of plasma (FRAP) as a measure of “antioxidant power”: The FRAP assay. Anal. Biochem. 1996, 239, 70–76. [Google Scholar]
- Ellman, G.L.; Courtney, K.D.; Andres, V., Jr.; Featherstone, R.M. A new and rapid colorimetric determination of acetylcholinesterase activity. Biochem. Pharmacol. 1961, 7, 88–95. [Google Scholar]
- Xue, C.; Lin, T.Y.; Chang, D.; Guo, Z. Thioflavin T as an amyloid dye: Fibril quantification, optimal concentration and effect on aggregation. R. Soc. Open Sci. 2017, 4, 160696. [Google Scholar]
- Dalberto, D.; Nicolau, C.C.; Garcia, A.L.H.; Nordin, A.P.; Grivicich, I.; Silva, J.D. Cytotoxic and genotoxic evaluation of cotinine using human neuroblastoma cells (SH-SY5Y). Genet. Mol. Biol. 2020, 43, e20190123. [Google Scholar] [CrossRef]
- Ekpo, E.; Enogieru, A.B.; Omoruyi, S.I. Aqueous leaf extract of Sutherlandia frutescens attenuates ROS-induced apoptosis and loss of mitochondrial membrane potential in MPP+-treated SH-SY5Y cells. Trop. J. Pharm. Res. 2020, 19, 549–555. [Google Scholar]
- Salvioli, S.; Dobrucki, J.; Moretti, L.; Troiano, L.; Fernandez, M.G.; Pinti, M.; Pedrazzi, J.; Franceschi, C.; Cossarizza, A. Mitochondrial heterogeneity during staurosporine-induced apoptosis in HL60 cells: Analysis at the single cell and single organelle level. Cytom. J. Int. Soc. Anal. Cytol. 2000, 40, 189–197. [Google Scholar]
- Chang, H.-Y.; Huang, H.-C.; Huang, T.-C.; Yang, P.-C.; Wang, Y.-C.; Juan, H.-F. Flow cytometric detection of reactive oxygen species. Bio-Protocol 2013, 3, e431. [Google Scholar]
- Kim, H.; Xue, X. Detection of total reactive oxygen species in adherent cells by 2′, 7′-dichlorodihydrofluorescein diacetate staining. J. Vis. Exp. JoVE 2020, 160, 10-3791. [Google Scholar]
- Ruijter, J.; Ramakers, C.; Hoogaars, W.; Karlen, Y.; Bakker, O.; Van den Hoff, M.; Moorman, A. Amplification efficiency: Linking baseline and bias in the analysis of quantitative PCR data. Nucleic Acids Res. 2009, 37, e45. [Google Scholar] [CrossRef]
- Ruijter, J.M.; Pfaffl, M.W.; Zhao, S.; Spiess, A.N.; Boggy, G.; Blom, J.; Rutledge, R.G.; Sisti, D.; Lievens, A.; De Preter, K. Evaluation of qPCR curve analysis methods for reliable biomarker discovery: Bias, resolution, precision, and implications. Methods 2013, 59, 32–46. [Google Scholar]
Disclaimer/Publisher’s Note: The statements, opinions and data contained in all publications are solely those of the individual author(s) and contributor(s) and not of MDPI and/or the editor(s). MDPI and/or the editor(s) disclaim responsibility for any injury to people or property resulting from any ideas, methods, instructions or products referred to in the content. |
© 2025 by the authors. Licensee MDPI, Basel, Switzerland. This article is an open access article distributed under the terms and conditions of the Creative Commons Attribution (CC BY) license (https://creativecommons.org/licenses/by/4.0/).