Abstract
We investigate the magnetic field-dependent fluorescence lifetime of microdiamond powder containing a high density of nitrogen-vacancy centers. This constitutes a non-intensity quantity for robust, all-optical magnetic field sensing. We propose a fiber-based setup in which the excitation intensity is modulated in a frequency range up to . The change in magnitude and phase of the fluorescence relative to is recorded where the phase shows a maximum in magnetic contrast of at . A lock-in amplifier-based setup utilizing the change in phase at this frequency shows a 100 times higher immunity to fluctuations in the optical path compared to the intensity-based approach. A noise floor of and a shot-noise-limited sensitivity of were determined.
1. Introduction
The use of negatively charged nitrogen-vacancy (NV) centers in diamonds has attracted considerable attention in the recent past, especially in the field of magnetic field sensing. Approaches using microwave (MW) excitation achieve high sensitivities [1,2] and spatial resolutions [3,4] while operating at room temperature. They are, however, limited in their application due to the necessity of MW delivery, which typically requires a galvanic connection. Additionally, the MW delivery adds complexity and may have adverse effects, like local heating or the creation of eddy currents. In contrast, all-optical approaches simplify the sensor design as a step toward industrial application. They rely on the fluorescence change caused by spin mixing for magnetic fields up to ~ achieving sensitivities of 14–50 [5,6,7,8,9]. Other all-optical setups utilize the ground-state level-anticrossing, reporting noise floors of , but requiring high precision in angular alignment and a bias magnetic field [10,11,12]. Furthermore, the cross-relaxation features near zero magnetic field in high-NV-density samples have been investigated in MW-free setups [13,14], reporting estimated photon shot-noise-limited sensitivities of [14]. They can be implemented using fiber optics [7,13,15,16] to construct a non-magnetic, high-insulation resistance probe and potentially be used in harsh environments. These designs are, however, still subject to challenges, like movement in the optical fiber or laser intensity fluctuations. In setups that only observe the fluorescence intensity, these would be misinterpreted as magnetic field changes. One possible solution is the use of a non-intensity quantity like the fluorescence lifetime, which shows a relative change, similar to the fluorescence intensity, upon application of a magnetic field [3,17].
In this work, a sample composed of an ensemble of microdiamonds is first characterized in a time-correlated single-photon counting (TCSPC) setup with regard to the magnetic field-dependent fluorescence lifetime. Afterward, a setup is presented in which the material is fixed to the tip of an optical fiber, which is used for excitation and fluorescence collection. The magnitude and phase of the fluorescence upon excitation with a varying frequency in the range up to is recorded, and its dependence on magnetic fields is analyzed. Furthermore, the phase at one specific excitation frequency is used for magnetic field sensing and analyzed concerning its immunity to disturbances and noise characteristics.
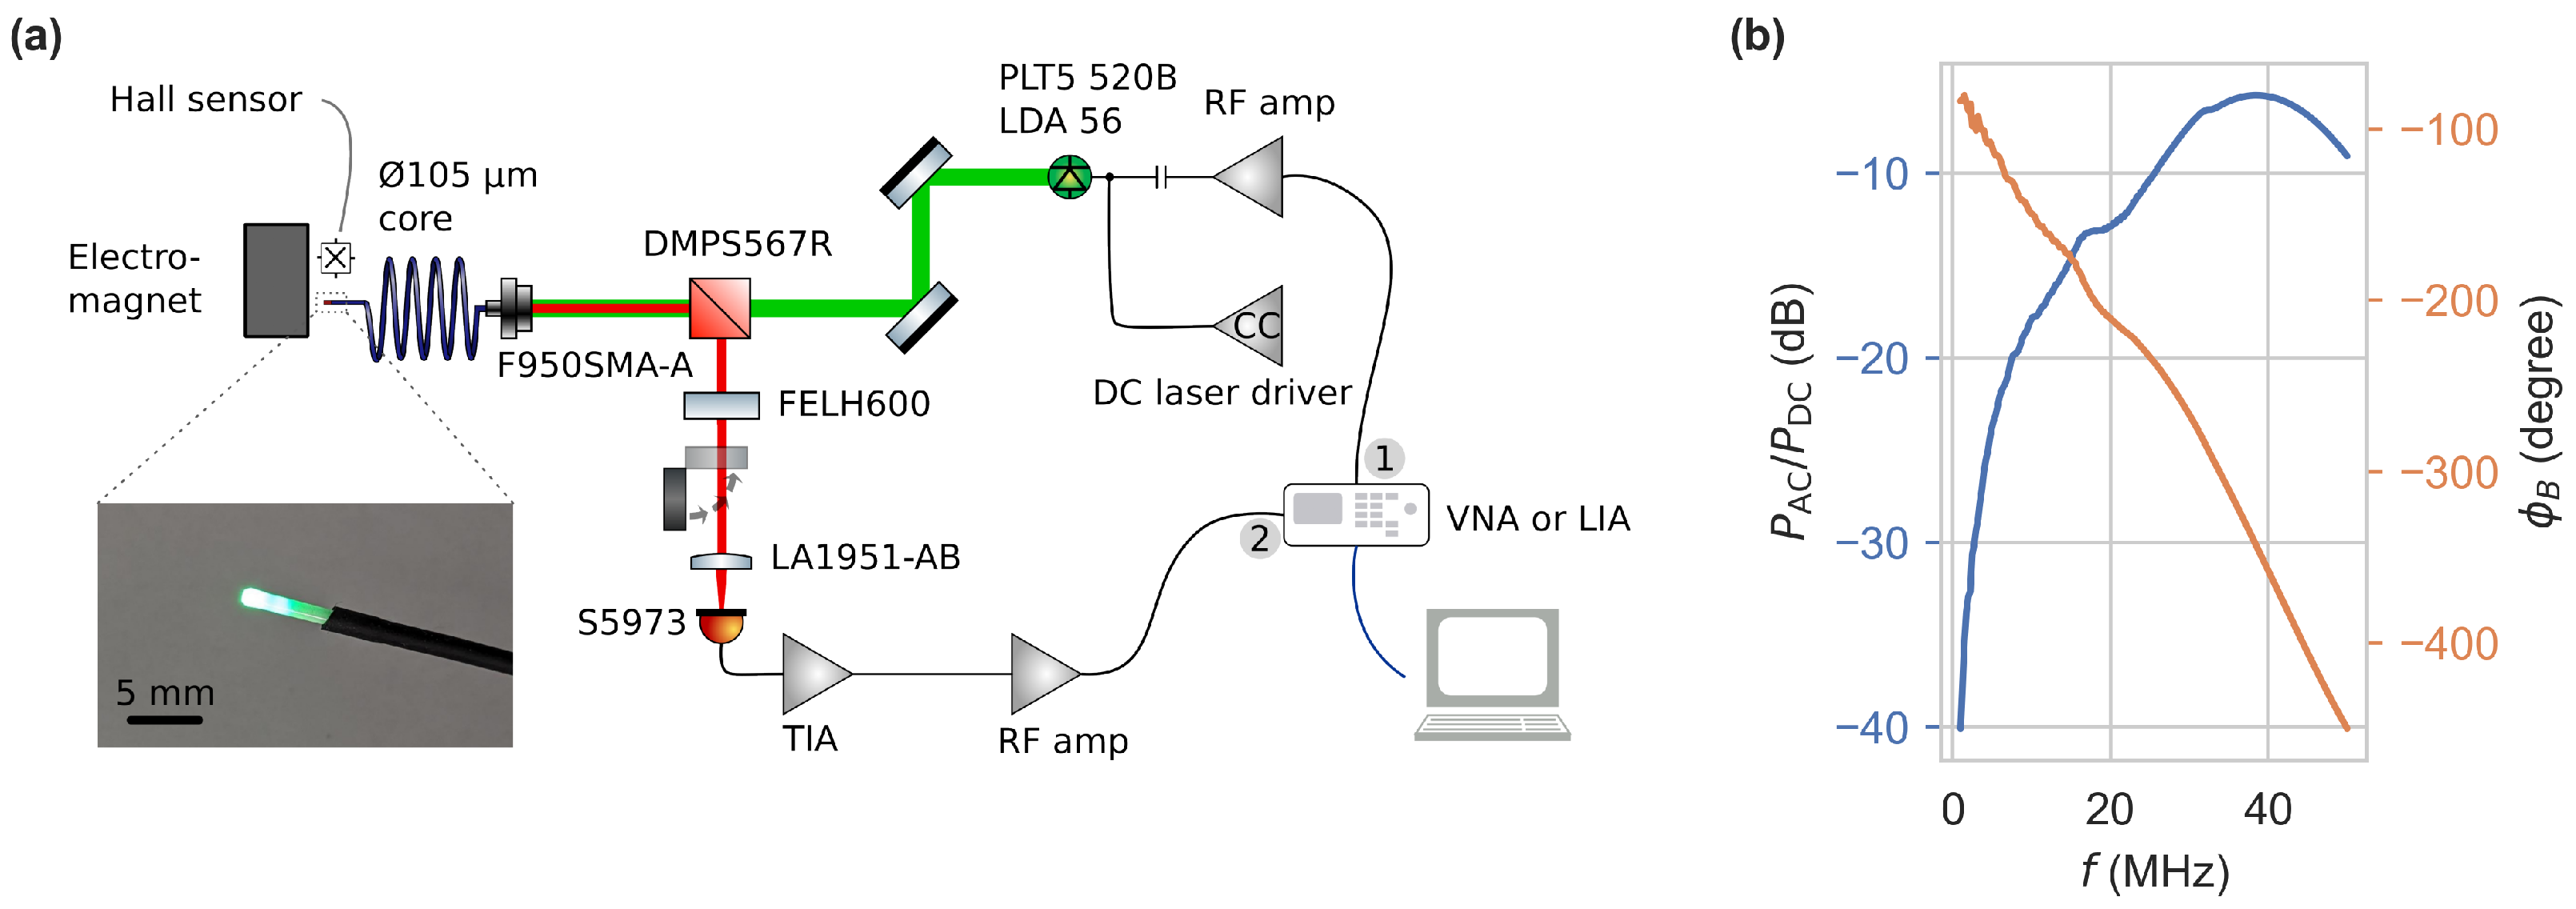
3. Frequency Domain Lifetime Measurements
While TCSPC measurements deliver complete histograms, their implementation is technically demanding. Additionally, the acquisition is slow when considering the application of magnetic field sensing. A setup based on the frequency domain measurement is proposed to make use of the change in the excited-state fluorescence lifetime of NV centers for magnetometry. The fluorescence response can be understood as a convolution of the excitation signal with the decay dynamics, acting as a low-pass filter. Instead of monitoring the time-domain decay from a short excitation pulse, we employ harmonic oscillation with a variable frequency. With increasing frequency, the low-pass characteristic will lead to a reduction of the fluorescence amplitude, commonly referred to as demodulation. This is accompanied by a phase shift of the fluorescence signal from 0 to [18]. In our setup, we sweep the frequency up to 100 MHz and record the system response in both amplitude and phase. This frequency response not only contains the effects of the NV diamond powder but also all electronic and optical components involved in the excitation and recording of the fluorescence. Examples are a frequency-dependent excitation power or the transition time of the signal through the system, leading to a frequency-dependent phase shift. Therefore, we record a reference frequency response at , which is used to calibrate subsequent measurements. The resulting measurements then directly reflect the change in the fluorescence decay dynamics at the application of a magnetic field.
3.1. Materials and Methods
The optical and electrical setup for frequency domain measurements is depicted in Figure 3a. A laser diode (PLT5 520B, ams-OSRAM AG, Premstaetten, Austria) is driven by a constant current source based on a laser driver integrated circuit (NZN, iC-Haus GmbH, Bodenheim, Germany). Additionally, it is modulated by an AC-coupled radio frequency (RF) amplifier (, 1–700, ) at an input power of . The excitation light is collimated, propagates through a dichroic beam splitter (DMPS567R, Thorlabs, Newton, NJ, USA), and is coupled to a core diameter fibre. The end facet of the fiber is coated with NV-rich diamond powder in glue, with crystal sizes much smaller than the facet diameter. The material is comparable in NV density to the material used in [6]. The fiber sensor was manufactured by Quantum Technologies GmbH in collaboration with the Leibniz Institute of Surface Engineering. The fluorescence is collected through the same fiber, passing through a long-pass filter and focused (FELH600 & LA1951-AB, Thorlabs, Newton, NJ, USA) onto a Si-photodiode (S5973, Hamamatsu Photonics K.K., Hamamatsu City, Japan). The photodiode is part of a trans-impedance amplifier (TIA) based on an OPA847 operational amplifier (, ). Its output is passed through a low-noise RF amplifier (, 0.1–2000) to a PicoVNA 106 vector network analyzer (VNA) (Pico Technology, St Neots, United Kingdom) or HF2LI lock-in amplifier (LIA) (Zurich Instruments AG, Zurich, Switzerland), which also drives the laser diode modulation. An electromagnet, connected to a PC-controlled power supply, is being monitored by a Hall effect sensor and enables the application of magnetic flux densities from 0 to ~.
Figure 3.
(a) Schematic of the optical and electrical setup used for frequency domain measurements. (b) Excitation light modulation measured via reflections with the long-pass filter removed and phase difference between excitation and reception signal.
The modulation of the excitation light can be described by an offset and amplitude of the AC component . To assess the modulation, we measured these via reflection of the pump beam after removing the long-pass filter at the DC-coupled TIA output. Their ratio is depicted in Figure 3b. It shows a high pass characteristic and overall non-constant ratio originating from the RF amplifier for laser modulation. The laser diode output power measured before the dichroic mirror varies between 33 and 37, depending on the modulation frequency. The use of a VNA, in particular, requires the calibration of the scattering parameter , i.e., the magnitude and phase relationship of the signals of ports one and two. Therefore, isolation and through was calibrated by either blocking the fluorescence path or passing it unrestricted to the photodetector, ensuring no magnetic field was applied to the sensor head. This way, the instrument automatically corrects for the reference frequency response.
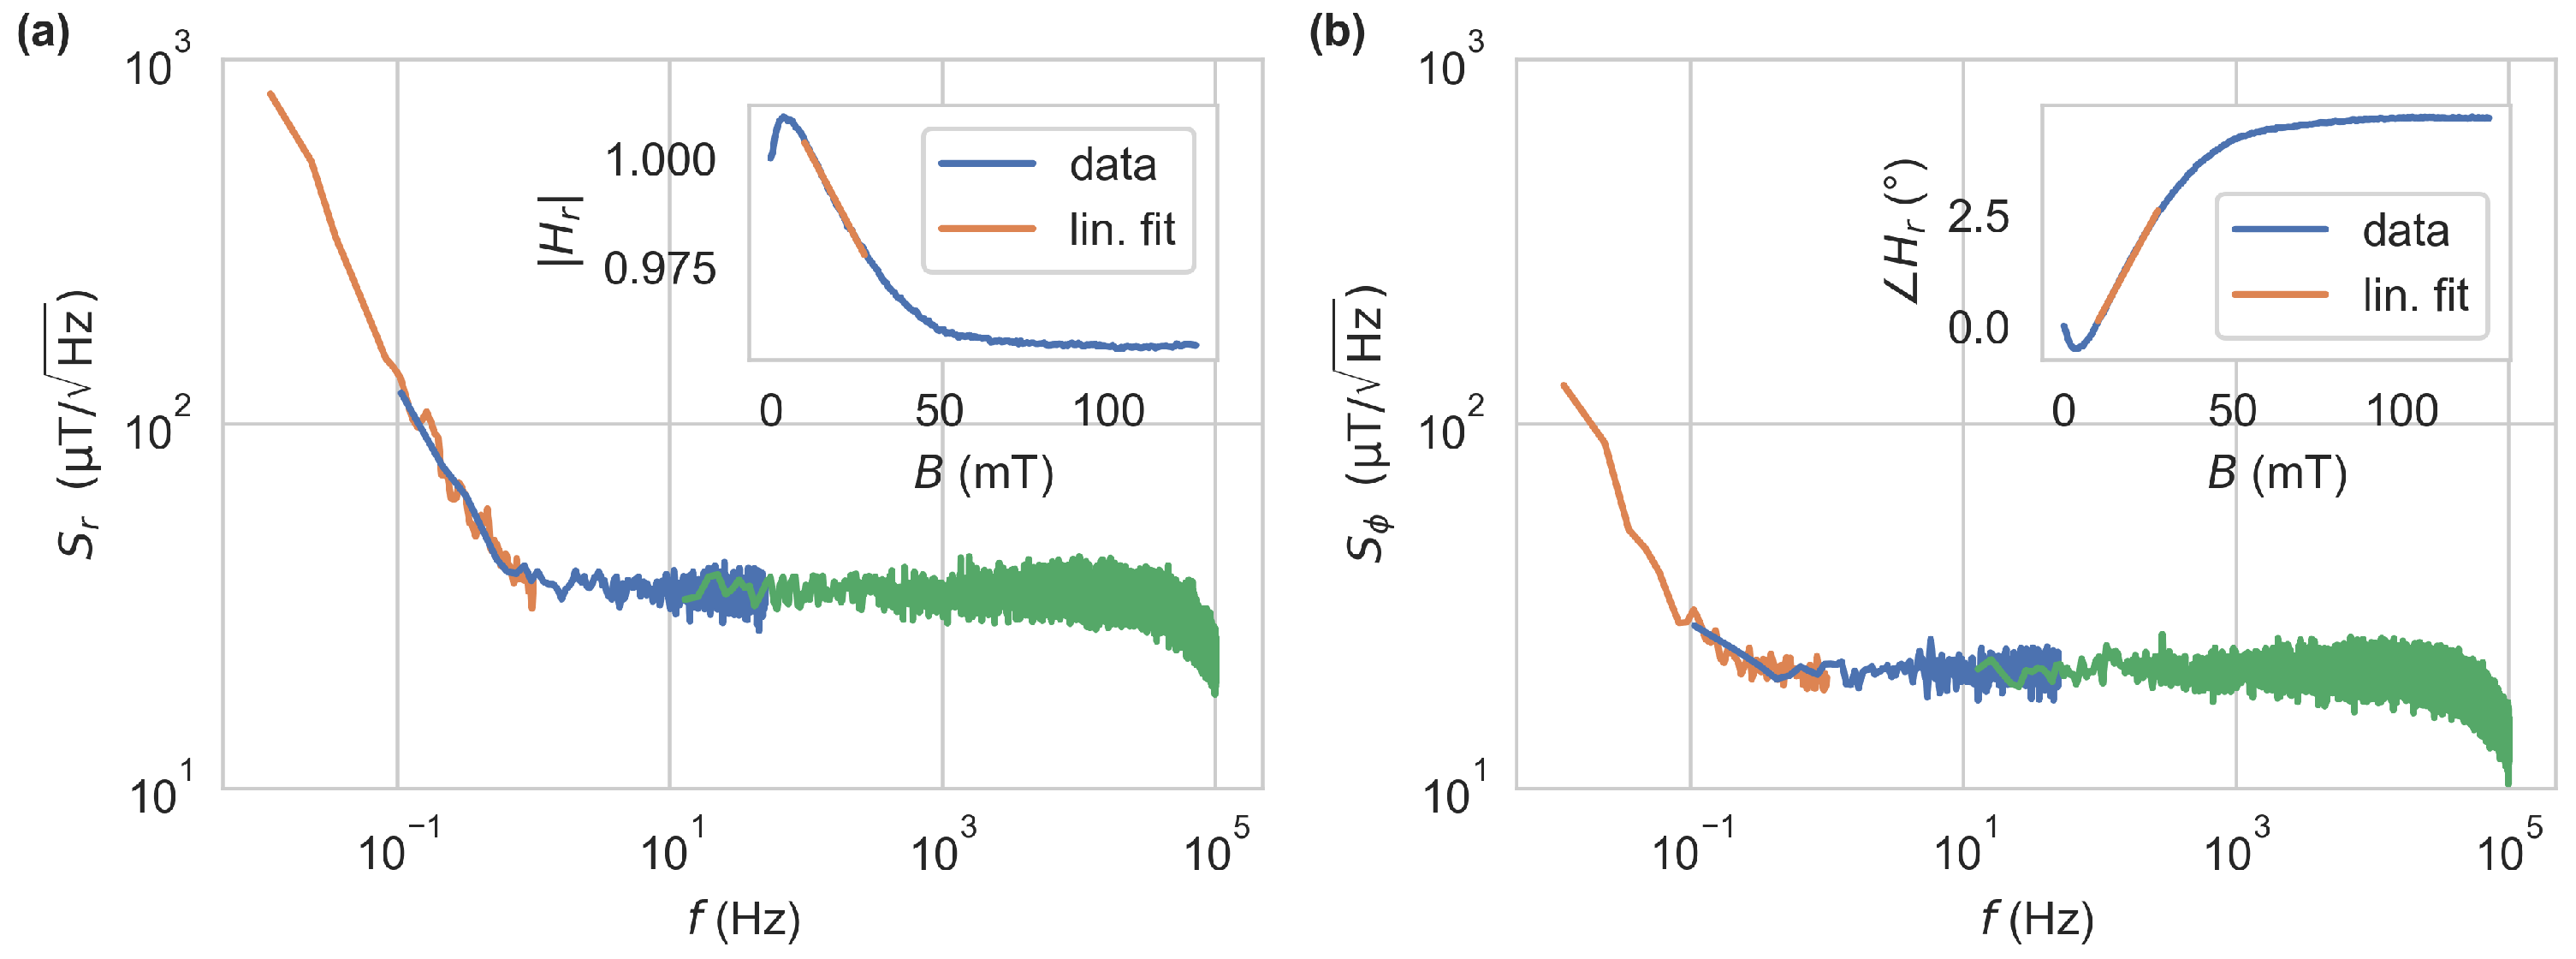
3.2. Results and Discussion
Figure 4a,b show the magnitude and phase of the fluorescence signal as a function of modulation frequency and applied magnetic field (acquired with the VNA), relative to . The horizontal and vertical lines correspond to the other measurements shown in the figure. On the left edge at near zero frequency, we see a relative magnetic contrast of 16% in magnitude, which has already been observed and used for all-optical magnetometry [6,38]. At higher modulation frequencies, this behavior changes significantly. The magnitude for all declines, and a response of the phase to magnetic fields emerges. The phase displays a maximum in magnetic contrast of at . Towards higher modulation frequencies, both quantities decrease in magnetic contrast, and the magnitude rises above one at an inflection point around . At this frequency, the magnitude is nearly independent of the magnetic field (cf. pink trace in Figure 4e) while the phase still shows a magnetic contrast of . This could potentially be used to calibrate the optical path. At lower optical excitation powers, we observe a similar behavior with the difference of a lower signal-to-noise ratio and a decrease in magnetic contrast of both measurement quantities. Many fiber sensors were produced and show good reproducibility in fluorescence intensity and response to static magnetic fields, but lifetime measurements were only performed for one fiber. We also expect lifetime measurement results to be similar for different fiber sensors.
Figure 4.
Measurements of the complex transfer function . The top and bottom rows show the magnitude and phase , respectively. is the transfer function , relative to . (a–d) were obtained directly by sweeping the modulation frequency using a VNA, which was calibrated at . For (e,f), a LIA at the respective modulation frequencies was used to capture magnitude and phase. The data were subsequently normalized to the data point at .
We operate the system at optical excitation powers for which we expect no saturation behavior [39,40]. In this linear regime, the fluorescence can be understood as a convolution of the excitation signal with the decay dynamics, acting as a low-pass filter. Considering single- and bi-exponential fluorescence decays, their respective transfer functions can be written as
by the Laplace-transform of Equation (1) with , where for a single exponential approach . To model the measurements in Figure 4 the normalization to at is considered, resulting in . Magnitude and phase can then be obtained from this. To reproduce the inflection point around and a magnitude greater one at high modulation frequencies, at least a bi-exponential approach is needed. This becomes apparent when considering
for a single exponential approach, with , and , being functions of B. can then only be strictly greater or less than one for or , respectively. Therefore, a single exponential approach is insufficient to model this behavior. The data can, however, be fit well by with constant factors resulting in and at . These findings agree well with the fits to the time-domain histograms from Figure 2. Analogous to the time domain fits, similar fitting transfer functions could be obtained from a constant and shift in , or intermediate values. The exact dynamics do not need to be deduced from these measurements, as the behavior, especially the reduction in the larger decay time, allows the utilization in a sensing application. This may be done by capturing the complete frequency response to calculate the applied magnetic field. Alternatively, we record the magnitude and phase at one excitation frequency with a LIA, yielding a higher acquisition speed.
The key advantage of using the phase instead of the magnitude lies in its immunity to disturbances that affect the intensity of the signal. These include laser intensity noise and thermal drifts in the optical alignment, as well as motion in the fiber, causing fluctuations in the excitation and the returning fluorescence. We use an LIA to monitor and compare magnitude and phase. Hence, we set the excitation frequency to , where the phase shows the maximum contrast. Now, we test the immunity. We add a small modulation of the laser intensity in a frequency range up to . This translates to an excitation intensity modulation, which can be expected in an application through attenuation by, e.g., bending of the fiber. This artificial disturbance is achieved by a Liquid Crystal Light Valve (LCLV) placed between the adjustment mirrors and the dichroic beam splitter, which can be continuously modulated in its transmission. Figure 5a shows magnitude and phase in a time range of . The additional disturbance modulation with frequency is switched on at which leads to an excitation intensity of fluctuating with . Additionally, at , a magnetic field of was applied for easy comparison of both measurement quantities to their magnetic contrast. A lower impact on relative to its contrast is obvious.
Figure 5.
(a) Measurement quantities and at (4th order, low-pass demodulator). The excitation disturbance modulation with frequency was switched on at . For comparison to the magnetic contrasts of both quantities, a magnetic field of > has been applied at . (b) Root-mean-square values of the AC components of magnitude and phase at the disturbance frequency in a range of 0.1–10. Here, a bias magnetic field corresponding to half of the magnetic contrast was applied.
To measure these errors in a wider frequency range and at a higher precision, the LIAs demodulator outputs R or were fed back into a second demodulator, running at and therefore measuring the root-mean-square (RMS) value of the disturbance modulation components. We set the first demodulator low-pass filter to , making sure the additional disturbance component passes to the second one without attenuation. Additionally, a bias magnetic field corresponding to half of the magnetic contrast was applied to bring the system to a point of operation that is realistic during an application. We then swept in a frequency range of to and recorded the second demodulator output. This second output is a measure for the low-frequency disturbances in magnitude or phase, which we denote by or , respectively. They are shown in Figure 5b. For lower frequencies , which is 2.3% of the magnetic contrast of . In comparison , a disturbance of only 0.02%, relative to the magnetic contrast of . Above , the LCLV drops off in its modulation amplitude, leading to a reduction in and a higher error in the measurement of . This is caused by the slow response of the LCLV, and we expect the immunity to persist at higher frequency disturbances.
The sensitivity achievable by both approaches, i.e., magnitude or phase as a measurement quantity, was further investigated. Therefore, a bias magnetic field of was applied, and data were recorded with the LIA set to and subsequently converted to magnetic field values using linear fits to and , depicted in the insets of Figure 6. The respective noise spectral densities are shown in Figure 6 reveal a white noise region above with sensitivities of and . The excitation light source was operated at . In this case, the fluorescence signal leads to a photodiode current with DC component and amplitude of the AC component of at . This results in shot-noise-limited sensitivities (SNLS) of and . The SNLS in LIA-based setups are derived in Appendix A. The difference in the achieved sensitivities is largely based on the TIA’s output noise spectral density, being limited by the feedback resistor’s thermal noise of and the operational amplifier’s input current noise contributing . These dominate the shot noise, contributing only at the given photocurrent. The same measurement at leads to sensitivities of and , which are caused by different magnetic contrasts at this frequency. Additional 1/f components dominate the spectrum below in both approaches. These are attributed largely to the excitation and detection electronics.
Figure 6.
Noise spectral densities based on magnitude (a) and phase (b). The excitation frequency was set to , and a bias field of was applied. Data were recorded by the LIA with the low-pass filter set to fourth order at corner frequencies of , and , corresponding to the green, blue and orange traces. They have been subsequently converted to magnetic field values using the linear fits drawn in the respective insets and converted to spectral densities by Welch’s method.
4. Conclusions and Outlook
The fluorescence lifetime of a high-NV-density microdiamond powder has been investigated, showing a bi-exponential behavior with a magnetic contrast of the larger decay time of 15.2%. This constitutes a non-intensity-based quantity for magnetic field sensing, which is used in a MW-free fiber-based setup. The bi-exponential function is interpreted as a sum of two first-order low-pass filters, which change their gain and corner frequencies upon application of a magnetic field. This is accompanied by a change in phase, which shows a maximum in magnetic contrast of at . We employ an LIA at this modulation frequency and use the phrase as a non-intensity quantity for magnetic field sensing. We realize a 100-times-higher immunity to intensity fluctuations because we avoid the misinterpretation of changes in fluorescence intensity as changing magnetic fields. In the current state, the system shows comparable realized sensitivities and expected SNLS for the magnitude and phase approaches. The construction of the TIA leaves room for improvement upon narrowing the required bandwidth to a small band around to realize a sensitivity closer to the SNLS, which we estimate to at an excitation power of . In shot-noise-limited measurements, the signal-to-noise ratio scales with the square root of the detected photons per time. However, we are limited by significant increases in the excitation power and, therefore, fluorescence intensity by heat introduced into the fiber head. Next to the shot noise, the achievable sensitivity in our setup is primarily determined by the derivatives of the measurement quantities and , which increase with excitation power. We expect a saturation towards higher powers, which has been observed for the magnitude before [6].
Current state-of-the-art NV-based sensors realize impressive sensitivities, reaching for NV ensembles [41] and for single NV centers [42]. They are based on optically detected magnetic resonance, requiring MW excitation. Other all-optical setups also achieve higher sensitivities at –, using the GSLAC [10,11,12] or ~, utilizing the zero-field features [14]. Both are based on narrowband features, requiring stable bias magnetic fields with accurate alignment. All of these setups need bulky and costly infrastructure bound to a laboratory environment. Our setup, in contrast, can potentially be realized in a more compact and less costly manner. It also shows a consistent sensitivity in a higher magnetic field range of approximately 10–, making it more universally applicable. These findings establish the basis for the application of fluorescence lifetime in all-optical, low-noise, and robust magnetometry. The integration of this approach holds promise for advancing magnetic field sensing capabilities, particularly in applications where conventional methods are limited by a galvanic connection, metallic components in the sensing volume, or the interaction with MW radiation.
Author Contributions
Conceptualization, L.H., L.L. and R.S.; methodology, L.H. and L.L.; validation, J.P., D.S., F.H. and L.L.; formal analysis, L.H.; investigation, L.H., L.L. and J.P.; resources, R.S., C.L., W.K. and M.G.; data curation, L.H.; writing—original draft preparation, L.H.; writing—review and editing, J.P., D.S., F.H., L.L., R.S., M.G. and P.G.; visualization, L.H.; supervision, M.G. and P.G.; project administration, P.G.; funding acquisition, M.G. and P.G. All authors have read and agreed to the published version of the manuscript.
Funding
Research funded by Bundesministerium für Bildung und Forschung (13N15489 and 13N15971).
Institutional Review Board Statement
Not applicable.
Informed Consent Statement
Not applicable.
Data Availability Statement
Data underlying the results presented in this paper are not publicly available at this time but may be obtained from the authors upon reasonable request.
Acknowledgments
The authors would like to thank the members of the projects OCQNV, RaQuEl, and O3Q for helpful debates, as well as the Research Center for Information and Communications Technologies of the University of Granada (CITIC-UGR) for a constructive exchange. We also thank Simon Klug for their support in the TCSPC setup.
Conflicts of Interest
Author R.S. is an executive partner of Quantum Technologies GmbH and has a financial interest in the outcome of this study. Author L.L. is employed at the same company. The authors L.H., J.P., D.S., F.H., C.L., W.K., M.G., and P.G. have no conflicts of interest to declare.
Abbreviations
The following abbreviations are used in this manuscript:
| NV | Nitrogen vacancy |
| MW | Microwave |
| TCSPC | Time-correlated single-photon counting |
| APD | Avalanche photodiode |
| IRF | Instrument response function |
| FWHM | Full width at half maximum |
| NLLS | Non-linear least squares |
| AC | Alternating current |
| RF | Radio frequency |
| TIA | Trans-impedance amplifier |
| VNA | Vector network analyzer |
| LIA | Lock-In amplifier |
| DC | Direct current |
| LCLV | Liquid Crystal Light Valve |
| RMS | Root-mean-square |
| SNLS | Shot-noise-limited sensitivity |
Appendix A
Shot noise in optical devices arises due to fluctuations in the number of photons detected per time because they occur independently of each other, and sets a lower bound to the achievable sensitivities in the presented setup. To determine its impact on intensity- or phase-based all-optical systems, first, the influence of noise on amplitude and phase in general has to be determined. The following considerations are based on [43,44,45]. A lock-in amplifier output signal can be considered to be
with in-phase and quadrature components or amplitude and phase . For each component, the mean and standard deviation are given by and , subscripted by the component name. The output is considered to be the response of a homodyne detector to a sinusoidal signal with additional noise. It can be assumed that the noise components of in-phase and quadrature are
- Gaussian random processes with zero-mean, normal distributions,
- statistically independent, and
- contain identical energy, i.e., .
with the parameter , the amplitude is then described by the Rician distribution
with the modified Bessel function of the first kind with order zero . The phase distribution is given by
with and the scaled complementary error function erfcx. While for the amplitude distribution, the mean and standard deviation are well defined, there are no closed-form formulas for the phase distribution. So, in this work, they are obtained computationally by and . The nature of the erfcx function necessitates an arbitrary-precision floating-point arithmetic library, like mpmath [46].
In the given application, the photodiodes output current is composed of a DC offset and AC component of amplitude , resulting in a root-mean-square current contributing a shot noise density of with the elementary charge q. With and the shot-noise-limited sensitivity for the magnitude can then be defined as
in units of . Here is the change in magnitude relative to the case of at a fixed excitation frequency . Similarly for the phase
with . Please note that in the last steps, and are spectral densities instead of RMS values. The argument stays valid because the shot noise is white, i.e., constant over frequency.
References
- Barry, J.F.; Schloss, J.M.; Bauch, E.; Turner, M.J.; Hart, C.A.; Pham, L.M.; Walsworth, R.L. Sensitivity optimization for NV-diamond magnetometry. Rev. Mod. Phys. 2020, 92, 015004. [Google Scholar] [CrossRef]
- Xie, Y.; Yu, H.; Zhu, Y.; Qin, X.; Rong, X.; Duan, C.K.; Du, J. A hybrid magnetometer towards femtotesla sensitivity under ambient conditions. Sci. Bull. 2021, 66, 127–132. [Google Scholar] [CrossRef] [PubMed]
- Tetienne, J.P.; Rondin, L.; Spinicelli, P.; Chipaux, M.; Debuisschert, T.; Roch, J.F.; Jacques, V. Magnetic-field-dependent photodynamics of single NV defects in diamond: An application to qualitative all-optical magnetic imaging. New J. Phys. 2012, 14, 103033. [Google Scholar] [CrossRef]
- Zhou, T.X.; Stöhr, R.J.; Yacoby, A. Scanning diamond NV center probes compatible with conventional AFM technology. Appl. Phys. Lett. 2017, 111, 163106. [Google Scholar] [CrossRef]
- Rogers, L.J.; McMurtrie, R.L.; Sellars, M.J.; Manson, N.B. Time-averaging within the excited state of the nitrogen-vacancy centre in diamond. New J. Phys. 2009, 11, 063007. [Google Scholar] [CrossRef]
- Staacke, R.; John, R.; Wunderlich, R.; Horsthemke, L.; Knolle, W.; Laube, C.; Glösekötter, P.; Burchard, B.; Abel, B.; Meijer, J. Isotropic Scalar Quantum Sensing of Magnetic Fields for Industrial Application. Adv. Quantum Technol. 2020, 3, 2000037. [Google Scholar] [CrossRef]
- Fedotov, I.; Amitonova, L.; Sidorov-Biryukov, D.; Safronov, N.; Blakley, S.; Levchenko, A.; Zibrov, S.; Fedotov, A.; Kilin, S.; Scully, M.; et al. Fiber-optic magnetic-field imaging. Opt. Lett. 2014, 39, 6954–6957. [Google Scholar] [CrossRef] [PubMed]
- Paone, D.; Pinto, D.; Kim, G.; Feng, L.; Kim, M.J.; Stöhr, R.; Singha, A.; Kaiser, S.; Logvenov, G.; Keimer, B.; et al. All-optical and microwave-free detection of Meissner screening using nitrogen-vacancy centers in diamond. J. Appl. Phys. 2021, 129, 024306. [Google Scholar] [CrossRef]
- Anishchik, S.V.; Vins, V.G.; Yelisseyev, A.P.; Lukzen, N.N.; Lavrik, N.L.; Bagryansky, V.A. Low-field feature in the magnetic spectra of N-V centers in diamond. New J. Phys. 2015, 17, 023040. [Google Scholar] [CrossRef]
- Wickenbrock, A.; Zheng, H.; Bougas, L.; Leefer, N.; Afach, S.; Jarmola, A.; Acosta, V.M.; Budker, D. Microwave-free magnetometry with nitrogen-vacancy centers in diamond. Appl. Phys. Lett. 2016, 109, 053505. [Google Scholar] [CrossRef]
- Zheng, H.; Chatzidrosos, G.; Wickenbrock, A.; Bougas, L.; Lazda, R.; Berzins, A.; Gahbauer, F.H.; Auzinsh, M.; Ferber, R.; Budker, D. Level anti-crossing magnetometry with color centers in diamond. arXiv 2017, arXiv:1701.06838. [Google Scholar] [CrossRef]
- Zheng, H.; Sun, Z.; Chatzidrosos, G.; Zhang, C.; Nakamura, K.; Sumiya, H.; Ohshima, T.; Isoya, J.; Wrachtrup, J.; Wickenbrock, A.; et al. Microwave-Free Vector Magnetometry with Nitrogen-Vacancy Centers along a Single Axis in Diamond. Phys. Rev. Appl. 2020, 13, 044023. [Google Scholar] [CrossRef]
- Wunderlich, R.; Staacke, R.; Knolle, W.; Abel, B.; Meijer, J. Magnetic field and angle-dependent photoluminescence of a fiber-coupled nitrogen vacancy rich diamond. J. Appl. Phys. 2021, 130, 124901. [Google Scholar] [CrossRef]
- Dhungel, O.; Lenz, T.; Omar, M.; Rebeirro, J.S.; Ivady, V.; Gali, A.; Wickenbrock, A.; Budker, D. Zero-field microwave-free magnetometry with ensembles of nitrogen-vacancy centers in diamond. arXiv 2023, arXiv:2301.09666. [Google Scholar] [CrossRef]
- Duan, D.; Du, G.X.; Kavatamane, V.K.; Arumugam, S.; Tzeng, Y.K.; Chang, H.C.; Balasubramanian, G. Efficient nitrogen-vacancy centers’ fluorescence excitation and collection from micrometer-sized diamond by a tapered optical fiber in endoscope-type configuration. Opt. Express 2019, 27, 6734. [Google Scholar] [CrossRef]
- Chatzidrosos, G.; Rebeirro, J.S.; Zheng, H.; Omar, M.; Brenneis, A.; Stürner, F.M.; Fuchs, T.; Buck, T.; Rölver, R.; Schneemann, T.; et al. Fiberized Diamond-Based Vector Magnetometers. Front. Photon. 2021, 2, 732748. [Google Scholar] [CrossRef]
- Lai, N.D.; Zheng, D.; Jelezko, F.; Treussart, F.; Roch, J.F. Influence of a static magnetic field on the photoluminescence of an ensemble of nitrogen-vacancy color centers in a diamond single-crystal. Appl. Phys. Lett. 2009, 95, 133101. [Google Scholar] [CrossRef]
- Lakowicz, J.R. Principles of Fluorescence Spectroscopy, 3rd ed.; Springer: New York, NY, USA, 2010. [Google Scholar]
- Collins, A.T.; Thomaz, M.F.; Jorge, M.I.B. Luminescence decay time of the 1.945 eV centre in type Ib diamond. J. Phys. C Solid State Phys. 1983, 16, 2177–2181. [Google Scholar] [CrossRef]
- Lenef, A.; Brown, S.W.; Redman, D.A.; Rand, S.C.; Shigley, J.; Fritsch, E. Electronic structure of the N-V center in diamond: Experiments. Phys. Rev. B 1996, 53, 13427–13440. [Google Scholar] [CrossRef]
- Acosta, V.M.; Jarmola, A.; Bauch, E.; Budker, D. Optical properties of the nitrogen-vacancy singlet levels in diamond. arXiv 2010, arXiv:1009.0032. [Google Scholar] [CrossRef]
- Robledo, L.; Bernien, H.; van Weperen, I.; Hanson, R. Control and Coherence of the Optical Transition of Single Nitrogen Vacancy Centers in Diamond. Phys. Rev. Lett. 2010, 105, 177403. [Google Scholar] [CrossRef] [PubMed]
- Toyli, D.M.; Christle, D.J.; Alkauskas, A.; Buckley, B.B.; de Walle, C.G.V.; Awschalom, D.D. Persistence of Single Spin Coherence above 600K in Diamond. arXiv 2012, arXiv:1201.4420. [Google Scholar] [CrossRef]
- Khalid, A.; Chung, K.; Rajasekharan, R.; Lau, D.W.; Karle, T.J.; Gibson, B.C.; Tomljenovic-Hanic, S. Lifetime Reduction and Enhanced Emission of Single Photon Color Centers in Nanodiamond via Surrounding Refractive Index Modification. Sci. Rep. 2015, 5, 11179. [Google Scholar] [CrossRef] [PubMed]
- Storteboom, J.; Dolan, P.; Castelletto, S.; Li, X.; Gu, M. Lifetime investigation of single nitrogen vacancy centres in nanodiamonds. Opt. Express 2015, 23, 11327. [Google Scholar] [CrossRef] [PubMed]
- Batalov, A.; Zierl, C.; Gaebel, T.; Neumann, P.; Chan, I.Y.; Balasubramanian, G.; Hemmer, P.R.; Jelezko, F.; Wrachtrup, J. Temporal Coherence of Photons Emitted by Single Nitrogen-Vacancy Defect Centers in Diamond Using Optical Rabi-Oscillations. Phys. Rev. Lett. 2008, 100, 077401. [Google Scholar] [CrossRef] [PubMed]
- Robledo, L.; Bernien, H.; van der Sar, T.; Hanson, R. Spin dynamics in the optical cycle of single nitrogen-vacancy centres in diamond. New J. Phys. 2011, 13, 025013. [Google Scholar] [CrossRef]
- Fuchs, G.D.; Dobrovitski, V.V.; Toyli, D.M.; Heremans, F.J.; Weis, C.D.; Schenkel, T.; Awschalom, D.D. Excited-state spin coherence of a single nitrogen–vacancy centre in diamond. Nat. Phys. 2010, 6, 668–672. [Google Scholar] [CrossRef]
- Gupta, A.; Hacquebard, L.; Childress, L. Efficient signal processing for time-resolved fluorescence detection of nitrogen-vacancy spins in diamond. J. Opt. Soc. Am. B 2016, 33, B28. [Google Scholar] [CrossRef]
- Stürner, F.M.; Liu, Y.; Colard, P.O.; Markham, M.; Jelezko, F. Magnetometry based on the excited-state lifetimes of a single nitrogen-vacancy center in diamond. Appl. Phys. Lett. 2021, 119, 134001. [Google Scholar] [CrossRef]
- Epstein, R.J.; Mendoza, F.M.; Kato, Y.K.; Awschalom, D.D. Anisotropic interactions of a single spin and dark-spin spectroscopy in diamond. Nat. Phys. 2005, 1, 94–98. [Google Scholar] [CrossRef]
- Laube, C.; Temme, R.; Prager, A.; Griebel, J.; Knolle, W.; Abel, B. Fluorescence Lifetime Control of Nitrogen Vacancy Centers in Nanodiamonds for Long-Term Information Storage. ACS Nano 2023, 17, 15401–15410. [Google Scholar] [CrossRef]
- Laube, C.; Oeckinghaus, T.; Lehnert, J.; Griebel, J.; Knolle, W.; Denisenko, A.; Kahnt, A.; Meijer, J.; Wrachtrup, J.; Abel, B. Controlling the fluorescence properties of nitrogen vacancy centers in nanodiamonds. Nanoscale 2019, 11, 1770–1783. [Google Scholar] [CrossRef] [PubMed]
- Smith, B.R.; Gruber, D.; Plakhotnik, T. The effects of surface oxidation on luminescence of nano diamonds. Diam. Relat. Mater. 2010, 19, 314–318. [Google Scholar] [CrossRef]
- Laporte, G.; Psaltis, D. STED imaging of green fluorescent nanodiamonds containing nitrogen-vacancy-nitrogen centers. Biomed. Opt. Express 2016, 7, 34–44. [Google Scholar] [CrossRef] [PubMed]
- Inam, F.A.; Edmonds, A.M.; Steel, M.J.; Castelletto, S. Tracking emission rate dynamics of nitrogen vacancy centers in nanodiamonds. Appl. Phys. Lett. 2013, 102, 253109. [Google Scholar] [CrossRef]
- Fraczek, E.; Savitski, V.G.; Dale, M.; Breeze, B.G.; Diggle, P.; Markham, M.; Bennett, A.; Dhillon, H.; Newton, M.E.; Kemp, A.J. Laser spectroscopy of NV- and NV0 colour centres in synthetic diamond. Opt. Mater. Express 2017, 7, 2571. [Google Scholar] [CrossRef]
- Horsthemke, L.; Bischoff, C.; Glösekötter, P.; Burchard, B.; Staacke, R.; Meijer, J. A1.4 Highly Sensitive Compact Room Temperature Quantum Scalar Magnetometer. In Proceedings of the Sensor and Measurement Science International 2020, Nuremberg, Germany, 22–25 June 2020. [Google Scholar] [CrossRef]
- Wee, T.L.; Tzeng, Y.K.; Han, C.C.; Chang, H.C.; Fann, W.; Hsu, J.H.; Chen, K.M.; Yu, Y.C. Two-photon Excited Fluorescence of Nitrogen-Vacancy Centers in Proton-Irradiated Type Ib Diamond. J. Phys. Chem. A 2007, 111, 9379–9386. [Google Scholar] [CrossRef] [PubMed]
- Magaletti, S.; Mayer, L.; Roch, J.F.; Debuisschert, T. A quantum radio frequency signal analyzer based on nitrogen vacancy centers in diamond. Commun. Eng. 2022, 1, 19. [Google Scholar] [CrossRef]
- Fescenko, I.; Jarmola, A.; Savukov, I.; Kehayias, P.; Smits, J.; Damron, J.; Ristoff, N.; Mosavian, N.; Acosta, V.M. Diamond magnetometer enhanced by ferrite flux concentrators. Phys. Rev. Res. 2020, 2, 023394. [Google Scholar] [CrossRef]
- Takada, K.; Katsumi, R.; Yatsui, T. Sensitivity improvement of a single-NV diamond magnetometer using a chiral waveguide. Opt. Express 2023, 32, 795. [Google Scholar] [CrossRef]
- Alem, M. Noise Analysis of Signal Components. 2017. Available online: https://www.zhinst.com/europe/en/blogs/noise-analysis-signal-components (accessed on 18 December 2023).
- Haykin, S.S. Communication Systems, 4th ed.; Wiley: New York, NY, USA, 2001. [Google Scholar]
- Dharmawansa, P.; Rajatheva, N.; Tellambura, C. Envelope and phase distribution of two correlated gaussian variables. IEEE Trans. Commun. 2009, 57, 915–921. [Google Scholar] [CrossRef]
- The mpmath Development Team. mpmath: A Python Library for Arbitrary-Precision Floating-Point Arithmetic (Version 1.3.0). 2023. Available online: https://mpmath.org/ (accessed on 19 December 2023).
Disclaimer/Publisher’s Note: The statements, opinions and data contained in all publications are solely those of the individual author(s) and contributor(s) and not of MDPI and/or the editor(s). MDPI and/or the editor(s) disclaim responsibility for any injury to people or property resulting from any ideas, methods, instructions or products referred to in the content. |
© 2024 by the authors. Licensee MDPI, Basel, Switzerland. This article is an open access article distributed under the terms and conditions of the Creative Commons Attribution (CC BY) license (https://creativecommons.org/licenses/by/4.0/).