
A Miniaturized and Ultra-Low-Power Wireless Multi-Parameter Monitoring System with Self-Powered Ability for Aircraft Smart Skin

Abstract
1. Introduction
2. Basic Principles of ASS-Based Aircraft Multi-Parameter Monitoring
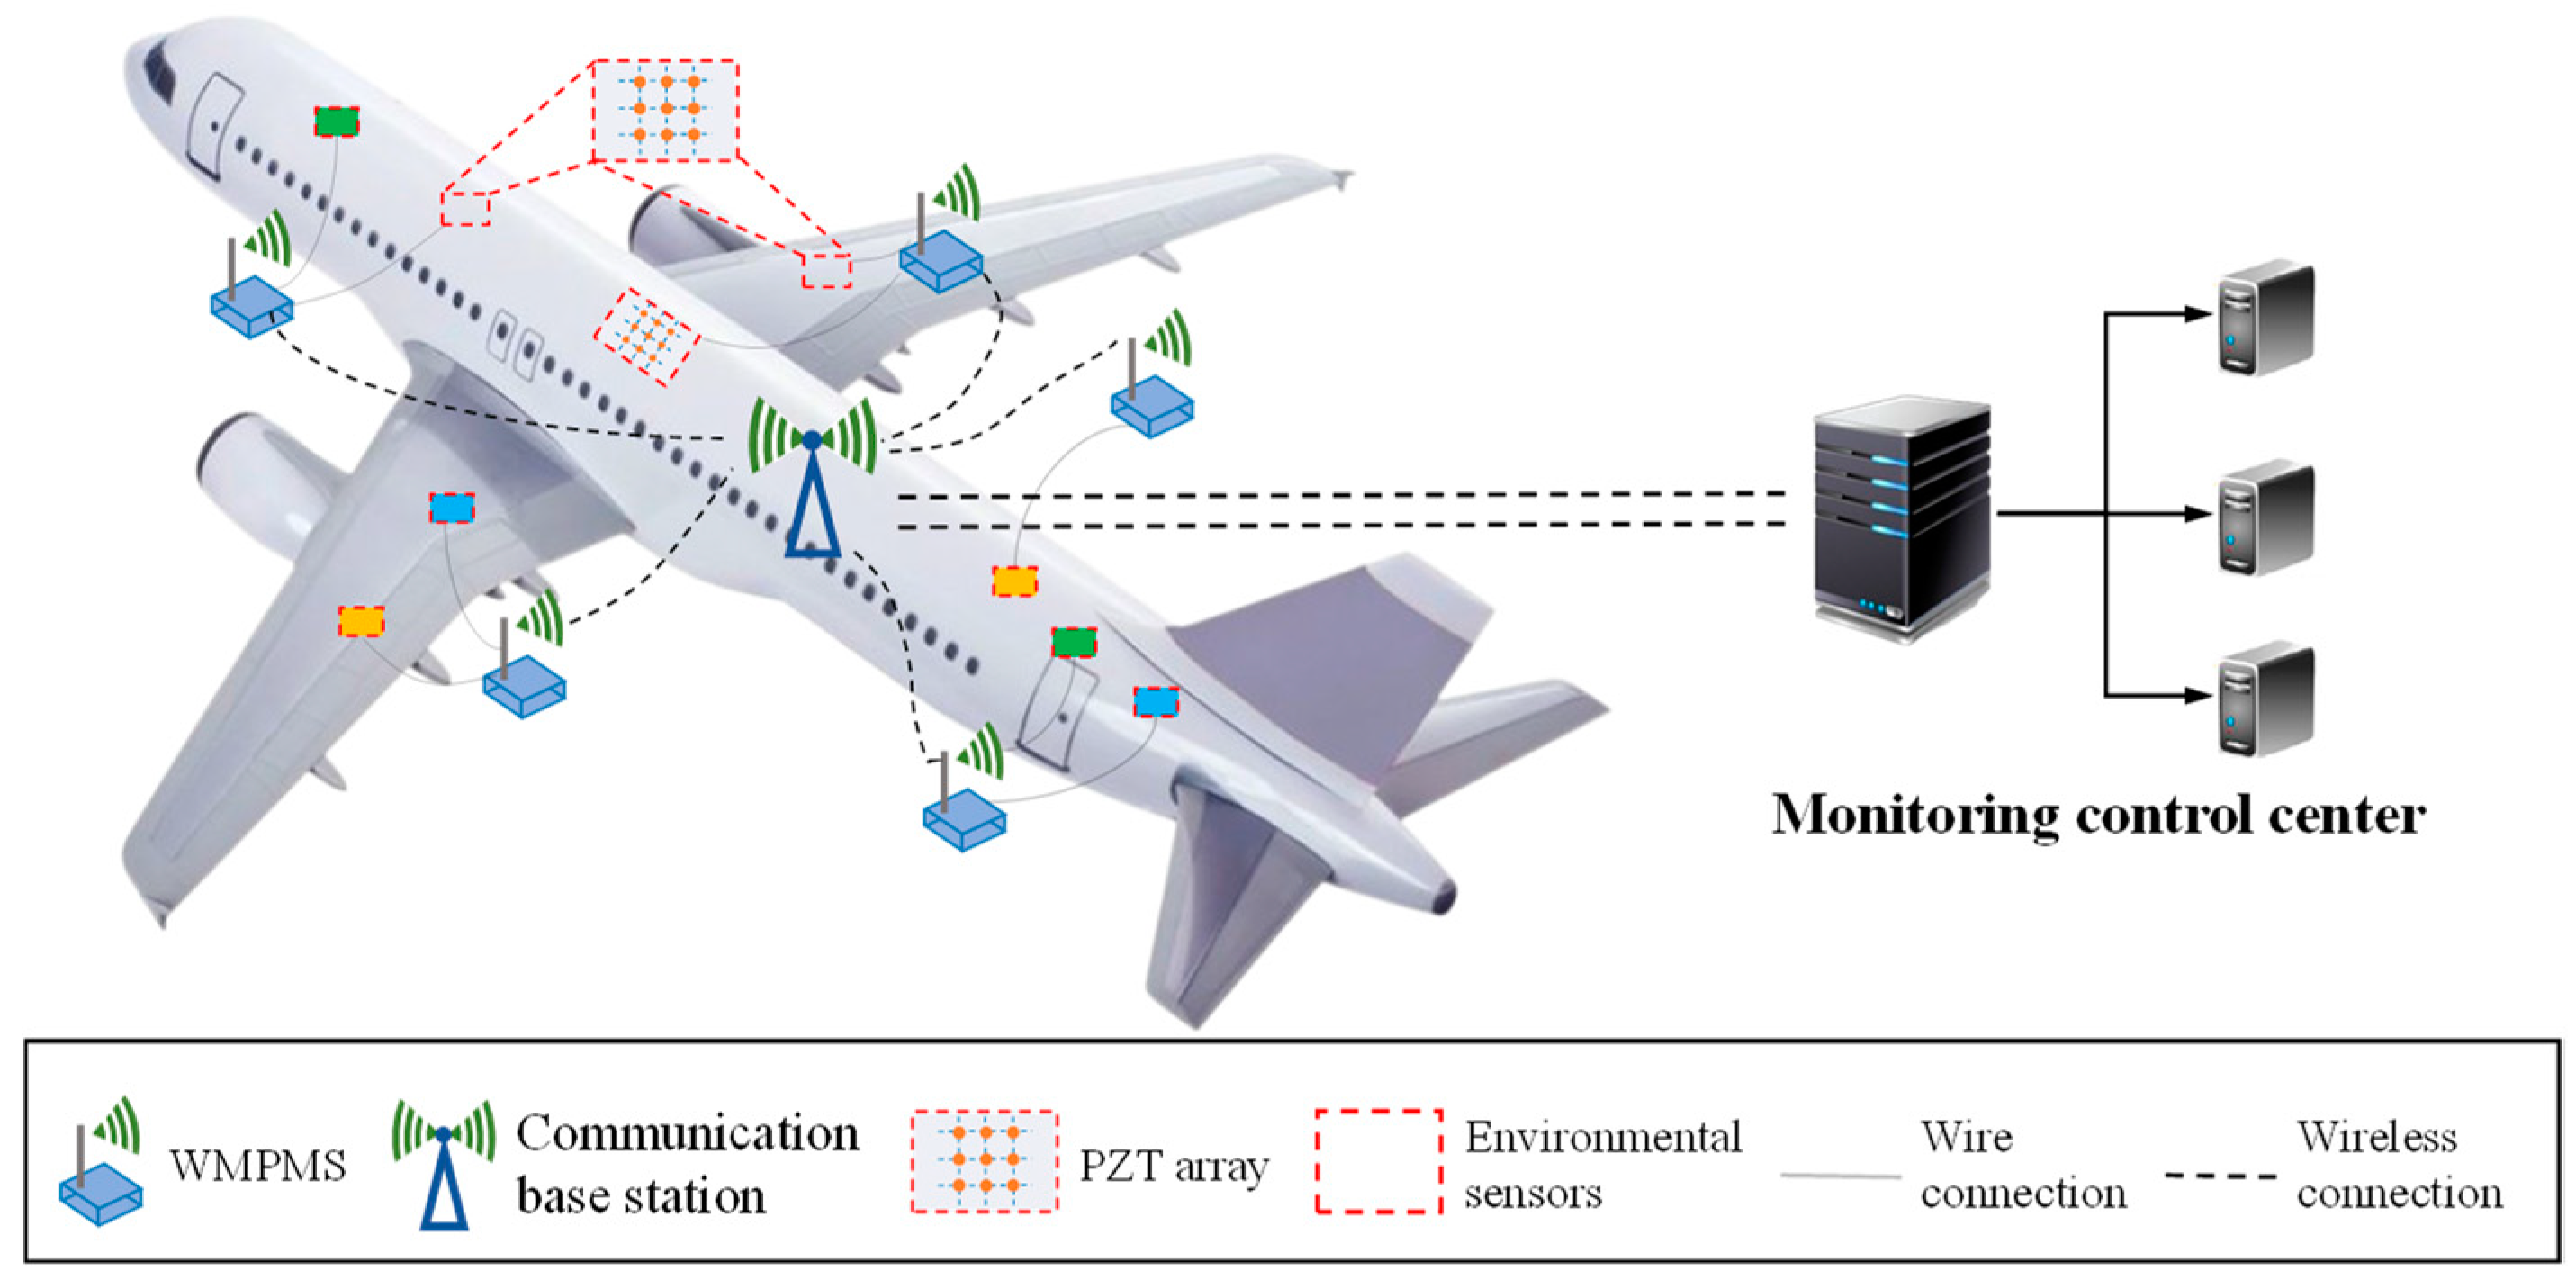
2.1. ASS Multi-Parameter Monitoring Architecture
2.2. All-Digital Multi-Parameter Monitoring
3. Design of the WMPMS
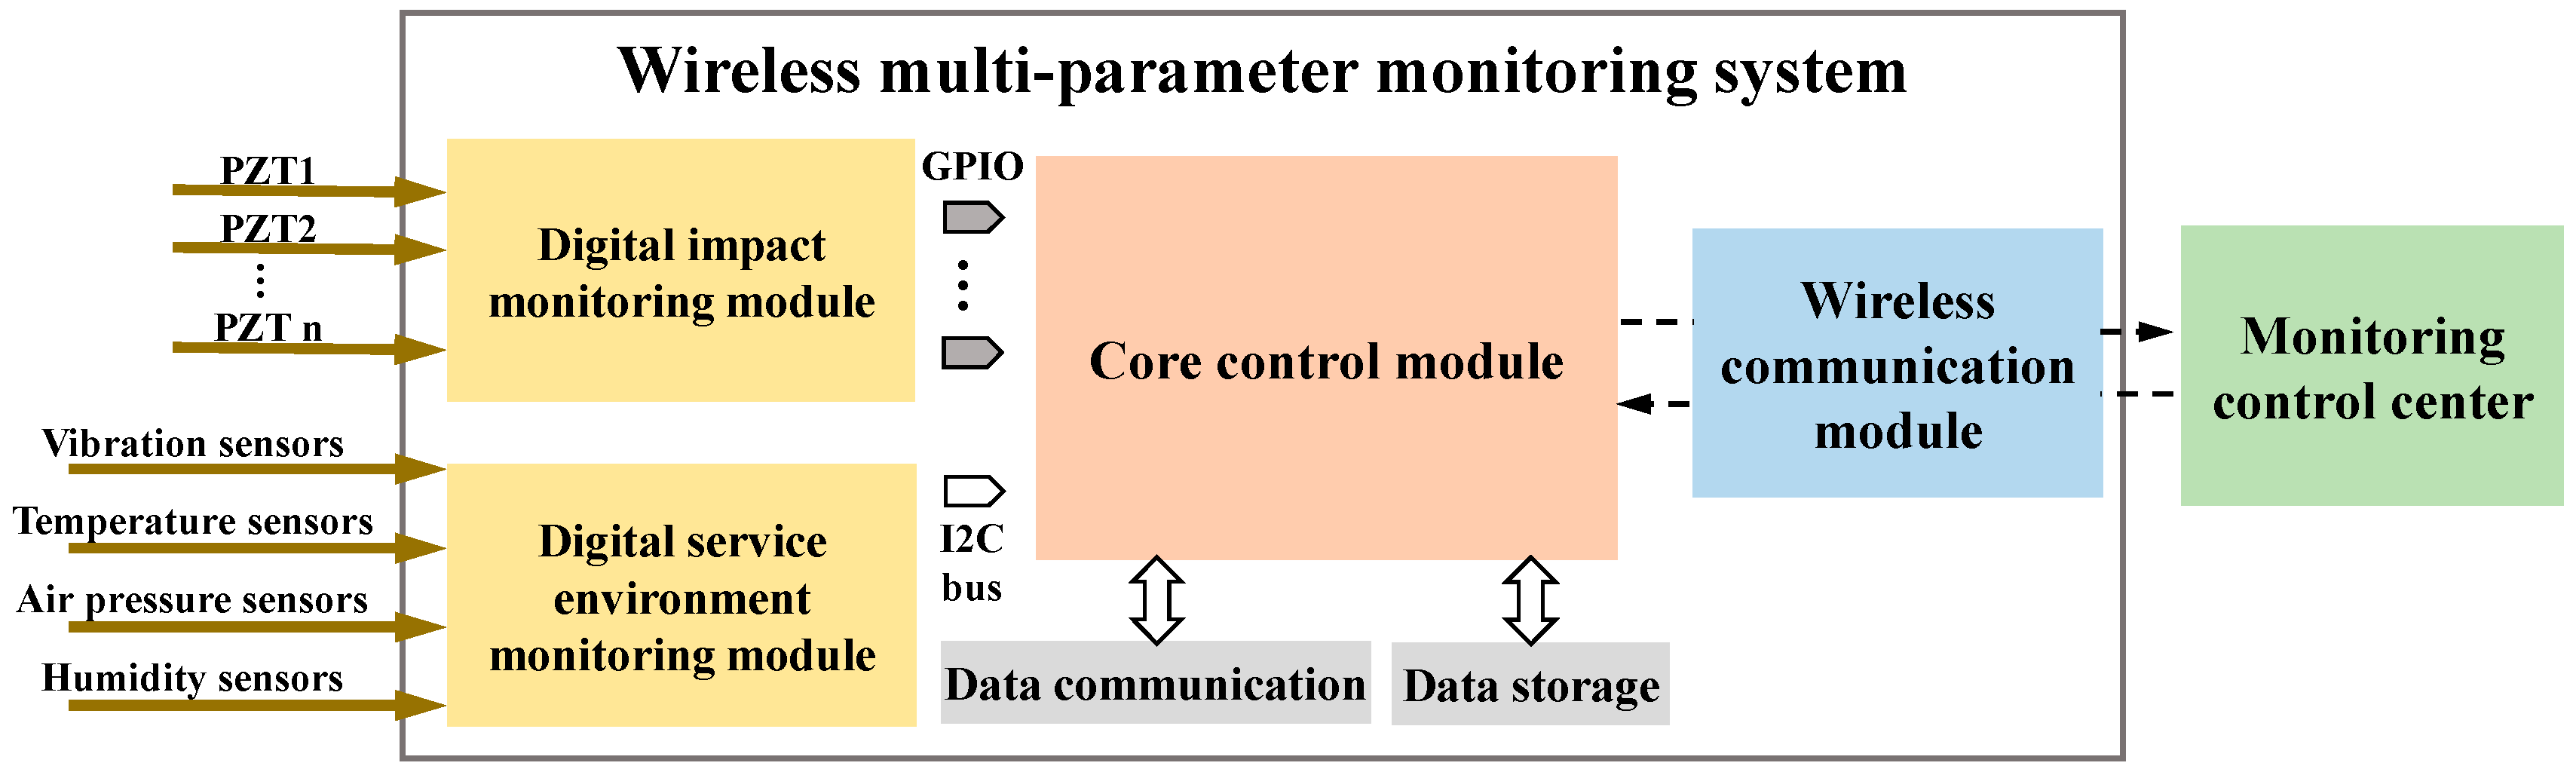
3.1. Hardware Design
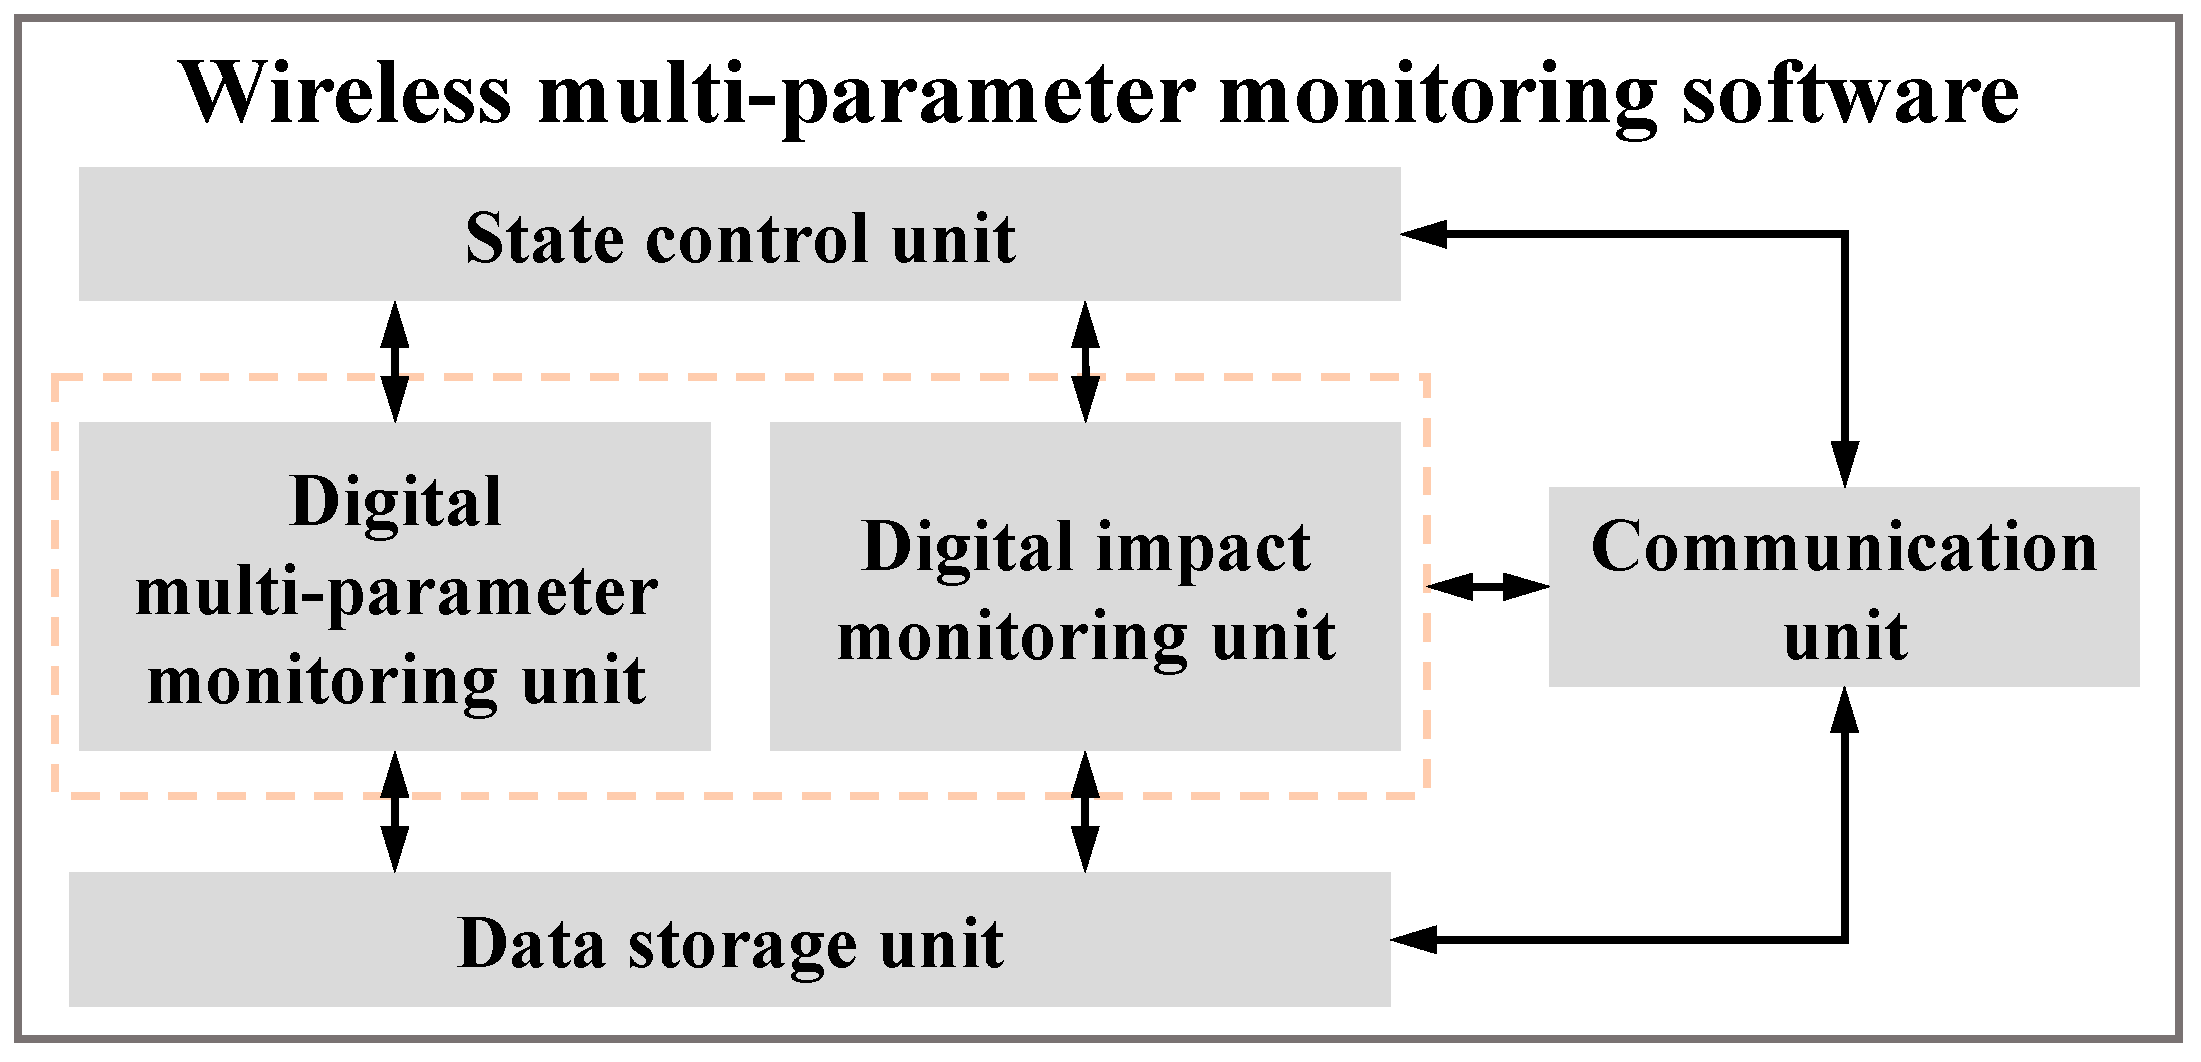
3.2. Software Design
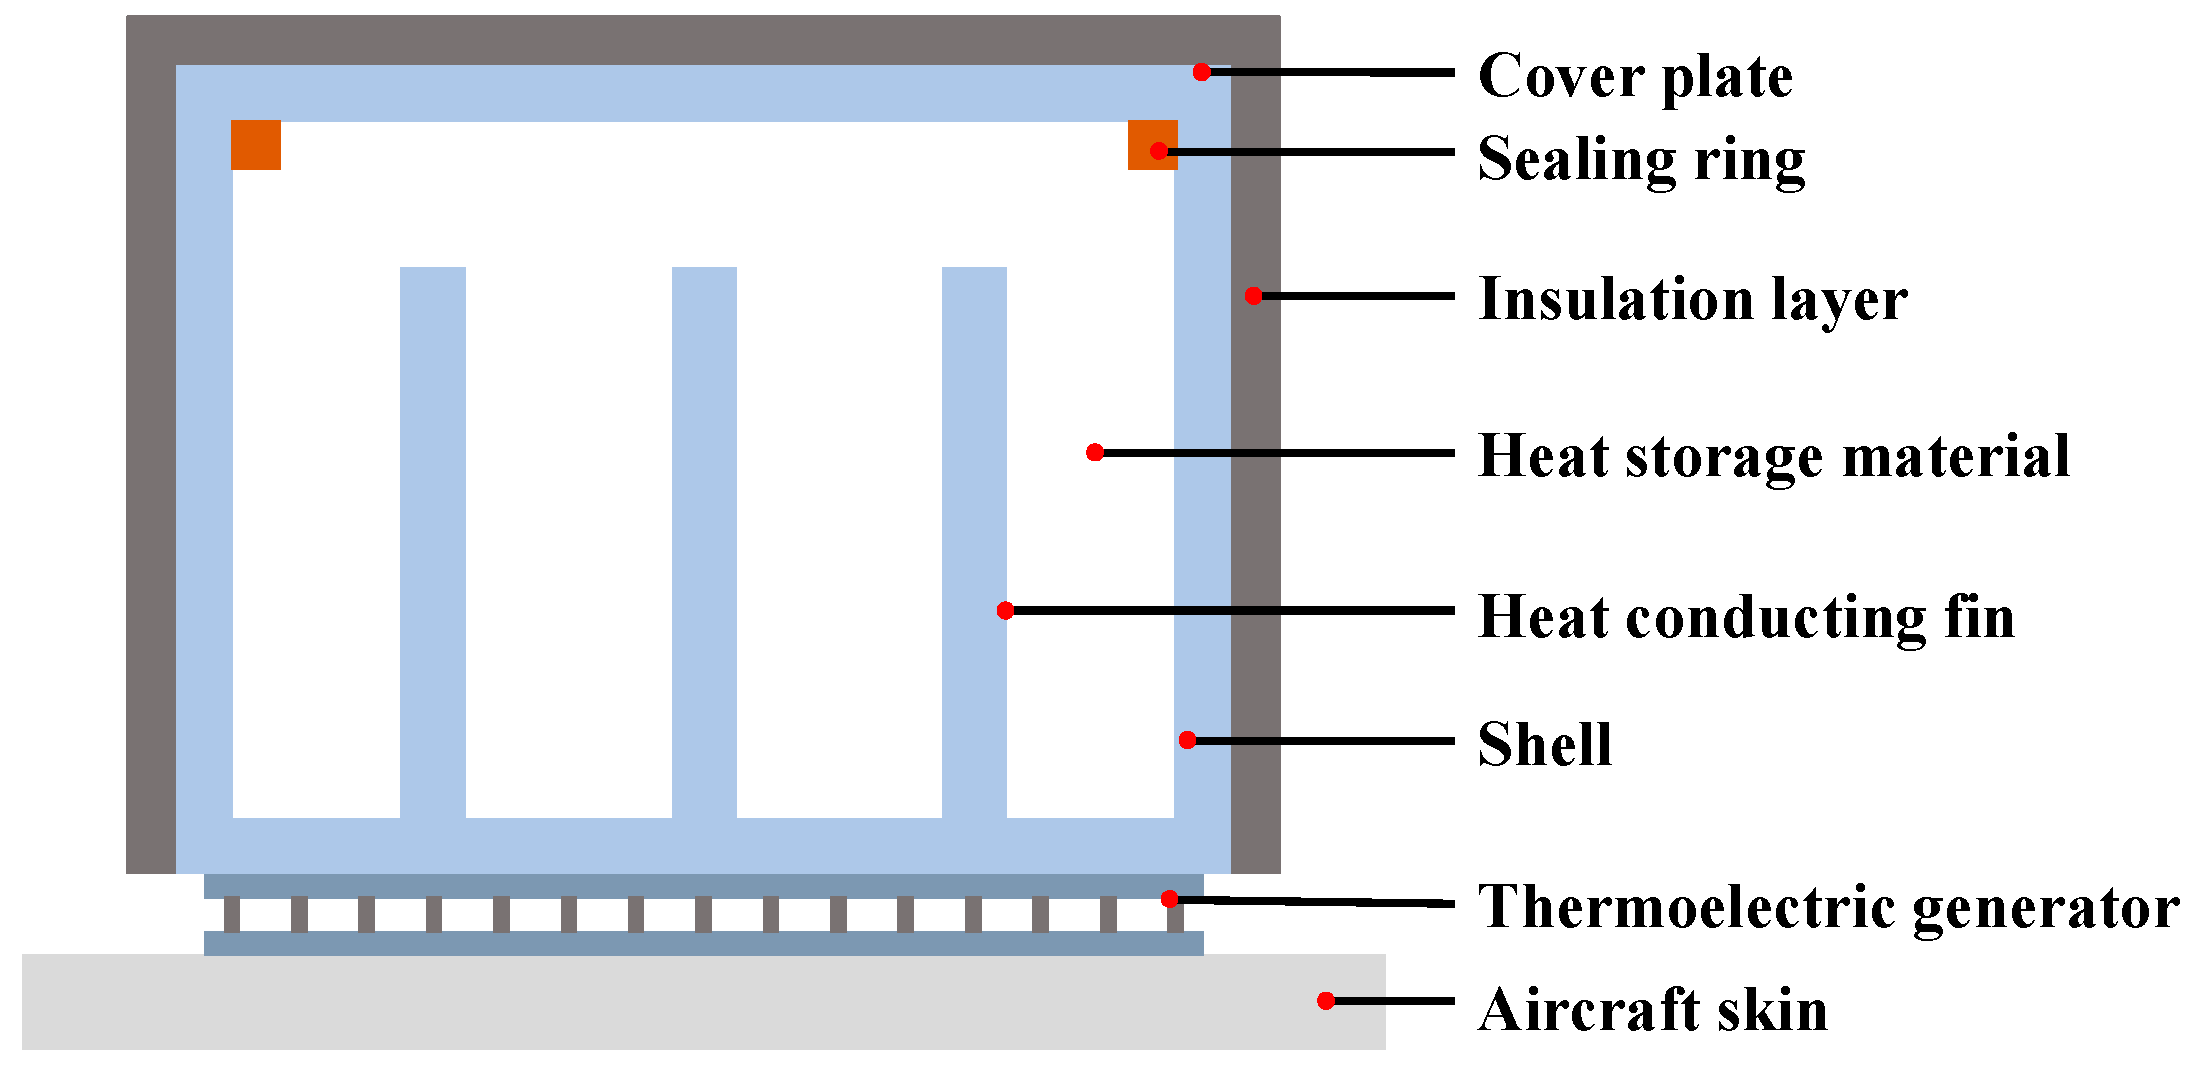
4. Development of the Energy Self-Supply Module
5. System Verification
5.1. Multi-Parameter Monitoring Function Verification
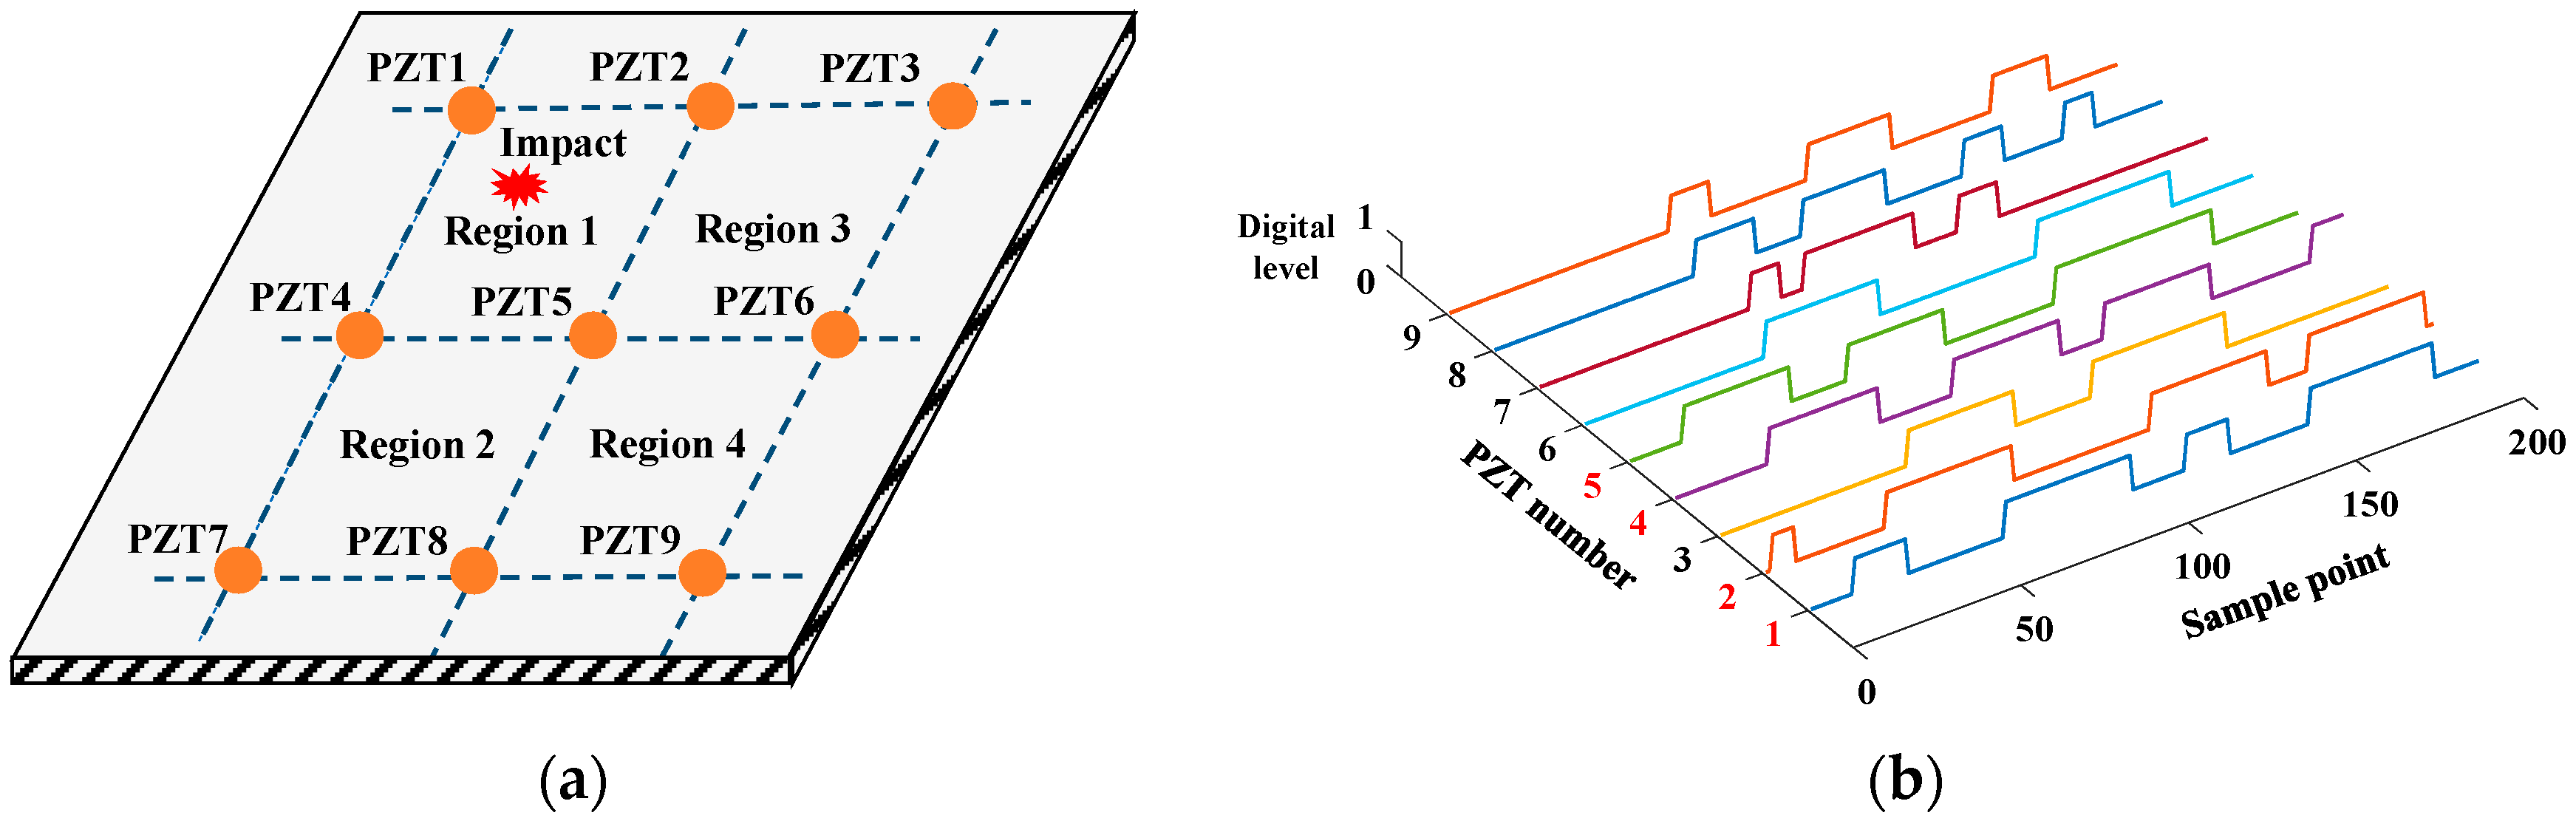
5.1.1. Impact Monitoring Verification
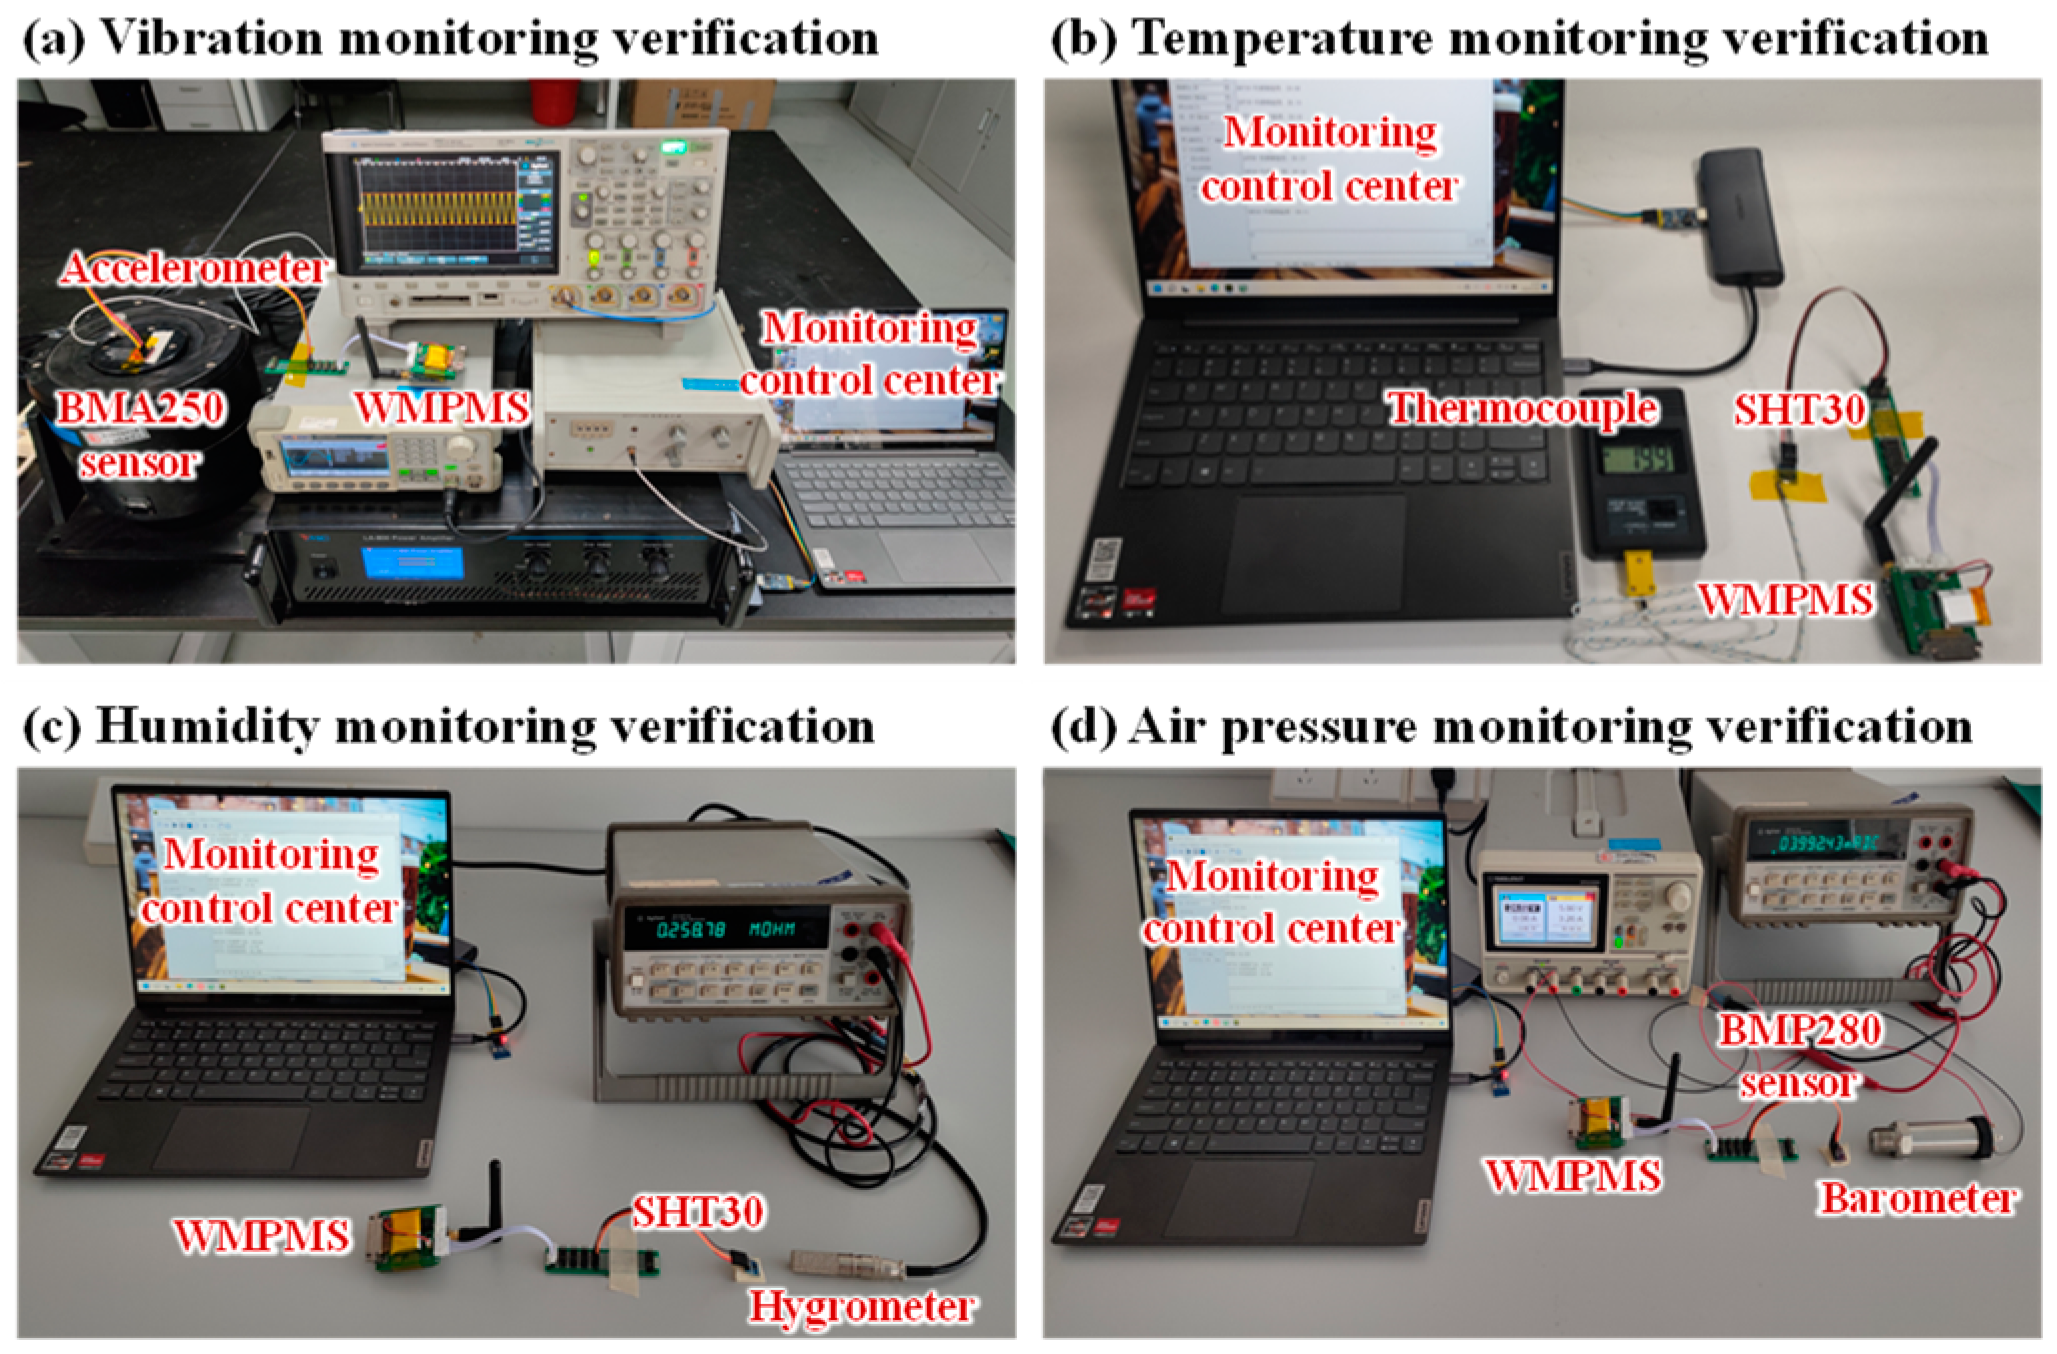
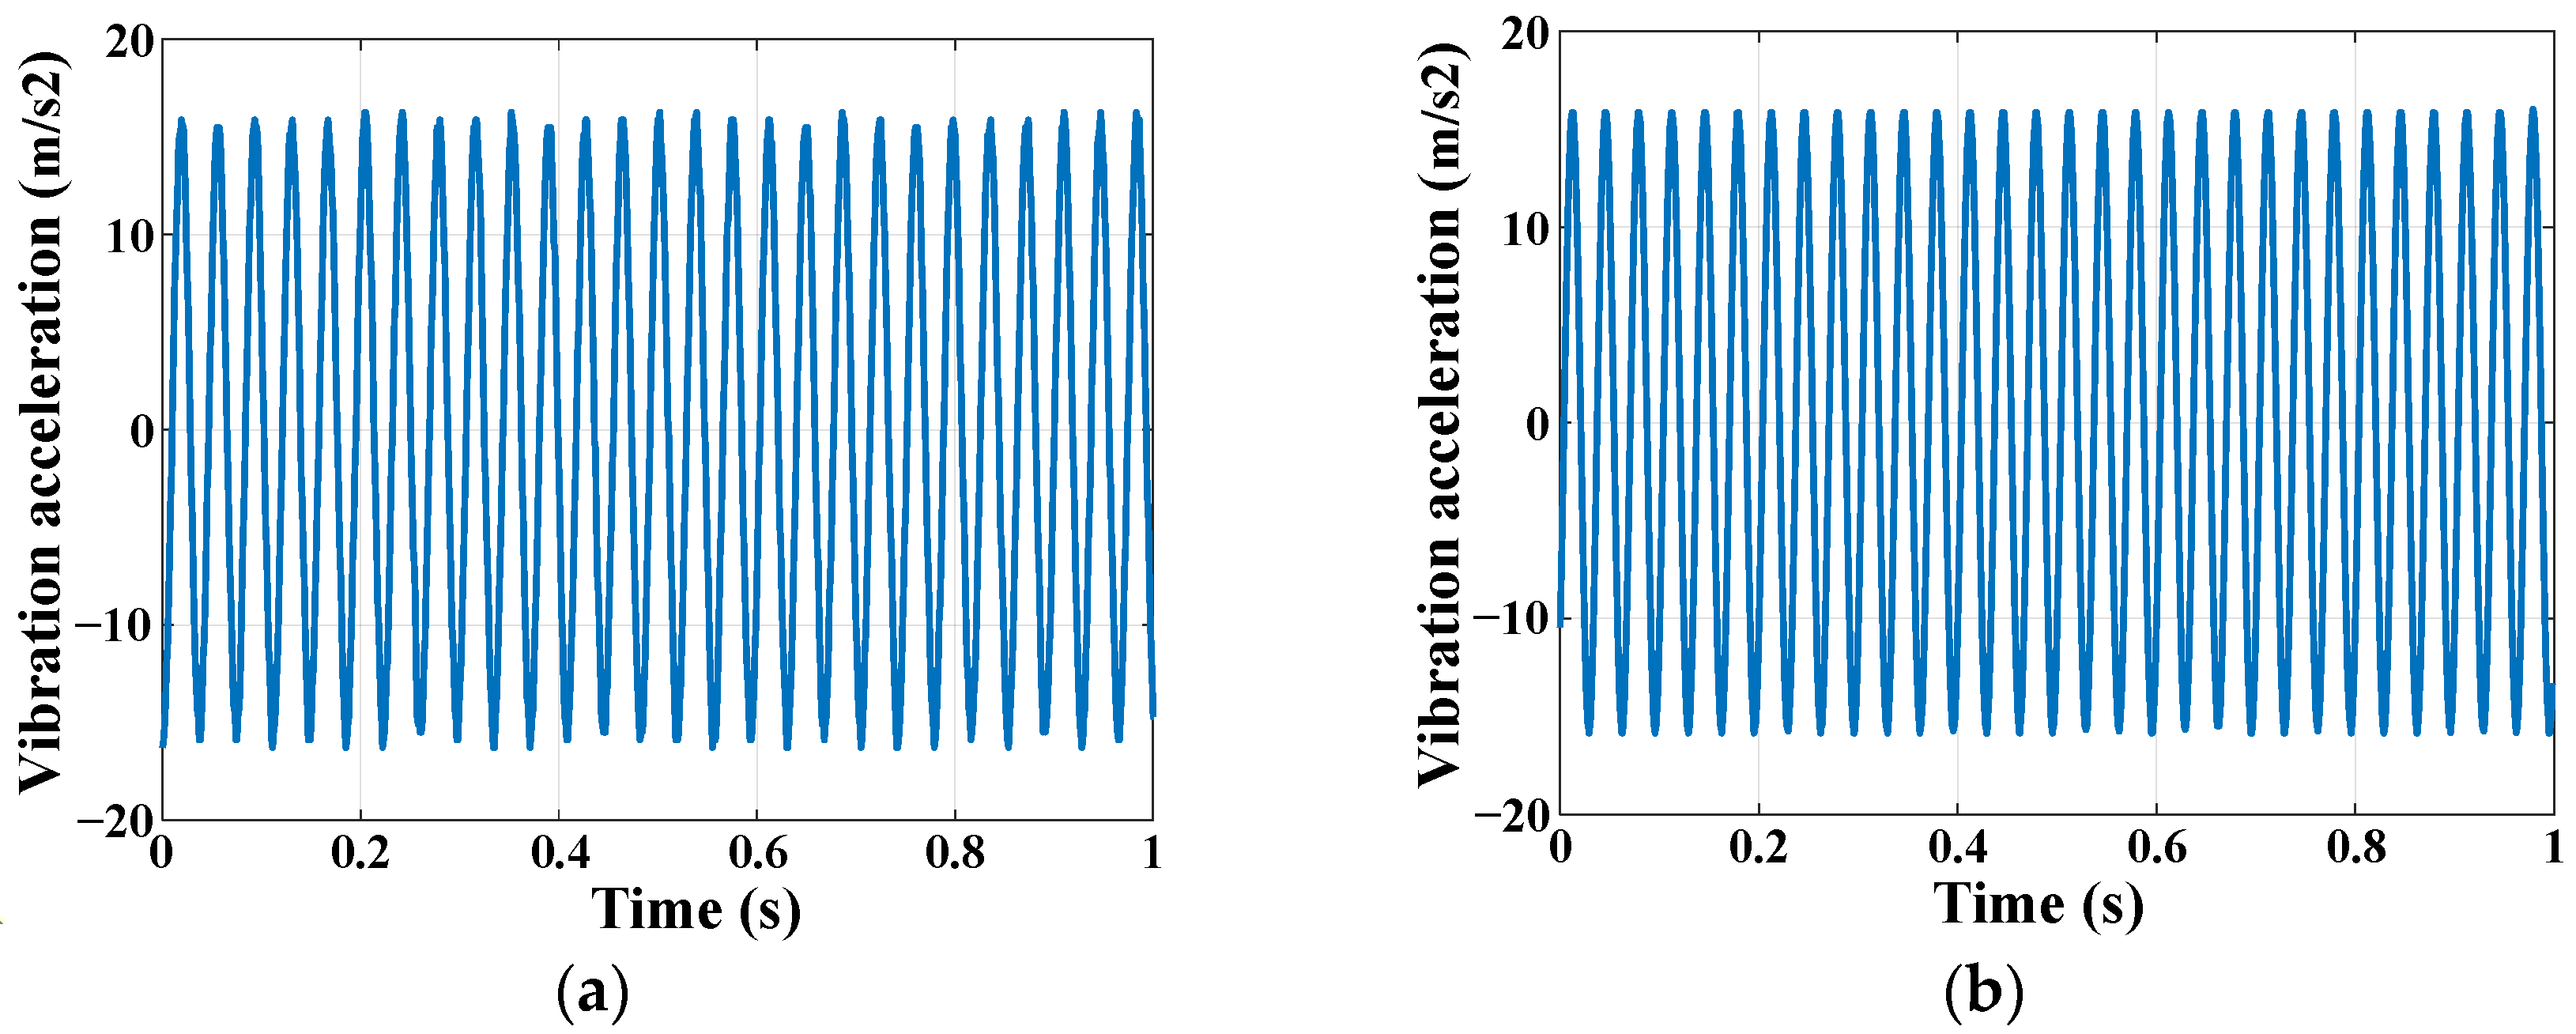
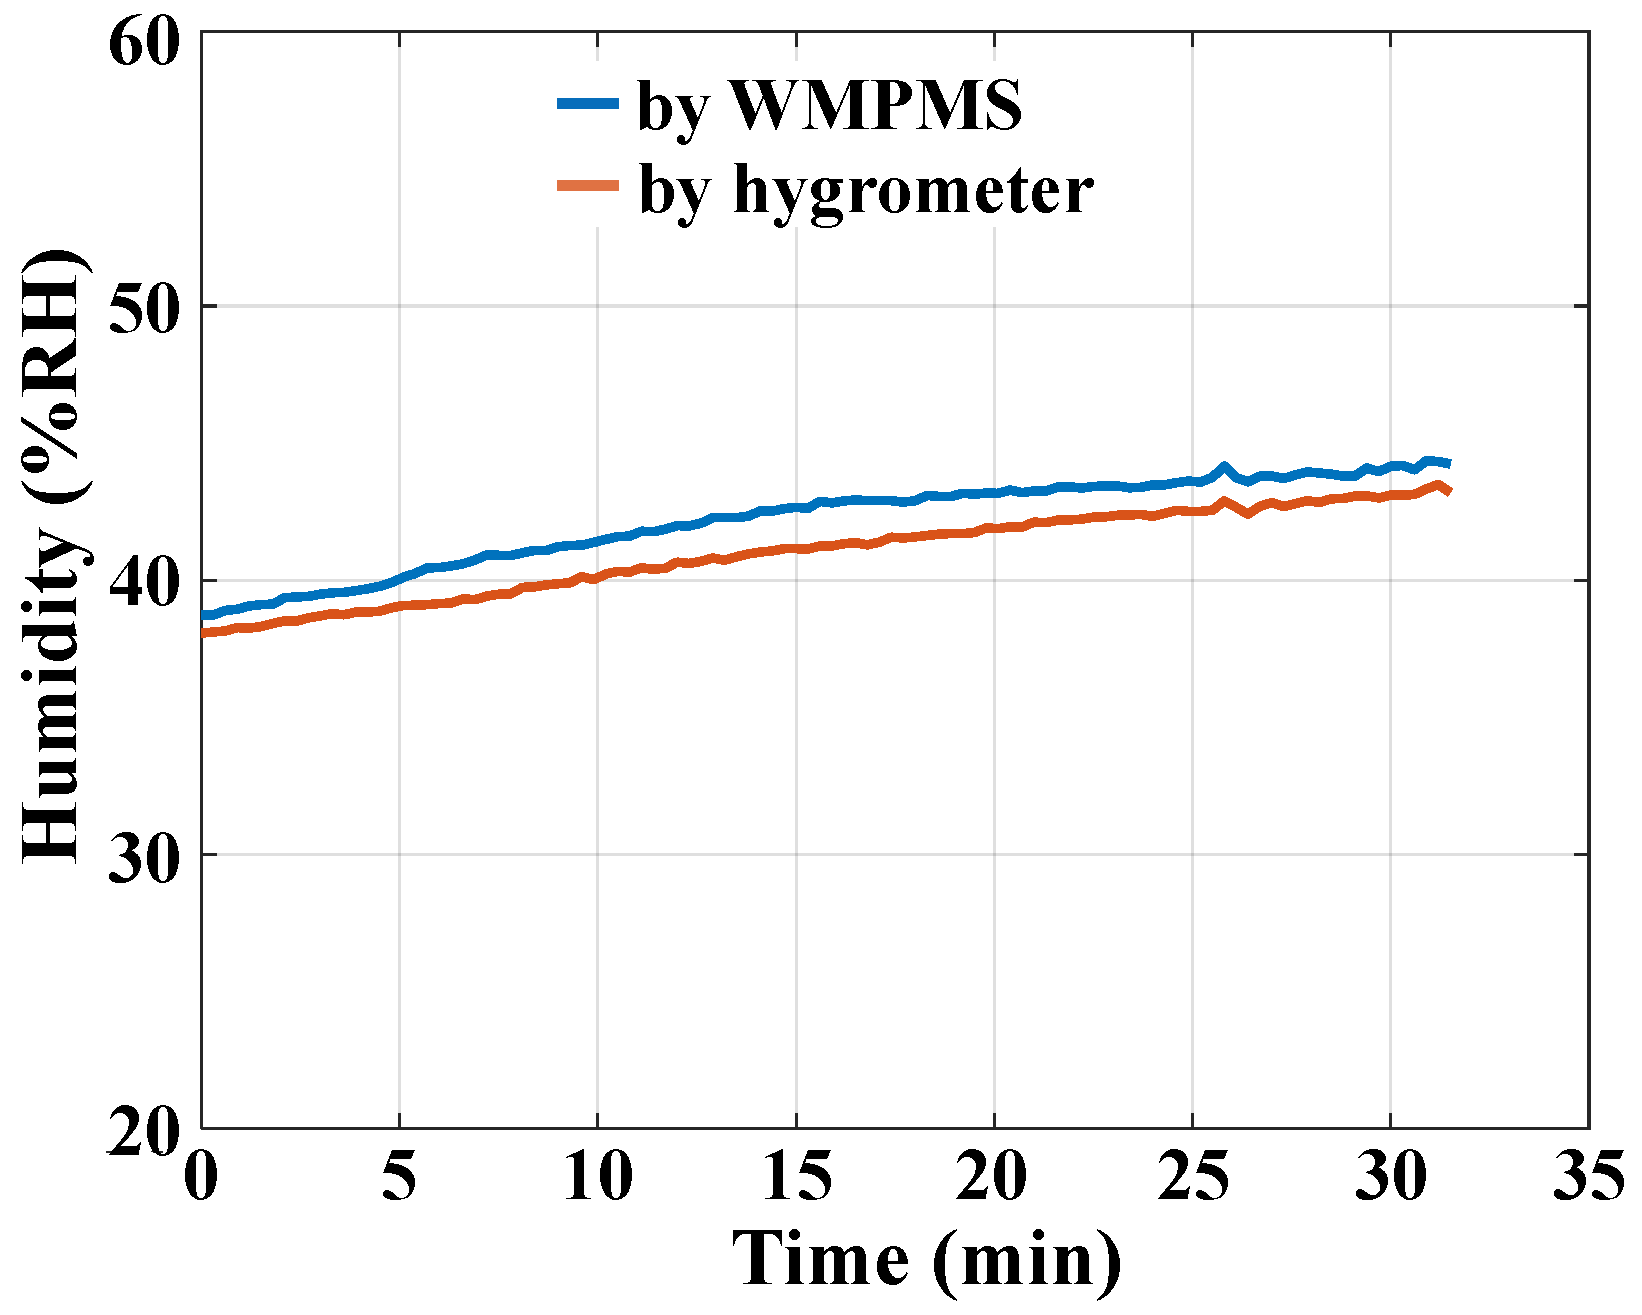
5.1.2. Environmental Monitoring Verification
5.2. System Power Consumption Evaluation
5.3. Energy Self-Supply Verification
5.4. Composite Unmanned Aerial Vehicle Monitoring Verification
5.4.1. Experimental Setup
5.4.2. Experimental Verification Results
6. Conclusions
- (1)
- The monitoring system developed in this paper is only in the stage of completing the method and function verification. In the future, for more complex monitoring environments, whether the performance and reliability of the system can meet the monitoring requirements needs to be further tested, for example, by testing for a larger data processing capacity and higher data transmission speed.
- (2)
- At present, the functional verification of monitoring systems is carried out in the ideal laboratory environment, without considering external interferences that may exist in the actual environment. In the future, the performance of the monitoring system should be evaluated and improved according to the actual application conditions. In terms of hardware, performance and stability should be considered, while in terms of software, operational efficiency and accuracy should be considered, as well as the iterative optimization of monitoring methods.
- (3)
- As a structural health monitoring device with wireless communication capability, the developed WMPMS has scalability. An important research question that remains is how to organize multiple systems through network design to carry out multi-parameter data fusion monitoring and realize the large-scale, multi-point, and multi-directional monitoring of an aircraft.
Author Contributions
Funding
Data Availability Statement
Conflicts of Interest
References
- McEvoy, M.A.; Correll, N. Materials that couple sensing, actuation, computation, and communication. Science 2015, 347, 1261689. [Google Scholar] [CrossRef] [PubMed]
- Ren, H.L.; Yang, X.D.; Wang, Z.H.; Xu, X.G.; Wang, R.; Ge, Q.; Xiong, Y. Smart structures with embedded flexible sensors fabricated by fused deposition modeling-based multimaterial 3D printing. Int. J. Smart Nano Mater. 2022, 13, 447–464. [Google Scholar] [CrossRef]
- Wang, Y.; Hu, S.G.; Xiong, T.; Huang, Y.A.; Qiu, L. Recent progress in aircraft smart skin for structural health monitoring. Struct. Health Monit. 2022, 21, 2453–2480. [Google Scholar] [CrossRef]
- Dey, S.; Bhattacharyya, R.; Sarma, S.E.; Karmakar, N.C. A novel “smart skin” sensor for chipless RFID-based structural health monitoring applications. IEEE Internet Things J. 2020, 8, 3955–3971. [Google Scholar] [CrossRef]
- Yang, Y.; Chiesura, G.; Plovie, B.; Vervust, T.; Luyckx, G.; Degrieck, J.; Sekitani, T.; Vanfleteren, J. Design and integration of flexible sensor matrix for in situ monitoring of polymer composites. ACS Sens. 2018, 3, 1698–1705. [Google Scholar] [CrossRef] [PubMed]
- Suzuki, Y.; Suzuki, T.; Todoroki, A.; Mizutani, T. Smart lightning protection skin for real-time load monitoring of composite aircraft structures under multiple impacts. Compos. Part A Appl. Sci. Manuf. 2014, 67, 44–54. [Google Scholar] [CrossRef]
- Wang, C.; Dudley, K.; Szatkowski, G. Open circuit resonant (SansEC) sensor for composite damage detection and diagnosis in aircraft lightning environments. In Proceedings of the 4th AIAA Atmospheric and Space Environments Conference, New Orleans, LA, USA, 25–28 June 2012. [Google Scholar]
- Lin, M.; Chang, F.K. The manufacture of composite structures with a built-in network of piezoceramics. Compos. Sci. Technol. 2002, 62, 919–939. [Google Scholar] [CrossRef]
- Ren, Y.Q.; Zhang, S.F.; Yuan, S.F.; Qiu, L. In-situ integration and performance verification of large-scale PZT network for composite aerospace structure. Smart Mater. Struct. 2023, 32, 055010. [Google Scholar] [CrossRef]
- Xiong, W.N.; Zhu, C.; Guo, D.L.; Hou, C.; Yang, Z.X.; Xu, Z.Y.; Qiu, L.; Yang, H.; Li, K.; Huang, Y.A. Bio-inspired, intelligent flexible sensing skin for multifunctional flying perception. Nano Energy 2021, 90, 106550. [Google Scholar] [CrossRef]
- Wang, Y.; Qiu, L.; Luo, Y.J.; Ding, R. A stretchable and large-scale guided wave sensor network for aircraft smart skin of structural health monitoring. Struct. Health Monit. 2021, 20, 861–876. [Google Scholar] [CrossRef]
- Kopsaftopoulos, F.; Nardari, R.; Li, Y.H.; Chang, F.K. A stochastic global identification framework for aerospace structures operating under varying flight states. Mech. Syst. Signal Process. 2018, 98, 425–447. [Google Scholar] [CrossRef]
- Sharp, N.; Kuntz, A.; Brubaker, C.; Amos, S.; Gao, W.; Gupta, G.; Mohite, A.; Farrar, C.; Mascareñas, D. A bio-inspired asynchronous skin system for crack detection applications. Smart Mater. Struct. 2014, 23, 055020. [Google Scholar] [CrossRef]
- Zhao, D.; Liu, T.; Zhang, M.; Liang, R.; Wang, B. Fabrication and characterization of aerosol-jet printed strain sensors for multifunctional composite structures. Smart Mater. Struct. 2012, 21, 115008. [Google Scholar] [CrossRef]
- Blumenthal, T.; Fratello, V.; Nino, G.; Ritala, K. Conformal printing of sensors on 3D and flexible surfaces using aerosol jet deposition. In Proceedings of the SPIE Smart Structures and Materials + Nondestructive Evaluation and Health Monitoring, San Diego, CA, USA, 10–14 March 2013. [Google Scholar]
- Qiu, L.; Lin, X.D.; Yuan, S.F.; Shi, W.L. A lightweight system with ultralow-power consumption for online continuous impact monitoring of aerospace vehicle structures. IEEE Trans. Ind. Electron. 2020, 68, 5281–5292. [Google Scholar] [CrossRef]
- Krichen, D.; Abdallah, W.; Boudriga, N. On the design of an embedded wireless sensor network for aircraft vibration monitoring using efficient game theoretic based MAC protocol. Ad Hoc Netw. 2017, 61, 1–15. [Google Scholar] [CrossRef]
- Kim, J.H.; Park, Y.; Kim, Y.Y.; Shrestha, P.; Kim, C.G. Aircraft health and usage monitoring system for in-flight strain measurement of a wing structure. Smart Mater. Struct. 2015, 24, 105003. [Google Scholar] [CrossRef]
- Kwon, H.; Park, Y.; Kim, J.H.; Kim, C.G. Embedded fiber Bragg grating sensor–based wing load monitoring system for composite aircraft. Struct. Health Monit. 2019, 18, 1337–1351. [Google Scholar] [CrossRef]
- Jiang, X.; Li, Y.C.; Wang, J.; Li, J.C. Electromechanical modeling and experimental analysis of a compression-based piezoelectric vibration energy harvester. Int. J. Smart Nano Mater. 2014, 5, 152–168. [Google Scholar] [CrossRef]
- Gao, X.Z.; Hou, Z.X.; Guo, Z.; Chen, X.Q. Reviews of methods to extract and store energy for solar-powered aircraft. Renew. Sust. Energ. Rev. 2015, 44, 96–108. [Google Scholar] [CrossRef]
- Junior, O.H.A.; Maran, A.L.O.; Henao, N.C. A review of the development and applications of thermoelectric microgenerators for energy harvesting. Renew. Sust. Energ. Rev. 2018, 91, 376–393. [Google Scholar] [CrossRef]
- Allmen, L.V.; Bailleul, G.; Becker, T.; Decotignie, J.D.; Kiziroglou, M.E.; Leroux, C.; Mitcheson, P.D.; Müller, J.; Piguet, D.; Toh, T.T.; et al. Aircraft strain WSN powered by heat storage harvesting. IEEE Trans. Ind. Electron. 2017, 64, 7284–7292. [Google Scholar] [CrossRef]
- Elefsiniotis, A.; Becker, T.; Schmid, U. Thermoelectric energy harvesting using phase change materials (PCMs) in high temperature environments in aircraft. J. Electron. Mater. 2014, 43, 1809–1814. [Google Scholar] [CrossRef]
- Samson, D.; Kluge, M.; Becker, T.; Schmid, U. Wireless sensor node powered by aircraft specific thermoelectric energy harvesting. Sens. Actuators A Phys. 2011, 172, 240–244. [Google Scholar] [CrossRef]
- Featherston, C.A.; Holford, K.M.; Waring, G. Thermoelectric energy harvesting for wireless sensor systems in aircraft. Key Eng. Mater. 2009, 413, 487–494. [Google Scholar] [CrossRef]
- Fu, H.L.; Khodaei, Z.S.; Aliabadi, M.H.F. An event-triggered energy-efficient wireless structural health monitoring system for impact detection in composite airframes. IEEE Internet Things J. 2018, 6, 1183–1192. [Google Scholar] [CrossRef]
- Abbas, M.; Shafiee, M. Structural health monitoring (SHM) and determination of surface defects in large metallic structures using ultrasonic guided waves. Sensors 2018, 18, 3958. [Google Scholar] [CrossRef] [PubMed]
- Capineri, L.; Bulletti, A. Ultrasonic guided-waves sensors and integrated structural health monitoring systems for impact detection and localization: A review. Sensors 2021, 21, 2929. [Google Scholar] [CrossRef]
- Muller, A.; Robertson-Welsh, B.; Gaydecki, P.; Gresil, M.; Soutis, C. Structural health monitoring using lamb wave reflections and total focusing method for image reconstruction. Appl. Compos. Mater. 2017, 24, 553–573. [Google Scholar] [CrossRef]
- Muttillo, M.; Stornelli, V.; Alaggio, R.; Paolucci, R.; Battista, L.D.; Rubeis, T.; Ferri, G. Structural health monitoring: An IoT sensor system for structural damage indicator evaluation. Sensors 2020, 20, 4908. [Google Scholar] [CrossRef]
- Aleman, M.A.; Gopalarathnam, A.; Granlund, K. Novel Surface Flow-Reversal Sensor Applied to Detection of Airfoil Stall. J. Aircr. 2022, 59, 1382–1389. [Google Scholar] [CrossRef]
- Nguyen, V.; Dugenske, A. An I2C based architecture for monitoring legacy manufacturing equipment. Manuf. Lett. 2018, 15, 67–70. [Google Scholar] [CrossRef]
- Yuan, S.F.; Liu, P.P.; Qiu, L. A miniaturized composite impact monitor and its evaluation research. Sens. Actuators A Phys. 2012, 184, 182–192. [Google Scholar] [CrossRef]
- Gao, S.; Dai, X.; Hang, Y.; Guo, Y.; Ji, Q. Airborne wireless sensor networks for airplane monitoring system. Wirel. Commun. Mob. Comput. 2018, 2018, 6025825. [Google Scholar] [CrossRef]
- Nardo, M.D.; Yu, H. Intelligent ventilation systems in mining engineering: Is ZigBee WSN technology the best choice? Appl. Syst. Innov. 2021, 4, 42. [Google Scholar] [CrossRef]
- Qiu, L.; Yuan, S.F.; Liu, P.P.; Qian, W.F. Design of an All-Digital Impact Monitoring System for Large-Scale Composite Structures. IEEE Trans. Instrum. Meas. 2013, 62, 1990–2022. [Google Scholar] [CrossRef]


| PZT Number | PZT 1 | PZT 2 | PZT 3 | PZT 4 | PZT 5 | PZT 6 | PZT 7 | PZT 8 | PZT 9 |
|---|---|---|---|---|---|---|---|---|---|
| RWS | 2165 | 2394 | 912 | 2001 | 2801 | 1003 | 528 | 603 | 342 |
| Region Number | Region 1 | Region 2 | Region 3 | Region 4 |
|---|---|---|---|---|
| RWS | 9361 | 7110 | 5933 | 4749 |
| Working Mode | Voltage (V) | Current (mA) | Power Consumption (mW) | Duration (s) (Every 10 s) |
|---|---|---|---|---|
| Sleep | 3.3 | 0.86 | 2.84 | >9.5 |
| Impact monitoring | 3.3 | 1.65 | 5.45 | <0.1 |
| Vibration monitoring | 3.3 | 1.16 | 3.83 | 10 |
| Temperature and humidity monitoring | 3.3 | 1.26 | 4.16 | <0.1 |
| Air pressure monitoring | 3.3 | 1.21 | 3.99 | <0.1 |
| Wireless communication | 3.3 | 28.06 | 92.6 | <0.1 |
| Impact Regions | Impact Times | Correct Location Times | Accuracy |
|---|---|---|---|
| 1 | 20 | 20 | 100% |
| 2 | 20 | 19 | 95% |
| 3 | 20 | 20 | 100% |
| 4 | 20 | 20 | 100% |
| 5 | 20 | 19 | 95% |
| 6 | 20 | 18 | 90% |
| 7 | 20 | 18 | 90% |
| 8 | 20 | 19 | 95% |
| 9 | 20 | 20 | 100% |
| 10 | 20 | 19 | 95% |
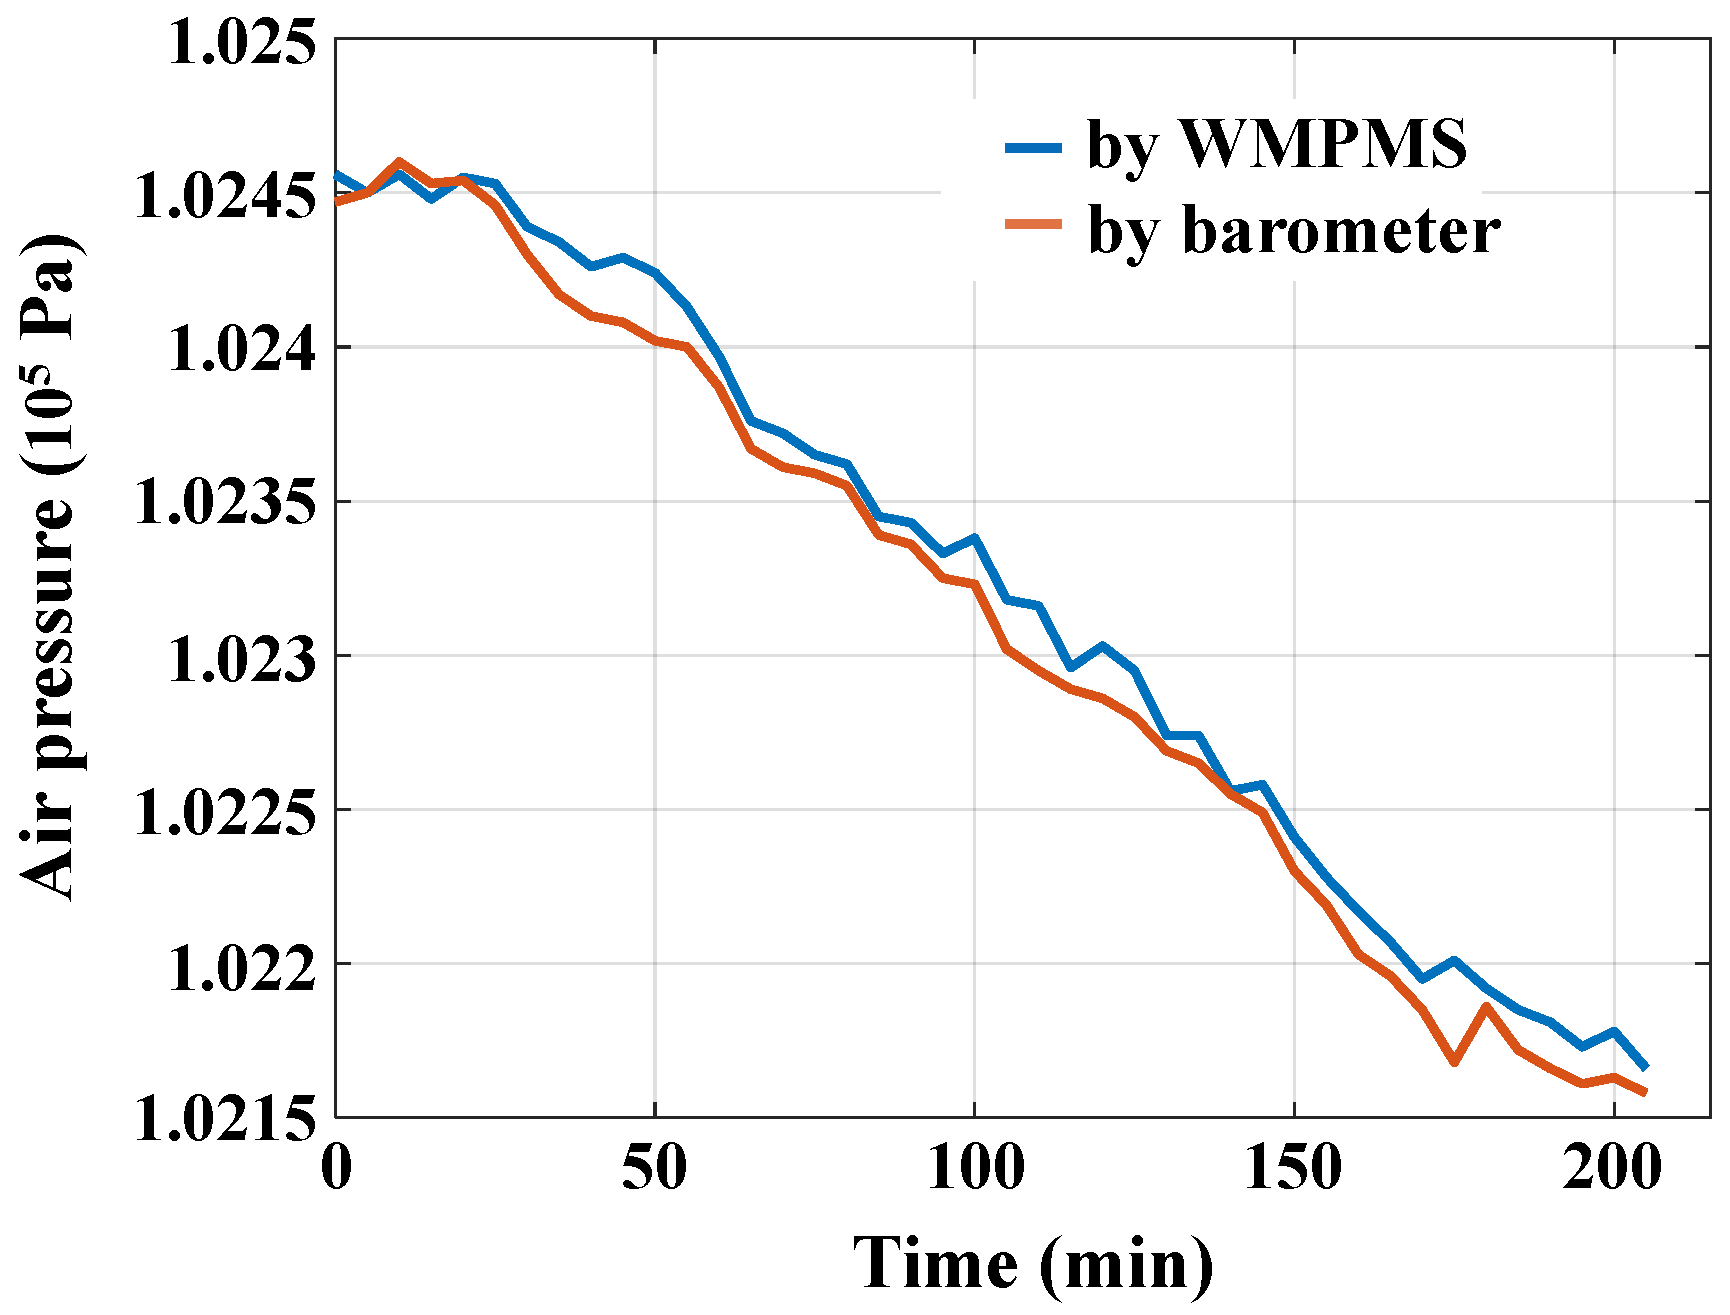
| Typical Time | Temperature Monitoring (°C) | Humidity Monitoring (%RH) | Air Pressure Monitoring (Pa) | |||
|---|---|---|---|---|---|---|
| System | Thermocouples | System | Hygrometers | System | Barometers | |
| 1 | 22.4 | 22.0 | 26.0 | 26.3 | 102,895 | 102,890 |
| 2 | 22.5 | 22.4 | 26.3 | 26.1 | 102,899 | 102,900 |
| 3 | 22.0 | 21.7 | 26.3 | 26.2 | 102,892 | 102,890 |
| 4 | 21.7 | 21.3 | 26.2 | 26.0 | 102,890 | 102,880 |
| 5 | 21.5 | 21.5 | 26.0 | 26.1 | 102,887 | 102,880 |
| 6 | 21.3 | 21.7 | 25.7 | 26.0 | 102,885 | 102,890 |
| 7 | 20.7 | 21.0 | 25.4 | 25.9 | 102,864 | 102,880 |
| 8 | 20.4 | 20.8 | 25.7 | 25.7 | 102,865 | 102,870 |
| 9 | 20.6 | 20.7 | 25.6 | 25.5 | 102,855 | 102,870 |
| 10 | 20.8 | 21.0 | 25.2 | 25.6 | 102,872 | 102,880 |
Disclaimer/Publisher’s Note: The statements, opinions and data contained in all publications are solely those of the individual author(s) and contributor(s) and not of MDPI and/or the editor(s). MDPI and/or the editor(s) disclaim responsibility for any injury to people or property resulting from any ideas, methods, instructions or products referred to in the content. |
© 2024 by the authors. Licensee MDPI, Basel, Switzerland. This article is an open access article distributed under the terms and conditions of the Creative Commons Attribution (CC BY) license (https://creativecommons.org/licenses/by/4.0/).
Share and Cite
Wang, C.; Wang, Y.; Pu, W.; Qiu, L. A Miniaturized and Ultra-Low-Power Wireless Multi-Parameter Monitoring System with Self-Powered Ability for Aircraft Smart Skin. Sensors 2024, 24, 7993. https://doi.org/10.3390/s24247993
Wang C, Wang Y, Pu W, Qiu L. A Miniaturized and Ultra-Low-Power Wireless Multi-Parameter Monitoring System with Self-Powered Ability for Aircraft Smart Skin. Sensors. 2024; 24(24):7993. https://doi.org/10.3390/s24247993
Chicago/Turabian StyleWang, Chongqi, Yu Wang, Wei Pu, and Lei Qiu. 2024. "A Miniaturized and Ultra-Low-Power Wireless Multi-Parameter Monitoring System with Self-Powered Ability for Aircraft Smart Skin" Sensors 24, no. 24: 7993. https://doi.org/10.3390/s24247993
APA StyleWang, C., Wang, Y., Pu, W., & Qiu, L. (2024). A Miniaturized and Ultra-Low-Power Wireless Multi-Parameter Monitoring System with Self-Powered Ability for Aircraft Smart Skin. Sensors, 24(24), 7993. https://doi.org/10.3390/s24247993