Abstract
To enhance real-time S-wave detection in the railway earthquake early warning (EEW) system, we improved the existing short-term average/long-term average (STA/LTA) algorithm. This enhancement focused on developing a more robust and computationally efficient method. Specifically, we introduced noise reflecting P-wave amplitude information before the P-wave to better distinguish between P- and S-waves. By applying this modified STA/LTA method, we achieved a significant improvement in S-wave detection accuracy. For seismic waveforms from stations located within 100 km of the epicenter of each earthquake, with magnitude of M5.5–6.5 and depths ≤ 100 km, the detection accuracy within 1.5 s of the correct time (manual picking) was 81.0%, compared to the 49.0% accuracy of the currently operational railway EEW system. Importantly, despite the improved accuracy, the computational cost of the new method remains comparable to the existing system, allowing for easy integration into the operational EEW system. This development is crucial for preventing false alarms, especially moderate earthquakes (~M6) because issuing warn-ings in unnecessary areas can have a significant social impact. Future plans involve implementing this method into the current system to further improve early warning capabilities and minimize false alarms.
1. Introduction
The earthquake early warning (EEW) system is a highly effective method for mitigating earthquake hazards. Typically, the EEW system provides crucial information such as magnitude and location (hypocenter or epicenter) within seconds after detecting the initial P-wave at the first station. In Japan, practical EEW systems have been under development for nearly 30 years. Ref. [1] introduced the Urgent Earthquake Detection and Alarm System (UrEDAS) to safely stop the Shinkansen (bullet train) during earthquakes. The railway EEW systems rapidly analyze seismic waveforms acquired from stations in close proximity to the hypocenter and estimate critical parameters, such as hypocentral distance, back azimuth, and magnitude [2,3,4,5,6,7,8]. The swift and accurate determination of magnitudes is a crucial element of the EEW system. Magnitudes are usually calculated by using the epicentral distance estimated through the aforementioned process, as well as the maximum amplitude recorded at each station. To facilitate the timely estimation of magnitude immediately after an earthquake detection, the EEW process employs two types of magnitude calculation formulas, one for the P-wave phase (P-wave magnitude) and the other after the arrival of the S-wave (all-phase magnitude). The process dynamically switches between the two formulas depending on the estimated arrival time of the S-wave at each observation point. Hence, the accurate real-time determination of the S-wave arrival time is important for precise magnitude estimation. In a railway earthquake early warning (EEW) system, the real-time detection of S-waves involves monitoring the amplitude ratio of combined horizontal (two components) and vertical (one component) seismic waveforms over time [9]. When this ratio exceeds a certain threshold, it is interpreted as the arrival time of the S-wave. This method was adopted because of its extremely low computational cost and its fundamental similarity to the short-term average/long-term average (STA/LTA) [10,11] method used for P-wave detection. It was designed to operate on the machine specifications available at the time of its introduction, about 40 years ago. Although machine updates are gradually being implemented, the algorithm remains low in computational cost. The concept behind this method is that the amplitude of the horizontal component of the seismometer will increase upon the arrival of the S-wave. However, due to wave scattering, complex subsurface and fault structures, and converted waves from P-wave to S-wave, the threshold is often exceeded prematurely relative to the actual S-wave arrival time, leading to the underestimation of magnitude.
Real-time detection of S-waves is challenging due to their subtle features compared to the more pronounced differences between background noise and P-waves. The current method for detecting S-wave arrival times in railway EEW systems uses the amplitude ratio between horizontal and vertical seismic wave components, however, it is known that this method has a significant margin of error because it is difficult to identify these subtle features while P-waves are being recorded. Numerous techniques exist for real-time P-wave detection, but relatively few are available for S-waves. Traditional methods for picking P- and S-wave arrival times include the STA/LTA. Examples of S-wave picking methods incorporate various advanced techniques such as higher-order statistics, including kurtosis [12], an improved STA/LTA method using the envelope function [13], autoregressive prediction suitable for real-time processing [14], a non-parametric method for automatic determination of P-wave and S-wave arrival times [15], and combining singular value decomposition with the STA/LTA method [16]. The damped predominant period (Tpd) method, used for estimating both P- and S-wave arrival times, has demonstrated superior accuracy compared to STA/LTA pickers [17]. Autoregressive (AR) model fitting has also been employed for determining onset times of both P- and S-waves. Leonard and Kennett provide a comprehensive review of various AR models and methods for picking onset times using AR prediction. For P-wave onset time determination, the univariate approach [18] applied to the Z-component is preferred, while for S-wave onset time estimation, a multivariate AR model is recommended [19]. Deep learning techniques have recently made significant progress, offering new solutions for the fast and accurate pickup of P- and S-waves [20,21,22]. Despite these advancements, the development of optimized automated algorithms for S-wave detection remains an ongoing research topic. Robust automated procedures that include quality estimations can improve the consistency of automated S-phase picking by recognizing, downgrading, or rejecting uncertain and potentially incorrect arrival times, which can significantly influence hypocenter estimation.
In this study, we developed a simple method, by modifying the STA/LTA method, that robustly determines the arrival time of S-waves in real time, with low computational cost, to be incorporated into the railway EEW system. The STA/LTA algorithm is highly efficient for real-time processing owing to its low computational cost. However, in the implementation of STA/LTA in real-time S-wave detection, the utilization of P-wave amplitudes for calculating the LTA presents challenges, including the significant amplitude variation of P-waves in comparison with the background noise and the limited S-P time available for calculating LTA at stations situated near the hypocenter. Our developed method effectively stabilizes the STA/LTA fluctuations in the P-wave prior to the arrival of the S-wave while adhering to the basic STA/LTA algorithm, and clarifies the characteristic difference between P- and S-waves.
2. Data and Methods
We developed a real-time method for determining the arrival times of S-waves based on the principles of the STA/LTA method. First, the arrival time of the P-wave was determined using a conventional STA/LTA approach. Artificial noise, quantified in terms of the P-wave amplitude, was then introduced into the signal. Subsequently, STA/LTA was performed on the modified signal to determine the arrival time of the S-wave. Given that the proposed method involves the computation of STA/LTA twice, specifically for the P-wave and S-wave, hereafter, this method shall be referred to as the “Two-Step STA/LTA”.
The STA/LTA method has been used in many P-wave detection systems owing to its computational efficiency. For P-wave detection, the real-time calculation of and is performed on the seismic waveform data, as follows:
where is the current sample of a data sequence, the parameters and represent the length of time used to calculate the average value, and . The is the threshold for P-wave detection. Specifically, the time k, at which Equation (3) is first satisfied, is identified as the P-wave arrival time γ. Next, the 90th percentile of the P-wave, denoted as q, is calculated from γ to γ + δ s as follows:
Subsequently, the random noise (white noise) N with values ranging from 0 to 1, is multiplied by q to generate a noise waveform that incorporates the amplitude information of the P-wave from γ to γ + δ. The noise waveform, which is the product of q and N, is replaced with the original signal waveform from time γ + δ − β to time γ + δ. Therefore, waveform can be generated to detect the S-wave as follows:
Although creating from a time earlier than γ + δ − β presents no issue, we generated only the essential required to compute the LTA to minimize the cost of the real-time computation. Next, the STA/LTA analysis is performed on the modified waveform to establish the threshold, for detecting the S-wave, as follows:
where the parameters and represent the length of time used to calculate the average value and ≪. and can have an identical value to that of and . Finally, the time k at which Equation (8) is first satisfied is designated as the arrival time of the S-wave.
The δ, q, and values are updated if the value does not surpass the threshold (). The amplitude of the P-wave may undergo gradual changes, leading to the q value becoming insufficient a few seconds after the P-wave arrival. Hence, we increment the δ value each second and update the q and until the exceeds the . First, we generate the q and based on the data between γ and γ + 2 s, and conduct . If the values do not exceed the by γ + 3 s, we update the q and again based on the data between γ and γ + 3 s, followed by performing the until γ + 4 s, using updated . This iterative process continues until γ + 6 s, beyond which the q and are not updated.
The objective of this method is to stabilize the temporal fluctuations of the STA/LTA until the arrival of the S-waves. Directly following the onset of the P-wave, the computed LTA encompasses both the pre-P-wave noise and the P-wave itself. Consequently, the LTA value gradually escalates. In such instances, the STA/LTA requires time to stabilize, and the configuration of the threshold becomes intricate, leading to the risk of overlooking the arrival of the S-wave. Hence, by incorporating noise and the parameter q, the temporal fluctuation of the STA/LTA, commencing promptly after the arrival of the P-wave (more precisely, after δ has passed), can be assessed based on the interplay between P-waves and S-waves. This augments the reliable detection of S-waves.
In this study, we selected earthquakes of magnitude ≥ M5.5 and depths ≤ 100 km, which occurred between 2003 and 2018, and manually picked S-wave arrival times on the seismic waveforms recorded by K-NET (Kyoshin net: nationwide strong motion networks in Japan [23]) for the selected earthquakes (Figure 1). The waveform data used in this study were obtained from K-NET stations, located within 200 km from the epicenter of each earthquake. Only seismic events with 20 or more K-NET stations where the arrival time of the S-wave could be interpreted manually were considered. The 65 earthquakes considered in this analysis are listed in Table 1, totaling 3030 waveforms. In this study, we computed using the vertical component of the waveform recorded by each seismometer. The parameters q and were derived from the combined waveform, obtained through vector synthesis of the two horizontal components recorded by each seismometer. The propagation speed of seismic waves is generally slowest near the Earth’s surface and increases with depth. Consequently, the propagation path of seismic waves forms a convex shape, causing the waves to approach the surface almost vertically. As a result, P-waves exhibit predominant vertical motion, while S-waves exhibit predominant horizontal motion. The acceleration waveforms recorded by K-NET were integrated to velocity waveforms before being used in the analysis. This was performed to augment the amplitude variation in the time domain and aid in the detection of S-waves. The bandwidth range of the dataset used in this study is 0.1–20 Hz.
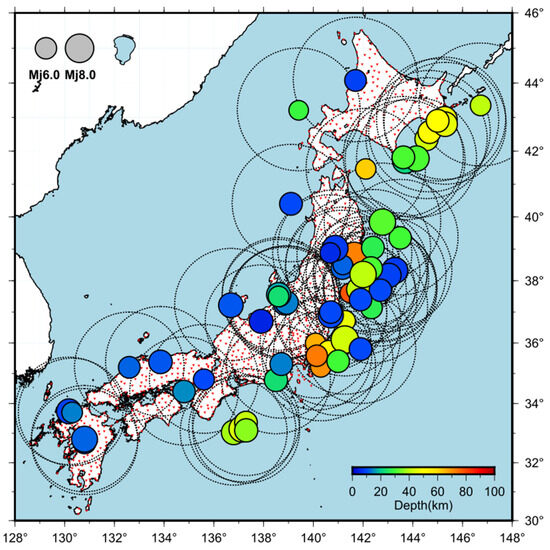
Figure 1.
The hypocenter locations of the 65 earthquakes analyzed in this study (colored circles), the locations of K-NET stations (reverse red triangles), and the 200 km range from the epicenter of each earthquake (dash circle lines) are shown.

Table 1.
Earthquake list. This earthquake catalog was obtained from the Japan Meteorological Agency (JMA) website (https://www.data.jma.go.jp/eqev/data/daily_map/index.html, last accessed on 14 November 2024).
3. Results
Figure 2 shows the application of the proposed method to a specific seismic waveform recorded at a given K-NET station. The absolute value of the vertical component recorded by each seismometer is shown in Figure 2a, while Figure 2b presents the absolute value of the composite waveform obtained by vector synthesis of the two horizontal velocity components recorded by each seismometer. Figure 2c illustrates the calculated , which determines the arrival time of the P-wave (γ) when the (4.5 in this case) is exceeded. The red waveforms in Figure 2d indicate the composite waveform, which is used to calculate the percentile parameter q. Figure 2e shows the waveform , in which q × N is substituted from γ + δ − β to γ + δ. Finally, Figure 2f shows the which determines the arrival time of the S-wave when the (3.5 in this case) is exceeded. A comparison of Figure 2a,c, which are aligned on the same temporal axis, shows that the surpasses the precisely at the moment of the P-wave’s arrival. Similarly, by comparing Figure 2b,f, which are also aligned on the same temporal axis, it can be observed that the of the proposed method surpasses the precisely at the moment of the S-wave’s arrival.
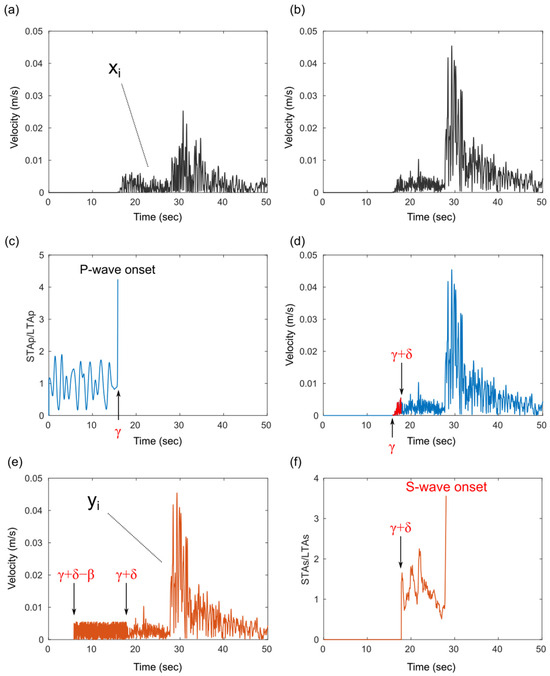
Figure 2.
The Two-Step STA/LTA method. (a) The absolute vertical component waveform. (b) Combined horizontal component waveform. (c) The calculated for the vertical component waveform () depicted in (a). (d) The segment where q is calculated for the combined horizontal two-component waveform. (e) Waveform replaced by q from γ + δ − β to γ + δ. (f) The calculated for depicted in (e).
The proposed method was used to determine the arrival times of S-waves for the 65 earthquakes listed in Table 1. The parameters = 5.0, = 0.5, = 5.0, = 2.2, = 0.5, = 5.0, and δ = 2.0 (initial value) were utilized in this study. The parameter β was set to 5 s to ensure a sufficiently large value for observing the long-term background noise level, while avoiding an excessively high average value due to repeated earthquakes. The parameter α was set to 0.5 s to balance early detection with reducing false positives from pulse-like noise. Setting α to a shorter duration, such as 0.1 s, increases the risk of false detection from noise, while a longer duration, like 1 s, delays the detection after the P-wave arrival.
In addition, manual and automatic readings were compared for 65 earthquakes. Further, the S-wave arrival time detected by the proposed method (, automatic reading) was compared with that determined through manual picking (, manual reading). These are the elapsed times from the earthquake occurrence. The results of the comparison between and at each K-NET station for 12 earthquakes are shown in Figure 3. The results show that the values are accurate and aligned with the values as they are roughly aligned in a straight line. However, at certain stations, the S-wave arrival times were not accurately determined using the proposed method. This can be attributed to two primary factors that hinder the accurate automatic picking: (1) in cases where the exceed the threshold value prior to the actual S-wave arrival (minus reading; ), which is mainly evident in the comparison of and in Figure 3 for earthquakes #14, #30, and #40; (2) when the do not exceed the designated value.
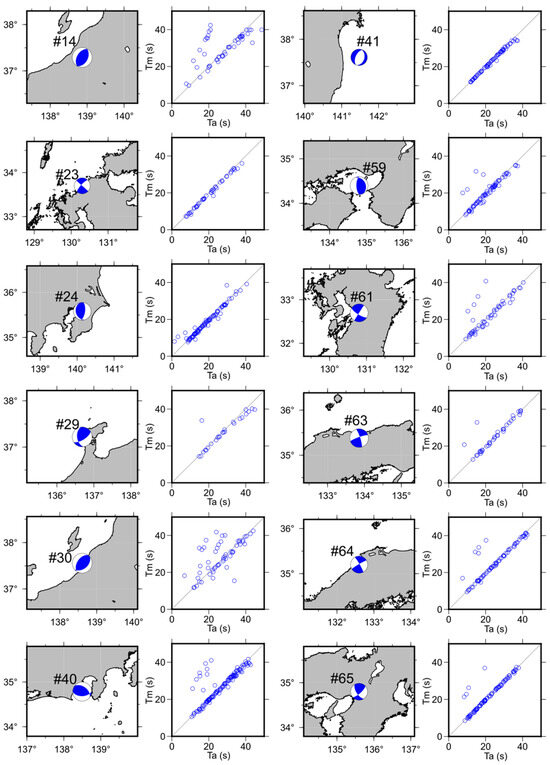
Figure 3.
Earthquake mechanisms and comparison of S-wave detection time between automatic reading () and manual reading ().
Figure 4a shows the histograms of the residuals (). The percentage of correct decisions () for waveforms from stations located within 200 km of the epicenter for 65 earthquakes in Table 1, totaling 3030 waveforms, was approximately 76.7% (Figure 4a and Table 2). Moreover, the percentage of correct decisions decreases as the hypocenter distance increases (Figure 4b). As the hypocenter distance increases, the percentage of waveforms that do not exceed and thus cannot determine the S-wave arrival time also increases. The percentage of correct decisions tends to decrease slightly as the magnitude of the earthquake increases (Figure 4c). It is anticipated that the decrease in detection rate is not due to the magnitude of the earthquakes, but because larger magnitude earthquakes tend to occur in subduction zones, which are farther from the seismic observation network on land. As stated in the Introduction, when the S-wave arrival time cannot be determined, the S-wave amplitude is utilized instead of the P-wave amplitude to estimate the earthquake magnitude, and a larger magnitude than the actual one is estimated, leading to an overestimation of the warning range. This issue is particularly crucial for moderate earthquakes (~M6) because issuing warnings in unnecessary areas can have a significant social impact. Using the proposed method, an accuracy of 81.0% was achieved for waveforms from stations located within 100 km of the epicenter for earthquakes with magnitudes of 5.5–6.5 (moderate earthquakes) and depths ≤ 100 km, totaling 1137 waveforms (Figure 4a and Table 2). This result indicates that the developed method contributes to improving the accuracy of alerts.
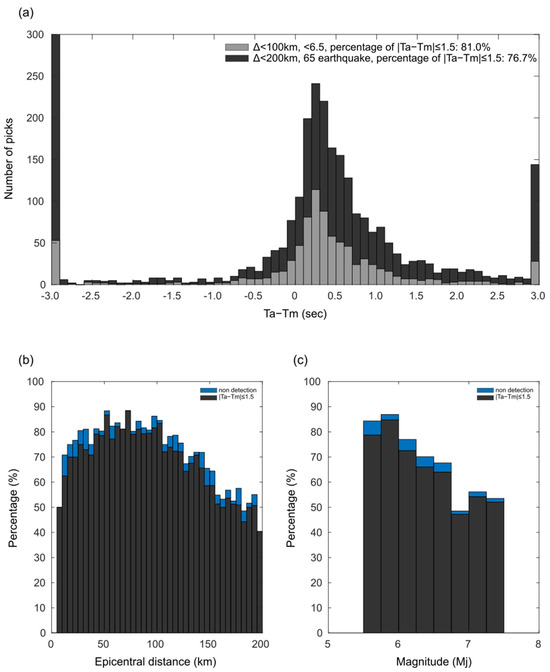
Figure 4.
The error in automatic reading (). (a) The histogram of residuals from waveform data obtained at stations within 200 km of the epicenter for all 65 earthquakes, totaling 3030 waveforms (black). The histogram of residuals from waveform data obtained at stations within 100 km of the epicenter for earthquake with Mj5.5–6.5, totaling 1137 waveforms (gray). (b) The percentage of correct decisions () vs. epicentral distance of stations (black) that do not exceed and cannot determine the S-wave arrival time (blue). (c) The percentage of correct decisions () vs. magnitude of the earthquake (black) that do not exceed and cannot determine the S-wave arrival time (blue).
Table 2.
The comparison results of between our method and current method [1]. Displayed as NaN when not applicable.
4. Discussion
As with other phase detection methods, it is important to assess the accuracy of this method. The increase in the number of waveforms that do not exceed the level with increasing epicentral distance (Figure 4b) can be attributed to the attenuation of the amplitude in the rising portion of the P-wave, and the reduced difference between the amplitudes of the P- and S-waves due to the prevalence of reflected waves. Conversely, the phases generated by the sedimentary layers, such as PS-converted and SP-converted waves, could potentially influence the minus readings. This phenomenon is more likely to occur when a notable discontinuity surface exists directly beneath a station, such as a station situated in a basin.
To minimize S-wave detection errors, parameter study of the was conducted. The was varied, from 1.0 to 4.0 (thp fixed at 5.0), for stations within epicenter distance of less than 200 km for the 65 earthquakes. Among the picks computed using the Two-Step STA/LTA method, N1 represents the count of picks with , N2 represents the count of picks where the did not surpass , and N3 represents the count of picks with (minus reading), as shown in Figure 5a. N1 was the highest when was 2.2, and as increased, N2 increased and N3 decreased. The decrease in N3 with increasing is due to the fact that the threshold is surpassed by the S-wave rather than the PS- or SP-converted waves. However, an elevated threshold value may lead to a delayed in comparison to because the threshold is exceeded at higher amplitudes. As an example, the results for earthquake #40 computed with = 1.0 and = 4.0 are presented in Figure 5b,c. The figures illustrate that reducing the increases the number of minus readings, while increasing the reduces the number of picks and leads to a delay in . Owing to the inherent variability in the observed seismic waveforms caused by factors such as source, propagation path, and site effects, it is theoretically essential to establish a specific threshold value for each station to accurately determine . It may be feasible to analyze numerous earthquakes and determine thresholds empirically based on information such as and the P-wave amplitude.
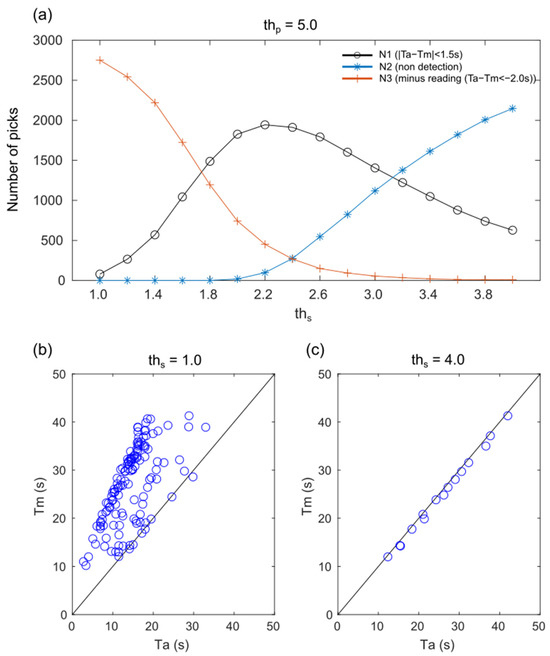
Figure 5.
(a) The number of picks for N1 (black), N2 (blue), and N3 (red) were calculated by varying the threshold, , from 1.0 to 4.0 for all stations located within an epicentral distance of less than 200 km for the 65 earthquakes. (b) Comparison between automatic reading () and manual reading () of earthquake #40 for = 1.0. (c) Comparison between and of earthquake #40 for = 4.0.
The bandwidth of the recorded seismic trace plays an important role in the performance of a phase detector, i.e., a bandwidth that is too narrow can deteriorate the efficiency of the employed algorithm [24]. Ref. [25] indicating that a strong bandwidth dependence of the STA/LTA algorithm is expected for P-wave detection, and that the STA/LTA algorithm requires a minimum bandwidth (more than 15 Hz) to reliably estimate (less than 10 samples) the phase arrival. Here, we compared the results of the Two-Step STA/LTA analysis of the seismic waveforms using five bandpass filters (0.01–20 Hz, 0.05–20 Hz, 0.1–20 Hz, 0.5–20 Hz, and 1–20 Hz). The target earthquakes and parameters are consistent with those presented in the Section 3. The percentage of correct decisions () were 80.5%, 80.0%, 81.0%, 60.2%, and 75.3%, respectively (Figure 4a and Figure S1a–4a). The percentage increased with the inclusion of low-frequency components. Nonetheless, the optimal bandwidth configuration may vary based on factors such as the magnitude (dominant frequency) and hypocentral distance (attenuation) of the station.
Although not a real-time process, previous studies have shown that in automated S-wave picking, the percentage of correct decisions often exceeds 90% with [15]. This is in contrast to the 81.0% correct decisions with observed (Section 3). In machine learning and statistical applications, ensemble methods, which incorporate multiple methods, outperform single-model techniques when there is diversity among them [26]. This phenomenon was also observed in phase picking [27]. Considering the objective of real-time S-wave picking, we acknowledge the constraints on our capacity to perform intricate computations. However, we propose the integration of our methodology with existing event and phase detection techniques to enhance the accuracy of the picking process.
We compare the results of our developed method with the real-time S-wave detection method currently used in railway EEW systems, which monitors the amplitude ratio of the combined horizontal two-component and vertical one-component seismic waveforms over time [1]. They stated that P-waves generally exhibit predominantly vertical motion, while S-waves exhibit predominantly horizontal motion. This difference enables the identification of P- and S-waves in the currently operational method. However, it should be noted that this distinction may not always apply to shallow or nearby earthquakes, where these characteristics can vary. The vertical and horizontal squared amplitudes are smoothed exponentially, and the amplitude ratio is calculated as follows:
where and are the absolute vertical and horizontal two-component composite waveform amplitudes, respectively. i is the current time step, and α is the exponential smoothing coefficient. An S-wave is considered to have arrived when the H/V value exceeds a set threshold after the P-wave arrival. Table 1 compares the S-wave arrival times detected using the H/V method with manually-read accurate values for all earthquakes. The proportion of correct detections within 1.5 s for all data was approximately 44.8%, and for earthquakes of magnitude 5.5–6.5 within 100 km of the epicenter, it was approximately 49.0% (Figure 6 and Table 2). It was observed that the method performs better for earthquakes with smaller epicentral distances. However, many instances detected the S-wave earlier than the actual arrival time, suggesting significant influence from PS converted waves. As mentioned earlier, the developed method shows a correct detection rate of 76.7% for 65 earthquakes within 200 km of the epicenter and over 81.0% for magnitude 5.5–6.5 earthquakes within 100 km of the epicenter (Table 2). This indicates that our proposed method can dramatically improve the accuracy of S-wave detection times while maintaining the same low computational cost as the current method.
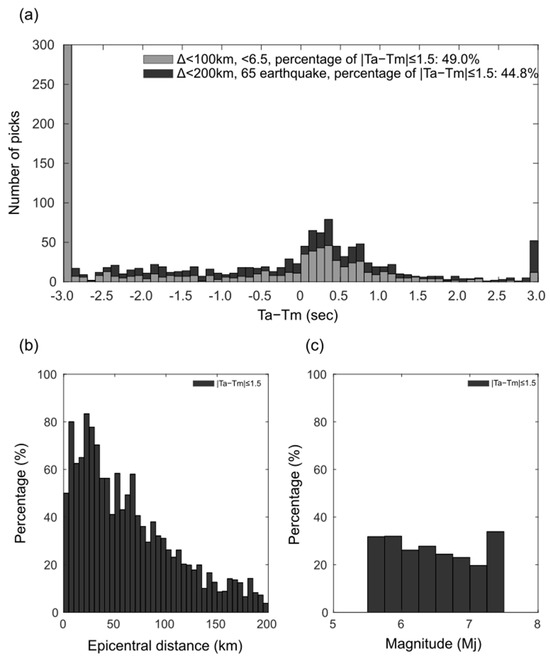
Figure 6.
The error in automatic reading with the current method of railway EEW [1] (). (a) The histogram of residuals from waveform data obtained at stations within 200 km of the epicenter for all 65 earthquakes (black). The histogram of residuals from waveform data obtained at stations within 100 km of the epicenter for earthquake with Mj5.5–6.5 (gray). (b) The percentage of correct decisions () vs. epicentral distance of stations (black). (c) The percentage of correct decisions () vs. magnitude of the earthquake (black).
The moderate earthquakes occur before the mainshock, leading to failures in the EEW system’s P-wave detection and magnitude estimation. In this study, we tested our developed method using files where seismic waveforms were segmented by individual earthquakes. As a result, we did not sufficiently verify the robustness of the method against successive earthquakes. Moving forward, it is essential to address successive earthquakes to enhance the accuracy of early earthquake detection for warning systems.
5. Conclusions
We developed a more robust method to determine the arrival time of S-waves in real time, with a low computational cost, while adhering to the basic algorithm of STA/LTA. In this approach, noise is intentionally added to the waveform ahead of the P-wave to accentuate the contrast between the P- and S-waves, followed by a renewed implementation of the STA/LTA to detect S-waves once the P-wave is successfully identified. The method can effectively determine the S-wave arrival time. The percentage of correct decisions () for waveforms from stations located within 200 km of the epicenter for 65 earthquakes in Table 1 was approximately 76.7%. However, the percentage of correct answers for earthquakes of magnitude 5.5–6.5 with observation points less than 100 km was 81.0%. The error in automatic readings can be minimized by optimizing the parameters for each individual earthquake and potentially for each station. Our newly developed method for detecting S-wave arrival times in railway EEW systems has demonstrated significant improvements compared to the existing approach, which uses the amplitude ratio between horizontal and vertical seismic wave components. The current method achieves a 49.0% detection rate within 1.5 s of the true value for earthquakes of magnitude 5.5–6.5 with epicentral distances less than 100 km. In contrast, our method significantly enhances detection accuracy. Moreover, the computational cost of our method is comparable to the current method, making it straightforward to integrate into railway EEW systems. We plan to proceed with the implementation of this improved method into the system.
Supplementary Materials
The following supporting information can be downloaded at: https://www.mdpi.com/article/10.3390/s24237452/s1, Figure S1: The error of T_a, obtained from the waveform filtered within the frequency range of 0.01–20 Hz, is presented, Figure S2: The error of T_a, obtained from the waveform filtered within the frequency range of 0.05–20 Hz, is presented, Figure S3: The error of T_a, obtained from the waveform filtered within the frequency range of 0.5–20 Hz, is presented and Figure S4: The error of T_a, obtained from the waveform filtered within the frequency range of 1.0–20 Hz, is presented,
Author Contributions
S.K.: Writing—review & editing, conceptualization, and methodology; N.I.: Review & editing, and project administration. All authors have read and agreed to the published version of the manuscript.
Funding
This research received no external funding.
Institutional Review Board Statement
Not applicable.
Informed Consent Statement
Not applicable.
Data Availability Statement
The waveform data used in this study were obtained from the National Research Institute for Earth Science and Disaster Resilience [28]. The seismic data used in this study were obtained from the Japan Meteorological Agency [JMA, https://www.data.jma.go.jp/eqev/data/daily_map/index.html]. The Supplemental Material for this article includes Figures S1–S4 with analysis details. Part of this research has already been published as a pre-print, accessed on 14 November 2024 [29].
Acknowledgments
The authors express their gratitude to the three anonymous reviewers for their insightful comments and suggestions. Some figures were prepared using Generic Mapping Tools [30].
Conflicts of Interest
Author Naoyasu Iwata was employed by the company Railway Technical Research Institute. The remaining authors declare that the research was conducted in the absence of any commercial or financial relationships that could be construed as a potential conflict of interest.
References
- Nakamura, Y. On the Urgent Earthquake Detection and Alarm System (UrEDAS). In Proceedings of the 9th World Conference Earthquake Engineering, Tokyo-Kyoto, Japan, 2–9 August 1988; Volume VII, pp. 673–678. [Google Scholar]
- Allen, R.M.; Kanamori, H. The potential for earthquake early warning in southern California. Science 2003, 300, 786–789. [Google Scholar] [CrossRef]
- Wu, Y.-M.; Kanamori, H. Experiment on an onsite early warning method for the Taiwan early warning system. Bull. Seismol. Soc. Am. 2005, 95, 347–353. [Google Scholar] [CrossRef]
- Odaka, T.; Ashiya, K.; Tsukada, S.; Sato, S.; Ohtake, K.; Nozaka, D. A new method of quickly estimating epicentral distance and magnitude from a single seismic record. Bull. Seismol. Soc. Am. 2003, 93, 526–532. [Google Scholar] [CrossRef]
- Horiuchi, S.; Negishi, H.; Abe, K.; Kaminuma, A.; Fujinawa, Y. An automatic processing system for broadcasting earthquake alarms. Bull. Seismol. Soc. Am. 2005, 95, 708–718. [Google Scholar] [CrossRef]
- Noda, S.; Yamamoto, S.; Sato, S.; Iwata, N.; Korenaga, M.; Ashiya, K. Improvement of back-azimuth estimation in real-time by using a single station record. Earth Planets Space 2012, 64, 305–308. [Google Scholar] [CrossRef][Green Version]
- Noda, S.; Yamamoto, S.; Ellsworth, W.L. Rapid estimation of earthquake magnitude from the arrival time of the peak high-frequency amplitude. Bull. Seismol. Soc. Am. 2016, 106, 232–241. [Google Scholar] [CrossRef]
- Iwata, N.; Korenara, M.; Noda, S.; Yamamoto, S. Improvement and performance evaluation of the earthquake early warning algorithm for railways in Japan. In Proceedings of the 17th World Conference on Earthquake Engineering, Sendai, Japan, 13–18 September 2020; p. 1e-0005. [Google Scholar]
- Nakamura, Y. Research and development of intelligent earthquake disaster prevention systems UrEDAS and HERAS. J. Struct. Mech. Earthq. Eng. 1996, 531, 1–33. (In Japanese) [Google Scholar] [CrossRef]
- Allen, R.V. Automatic earthquake recognition and timing from single traces. Bull. Seism. Soc. Am. 1978, 68, 1521–1532. [Google Scholar] [CrossRef]
- Allen, J.R.L. Sedimentary Structures: Their Character and Physical Basis; Elsevier Scientific Publishing Company: Amsterdam, The Netherlands, 1982; Volume 1. [Google Scholar]
- Baillard, C.; Crawford, W.C.; Ballu, V.; Hibert, C.; Mangeney, A. An automatic kurtosis-based P- and S-phase picker designed for local seismic networks. Bull. Seismol. Soc. Am. 2014, 104, 394–409. [Google Scholar] [CrossRef]
- Baer, M.; Kradolfer, U. An automatic phase picker for local and teleseismic events. Bull. Seismol. Soc. Am. 1987, 77, 1437–1445. [Google Scholar] [CrossRef]
- Küperkoch, L.; Meier, T.; Brüstle, A.; Lee, J.; Friederich, W. EGELADOS Working Group Automated determination of S-phase arrival times using autoregressive prediction: Application to local and regional distances. Geophys. J. Int. 2012, 188, 687–702. [Google Scholar] [CrossRef]
- Rawles, C.; Thurber, C. A non-parametric method for automatic determination of P-wave and S-wave arrival times: Application to local micro earthquakes. Geophys. J. Int. 2015, 202, 1164–1179. [Google Scholar] [CrossRef]
- Kurzon, I.; Vernon, L.F.; Rosenberger, A.; Ben-Zion, Y. Real-time automatic detectors of P and S waves using singular value decomposition. Bull. Seismol. Soc. Am. 2014, 104, 1696–1708. [Google Scholar] [CrossRef]
- Hildyard, M.W.; Nippress, S.E.; Rietbrock, A. Event detection and phase picking using a time-domain estimate of predominate period Tpd. Bull. Seismol. Soc. Am. 2008, 98, 3025–3032. [Google Scholar] [CrossRef]
- Takanami, T.; Kitagawa, G. A new efficient procedure forthe estimation of onset times of seismic waves. J. Phys. Earth 1988, 36, 267–290. [Google Scholar] [CrossRef]
- Takanami, T.; Kitagawa, G. Estimation of the arrival times of seismic waves by multivariate time series model. Ann. Inst. Stat. Math. 1991, 43, 407–433. [Google Scholar] [CrossRef]
- Ross, Z.E.; Ben-Zion, Y. Automatic picking of direct P, S seismic phases and fault zone head waves. Geophys. J. Int. 2014, 199, 368–381. [Google Scholar] [CrossRef]
- Zhu, L.; Peng, Z.; McClellan, J.; Li, C.; Yao, D.; Li, Z.; Fang, L. Deep learning for seismic phase detection and picking in the aftershock zone of 2008 Mw7.9 Wenchuan Earthquake. Phys. Earth Planet. Inter. 2019, 293, 106261. [Google Scholar] [CrossRef]
- Cai, J.; Duan, Z.; Yan, F.; Zhang, Y.; Mu, R.; Cai, H.; Ding, Z. Automatic arrival-time picking of P- and S-waves of micro-seismic events based on relative standard generative adversarial network and GHRA. J. Pet. Explor. Prod. Technol. 2024, 14, 2199–2218. [Google Scholar] [CrossRef]
- Kinoshita, S. Kyoshin net (k-net). Seism. Res. Lett. 1998, 69, 309–332. [Google Scholar] [CrossRef]
- Longbottom, J.; Walden, T.A.; White, E.R. Principles and applications of maximum Kurtosis phase estimation. Geophys. Prospect. 1988, 36, 115–138. [Google Scholar] [CrossRef]
- Saragiotis, C.; Hadjileontiadis, L.; Panas, S. PAI-S/K: A robust automatic seismic P phase arrival identification scheme. IEEE Trans. Geosci. Remote Sens. 2002, 40, 1395–1404. [Google Scholar] [CrossRef]
- Kuncheva, L.; Whitaker, C. Measures of diversity in classifier ensembles. Mach. Learn 2003, 51, 181–207. [Google Scholar] [CrossRef]
- Diehl, T.; Deichmann, N.; Kissling, E.; Husen, S. Automatic S-wave picker for local earthquake tomography. Bull. Seismol. Soc. Am. 2009, 99, 1906–1920. [Google Scholar] [CrossRef]
- National Research Institute for Earth Science and Disaster Resilience. NIED K-NET, KiK-net. Natl. Res. Inst. Earth Sci. Disaster Resil. 2019. [CrossRef]
- Katakami, S.; Iwata, N. A Robust Real-Time S-Wave Detection Method with Low Computational Cost Based on Modified STA/LT; Research Square: Durham, NC, USA, 2023; Available online: https://www.researchsquare.com/article/rs-3209398/v1 (accessed on 17 May 2024).
- Wessel, P.; Smith, F.H.W. New, improved version of generic mapping tools released. EOS. Trans. Am. Geophys. Union 1998, 79, 579. [Google Scholar] [CrossRef]


Disclaimer/Publisher’s Note: The statements, opinions and data contained in all publications are solely those of the individual author(s) and contributor(s) and not of MDPI and/or the editor(s). MDPI and/or the editor(s) disclaim responsibility for any injury to people or property resulting from any ideas, methods, instructions or products referred to in the content. |
© 2024 by the authors. Licensee MDPI, Basel, Switzerland. This article is an open access article distributed under the terms and conditions of the Creative Commons Attribution (CC BY) license (https://creativecommons.org/licenses/by/4.0/).