
Clinically Informed Automated Assessment of Finger Tapping Videos in Parkinson’s Disease


Abstract
:1. Introduction
2. Related Work
2.1. Advances in Automated Assessment of Parkinson’s Disease with Machine Learning Approach
2.2. The Current Landscape of Video-Based Assessment for Parkinson’s Disease
3. Method
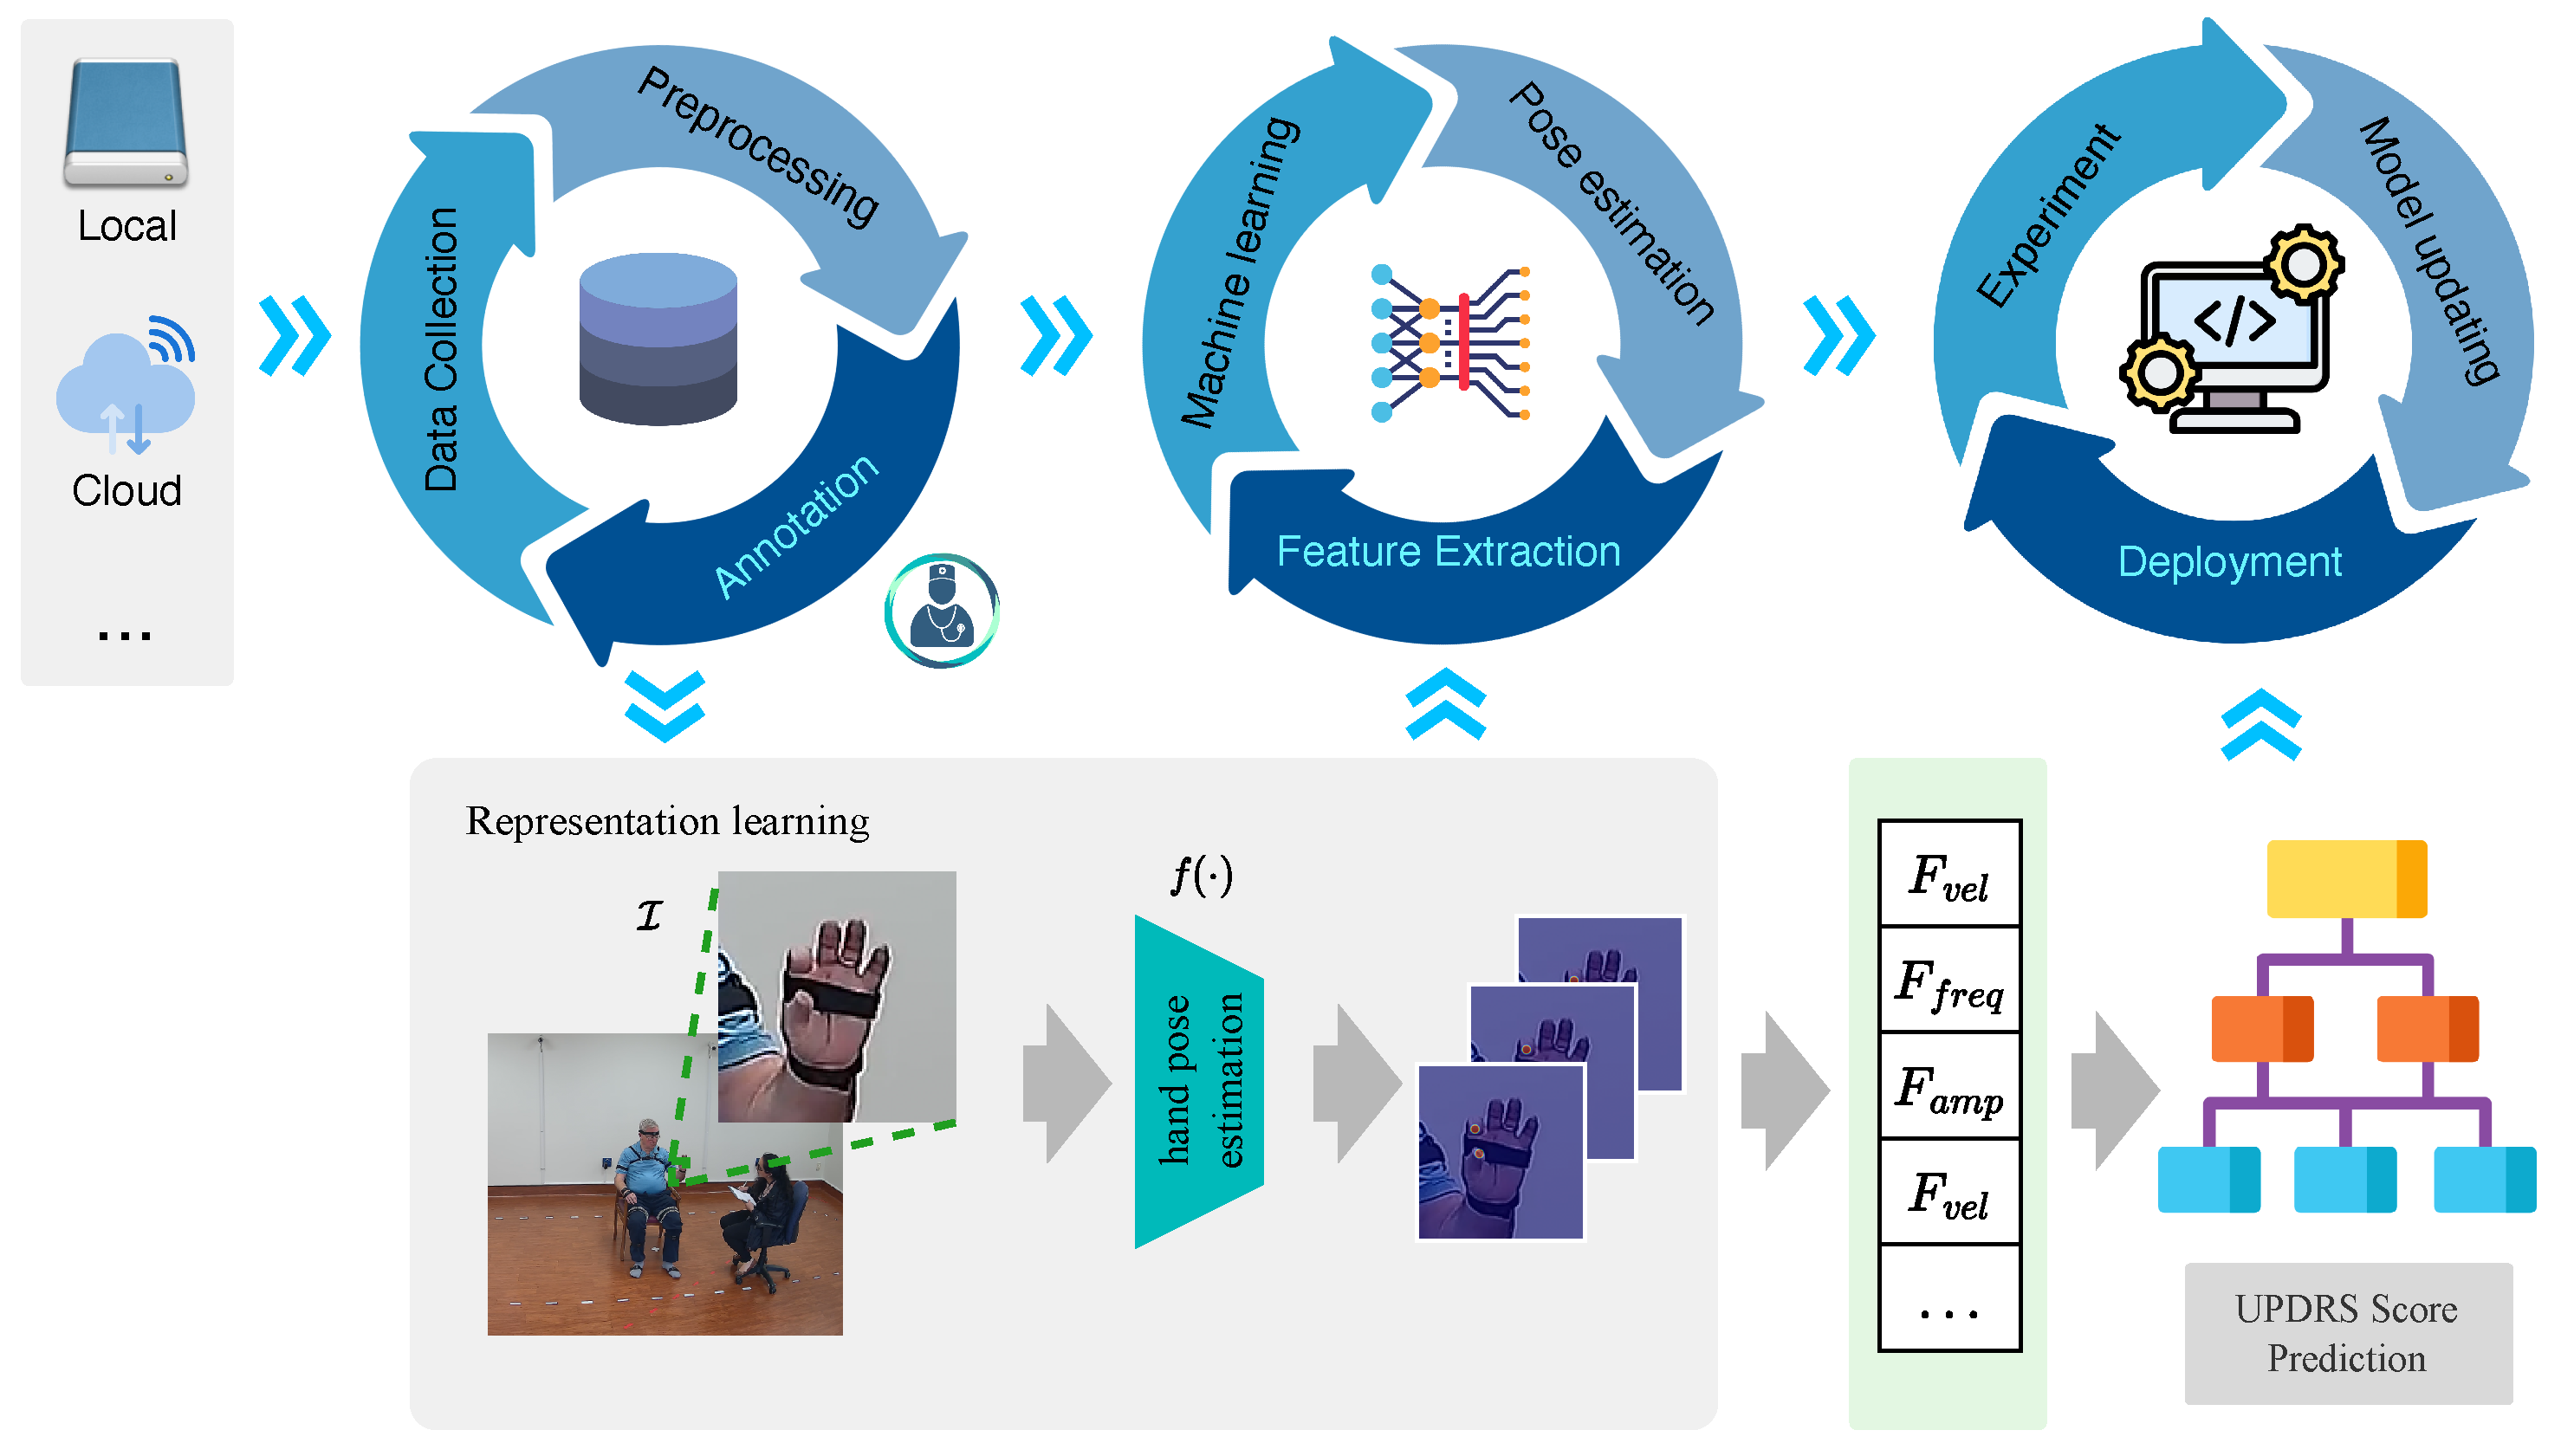
3.1. Data Cycle
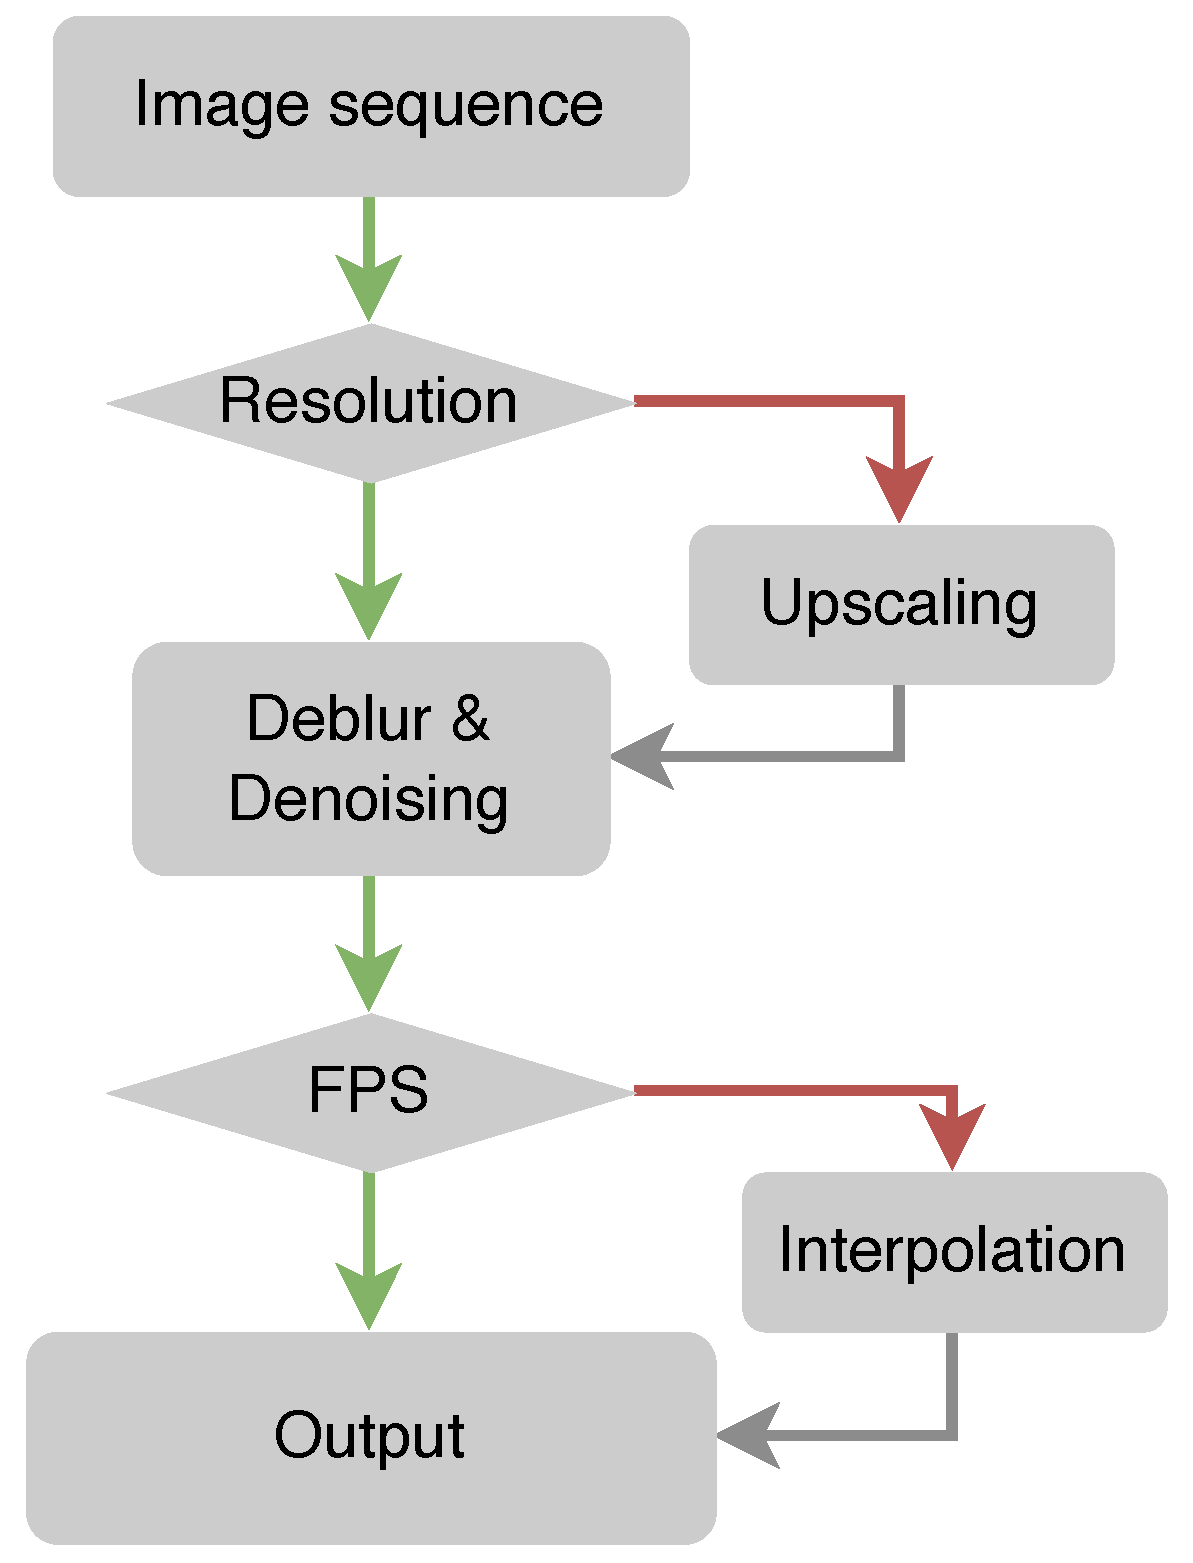
- Removing motion blur: Motion blur occurs in images or videos as a result of camera wobble or object motion [43]. When collecting multi-source data from various devices and environments, it is essential to remove motion blur to regain the sharpness and clarity of the data.
- Denoising: Noise may be introduced during the image- or video-acquisition process, leading to a degradation in quality and potentially hindering the capacity to extract meaningful features. A denoising step is often employed to reduce noise from the data while retaining the details.
- Frame interpolation: This technique generates additional frames in videos with low frame rates [44]. This process estimates the motion between existing frames and synthesizes new ones, thereby smoothing the motion and enhancing the temporal resolution.
3.2. Model Learning Cycle
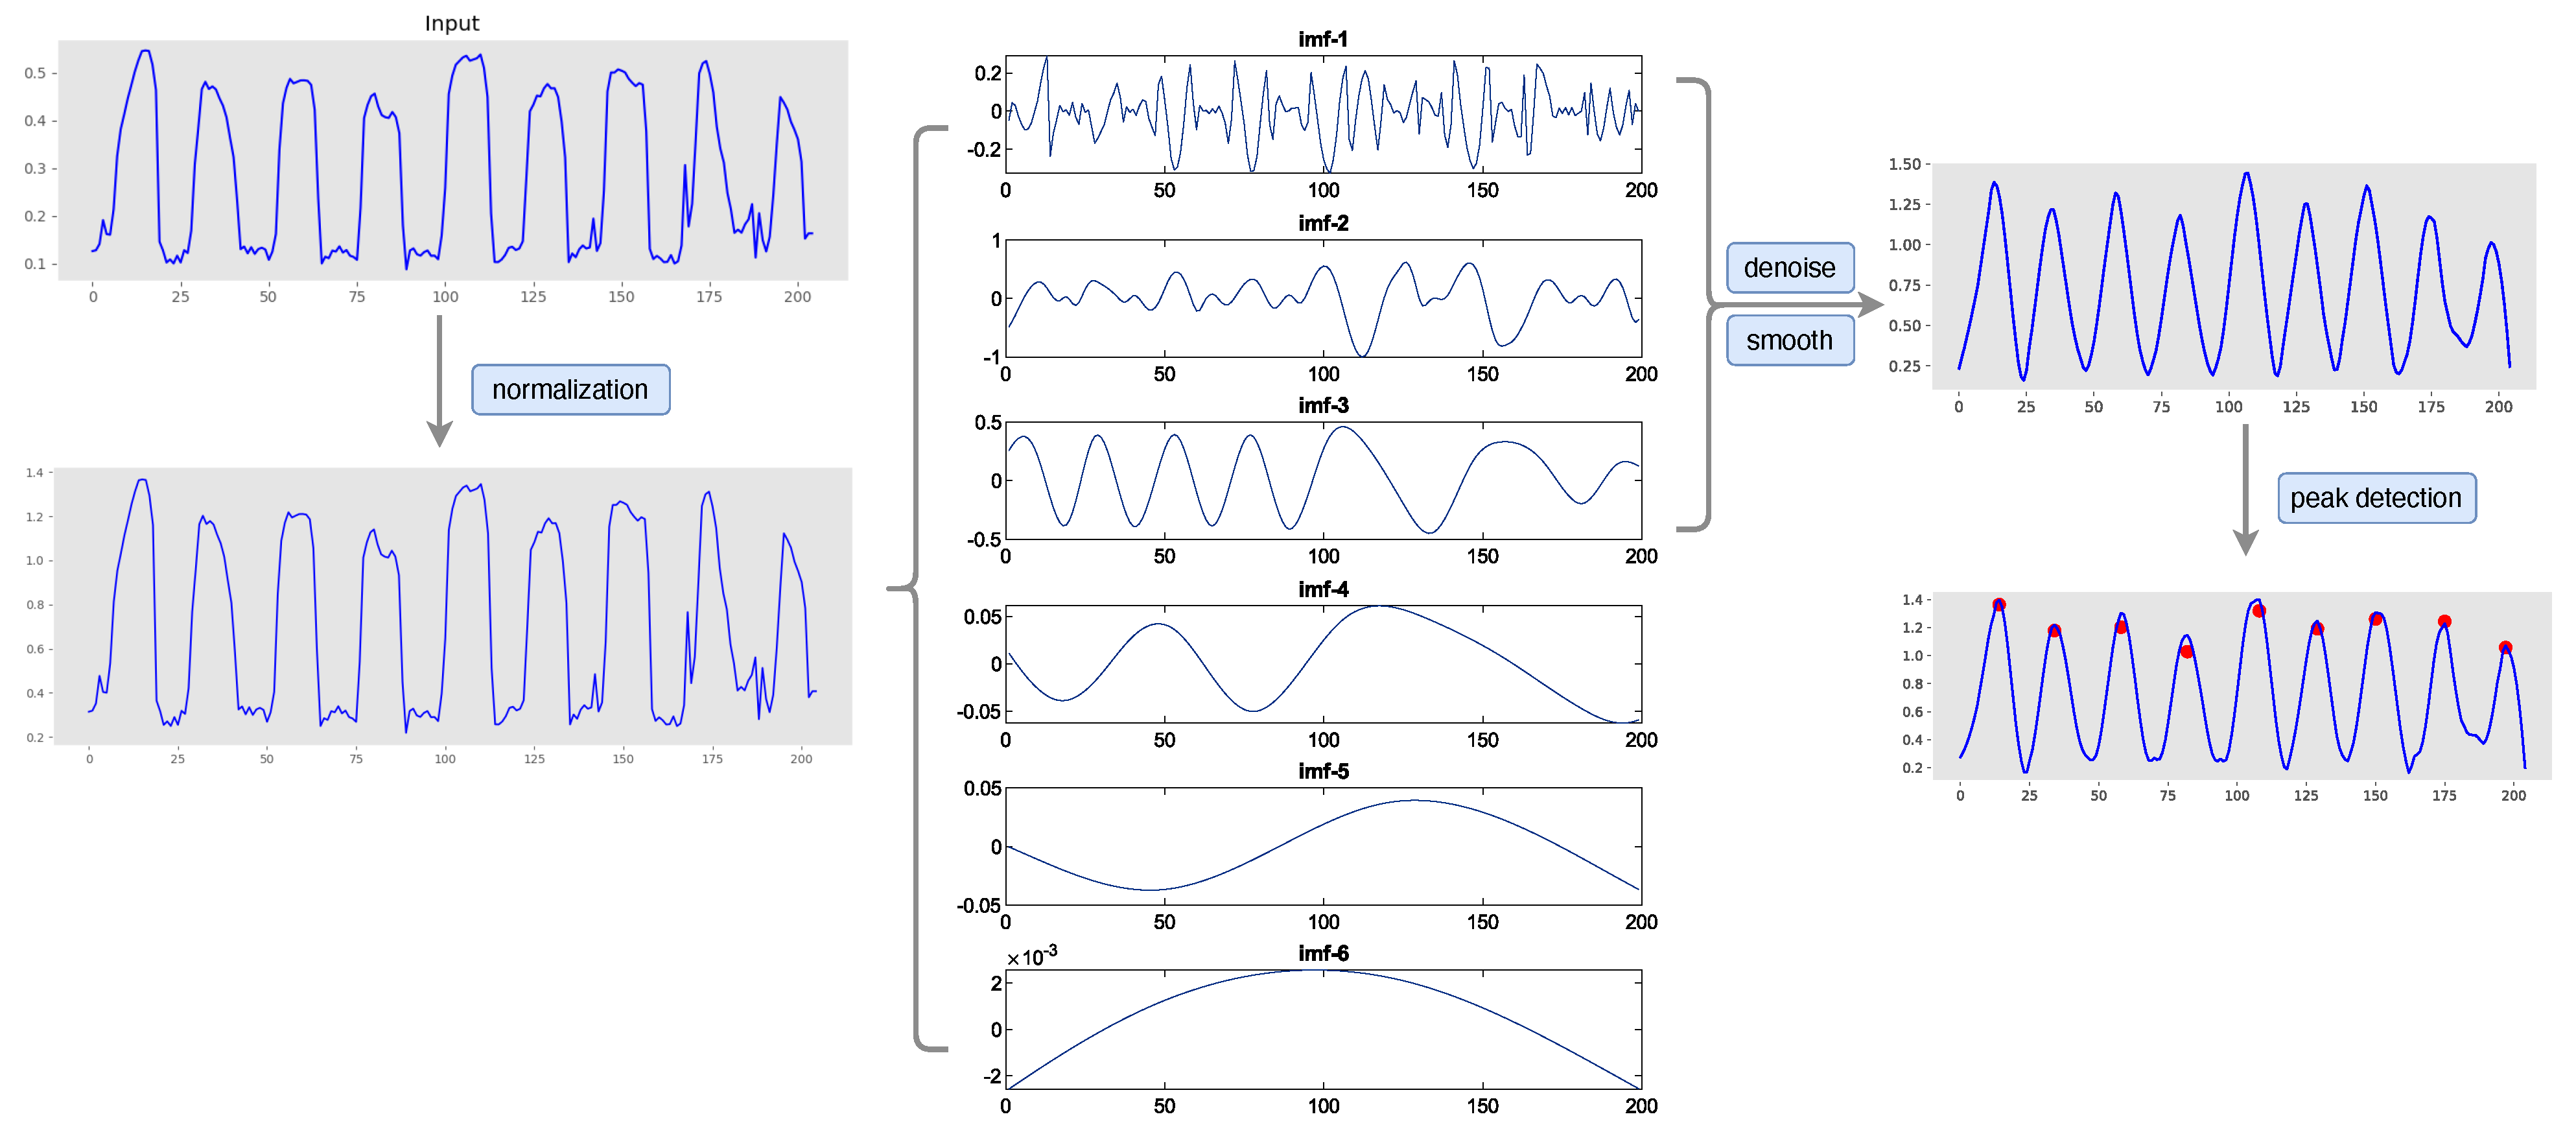
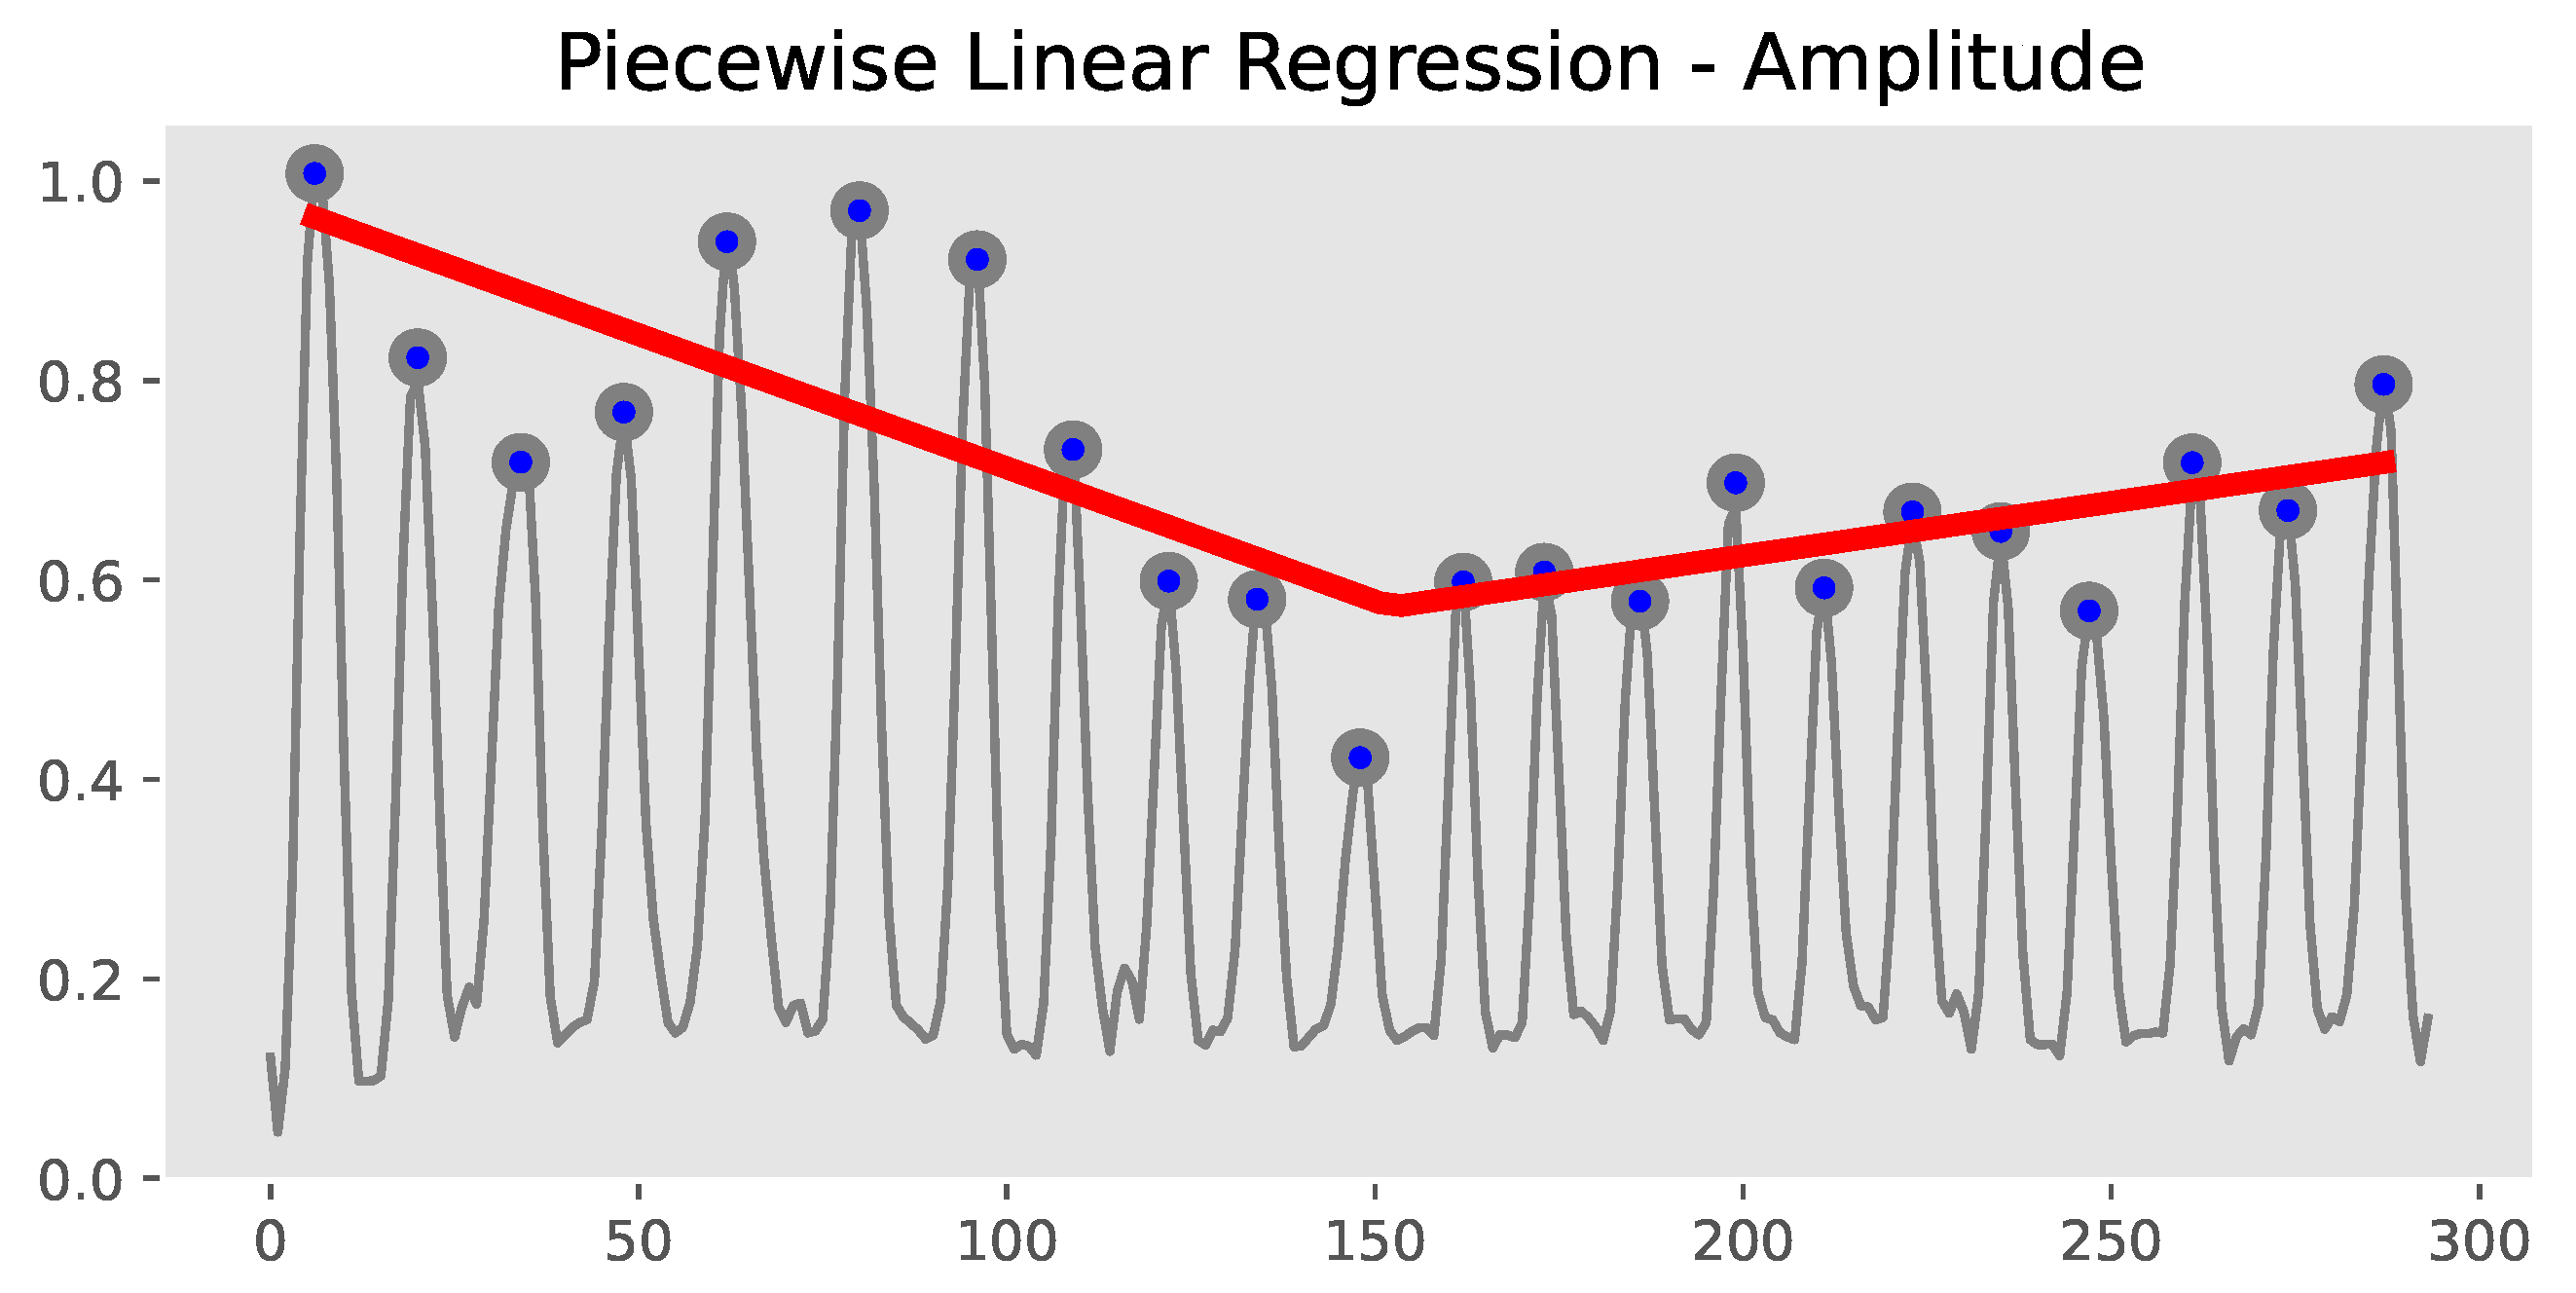
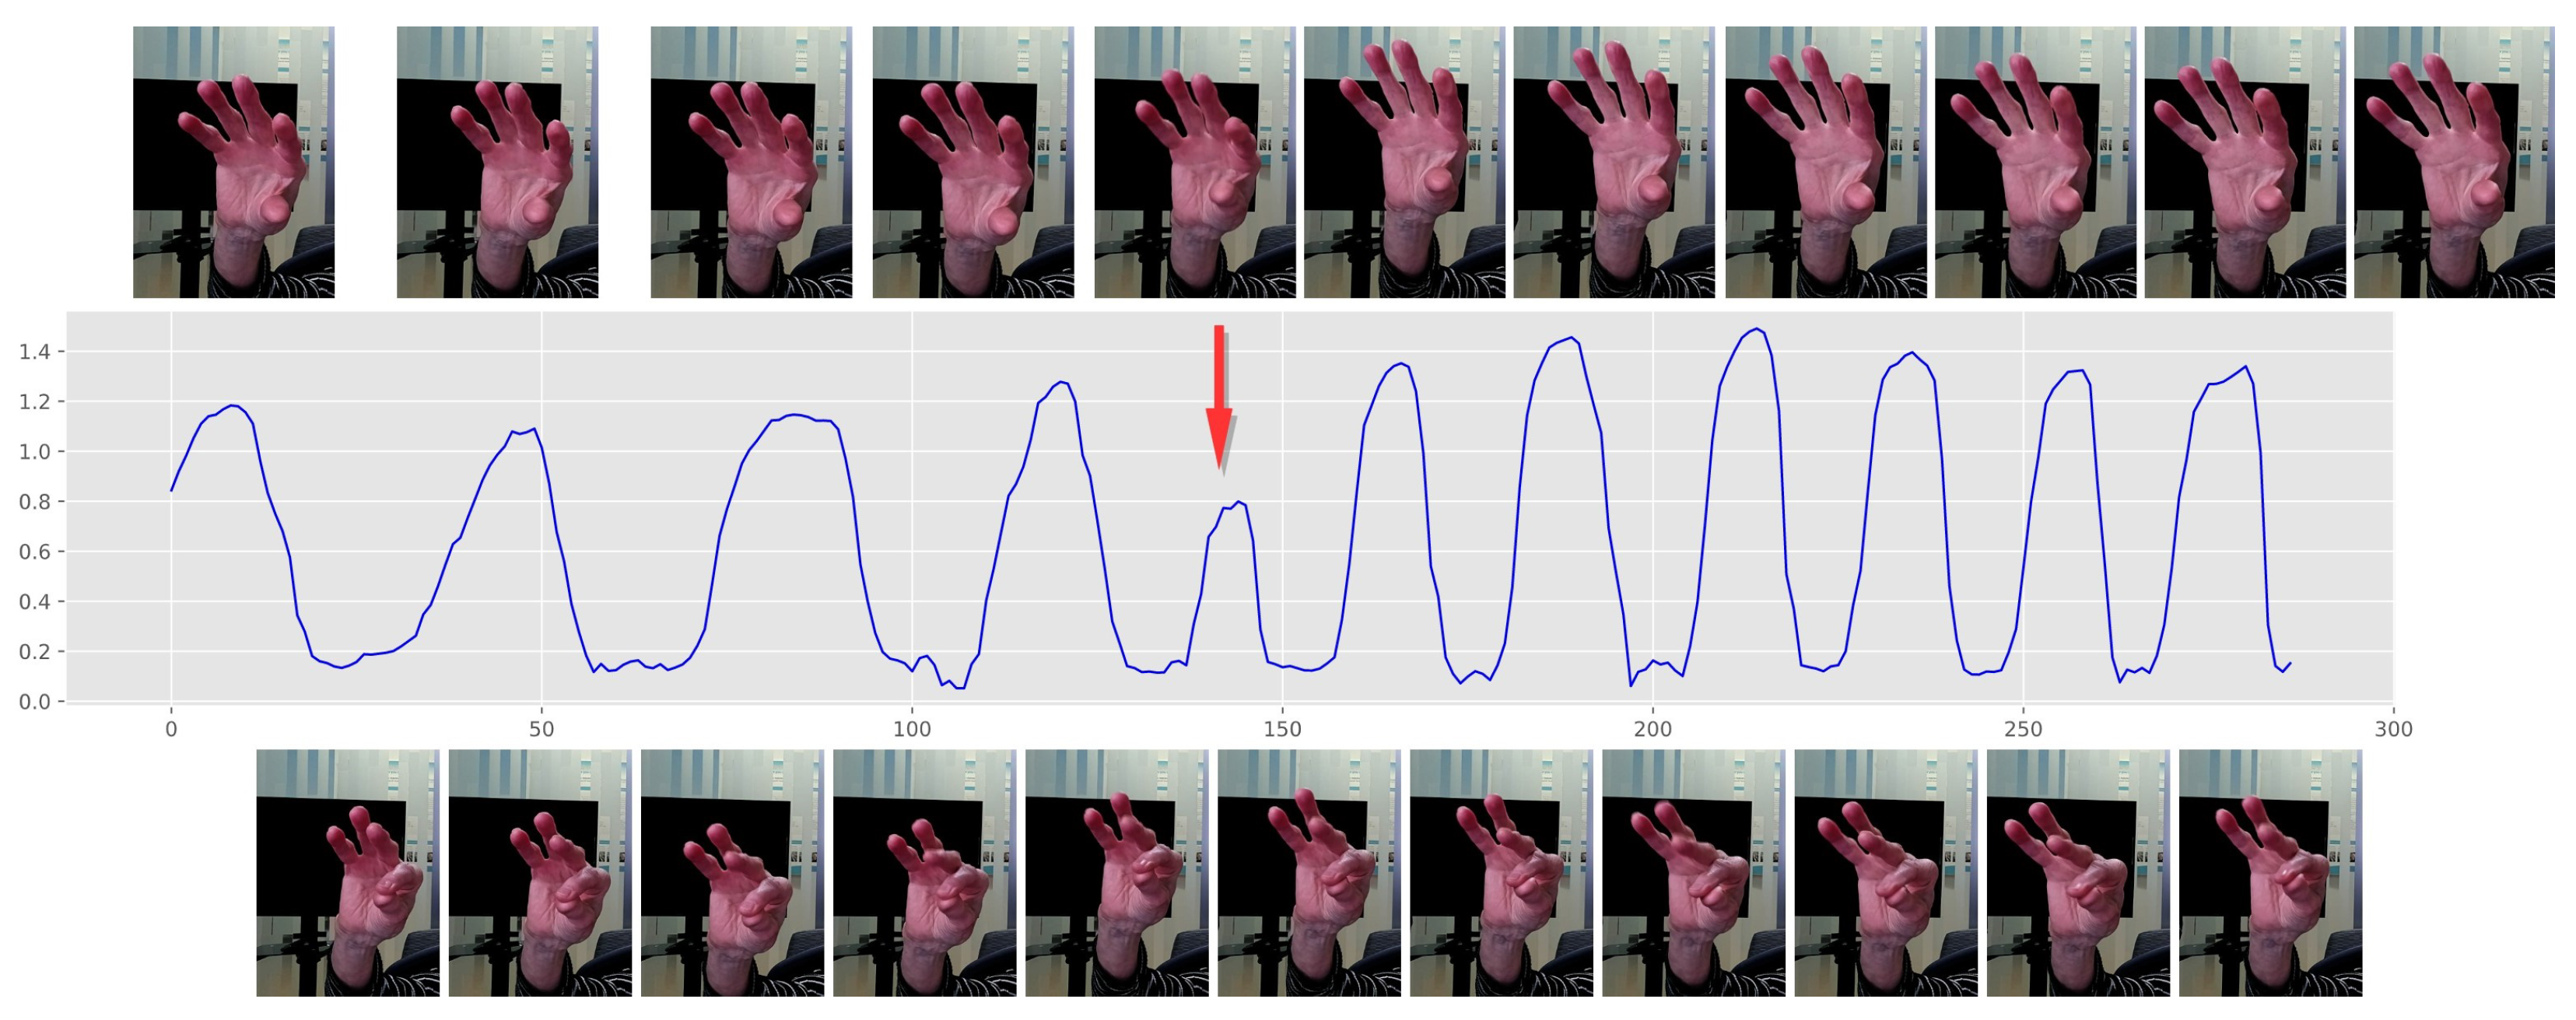
3.2.1. Time Series Preprocessing
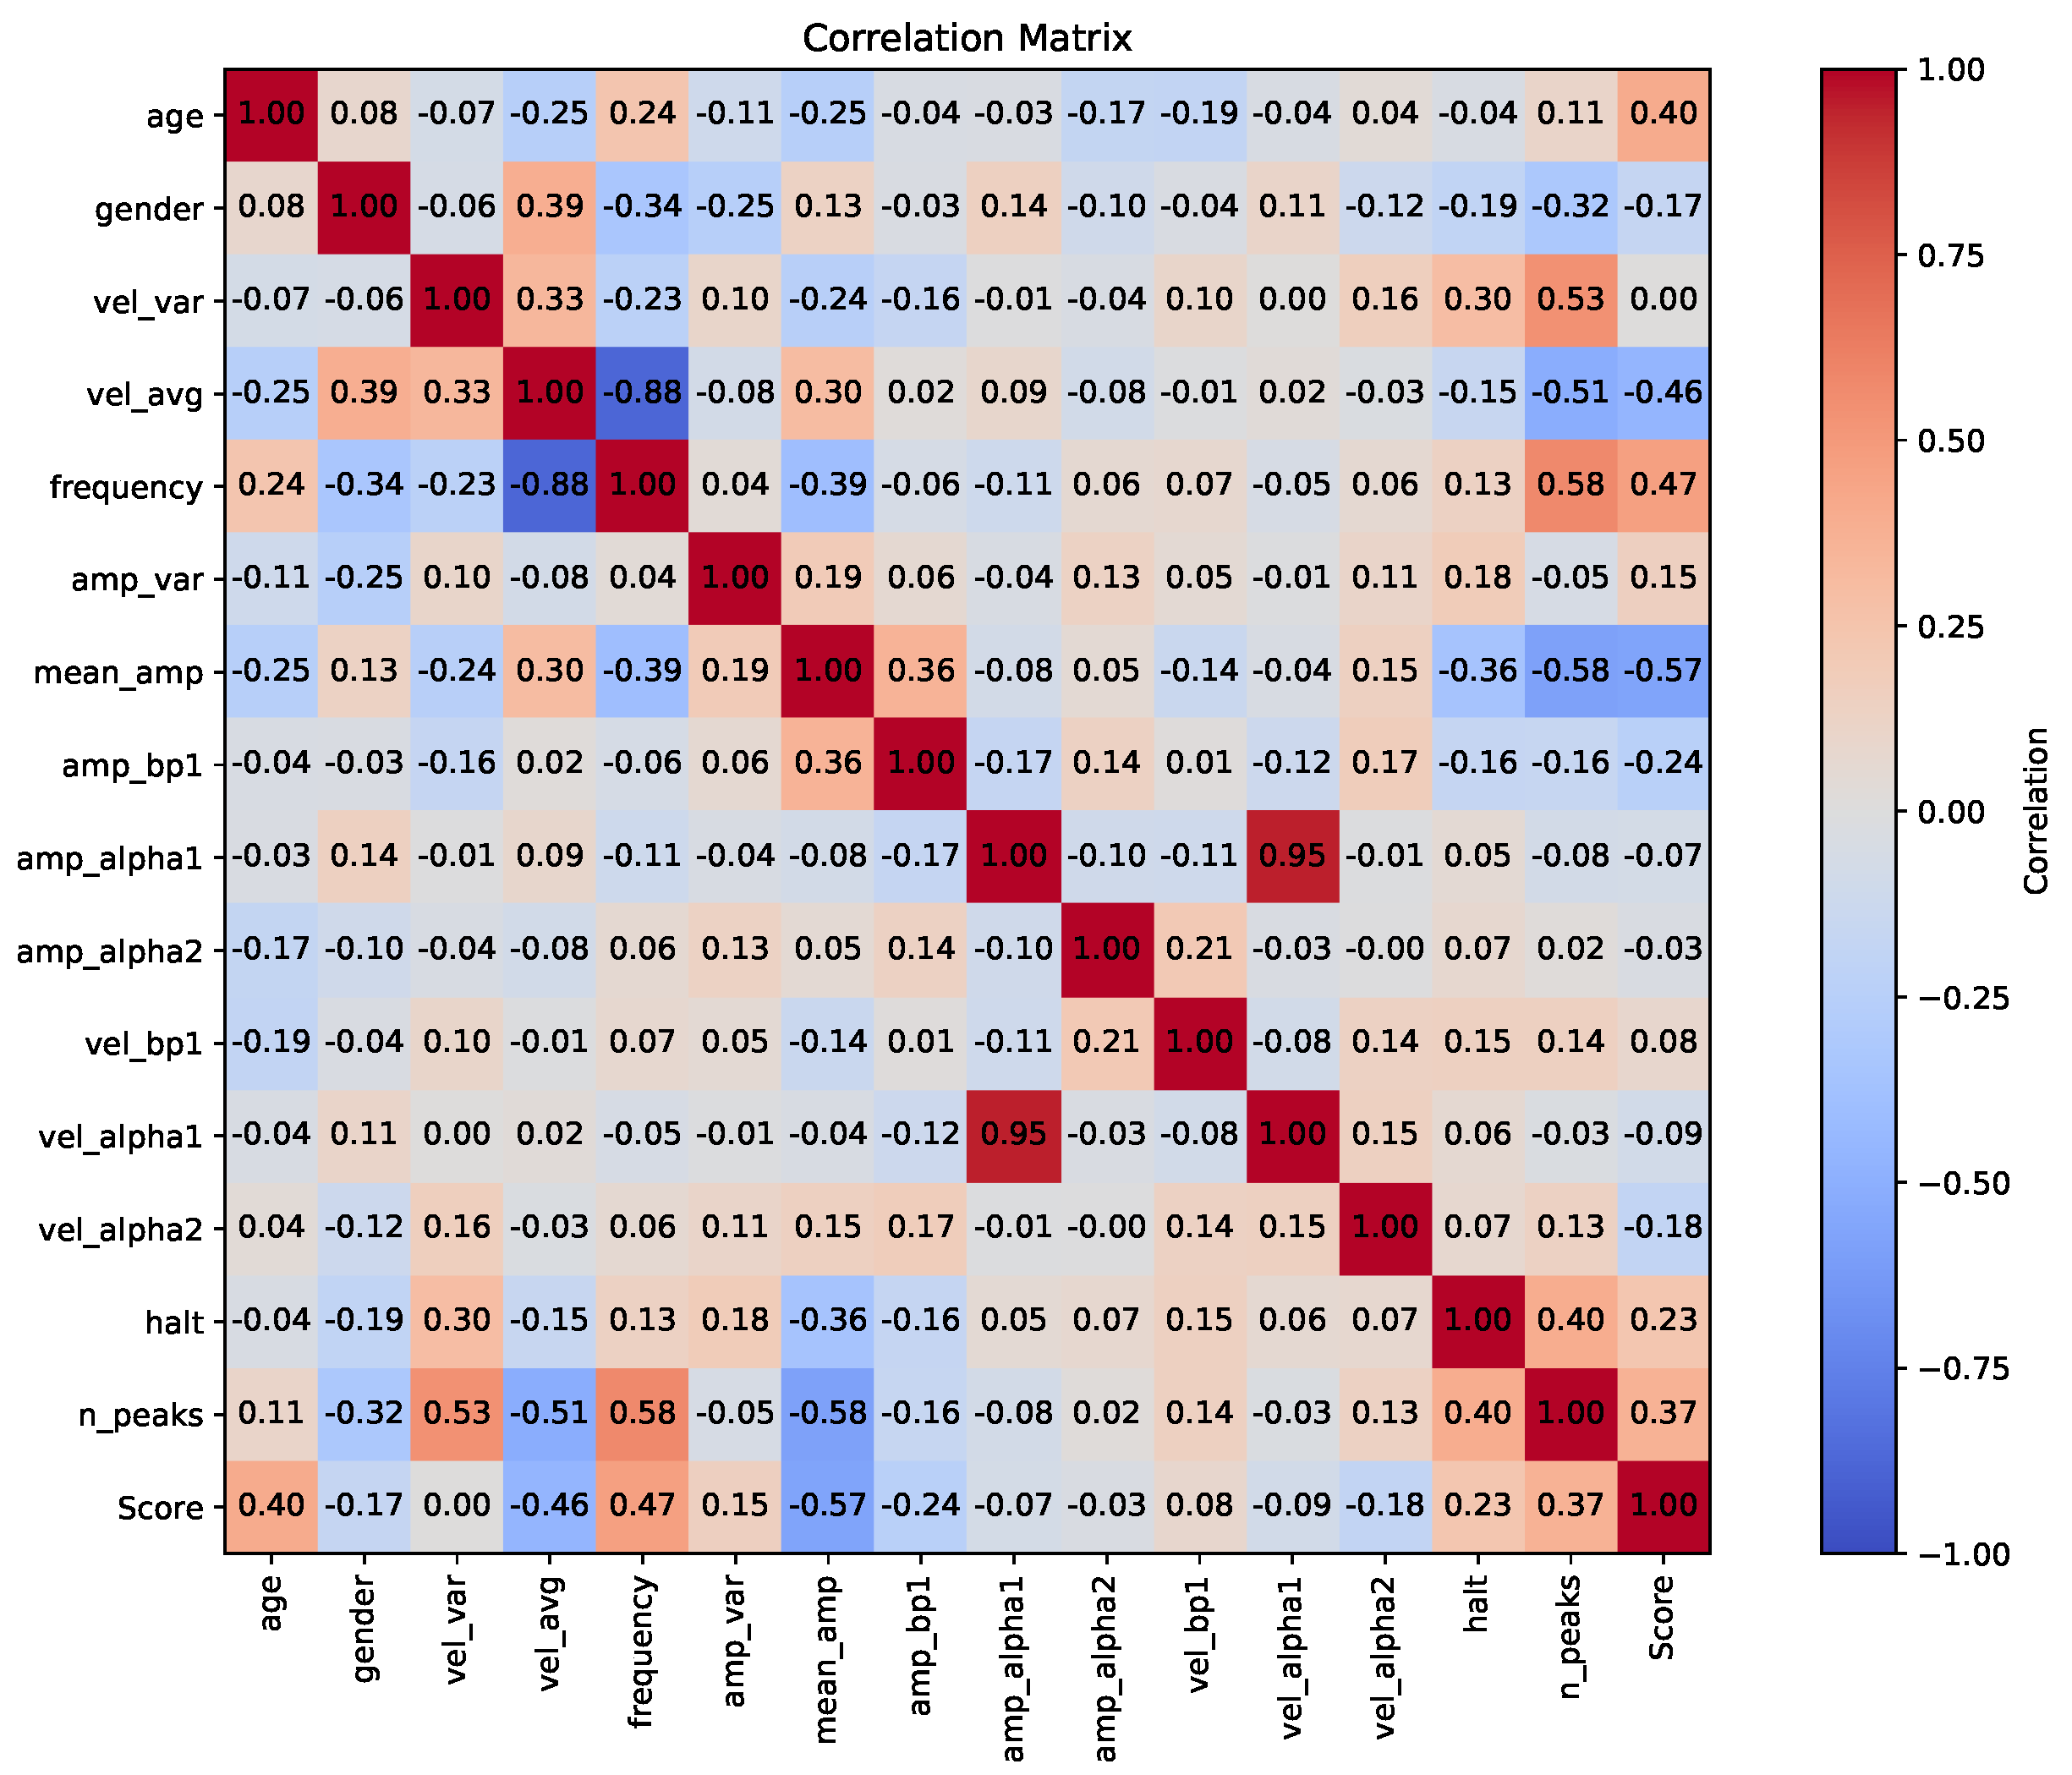
3.2.2. Feature Extraction
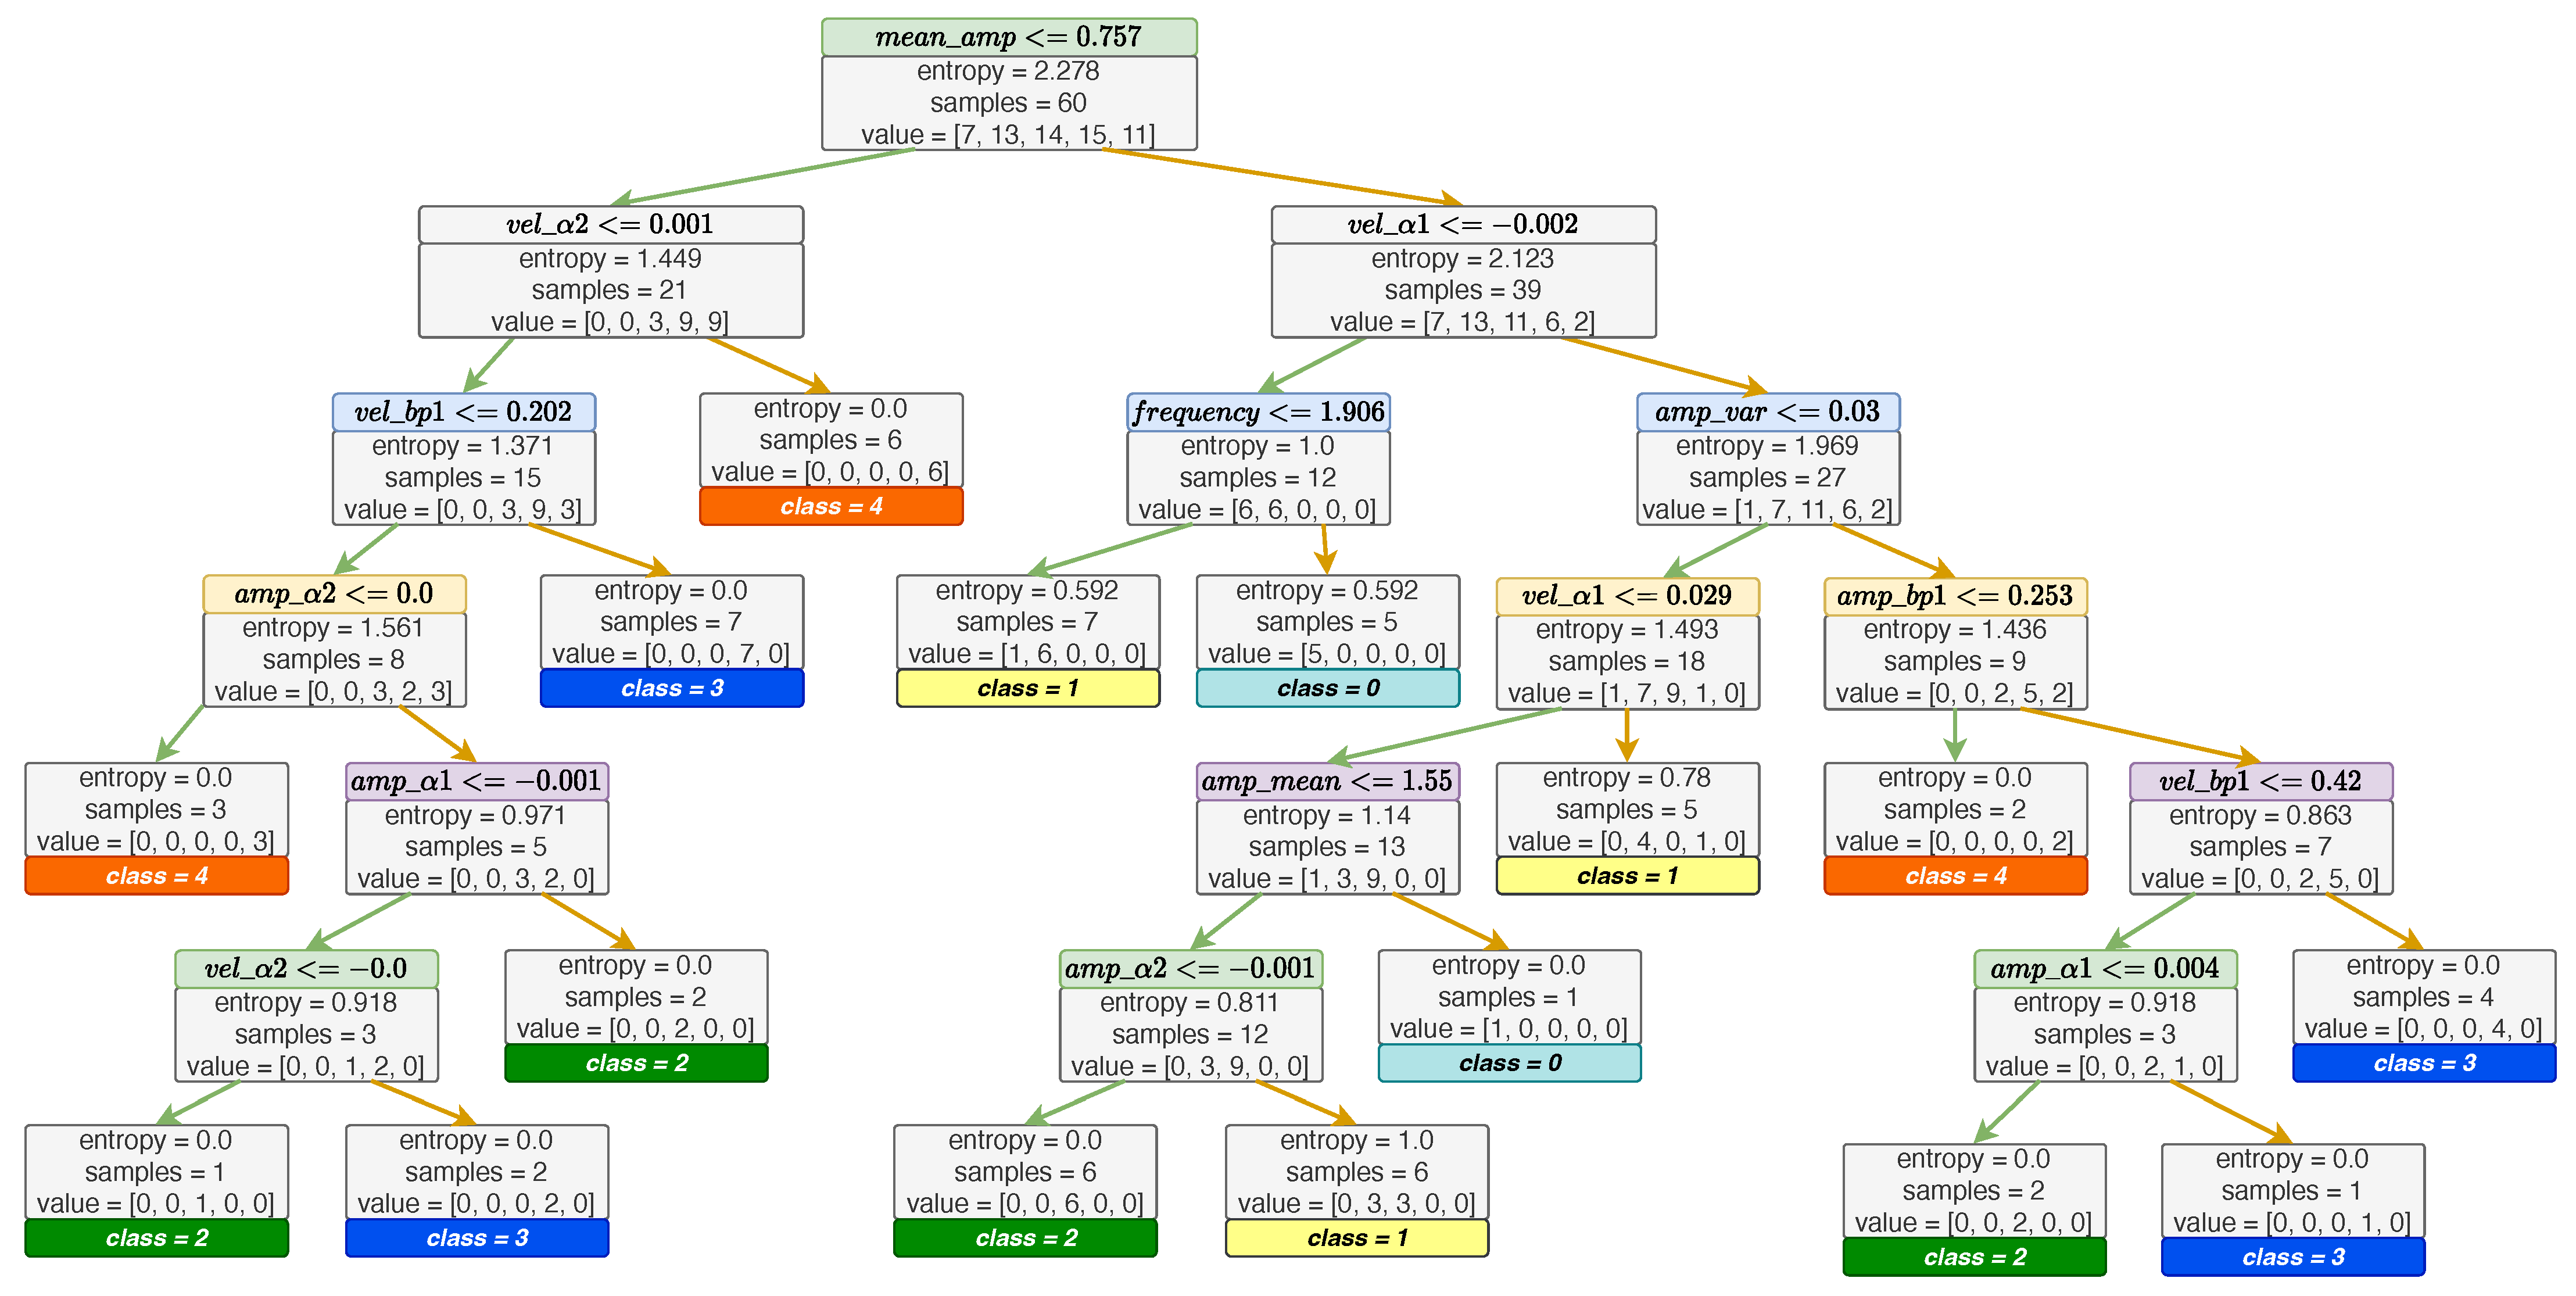
3.2.3. Machine Learning
3.3. Algorithm Deployment Cycle
4. Experiments
4.1. Participants and Dataset
4.2. Evaluation Matrix
- = , which is reported as “Accuracy(t1)”, represents that the prediction is equal to the ground truth .
- , reported as “Accuracy(t2)”, represents that the prediction is within a range of the ground truth, which could also be called “acceptable” accuracy. This situation takes the inter-annotator agreement into consideration, and we will further analyze this situation in the result part.
4.3. Method for Comparison
5. Results and Discussion
5.1. Labeling UPDRS Finger Tapping Videos
5.2. Classification of UPDRS Finger Tapping Score
6. Limitations and Future Work
7. Conclusions
Author Contributions
Funding
Institutional Review Board Statement
Informed Consent Statement
Data Availability Statement
Conflicts of Interest
References
- Balestrino, R.; Schapira, A. Parkinson disease. Eur. J. Neurol. 2020, 27, 27–42. [Google Scholar] [CrossRef] [PubMed]
- Fish, J. Unified Parkinson’s Disease Rating Scale. In Encyclopedia of Clinical Neuropsychology; Kreutzer, J.S., DeLuca, J., Caplan, B., Eds.; Springer: New York, NY, USA, 2011; pp. 2576–2577. [Google Scholar] [CrossRef]
- Goetz, C.G.; Tilley, B.C.; Shaftman, S.R.; Stebbins, G.T.; Fahn, S.; Martinez-Martin, P.; Poewe, W.; Sampaio, C.; Stern, M.B.; Dodel, R.; et al. Movement Disorder Society-sponsored revision of the Unified Parkinson’s Disease Rating Scale (MDS-UPDRS): Scale presentation and clinimetric testing results. Mov. Disord. Off. J. Mov. Disord. Soc. 2008, 23, 2129–2170. [Google Scholar] [CrossRef]
- Morinan, G.; Dushin, Y.; Sarapata, G.; Rupprechter, S.; Peng, Y.; Girges, C.; Salazar, M.; Milabo, C.; Sibley, K.; Foltynie, T.; et al. Computer vision quantification of whole-body Parkinsonian bradykinesia using a large multi-site population. NPJ Park. Dis. 2023, 9, 10. [Google Scholar] [CrossRef]
- Park, S.H.; Seo, N.Y.; Hwang, S.M.; Park, H.Y.; Jung, Y.J. Quantifying Finger-tapping-test Scores using a Three-dimensional Motion Analysis Program: A Preliminary Study. J. Magn. 2022, 27, 411–420. [Google Scholar] [CrossRef]
- Lu, M.; Poston, K.; Pfefferbaum, A.; Sullivan, E.V.; Fei-Fei, L.; Pohl, K.M.; Niebles, J.C.; Adeli, E. Vision-based estimation of MDS-UPDRS gait scores for assessing Parkinson’s disease motor severity. In Proceedings of the Medical Image Computing and Computer Assisted Intervention–MICCAI 2020: 23rd International Conference, Lima, Peru, 4–8 October 2020; Springer: Berlin/Heidelberg, Germany, 2020. Proceedings, Part III 23. pp. 637–647. [Google Scholar]
- Ayaz, Z.; Naz, S.; Khan, N.H.; Razzak, I.; Imran, M. Automated methods for diagnosis of Parkinson’s disease and predicting severity level. Neural Comput. Appl. 2023, 35, 14499–14534. [Google Scholar] [CrossRef]
- Mughal, H.; Javed, A.R.; Rizwan, M.; Almadhor, A.S.; Kryvinska, N. Parkinson’s disease management via wearable sensors: A systematic review. IEEE Access 2022, 10, 35219–35237. [Google Scholar] [CrossRef]
- Balakrishnan, A.; Medikonda, J.; Namboothiri, P.K.; Natarajan, M. Role of wearable sensors with machine learning approaches in gait analysis for Parkinson’s disease assessment: A review. Eng. Sci. 2022, 19, 5–19. [Google Scholar] [CrossRef]
- Joshi, R.; Bronstein, J.M.; Keener, A.; Alcazar, J.; Yang, D.D.; Joshi, M.; Hermanowicz, N. PKG movement recording system use shows promise in routine clinical care of patients with Parkinson’s disease. Front. Neurol. 2019, 10, 1027. [Google Scholar] [CrossRef] [PubMed]
- Hadley, A.J.; Riley, D.E.; Heldman, D.A. Real-world evidence for a smartwatch-based parkinson’s motor assessment app for patients undergoing therapy changes. Digit. Biomarkers 2021, 5, 206–215. [Google Scholar] [CrossRef] [PubMed]
- Schneider, R.B.; Myers, T.L.; Tarolli, C.G.; Amodeo, K.; Adams, J.L.; Jensen-Roberts, S.; Dorsey, E.R. Remote administration of the MDS-UPDRS in the time of COVID-19 and beyond. J. Park. Dis. 2020, 10, 1379–1382. [Google Scholar] [CrossRef]
- Park, K.W.; Wu, H.J.; Yu, T.; Mahal, R.; Mirian, M.S.; McKeown, M.J. Potential Pitfalls of Remote and Automated Video Assessments of Movements Disorders. Mov. Disord. 2023, 38, 504–506. [Google Scholar] [CrossRef] [PubMed]
- Tripathi, S.; Malhotra, A.; Qazi, M.; Chou, J.; Wang, F.; Barkan, S.; Hellmers, N.; Henchcliffe, C.; Sarva, H. Clinical Review of Smartphone Applications in Parkinson’s Disease. Neurologist 2022, 27, 183–193. [Google Scholar] [CrossRef]
- Jeon, H.; Lee, W.; Park, H.; Lee, H.J.; Kim, S.K.; Kim, H.B.; Jeon, B.; Park, K.S. Automatic classification of tremor severity in Parkinson’s disease using a wearable device. Sensors 2017, 17, 2067. [Google Scholar] [CrossRef]
- Mahadevan, N.; Demanuele, C.; Zhang, H.; Volfson, D.; Ho, B.; Erb, M.K.; Patel, S. Development of digital biomarkers for resting tremor and bradykinesia using a wrist-worn wearable device. NPJ Digit. Med. 2020, 3, 5. [Google Scholar] [CrossRef]
- Borzì, L.; Sigcha, L.; Rodríguez-Martín, D.; Olmo, G. Real-time detection of freezing of gait in Parkinson’s disease using multi-head convolutional neural networks and a single inertial sensor. Artif. Intell. Med. 2023, 135, 102459. [Google Scholar] [CrossRef] [PubMed]
- Liu, P.; Yu, N.; Yang, Y.; Yu, Y.; Sun, X.; Yu, H.; Han, J.; Wu, J. Quantitative assessment of gait characteristics in patients with Parkinson’s disease using 2D video. Park. Relat. Disord. 2022, 101, 49–56. [Google Scholar] [CrossRef] [PubMed]
- Talitckii, A.; Kovalenko, E.; Shcherbak, A.; Anikina, A.; Bril, E.; Zimniakova, O.; Semenov, M.; Dylov, D.V.; Somov, A. Comparative study of wearable sensors, video, and handwriting to detect Parkinson’s disease. IEEE Trans. Instrum. Meas. 2022, 71, 2509910. [Google Scholar] [CrossRef]
- Ngo, Q.C.; Motin, M.A.; Pah, N.D.; Drotár, P.; Kempster, P.; Kumar, D. Computerized analysis of speech and voice for Parkinson’s disease: A systematic review. Comput. Methods Programs Biomed. 2022, 226, 107133. [Google Scholar] [CrossRef]
- Aouraghe, I.; Khaissidi, G.; Mrabti, M. A literature review of online handwriting analysis to detect Parkinson’s disease at an early stage. Multimed. Tools Appl. 2023, 82, 11923–11948. [Google Scholar] [CrossRef]
- Yang, Y.; Yuan, Y.; Zhang, G.; Wang, H.; Chen, Y.C.; Liu, Y.; Tarolli, C.G.; Crepeau, D.; Bukartyk, J.; Junna, M.R.; et al. Artificial intelligence-enabled detection and assessment of Parkinson’s disease using nocturnal breathing signals. Nat. Med. 2022, 28, 2207–2215. [Google Scholar] [CrossRef]
- Guo, Z.; Zeng, W.; Yu, T.; Xu, Y.; Xiao, Y.; Cao, X.; Cao, Z. Vision-based finger tapping test in patients with Parkinson’s disease via spatial-temporal 3D hand pose estimation. IEEE J. Biomed. Health Inform. 2022, 26, 3848–3859. [Google Scholar] [CrossRef]
- Ospina, B.M.; Chaparro, J.A.V.; Paredes, J.D.A.; Pino, Y.J.C.; Navarro, A.; Orozco, J.L. Objective arm swing analysis in early-stage Parkinson’s disease using an RGB-D camera (Kinect®). J. Park. Dis. 2018, 8, 563–570. [Google Scholar] [CrossRef] [PubMed]
- Muñoz Ospina, B.; Valderrama Chaparro, J.A.; Arango Paredes, J.D.; Castaño Pino, Y.J.; Navarro, A.; Orozco, J.L. Age matters: Objective gait assessment in early parkinson’s disease using an RGB-D camera. Park. Dis. 2019, 2019, 5050182. [Google Scholar] [CrossRef] [PubMed]
- Fernández-González, P.; Carratalá-Tejada, M.; Monge-Pereira, E.; Collado-Vázquez, S.; Sánchez-Herrera Baeza, P.; Cuesta-Gómez, A.; Oña-Simbaña, E.D.; Jardón-Huete, A.; Molina-Rueda, F.; Balaguer-Bernaldo de Quirós, C.; et al. Leap motion controlled video game-based therapy for upper limb rehabilitation in patients with Parkinson’s disease: A feasibility study. J. Neuroeng. Rehabil. 2019, 16, 133. [Google Scholar] [CrossRef]
- Butt, A.H.; Rovini, E.; Dolciotti, C.; De Petris, G.; Bongioanni, P.; Carboncini, M.; Cavallo, F. Objective and automatic classification of Parkinson disease with Leap Motion controller. Biomed. Eng. Online 2018, 17, 1–21. [Google Scholar] [CrossRef]
- Khwaounjoo, P.; Singh, G.; Grenfell, S.; Özsoy, B.; MacAskill, M.R.; Anderson, T.J.; Çakmak, Y.O. Non-Contact Hand Movement Analysis for Optimal Configuration of Smart Sensors to Capture Parkinson’s Disease Hand Tremor. Sensors 2022, 22, 4613. [Google Scholar] [CrossRef]
- Moshkova, A.; Samorodov, A.; Voinova, N.; Volkov, A.; Ivanova, E.; Fedotova, E. Parkinson’s disease detection by using machine learning algorithms and hand movement signal from LeapMotion sensor. In Proceedings of the 2020 26th Conference of Open Innovations Association (FRUCT), Yaroslavl, Russia, 20–24 April 2020; pp. 321–327. [Google Scholar]
- Sarapata, G.; Dushin, Y.; Morinan, G.; Ong, J.; Budhdeo, S.; Kainz, B.; O’Keeffe, J. Video-based activity recognition for automated motor assessment of Parkinson’s disease. IEEE J. Biomed. Health Inform. 2023, 10, 5032–5041. [Google Scholar] [CrossRef]
- Islam, M.S.; Rahman, W.; Abdelkader, A.; Yang, P.T.; Lee, S.; Adams, J.L.; Schneider, R.B.; Dorsey, E.; Hoque, E. Using AI to Measure Parkinson’s Disease Severity at Home. arXiv 2023, arXiv:2303.17573. [Google Scholar]
- Park, K.W.; Lee, E.J.; Lee, J.S.; Jeong, J.; Choi, N.; Jo, S.; Jung, M.; Do, J.Y.; Kang, D.W.; Lee, J.G.; et al. Machine learning–based automatic rating for cardinal symptoms of Parkinson disease. Neurology 2021, 96, e1761–e1769. [Google Scholar] [CrossRef] [PubMed]
- Scott, B.; Seyres, M.; Philp, F.; Chadwick, E.K.; Blana, D. Healthcare applications of single camera markerless motion capture: A scoping review. PeerJ 2022, 10, e13517. [Google Scholar] [CrossRef] [PubMed]
- Moro, M.; Marchesi, G.; Hesse, F.; Odone, F.; Casadio, M. Markerless vs. marker-based gait analysis: A proof of concept study. Sensors 2022, 22, 2011. [Google Scholar] [CrossRef]
- Cao, Z.; Simon, T.; Wei, S.E.; Sheikh, Y. Realtime multi-person 2d pose estimation using part affinity fields. In Proceedings of the IEEE Conference on Computer Vision and Pattern Recognition, Honolulu, HI, USA, 21–26 July 2017; pp. 7291–7299. [Google Scholar]
- Lugaresi, C.; Tang, J.; Nash, H.; McClanahan, C.; Uboweja, E.; Hays, M.; Zhang, F.; Chang, C.L.; Yong, M.G.; Lee, J.; et al. MediaPipe: A framework for building perception pipelines. arXiv 2004, arXiv:1906.08172. [Google Scholar]
- Fang, H.S.; Li, J.; Tang, H.; Xu, C.; Zhu, H.; Xiu, Y.; Li, Y.L.; Lu, C. Alphapose: Whole-body regional multi-person pose estimation and tracking in real-time. IEEE Trans. Pattern Anal. Mach. Intell. 2023, 45, 7157–7173. [Google Scholar] [CrossRef] [PubMed]
- Vignoud, G.; Desjardins, C.; Salardaine, Q.; Mongin, M.; Garcin, B.; Venance, L.; Degos, B. Video-Based Automated Assessment of Movement Parameters Consistent with MDS-UPDRS III in Parkinson’s Disease. J. Park. Dis. 2022, 12, 2211–2222. [Google Scholar] [CrossRef]
- Liu, W.; Lin, X.; Chen, X.; Wang, Q.; Wang, X.; Yang, B.; Cai, N.; Chen, R.; Chen, G.; Lin, Y. Vision-based estimation of MDS-UPDRS scores for quantifying Parkinson’s disease tremor severity. Med. Image Anal. 2023, 85, 102754. [Google Scholar] [CrossRef] [PubMed]
- Li, H.; Shao, X.; Zhang, C.; Qian, X. Automated assessment of Parkinsonian finger tapping tests through a vision-based fine-grained classification model. Neurocomputing 2021, 441, 260–271. [Google Scholar] [CrossRef]
- Liang, J.; Lugmayr, A.; Zhang, K.; Danelljan, M.; Van Gool, L.; Timofte, R. Hierarchical conditional flow: A unified framework for image super-resolution and image rescaling. arXiv 2021, arXiv:2108.05301. [Google Scholar]
- Pan, Z.; Li, B.; He, D.; Yao, M.; Wu, W.; Lin, T.; Li, X.; Ding, E. Towards bidirectional arbitrary image rescaling: Joint optimization and cycle idempotence. arXiv 2022, arXiv:2203.00911. [Google Scholar]
- Li, J.; Wang, L.; Xu, B. Research on Motion Blur Image of Infrared Target Deblurring Based on Wavelet Transform. J. Phys. Conf. Ser. 2020, 1570, 012080. [Google Scholar] [CrossRef]
- Shi, Z.; Xu, X.; Liu, X.; Chen, J.; Yang, M.H. Video frame interpolation transformer. arXiv 2022, arXiv:2111.13817. [Google Scholar]
- Mazurowski, M.A.; Dong, H.; Gu, H.; Yang, J.; Konz, N.; Zhang, Y. Segment anything model for medical image analysis: An experimental study. Med. Image Anal. 2023, 89, 102918. [Google Scholar] [CrossRef]
- Ho, P.W.L.; Leung, C.T.; Liu, H.; Pang, S.Y.Y.; Lam, C.S.C.; Xian, J.; Li, L.; Kung, M.H.W.; Ramsden, D.B.; Ho, S.L. Age-dependent accumulation of oligomeric SNCA/α-synuclein from impaired degradation in mutant LRRK2 knockin mouse model of Parkinson disease: Role for therapeutic activation of chaperone-mediated autophagy (CMA). Autophagy 2020, 16, 347–370. [Google Scholar] [CrossRef]
- Kang, K.W.; Choi, S.M.; Kim, B.C. Gender differences in motor and non-motor symptoms in early Parkinson disease. Medicine 2022, 101, e28643. [Google Scholar] [CrossRef] [PubMed]
- Nutt, J.G.; Bloem, B.R.; Giladi, N.; Hallett, M.; Horak, F.B.; Nieuwboer, A. Freezing of gait: Moving forward on a mysterious clinical phenomenon. Lancet Neurol. 2011, 10, 734–744. [Google Scholar] [CrossRef] [PubMed]
- Li, Z.; Lu, K.; Cai, M.; Liu, X.; Wang, Y.; Yang, J. An Automatic Evaluation Method for Parkinson’s Dyskinesia Using Finger Tapping Video for Small Samples. J. Med. Biol. Eng. 2022, 42, 351–363. [Google Scholar] [CrossRef]
- Williams, S.; Wong, D.; Alty, J.E.; Relton, S.D. Parkinsonian hand or clinician’s eye? Finger tap Bradykinesia interrater reliability for 21 movement disorder experts. J. Park. Dis. 2023, 13, 525–536. [Google Scholar] [CrossRef]
- Nieuwboer, A.; Vercruysse, S.; Feys, P.; Levin, O.; Spildooren, J.; Swinnen, S. Upper limb movement interruptions are correlated to freezing of gait in Parkinson’s disease. Eur. J. Neurosci. 2009, 29, 1422–1430. [Google Scholar] [CrossRef] [PubMed]


| UPDRS Score | Symptoms |
|---|---|
| 0: Normal | No problems. |
| 1: Slight | Any of the following: |
| a. one or two interruptions or hesitations; | |
| b. slight slowing; | |
| c. the amplitude decrements near the end. | |
| 2: Mild | Any of the following: |
| a. 3 to 5 interruptions during tapping; | |
| b. mild slowing; | |
| c. the amplitude decrements midway in the 10-tap sequence. | |
| 3: Moderate | Any of the following: |
| a. more than 5 interruptions or at least one longer arrest (freeze) in ongoing movement; | |
| b. moderate slowing; | |
| c. the amplitude decrements starting after the 1st tap. | |
| 4: Severe | Cannot or can only barely perform the task because of slowing, interruptions, or decrements. |
| Authors, Year [Ref] | Input | Pose Estimation | Extracted Features | Method | Results | Tasks |
|---|---|---|---|---|---|---|
| Z. Guo et al., 2022 [23] | RGB–depth | A2J | Amplitude, velocity | SVM | Severity level | Finger tapping |
| Morinan et al., 2023 [4] | RGB | Openpose | 11 features representing speed, amplitude, hesitations, and decrement | Random Forest | Binary/ordinal classification | Finger tapping |
| Sarapata et al., 2023 [30] | RGB | Openpose | Region of interest extraction of motor tasks, followed by kinetic feature extraction for each task | Random Forest | Binary/ordinal classification | Finger tapping, hand movement, pronation/supination, toe tapping, leg agility, rising from a chair, gait |
| Islam et al., 2023 [31] | RGB | MediaPipe | 53 features representing speed, amplitude, hesitations, and decrement | LightGBM | Regression | Finger tapping |
| Proposed method | RGB | MediaPipe | 15 features representing demographics, amplitude, velocity, halt and hesitations, and decrement | Decision Tree | Severity level | Finger tapping |
| Features | Description |
|---|---|
| Age of the patients | |
| Gender of the patients | |
| Variance of the amplitude | |
| Mean of the amplitude | |
| Breakpoint of the amplitude | |
| Slope 1 of the amplitude | |
| Slope 2 of the amplitude | |
| Variance of the velocity | |
| Mean velocity of the finger movement | |
| Breakpoint of the velocity | |
| Slope 1 of the velocity | |
| Slope 2 of the velocity | |
| Frequency of finger tapping | |
| Number of halts and hesitations | |
| Number of peaks of the time series |
| Baseline Characteristics | |
|---|---|
| Age, years | |
| Median | 71 |
| Mean (SD) | 69.65 |
| Sex | |
| Female/Male, n/n (%/%) | 19/31(38/62) |
| Need assistance for walking, n (%) | 2 (4) |
| Dominant side of Parkinsonism | |
| Left | 23 |
| Right | 27 |
| UPDRS Score | |
| 0/1/2/3/4, n | 8/21/18/17/11 |
| Complete | Acceptable | None |
|---|---|---|
| 52% | 97% | 3% |
| Method | Evaluation Metric | ||||
|---|---|---|---|---|---|
| Accuracy(t1) | Accuracy(t2) | Precision | Recall | F1 | |
| AEMPD-FCN [49] | 0.267 | 0.60 | 0.18 | 0.19 | 0.173 |
| FTTST [23] | 0.467 | 0.80 | 0.50 | 0.60 | 0.513 |
| - | 0.467 | 0.733 | 0.480 | 0.60 | 0.509 |
| -- | 0.533 | 0.867 | 0.553 | 0.590 | 0.556 |
| F15- | 0.533 | 0.867 | 0.533 | 0.552 | 0.540 |
| - | 0.80 | 0.933 | 0.843 | 0.80 | 0.797 |
Disclaimer/Publisher’s Note: The statements, opinions and data contained in all publications are solely those of the individual author(s) and contributor(s) and not of MDPI and/or the editor(s). MDPI and/or the editor(s) disclaim responsibility for any injury to people or property resulting from any ideas, methods, instructions or products referred to in the content. |
© 2023 by the authors. Licensee MDPI, Basel, Switzerland. This article is an open access article distributed under the terms and conditions of the Creative Commons Attribution (CC BY) license (https://creativecommons.org/licenses/by/4.0/).
Share and Cite
Yu, T.; Park, K.W.; McKeown, M.J.; Wang, Z.J. Clinically Informed Automated Assessment of Finger Tapping Videos in Parkinson’s Disease. Sensors 2023, 23, 9149. https://doi.org/10.3390/s23229149
Yu T, Park KW, McKeown MJ, Wang ZJ. Clinically Informed Automated Assessment of Finger Tapping Videos in Parkinson’s Disease. Sensors. 2023; 23(22):9149. https://doi.org/10.3390/s23229149
Chicago/Turabian StyleYu, Tianze, Kye Won Park, Martin J. McKeown, and Z. Jane Wang. 2023. "Clinically Informed Automated Assessment of Finger Tapping Videos in Parkinson’s Disease" Sensors 23, no. 22: 9149. https://doi.org/10.3390/s23229149
APA StyleYu, T., Park, K. W., McKeown, M. J., & Wang, Z. J. (2023). Clinically Informed Automated Assessment of Finger Tapping Videos in Parkinson’s Disease. Sensors, 23(22), 9149. https://doi.org/10.3390/s23229149