
Non-Intrusive Load Monitoring for Residential Appliances with Ultra-Sparse Sample and Real-Time Computation

 ,
,
Abstract
:1. Introduction
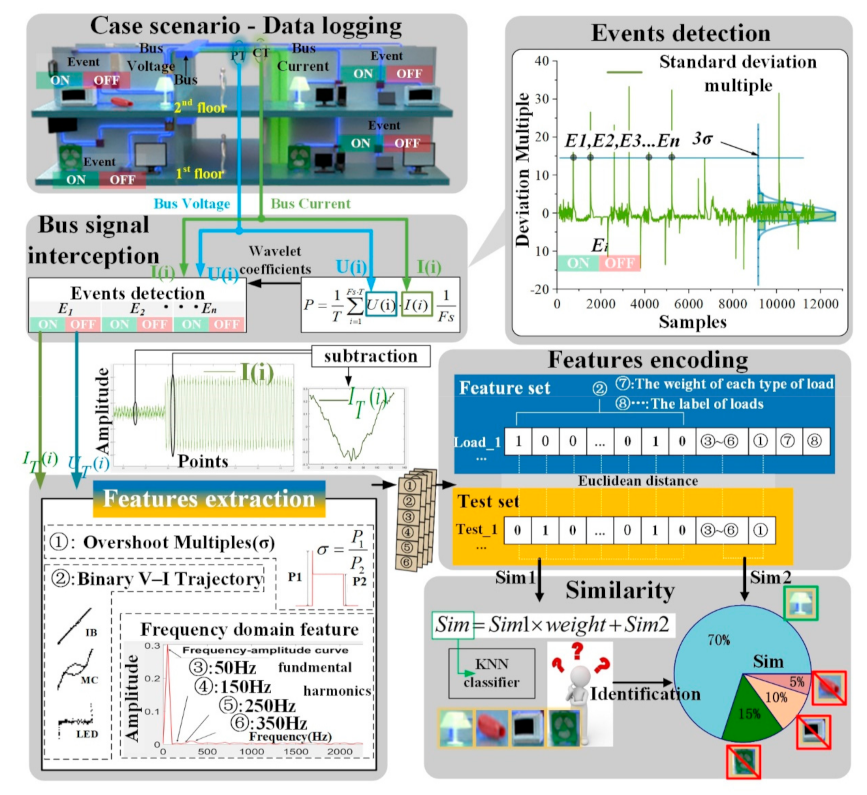
2. Methodology
3. Sparse Sample and Real-Time Computation Method for NILM
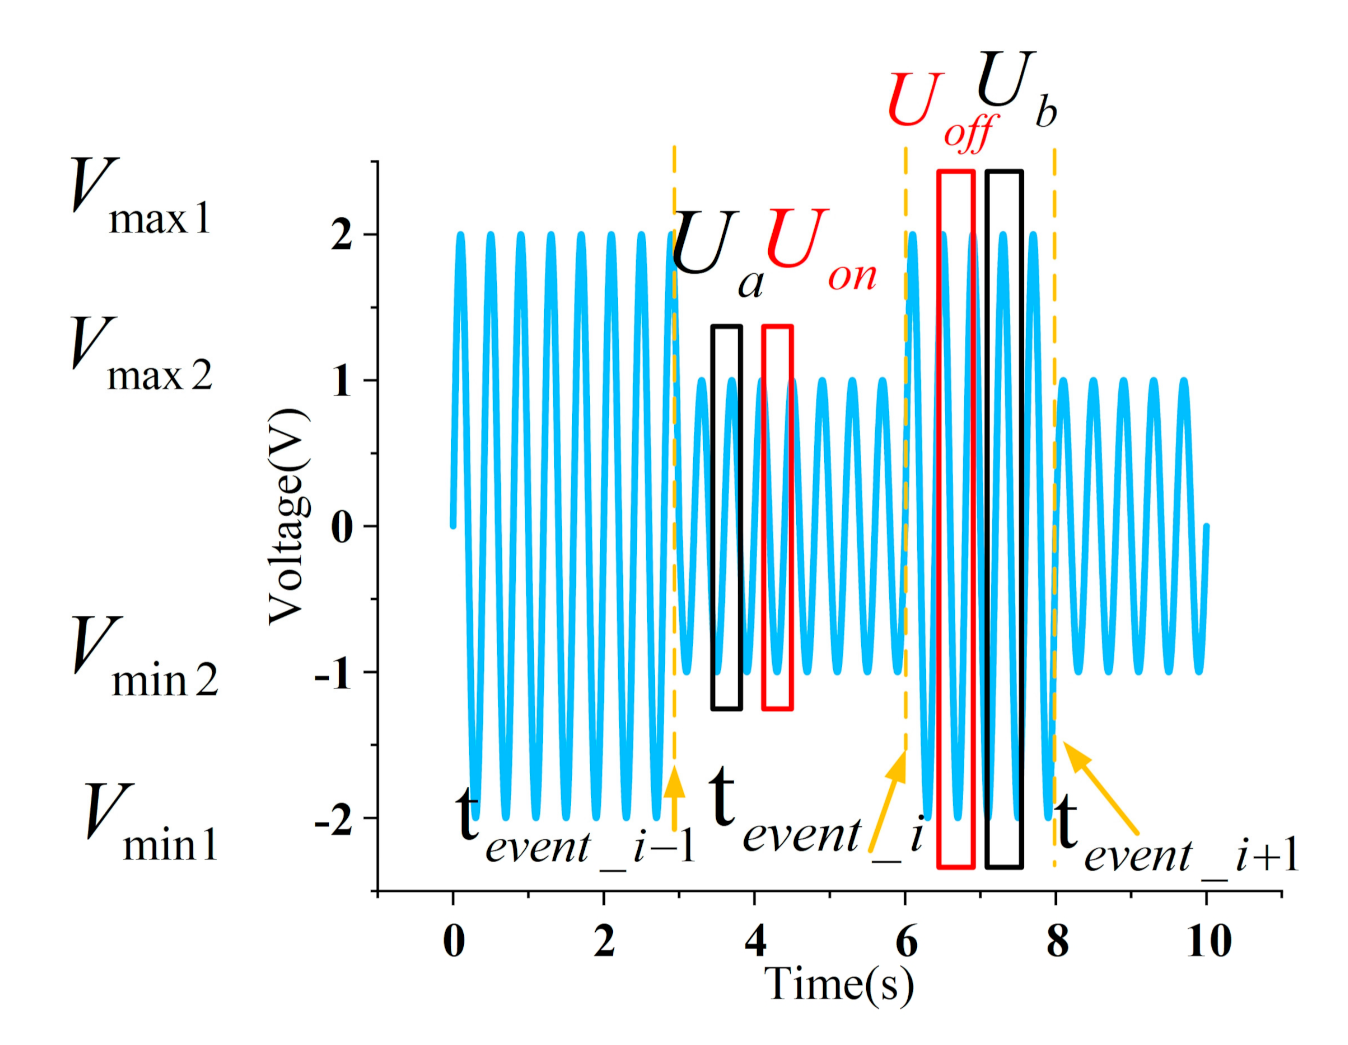
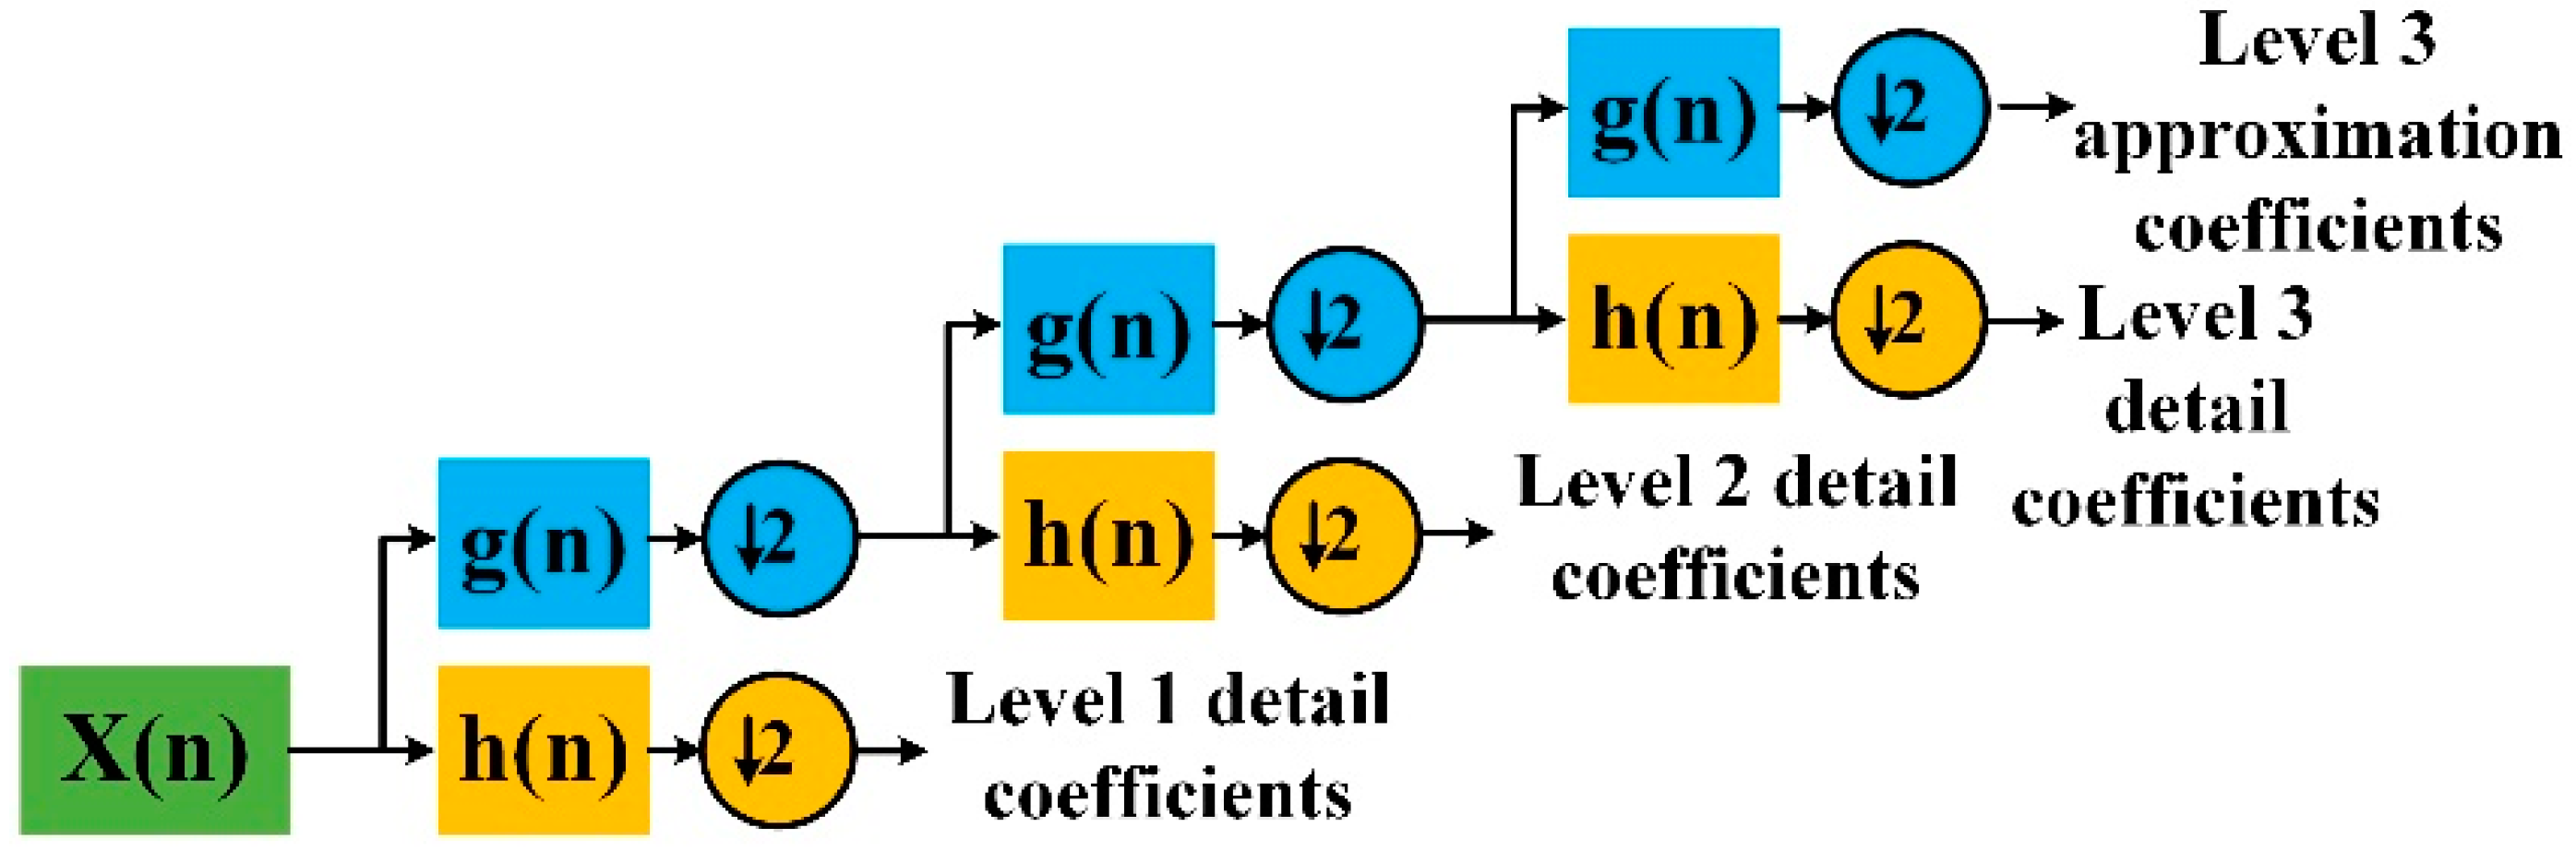
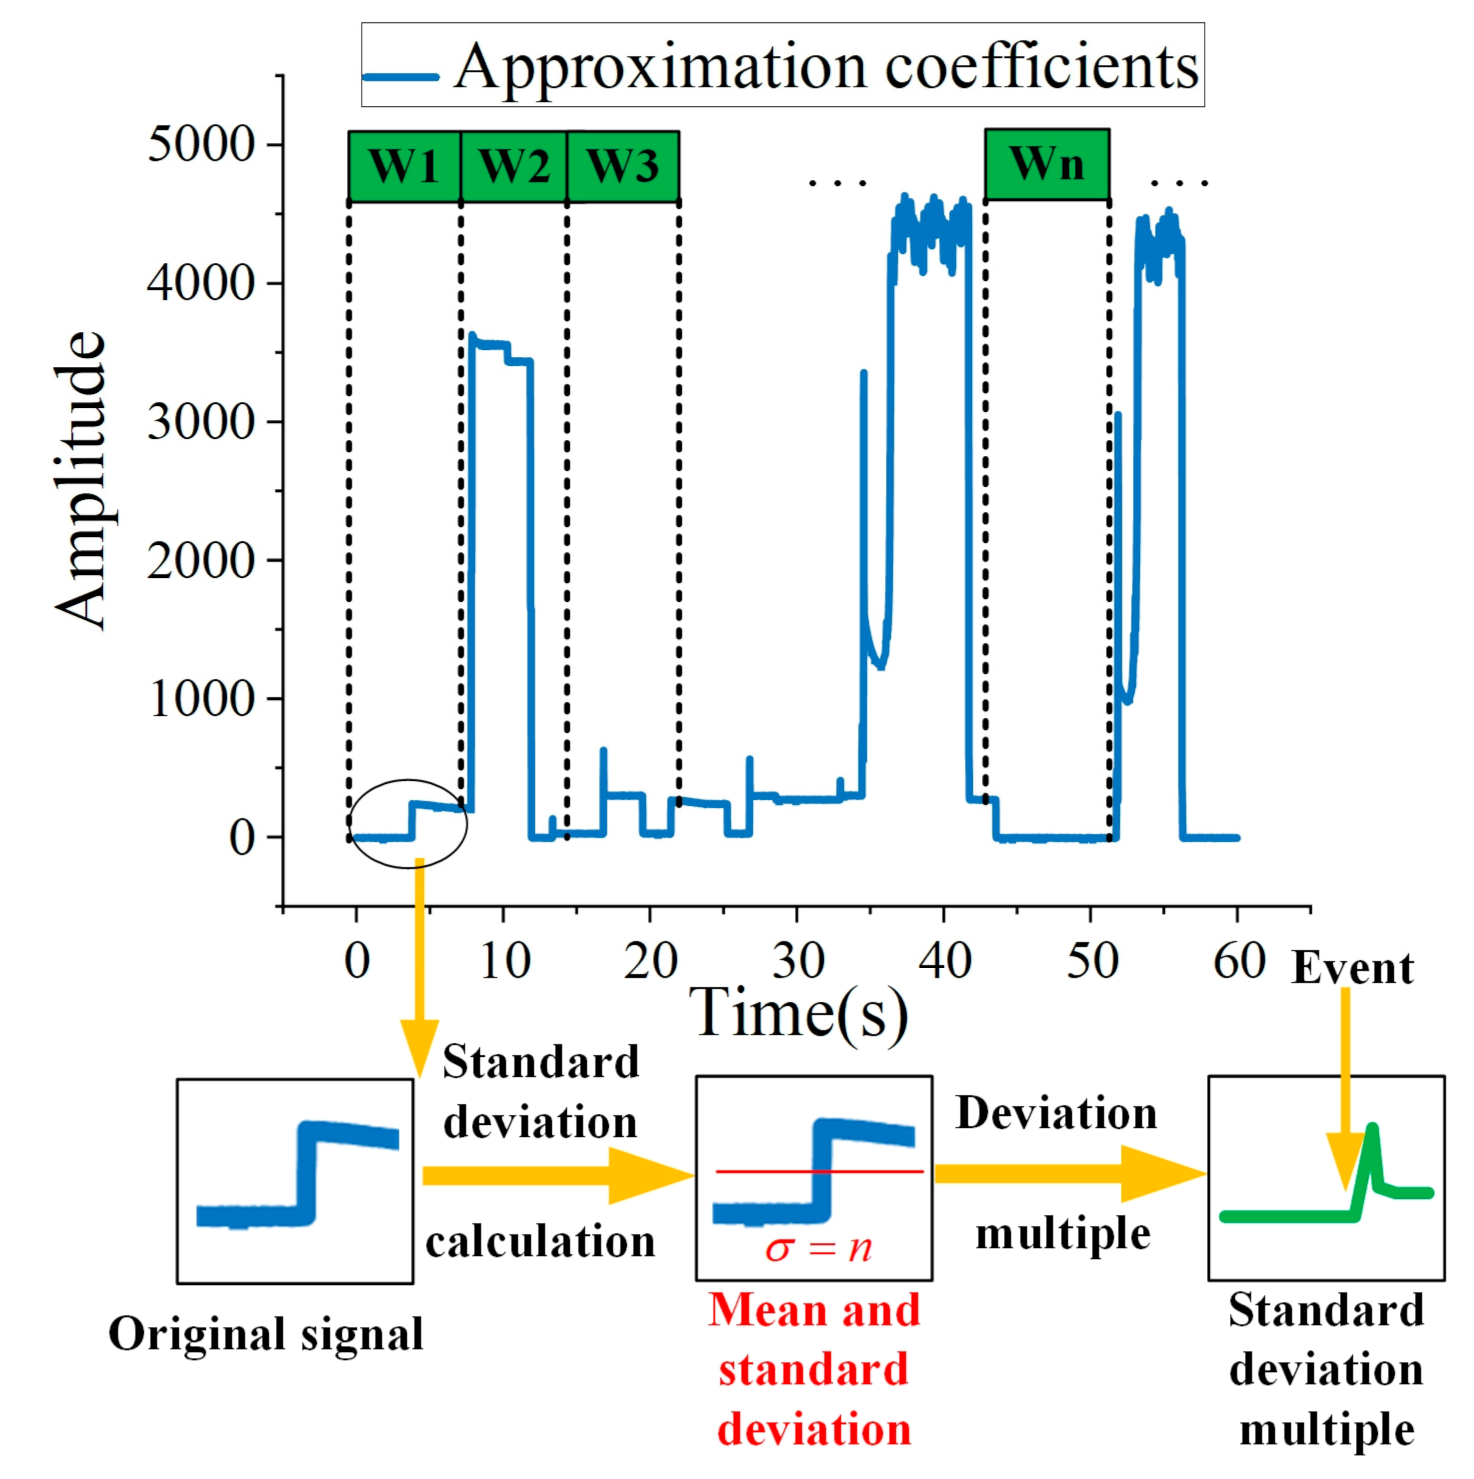
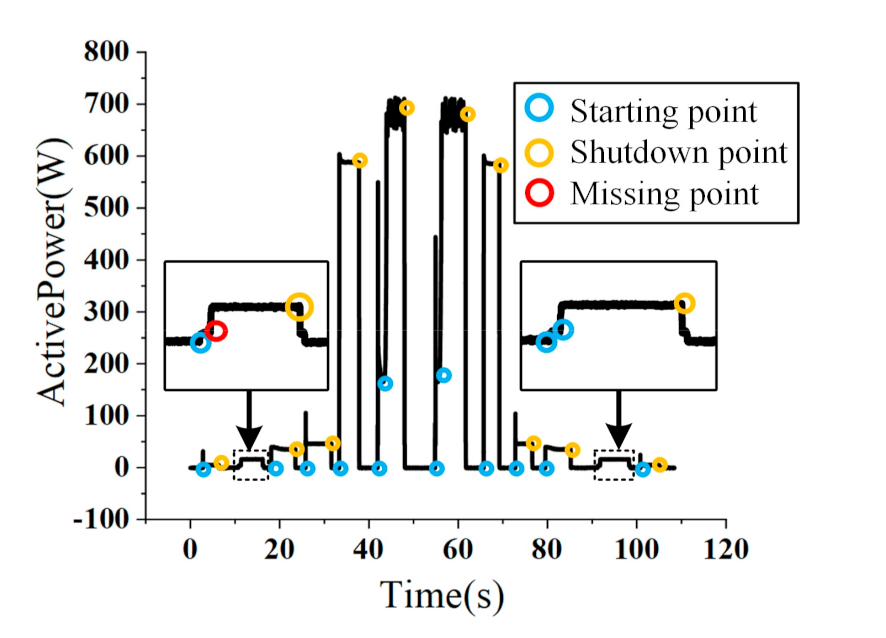
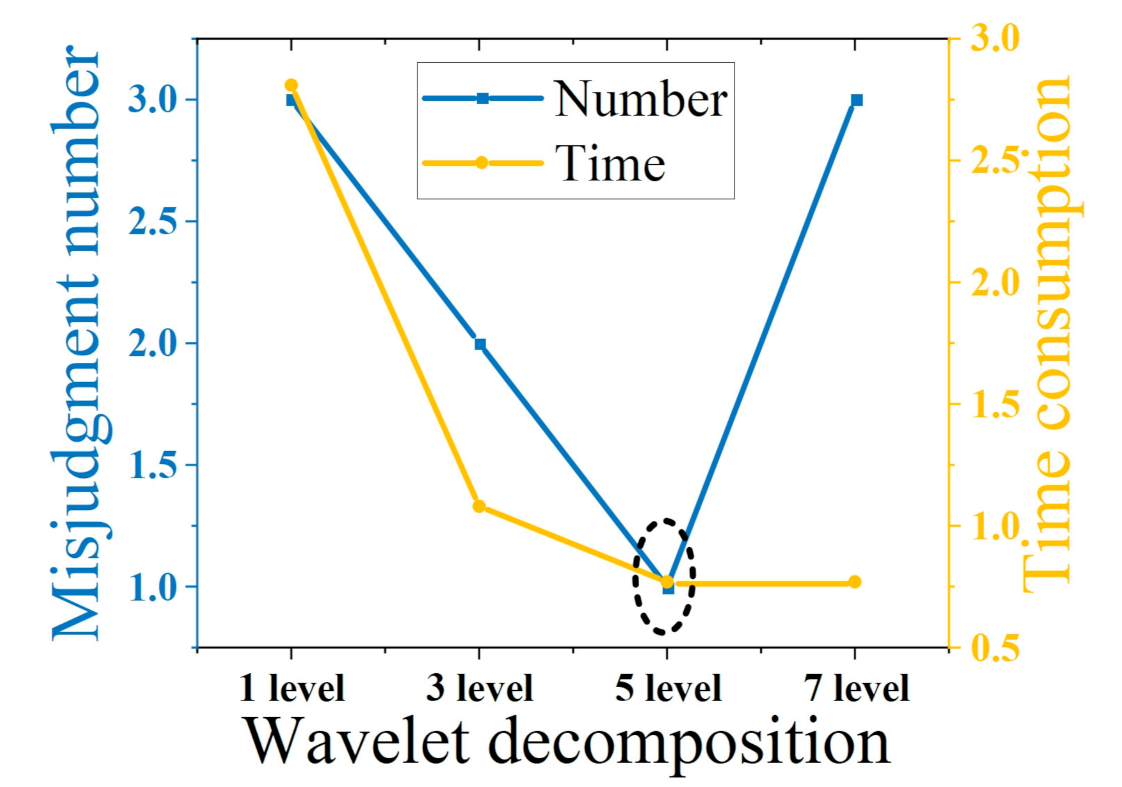
3.1. WDSDM Based Event Detection
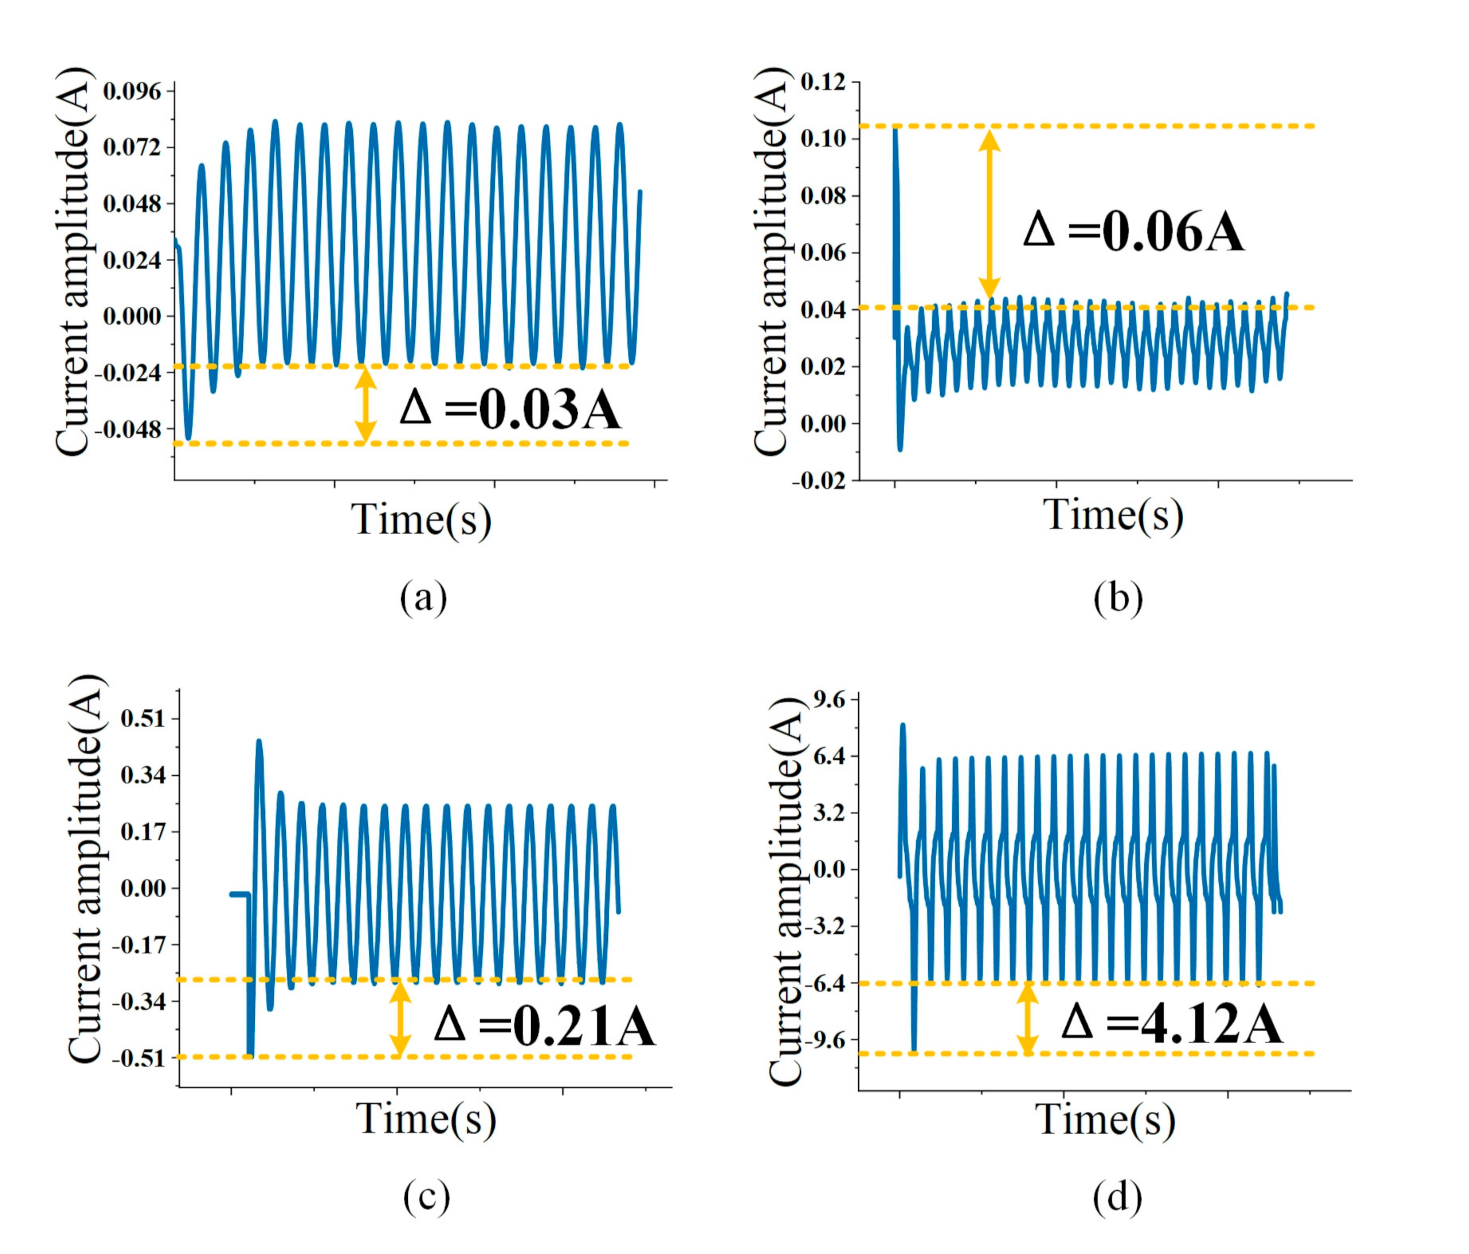
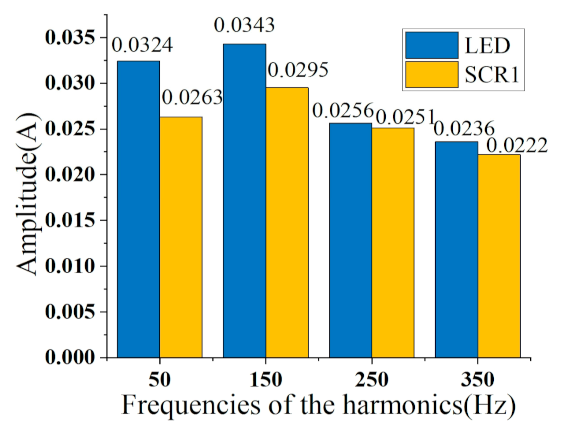
3.2. Features Used in NILM
3.3. Appliance Classification Based on Weighted KNN
3.3.1. The Selection of Weights
3.3.2. V-I Trajectory Similarity and Amplitude Similarity
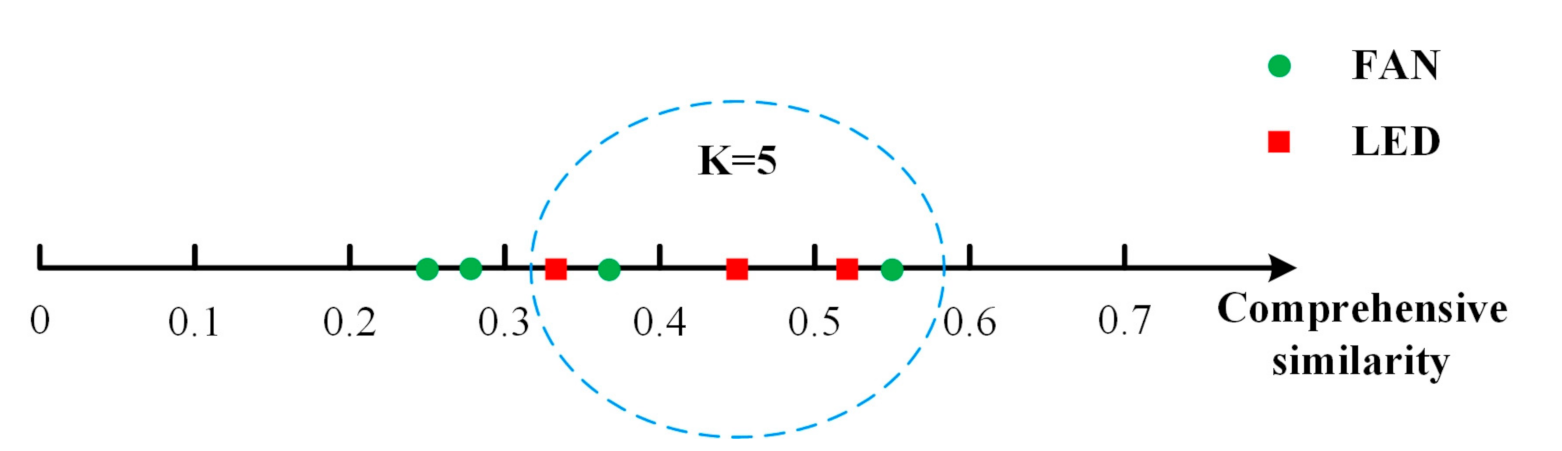
3.3.3. The Selection of K-Nearest Neighbors
3.3.4. Load Identification
4. Verification
5. Results and Discussion
5.1. Performance Comparison of Event Detection Algorithms
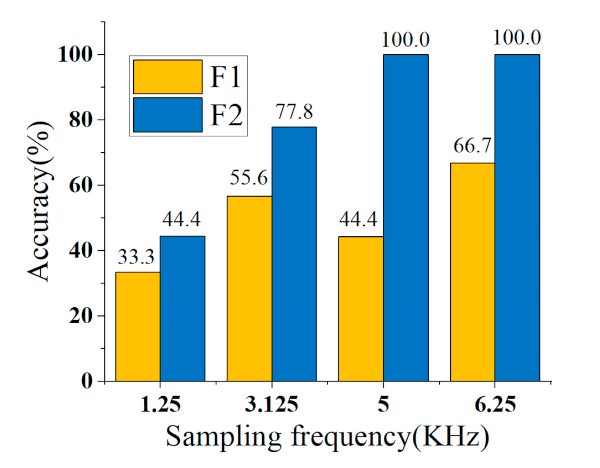
5.2. Research on the Improvement of Accuracy by Overshoot Multiple
5.3. Appliance Identification under Sparse Sample
5.4. Comparison and Discussion
6. Conclusions
- (1)
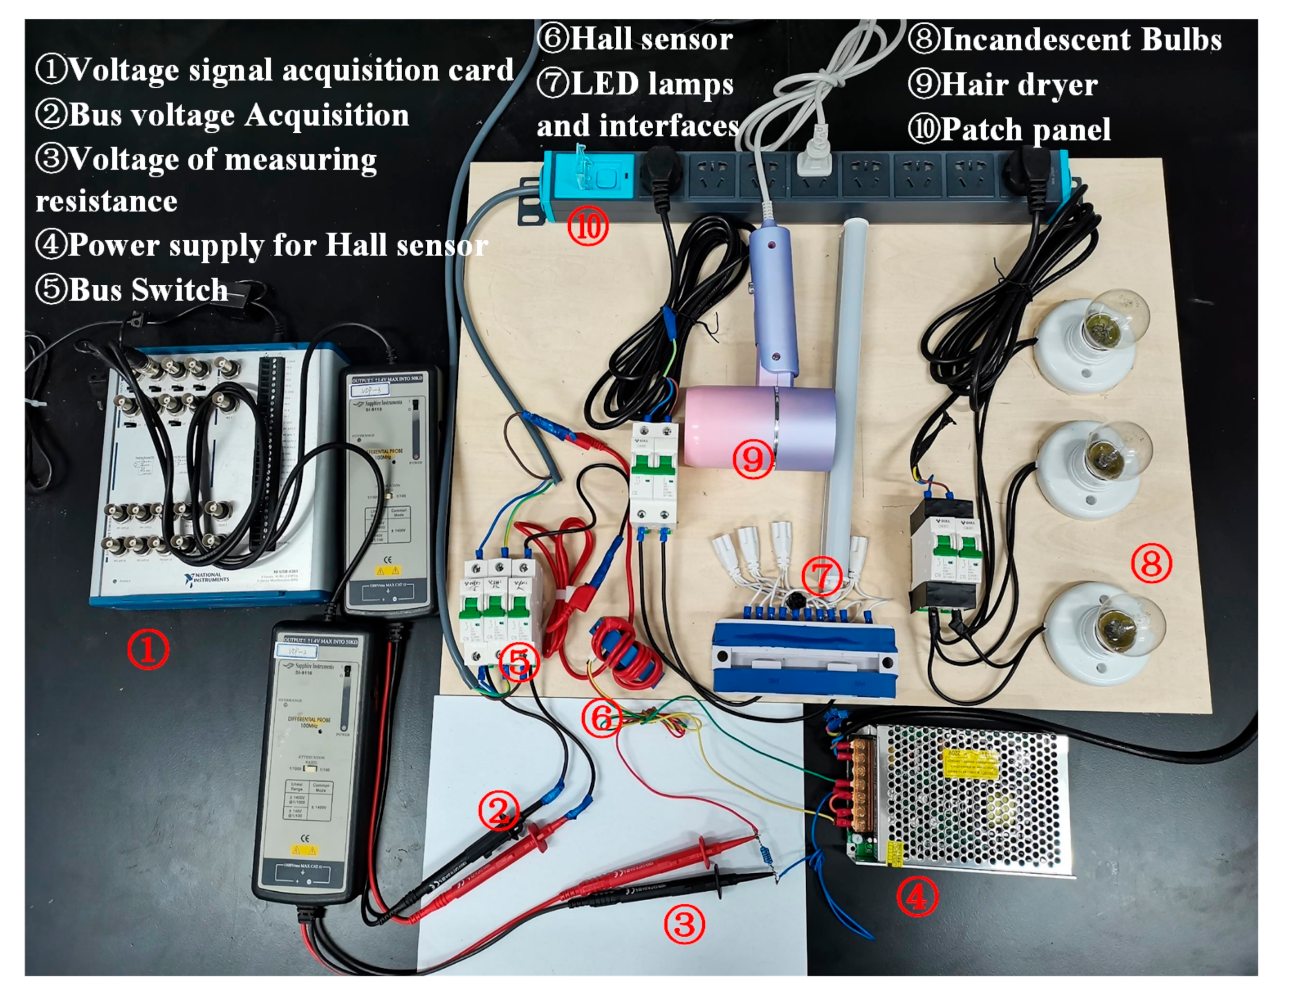
- This paper builds an experimental platform and uses the real-world data of residential appliances to verify the effectiveness of sparse sample and real-time computation based NILM.
- (2)
- The WDSDM is first proposed to empower event detection of appliances with complex starting processes. The result indicates an only 1 false detection out of 16 and the time consumption is only 0.77 s.
- (3)
- The overshoot multiple is first introduced as an essential indicator for NILM. It is verified through experiment that an average identification improvement from 82.1% to 100%. Especially, the overshoot multiple facilitates over 30% identification accuracy on SCR1.
- (4)
- Ultra-sparse sample is required for high appliance identification performance. The combination of modified weighted KNN and overshoot multiples achieves 100% appliance identification accuracy under the sampling frequency of 6.25 kHz.
Author Contributions
Funding
Institutional Review Board Statement
Informed Consent Statement
Data Availability Statement
Acknowledgments
Conflicts of Interest
Appendix A

| Abbreviation | Full Name | Abbreviation | Full Name |
|---|---|---|---|
| FAN | Electric fan | NILM | Non-intrusive load monitoring |
| HD | Hair dryer | EMS | Energy management system |
| LED | LED lights | ILM | Intrusive Load Monitoring |
| IB | Incandescent bulb | CUSUM | Cumulative Sum Control Chart |
| MC1 | First start point of microwave oven | SDM | Standard deviation multiple |
| MC2 | Second start point of microwave oven | KNN | K-Nearest Neighbor |
| SCR1 | First start point of Display screen | SNR | SIGNAL-NOISE RATIO |
| SCR2 | Second start point of Display screen | Apps | Appliances |
References
- Nations, T.U. The Paris Agreement. Available online: https://unfccc.int/process-and-meetings/the-paris-agreement/the-paris-agreement (accessed on 12 December 2015).
- Enríquez, R.; Jiménez, M.J.; Heras, M.R. Towards non-intrusive thermal load monitoring of buildings: BES calibration. Appl. Energy 2017, 191, 44–54. [Google Scholar] [CrossRef]
- Mariano-Hernández, D.; Hernández-Callejo, L.; Zorita-Lamadrid, A.; Duque-Pérez, O.; García, F.S. A review of strategies for building energy management system: Model predictive control, demand side management, optimization, and fault detect & diagnosis. J. Build. Eng. 2020, 33, 101692. [Google Scholar]
- IEA. Today in Energy; International Energy Agency: Paris, France, 2021. [Google Scholar]
- Costa, D.L.; Kahn, M.E. Energy conservation “nudges” and environmentalist ideology: Evidence from a randomized residential electricity field experiment. J. Eur. Econ. Assoc. 2013, 11, 680–702. [Google Scholar] [CrossRef]
- Andrean, V.; Zhao, X.H.; Teshome, D.F.; Huang, T.D.; Lian, K.L. A Hybrid Method of Cascade-Filtering and Committee Decision Mechanism for Non-Intrusive Load Monitoring. IEEE Access 2018, 6, 41212–41223. [Google Scholar] [CrossRef]
- Morais, L.R.; Castro, A.R. Competitive Autoassociative Neural Networks for Electrical Appliance Identification for Non-Intrusive Load Monitoring. IEEE Access 2019, 7, 111746–111755. [Google Scholar] [CrossRef]
- Xiao, Y.; Hu, Y.; He, H.; Zhou, D.; Zhao, Y.; Hu, W. Non-Intrusive Load Identification Method Based on Improved KM Algorithm. IEEE Access 2019, 7, 151368–151377. [Google Scholar] [CrossRef]
- Zhou, X.; Li, S.; Liu, C.; Zhu, H.; Dong, N.; Xiao, T. Non-Intrusive Load Monitoring Using a CNN-LSTM-RF Model Considering Label Correlation and Class-Imbalance. IEEE Access 2021, 9, 84306–84315. [Google Scholar] [CrossRef]
- Kang, H.; Kim, H. Household Appliance Classification Using Lower Odd-Numbered Harmonics and the Bagging Decision Tree. IEEE Access 2020, 8, 55937–55952. [Google Scholar]
- Zoha, A.; Gluhak, A.; Imran, M.A.; Rajasegarar, S. Non-Intrusive Load Monitoring Approaches for Disaggregated Energy Sensing: A Survey. Sensors 2012, 12, 16838–16866. [Google Scholar] [CrossRef] [Green Version]
- Alcalá, J.M.; Ureña, J.; Hernández, Á.; Gualda, D. Assessing Human Activity in Elderly People Using Non-Intrusive Load Monitoring. Sensors 2017, 17, 351. [Google Scholar] [CrossRef]
- Athanasiadis, C.; Doukas, D.; Papadopoulos, T.; Chrysopoulos, A. A Scalable Real-Time Non-Intrusive Load Monitoring System for the Estimation of Household Appliance Power Consumption. Energies 2021, 14, 767. [Google Scholar] [CrossRef]
- Liang, J.; Ng, S.K.; Kendall, G.; Cheng, J.W. Load signature study—Part II: Disaggregation framework, simulation, and applications. IEEE Trans. Power Deliv. 2009, 25, 561–569. [Google Scholar] [CrossRef]
- Zeifman, M.; Roth, K. Nonintrusive appliance load monitoring: Review and outlook. IEEE Trans. Consum. Electr. 2011, 57, 76–84. [Google Scholar] [CrossRef]
- Cheng, X.; Linzhi, L.I.; Hao, W.U.; Ding, Y.; Song, Y.; Sun, W. A Survey of the Research on Non-intrusive Load Monitoring and Disaggregation. Power Syst. Technol. 2016, 40, 3108–3117. [Google Scholar]
- Figueiredo, M.B.; De Almeida, A.; Ribeiro, B. An Experimental Study on Electrical Signature Identification of Non-Intrusive Load Monitoring (NILM) Systems; Springer: Berlin/Heidelberg, Germany, 2011; pp. 31–40. [Google Scholar]
- Tsai, M.; Lin, Y. Modern development of an adaptive non-intrusive appliance load monitoring system in electricity energy conservation. Appl. Energy 2012, 96, 55–73. [Google Scholar] [CrossRef]
- Farinaccio, L.; Zmeureanu, R. Using a pattern recognition approach to disaggregate the total electricity consumption in a house into the major end-uses. Energy Build. 1999, 30, 245–259. [Google Scholar] [CrossRef]
- Lin, Y.; Tsai, M. Development of an improved time—Frequency analysis-based nonintrusive load monitor for load demand identification. IEEE Trans. Instrum. Meas. 2013, 63, 1470–1483. [Google Scholar] [CrossRef]
- Ahmadi, H.; Martı, J.R. Load decomposition at smart meters level using eigenloads approach. IEEE Trans. Power Syst. 2015, 30, 3425–3436. [Google Scholar] [CrossRef]
- Shaw, S.R.; Abler, C.B.; Lepard, R.F.; Luo, D.; Leeb, S.B.; Norford, L.K. Instrumentation for high performance nonintrusive electrical load monitoring. J. Sol. Energy Eng. 1998, 120, 224–230. [Google Scholar] [CrossRef]
- Niu, L.; Jia, H. Transient Event Detection Algorithm for Non-intrusive Load Monitoring. Autom. Electr. Power Syst. 2011, 35, 30–35. [Google Scholar]
- Bo, Y.; Shuai, Z. Research on Non-Intrusive Monitoring and Identification of Household Appliances. Period. Ocean Univ. China 2020, 6, 149–156. [Google Scholar]
- Zhang, G.; Ren, J.; Zhou, M. Transient event detection algorithm based on standard deviation multiple. Electr. Meas. Instrum. 2020, 1–9. [Google Scholar]
- Dong, B.; Shi, Q.; Yang, Y.; Wen, F.; Zhang, Z.; Lee, C. Technology evolution from self-powered sensors to AIoT enabled smart homes. Nano Energy 2020, 79, 105414. [Google Scholar] [CrossRef]
- Méndez, J.I.; Ponce, P.; Mata, O.; Meier, A.; Peffer, T.; Molina, A.; Aguilar, M. Empower Saving Energy into Smart Homes Using a Gamification Structure by Social Products; IEEE: New York, NY, USA, 2020; pp. 1–7. [Google Scholar]
- de Souza, W.A.; Garcia, F.D.; Marafão, F.P.; Da Silva, L.C.P.; Simões, M.G. Load disaggregation using microscopic power features and pattern recognition. Energies 2019, 12, 2641. [Google Scholar] [CrossRef] [Green Version]
- Biansoongnern, S.; Plungklang, B. Non-intrusive appliances load monitoring (nilm) for energy conservation in household with low sampling rate. Procedia Comput. Sci. 2016, 86, 172–175. [Google Scholar] [CrossRef] [Green Version]
- Xiao, P.; Cheng, S. Neural network for nilm based on operational state change classification. arXiv 2019, arXiv:1902.02675. [Google Scholar]
- Kelly, J.; Knottenbelt, W. Neural NILM: Deep Neural Networks Applied to Energy Disaggregation. In Proceedings of the 2nd ACM International Conference on Embedded Systems for Energy-Efficient Built Environments, Seoul, Korea, 4–5 November 2015; pp. 55–64. [Google Scholar]
- Bouhouras, A.S.; Gkaidatzis, P.A.; Panagiotou, E.; Poulakis, N.; Christoforidis, G.C. A NILM algorithm with enhanced disaggregation scheme under harmonic current vectors. Energy Build. 2019, 183, 392–407. [Google Scholar] [CrossRef]
- Chang, H. Non-intrusive demand monitoring and load identification for energy management systems based on transient feature analyses. Energies 2012, 5, 4569–4589. [Google Scholar] [CrossRef] [Green Version]
- Gillis, J.; Morsi, W.G. Non-Intrusive Load Monitoring Using Orthogonal Wavelet Analysis; IEEE: New York, NY, USA, 2016; pp. 1–5. [Google Scholar]
- Wójcik, A.; Bilski, P.; Winiecki, W. Non-Intrusive Electrical Appliances Identification Using Wavelet Transform Analysis; IOP Publishing: Bristol, UK, 2018; p. 052021. [Google Scholar]
- De Baets, L.; Ruyssinck, J.; Develder, C.; Dhaene, T.; Deschrijver, D. Appliance classification using VI trajectories and convolutional neural networks. Energy Build. 2018, 158, 32–36. [Google Scholar] [CrossRef] [Green Version]
- Chang, H.; Lian, K.; Su, Y.; Lee, W. Energy Spectrum-Based Wavelet Transform for Non-Intrusive Demand Monitoring and Load Identification; IEEE: New York, NY, USA, 2013; pp. 1–9. [Google Scholar]
- Zielonka, A.; Woźniak, M.; Garg, S.; Kaddoum, G.; Piran, M.J.; Muhammad, G. Smart homes: How much will they support us? A research on recent trends and advances. IEEE Access 2021, 9, 26388–26419. [Google Scholar] [CrossRef]
- Liu, Y.; Liu, W.; Shen, Y.; Zhao, X.; Gao, S. Toward smart energy user: Real time non-intrusive load monitoring with simultaneous switching operations. Appl. Energy 2021, 287, 116616. [Google Scholar] [CrossRef]
- Srinivasan, D.; Ng, W.S.; Liew, A.C. Neural-network-based signature recognition for harmonic source identification. IEEE Trans. Power Deliv. 2005, 21, 398–405. [Google Scholar] [CrossRef]
- Kato, T.; Cho, H.S.; Lee, D.; Toyomura, T.; Yamazaki, T. Appliance Recognition from Electric Current Signals for Information-Energy Integrated Network in Home Environments; Springer: Berlin/Heidelberg, Germany, 2009; pp. 150–157. [Google Scholar]
- Hassan, T.; Javed, F.; Arshad, N. An empirical investigation of VI trajectory based load signatures for non-intrusive load monitoring. IEEE Trans. Smart Grid 2013, 5, 870–878. [Google Scholar] [CrossRef] [Green Version]
- Liao, X.; Shen, S.V.; Shi, X. The effects of behavioral intention on the choice to purchase energy-saving appliances in China: The role of environmental attitude, concern, and perceived psychological benefits in shaping intention. Energy Effic. 2020, 13, 33–49. [Google Scholar] [CrossRef]
- Himeur, Y.; Alsalemi, A.; Bensaali, F.; Amira, A. Smart non-intrusive appliance identification using a novel local power histogramming descriptor with an improved k-nearest neighbors classifier. Sustain. Cities Soc. 2021, 67, 102764. [Google Scholar] [CrossRef]
- Yan, F.; Luo, D.; Sun, Y. A Non-Intrusive Load Identification Method Suitable for Home Scene; IEEE: New York, NY, USA, 2020; pp. 1696–1701. [Google Scholar]
- Gou, J.; Ma, H.; Ou, W.; Zeng, S.; Rao, Y.; Yang, H. A generalized mean distance-based k-nearest neighbor classifier. Expert Syst. Appl. 2019, 115, 356–372. [Google Scholar] [CrossRef]
- Gou, J.; Qiu, W.; Yi, Z.; Shen, X.; Zhan, Y.; Ou, W. Locality constrained representation-based K-nearest neighbor classification. Knowl. Based Syst. 2019, 167, 38–52. [Google Scholar] [CrossRef]
- Gou, J.; Qiu, W.; Yi, Z.; Xu, Y.; Mao, Q.; Zhan, Y. A local mean representation-based K-nearest neighbor classifier. ACM Trans. Intell. Syst. Technol. (TIST) 2019, 10, 1–25. [Google Scholar] [CrossRef]
- Zhao, C.; He, M.; Zhao, X. Analysis of Transient Waveform Based on Combined Short Time Fourier Transform and Wavelet Transform; IEEE: New York, NY, USA, 2004; pp. 1122–1126. [Google Scholar]
- He, D.; Du, L.; Yang, Y.; Harley, R.; Habetler, T. Front-End Electronic Circuit Topology Analysis for Model-Driven Classification and Monitoring of Appliance Loads in Smart Buildings. IEEE Trans. Smart Grid 2012, 3, 2286–2293. [Google Scholar] [CrossRef]
- Himeur, Y.; Alsalemi, A.; Bensaali, F.; Amira, A. Robust event-based non-intrusive appliance recognition fusing multi-scale wavelet packet tree and ensemble bagging tree. Appl. Energy 2020, 267, 114877. [Google Scholar] [CrossRef]
- Huang, X.; Yin, B.; Wei, Z.; Wei, X.; Zhang, R. An online non-intrusive load monitoring method based on Hidden Markov model. J. Phys. Conf. Ser. 2019, 1176, 042036. [Google Scholar] [CrossRef]
- Pöttker, F.; Lazzaretti, A.E.; Renaux, D.P.; Linhares, R.R.; Lima, C.R.; Ancelmo, H.C.; Mulinari, B.M. Non-Intrusive Load Monitoring: A Multi-Agent Architecture and Results. In Proceedings of the 2018 2nd European Conference on Electrical Engineering and Computer Science (EECS), Bern, Switzerland, 20–22 December 2018. [Google Scholar]
- Hoyo-Montaño, J.A.; León-Ortega, N.; Valencia-Palomo, G.; Galaz-Bustamante, R.A.; Espejel-Blanco, D.F.; Vázquez-Palma, M.G. Non-Intrusive Electric Load identification using Wavelet Transform. Ing. Investig. 2018, 38, 42–51. [Google Scholar] [CrossRef]
- Mei, K.; Rovnyak, S.M.; Ong, C.M. Dynamic event detection using wavelet analysis. In Proceedings of the 2006 IEEE Power Engineering Society General Meeting, Montreal, QC, Canada, 18–22 June 2006. [Google Scholar]
- Ece, D.G.; Gerek, O.N. Power quality event detection using joint 2-D-wavelet subspaces. IEEE Trans. Instrum. Meas. 2004, 53, 1040–1046. [Google Scholar] [CrossRef]
- Singh, A.K.; Fozdar, M. A wavelet-based event detection and location framework for enhanced situational awareness in power system. In Proceedings of the 2016 IEEE Annual India Conference (INDICON), Bangalore, India, 6–18 December 2016. [Google Scholar]
- Kim, D.I.; Chun, T.Y.; Yoon, S.H.; Lee, G.; Shin, Y.J. Wavelet-based event detection method using PMU data. IEEE Trans. Smart Grid 2015, 8, 1154–1162. [Google Scholar] [CrossRef]
- de Apráiz, M.; Barros, J.; Diego, R.I. A laboratory for time-frequency analysis of power quality disturbances using wavelets. In Proceedings of the 14th International Conference on Harmonics and Quality of Power-ICHQP 2010, Bergamo, Italy, 26–29 September 2010. [Google Scholar]


| Appliance | Rated Power(W) |
|---|---|
| FAN | 40 |
| HD | 650 |
| LED | 5 |
| IB | 45 |
| MC | 800 |
| SCR | 16 |
| Device | Model |
|---|---|
| Data acquisition card | NI USB-6361 |
| Differential voltage probe | SI-9110 |
| Switching power supply | Shangyuan D60- ±12 |
| Hall current sensor | LT 58-S7 |
| Matching measuring resistance | 100 Ω |
| Apps | Event Time(s) | Apps | Event Time(s) |
|---|---|---|---|
| LED on | 2.802 | LED off | 6.352 |
| SCR on | 10.725, 11.305 | SCR off | 16.189, 16.419 |
| FAN on | 18.097 | FAN off | 23.520 |
| IB on | 25.770 | IB off | 31.585 |
| HD on | 33.308 | HD off | 37.711 |
| MC on | 41.915, 43.140 | MC off | 47.954 |
| MC on HD on IB on FAN on SCR on LED on | 54.800, 55.499 65.685 72.794 79.495 91.170, 91.750 100.746 | MC off HD off IB off FAN off SCR off LED off | 61.660 69.191 76.576 85.186 98.257, 98.517 105.038 |
| Algorithms | Time (s) | False (On) | Missed (On) | False (Off) | Missed (Off) |
|---|---|---|---|---|---|
| 1 | 0.83 | 32 | 4 | 32 | 2 |
| 2 | 4.97 | 0 | 2 | 5 | 0 |
| 3 | 0.77 | 0 | 1 | 0 | 0 |
| Levels | Time(s) | False Alarm (On) | Missed Detection (On) | False Alarm (Off) | Missed Detection (Off) |
|---|---|---|---|---|---|
| 1 | 2.81 | 0 | 2 | 1 | 0 |
| 3 | 1.08 | 0 | 2 | 0 | 0 |
| 5 | 0.77 | 0 | 1 | 0 | 0 |
| 7 | 0.77 | 0 | 3 | 0 | 0 |
| Appliances | Original Amount | SNR = 30 | SNR = 20 | Total Amount |
|---|---|---|---|---|
| FAN | 14 | 14 | 14 | 42 |
| HD | 24 | 24 | 24 | 72 |
| LED | 17 | 17 | 17 | 51 |
| IB | 25 | 25 | 25 | 75 |
| MC1 | 18 | 18 | 18 | 54 |
| MC2 | 18 | 18 | 18 | 54 |
| SCR1 | 9 | 9 | 9 | 27 |
| SCR2 | 9 | 9 | 9 | 27 |
| Apps | Samples | 5 kHz Accuracy (%) | 3.125 kHz Accuracy (%) | 1.25 kHz Accuracy (%) | |||
|---|---|---|---|---|---|---|---|
| F1 | F2 | F1 | F2 | F1 | F2 | ||
| FAN | 14 | 100 | 100 | 100 | 100 | 100 | 100 |
| HD | 24 | 100 | 100 | 100 | 100 | 100 | 100 |
| LED | 17 | 100 | 100 | 94.1 | 100 | 100 | 88.2 |
| IB | 25 | 100 | 100 | 100 | 77.8 | 100 | 100 |
| MC1 | 18 | 100 | 100 | 100 | 100 | 100 | 100 |
| MC2 | 18 | 100 | 100 | 100 | 100 | 100 | 100 |
| SCR1 | 9 | 44.4 | 100 | 55.6 | 77.8 | 33.3 | 44.4 |
| SCR2 | 9 | 100 | 100 | 100 | 100 | 100 | 88.9 |
| Total | 134 | 94.8 | 100 | 96.3 | 94.4 | 95.5 | 94.0 |
| Apps | Samples | Accuracy (%) | |
|---|---|---|---|
| F1 | F2 | ||
| FAN | 21 | 57.1 | 100 |
| HD | 34 | 100 | 100 |
| LED | 30 | 16.7 | 100 |
| IB | 34 | 100 | 100 |
| MC1 | 30 | 100 | 100 |
| MC2 | 24 | 100 | 100 |
| SCR1 | 15 | 86.7 | 100 |
| SCR2 Total | 13 201 | 100 82.1 | 100 100 |
| Ref. | Step | Method | Acc. (%) | Time (s) | Sample | Pros | Cons |
|---|---|---|---|---|---|---|---|
| [51] | ED | Cepstrum filtering | >97.31 | 0.35 | - | Robust | Threshold sensitive |
| FE | Multi-scale wavelet packet tree | - | - | - | Low sampling frequency | - | |
| LI | Ensemble bagging | >96.36 | 0.33 | 30 | Satisfactory accuracy and complexity | Supervised method | |
| [52] | ED | - | - | - | - | - | - |
| FE | Improved DB9 algorithm | - | - | 128 code-books | Filter the noise and low distortion | Only power feature | |
| LI | HMM | >92.76 | - | 100 | Suppress data | Appliances sensitive | |
| [53] | ED | DWT | >95.23 | - | - | Both time and frequency analysis | False positive |
| FE | DFT, energy spectrum | - | - | - | Rich features indicators | Sampling intensive | |
| LI | k-NN + SVM+ Decision tree | >93.09 | - | 684 | Combined method | None-optimized | |
| [33] | ED | DWT | - | - | - | - | - |
| FE | DWT | - | - | - | Better than STFT | Sampling intensive | |
| LI | Feedforward NN | >95 | <2 | 521 | Iterations reduced | Noise sensitive | |
| [54] | ED | - | - | - | - | - | - |
| FE | Parseval energy | - | - | - | Field implementable | - | |
| LI | Decision Tree | >90 | - | - | Simple but still accurate | Preliminary | |
| [37] | ED | - | - | - | - | - | - |
| FE | Energy spectrum | - | - | - | Transient performance | Complicate setups | |
| LI | ANN | >97 | 0.5 | Period * 60 * 256 | Better accuracy | Sampling sensitive | |
| Ours | ED | WDSDM | >96.7 | 0.36 | - | Multi-start appliances, faster detection, no preset threshold | - |
| FE | overshoot multiple | - | - | - | Easy to extract, physical interpretation | - | |
| LD | Weighted KNN | >96 | 0.06 | 1 | Ultra-sparse sample Real-time computation | Supervised learning |
Publisher’s Note: MDPI stays neutral with regard to jurisdictional claims in published maps and institutional affiliations. |
© 2021 by the authors. Licensee MDPI, Basel, Switzerland. This article is an open access article distributed under the terms and conditions of the Creative Commons Attribution (CC BY) license (https://creativecommons.org/licenses/by/4.0/).
Share and Cite
Hu, M.; Tao, S.; Fan, H.; Li, X.; Sun, Y.; Sun, J. Non-Intrusive Load Monitoring for Residential Appliances with Ultra-Sparse Sample and Real-Time Computation. Sensors 2021, 21, 5366. https://doi.org/10.3390/s21165366
Hu M, Tao S, Fan H, Li X, Sun Y, Sun J. Non-Intrusive Load Monitoring for Residential Appliances with Ultra-Sparse Sample and Real-Time Computation. Sensors. 2021; 21(16):5366. https://doi.org/10.3390/s21165366
Chicago/Turabian StyleHu, Minzheng, Shengyu Tao, Hongtao Fan, Xinran Li, Yaojie Sun, and Jie Sun. 2021. "Non-Intrusive Load Monitoring for Residential Appliances with Ultra-Sparse Sample and Real-Time Computation" Sensors 21, no. 16: 5366. https://doi.org/10.3390/s21165366
APA StyleHu, M., Tao, S., Fan, H., Li, X., Sun, Y., & Sun, J. (2021). Non-Intrusive Load Monitoring for Residential Appliances with Ultra-Sparse Sample and Real-Time Computation. Sensors, 21(16), 5366. https://doi.org/10.3390/s21165366