Measurement of the Acoustic Non-Linearity Parameter of Materials by Exciting Reversed-Phase Rayleigh Waves in Opposite Directions

Abstract
1. Introduction
2. Principle of the Method for Exciting Reversed-Phase Rayleigh Waves in Opposite Directions
2.1. Non-linear Characteristics of Rayleigh Waves
2.2. Principle of Exciting Reversed-Phase Rayleigh Waves in Opposite Directions
3. Numerical Simulation on Excitation of Reversed-Phase Rayleigh Waves in Opposite Directions
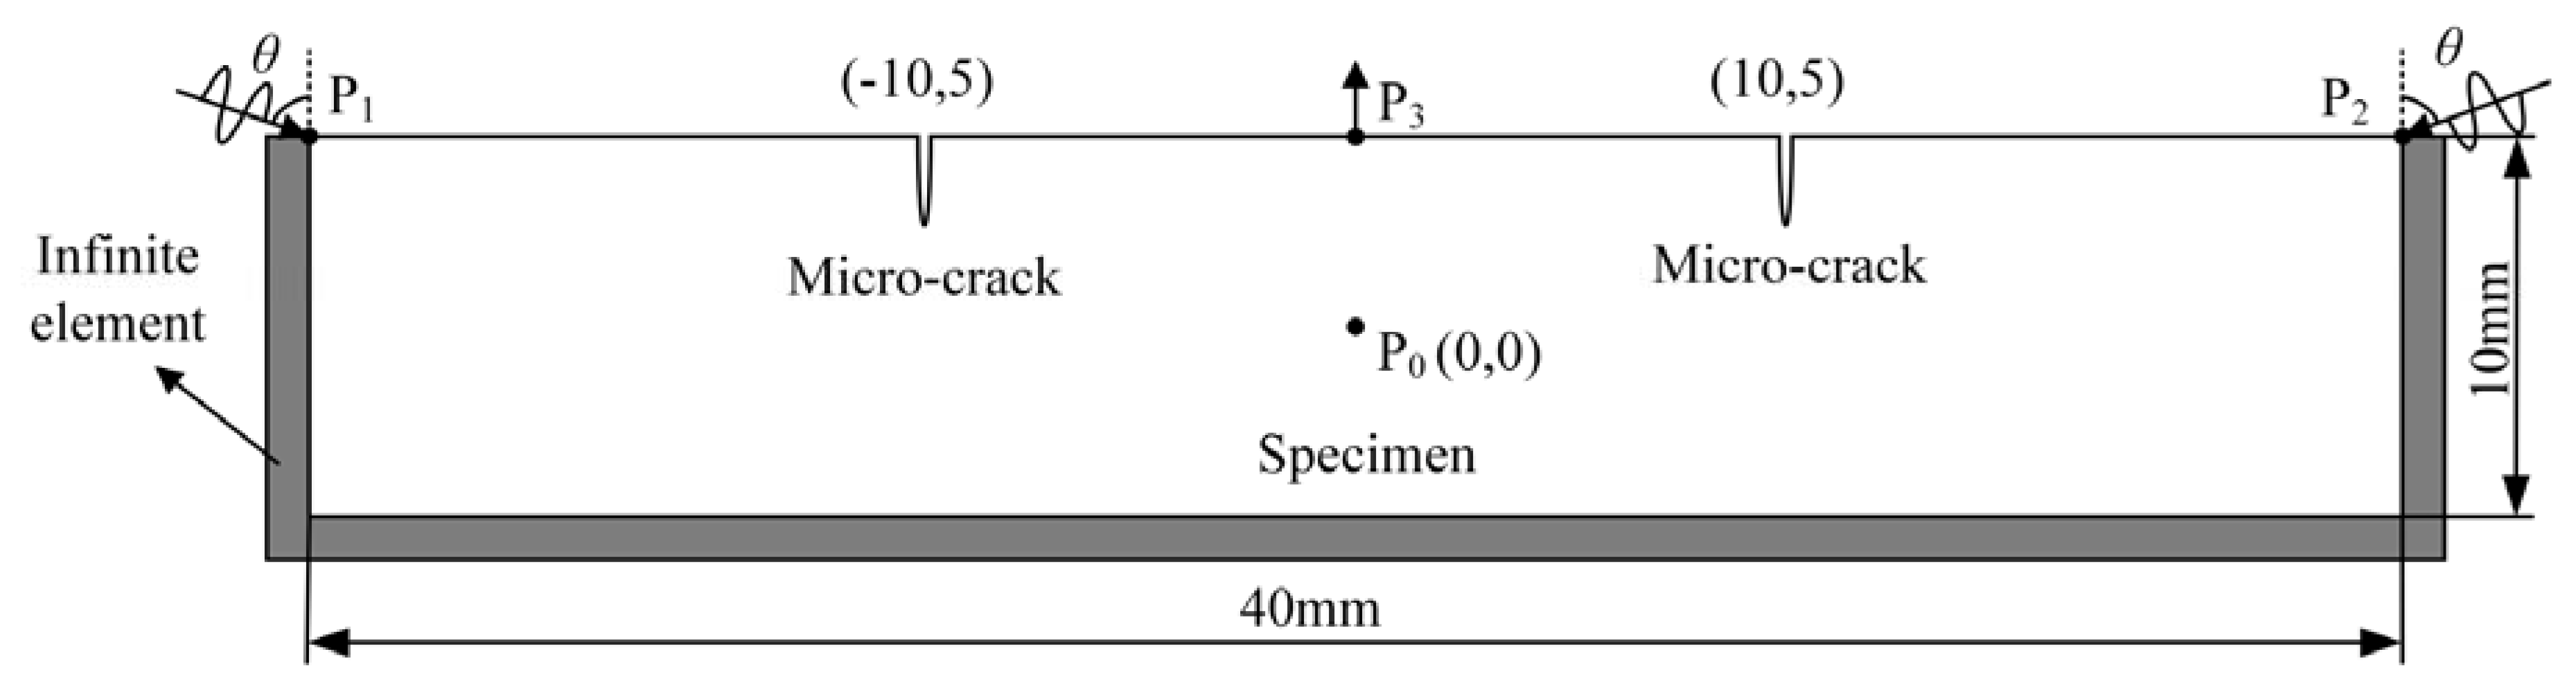
3.1. Finite Element Simulation Model
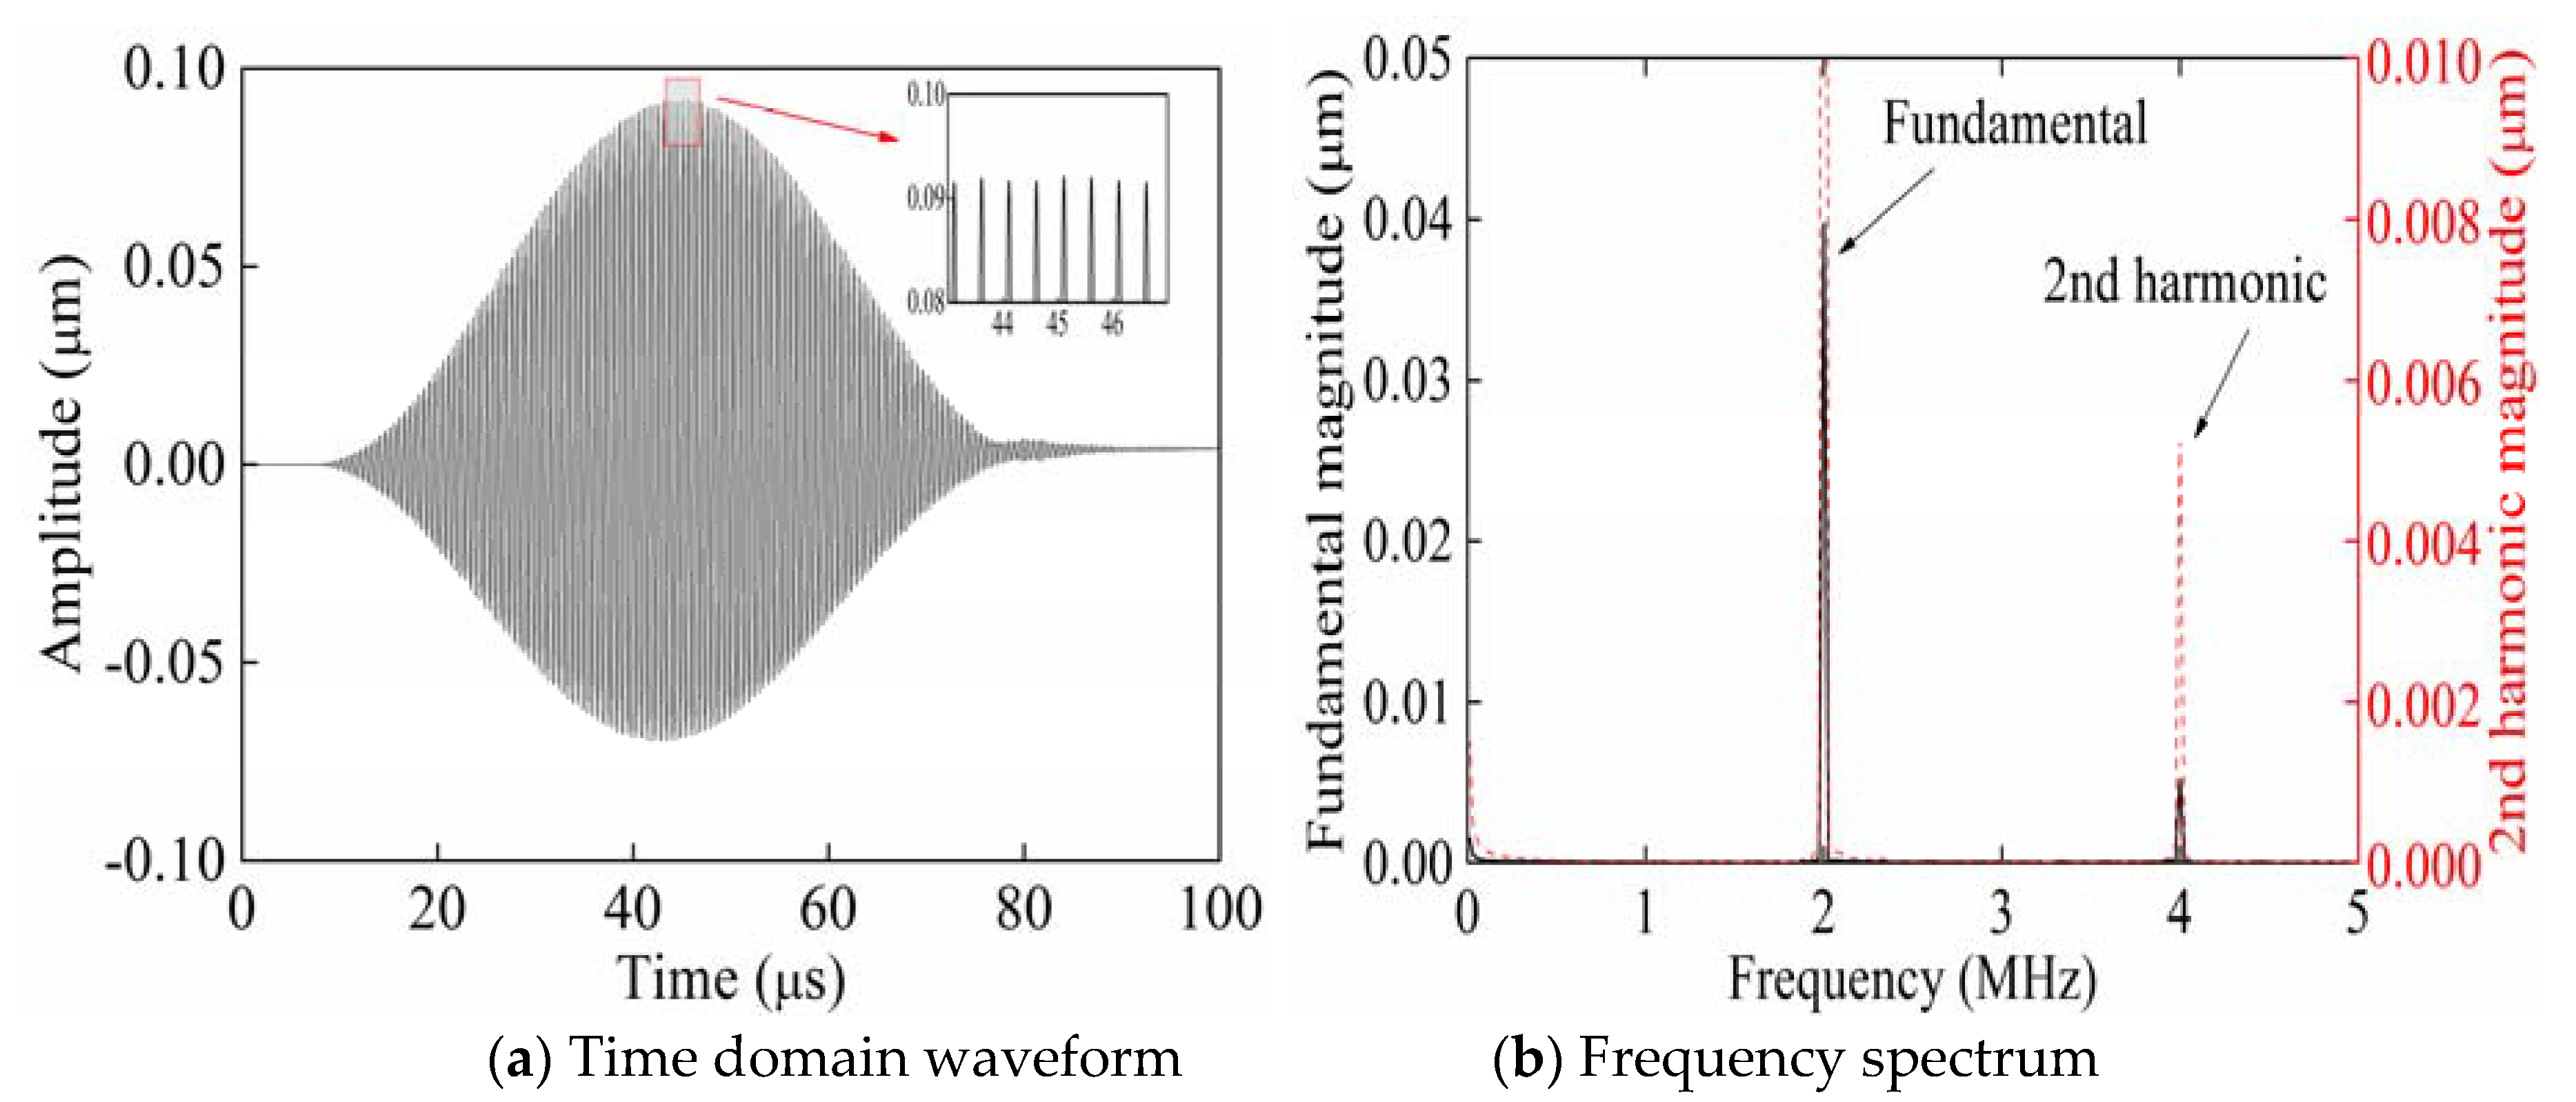
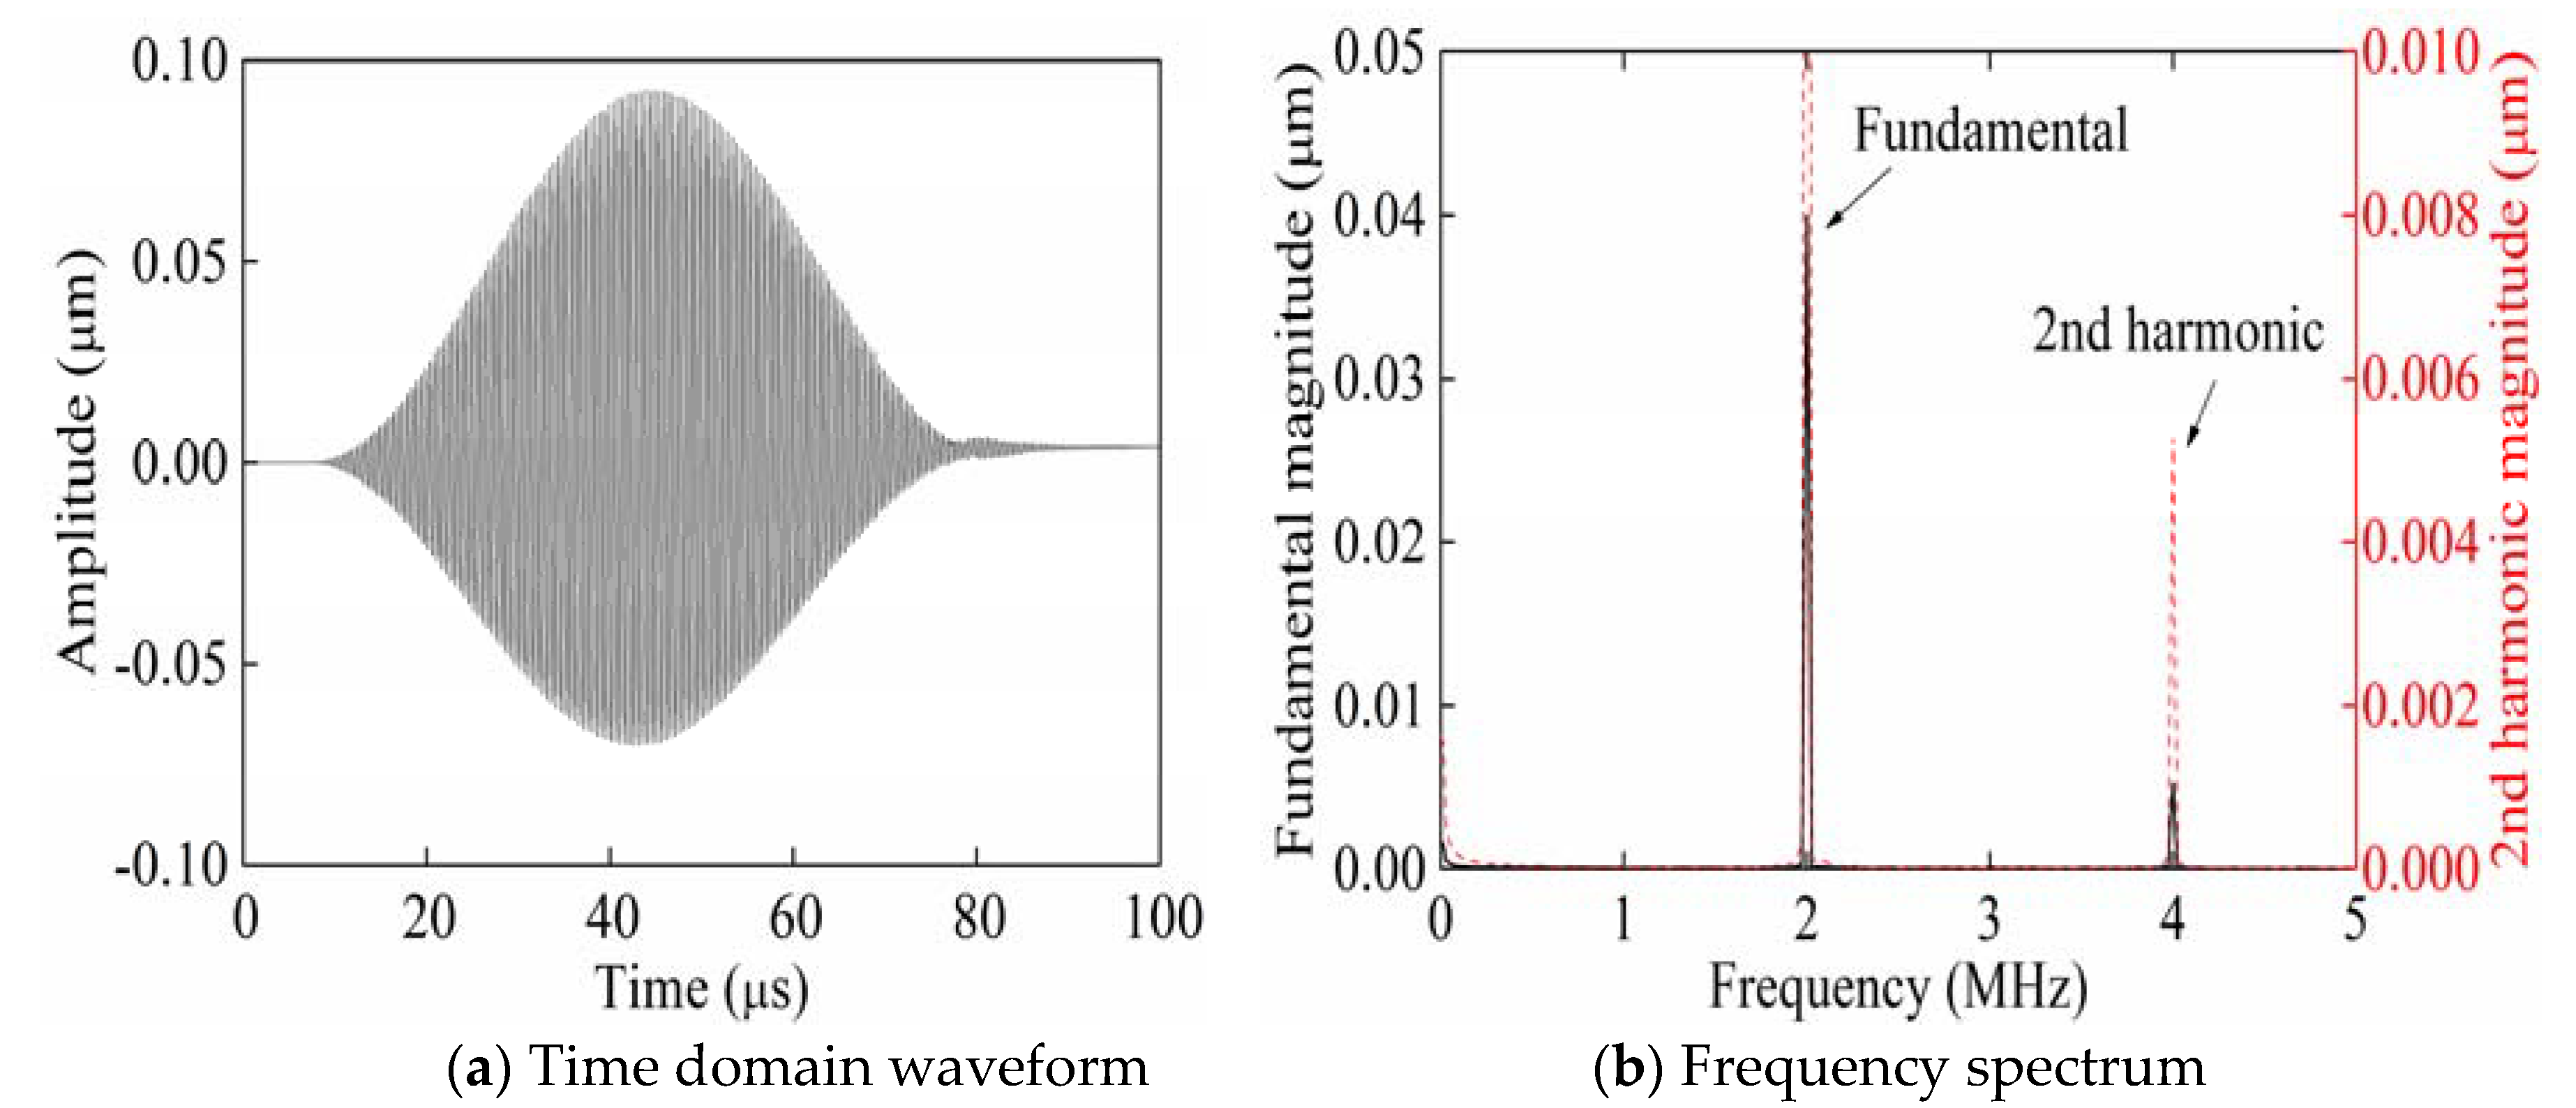
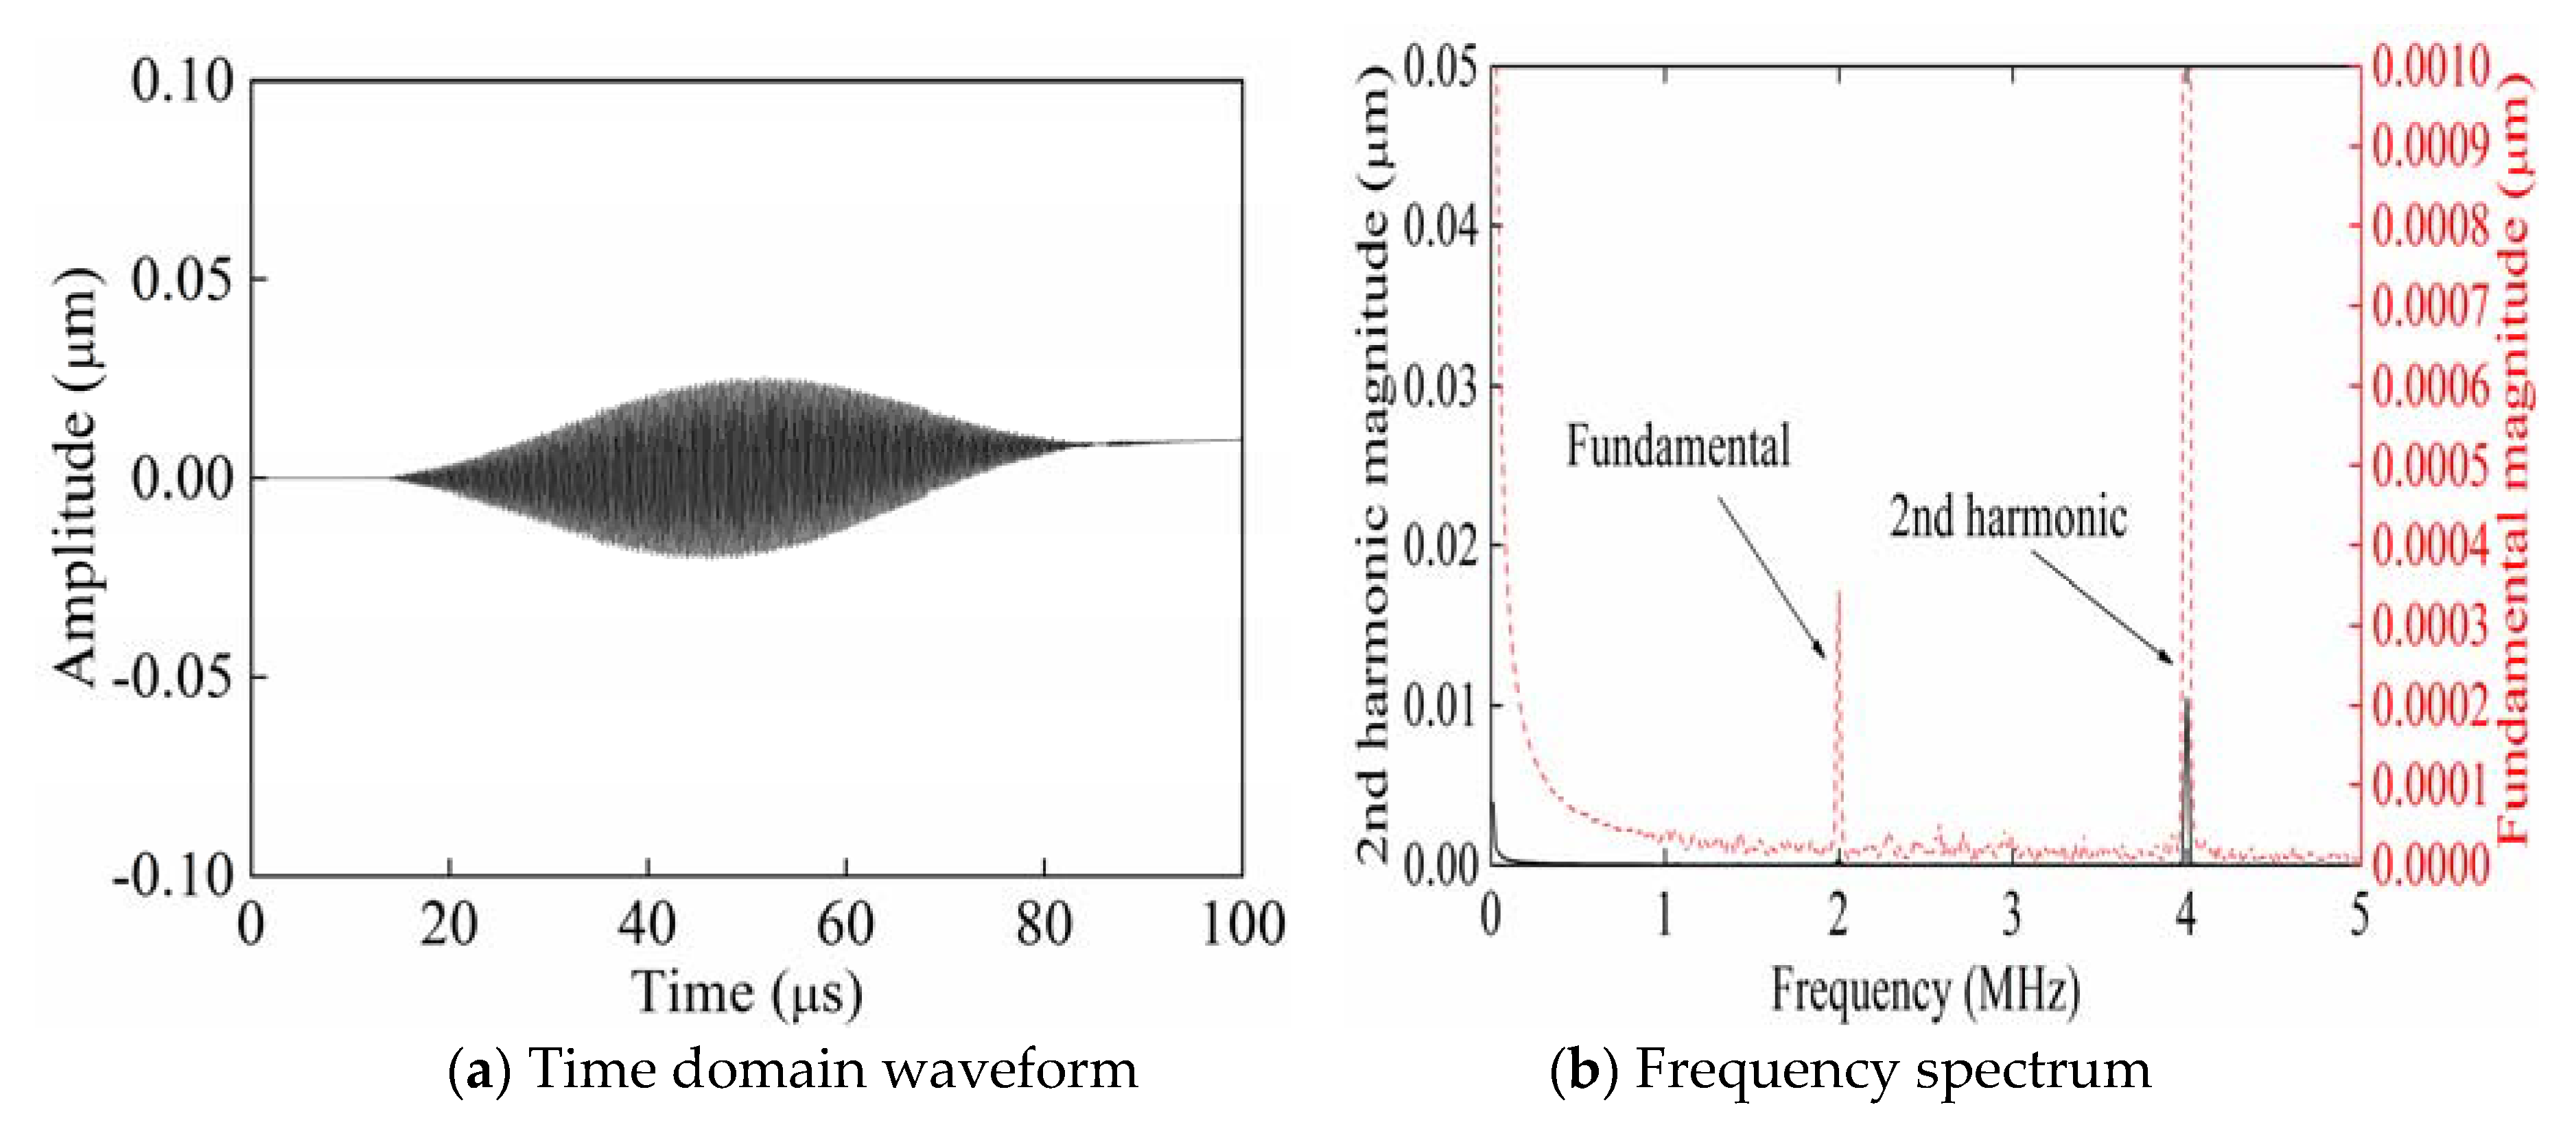
3.2. Analysis of Simulation Results
4. Experimental Study
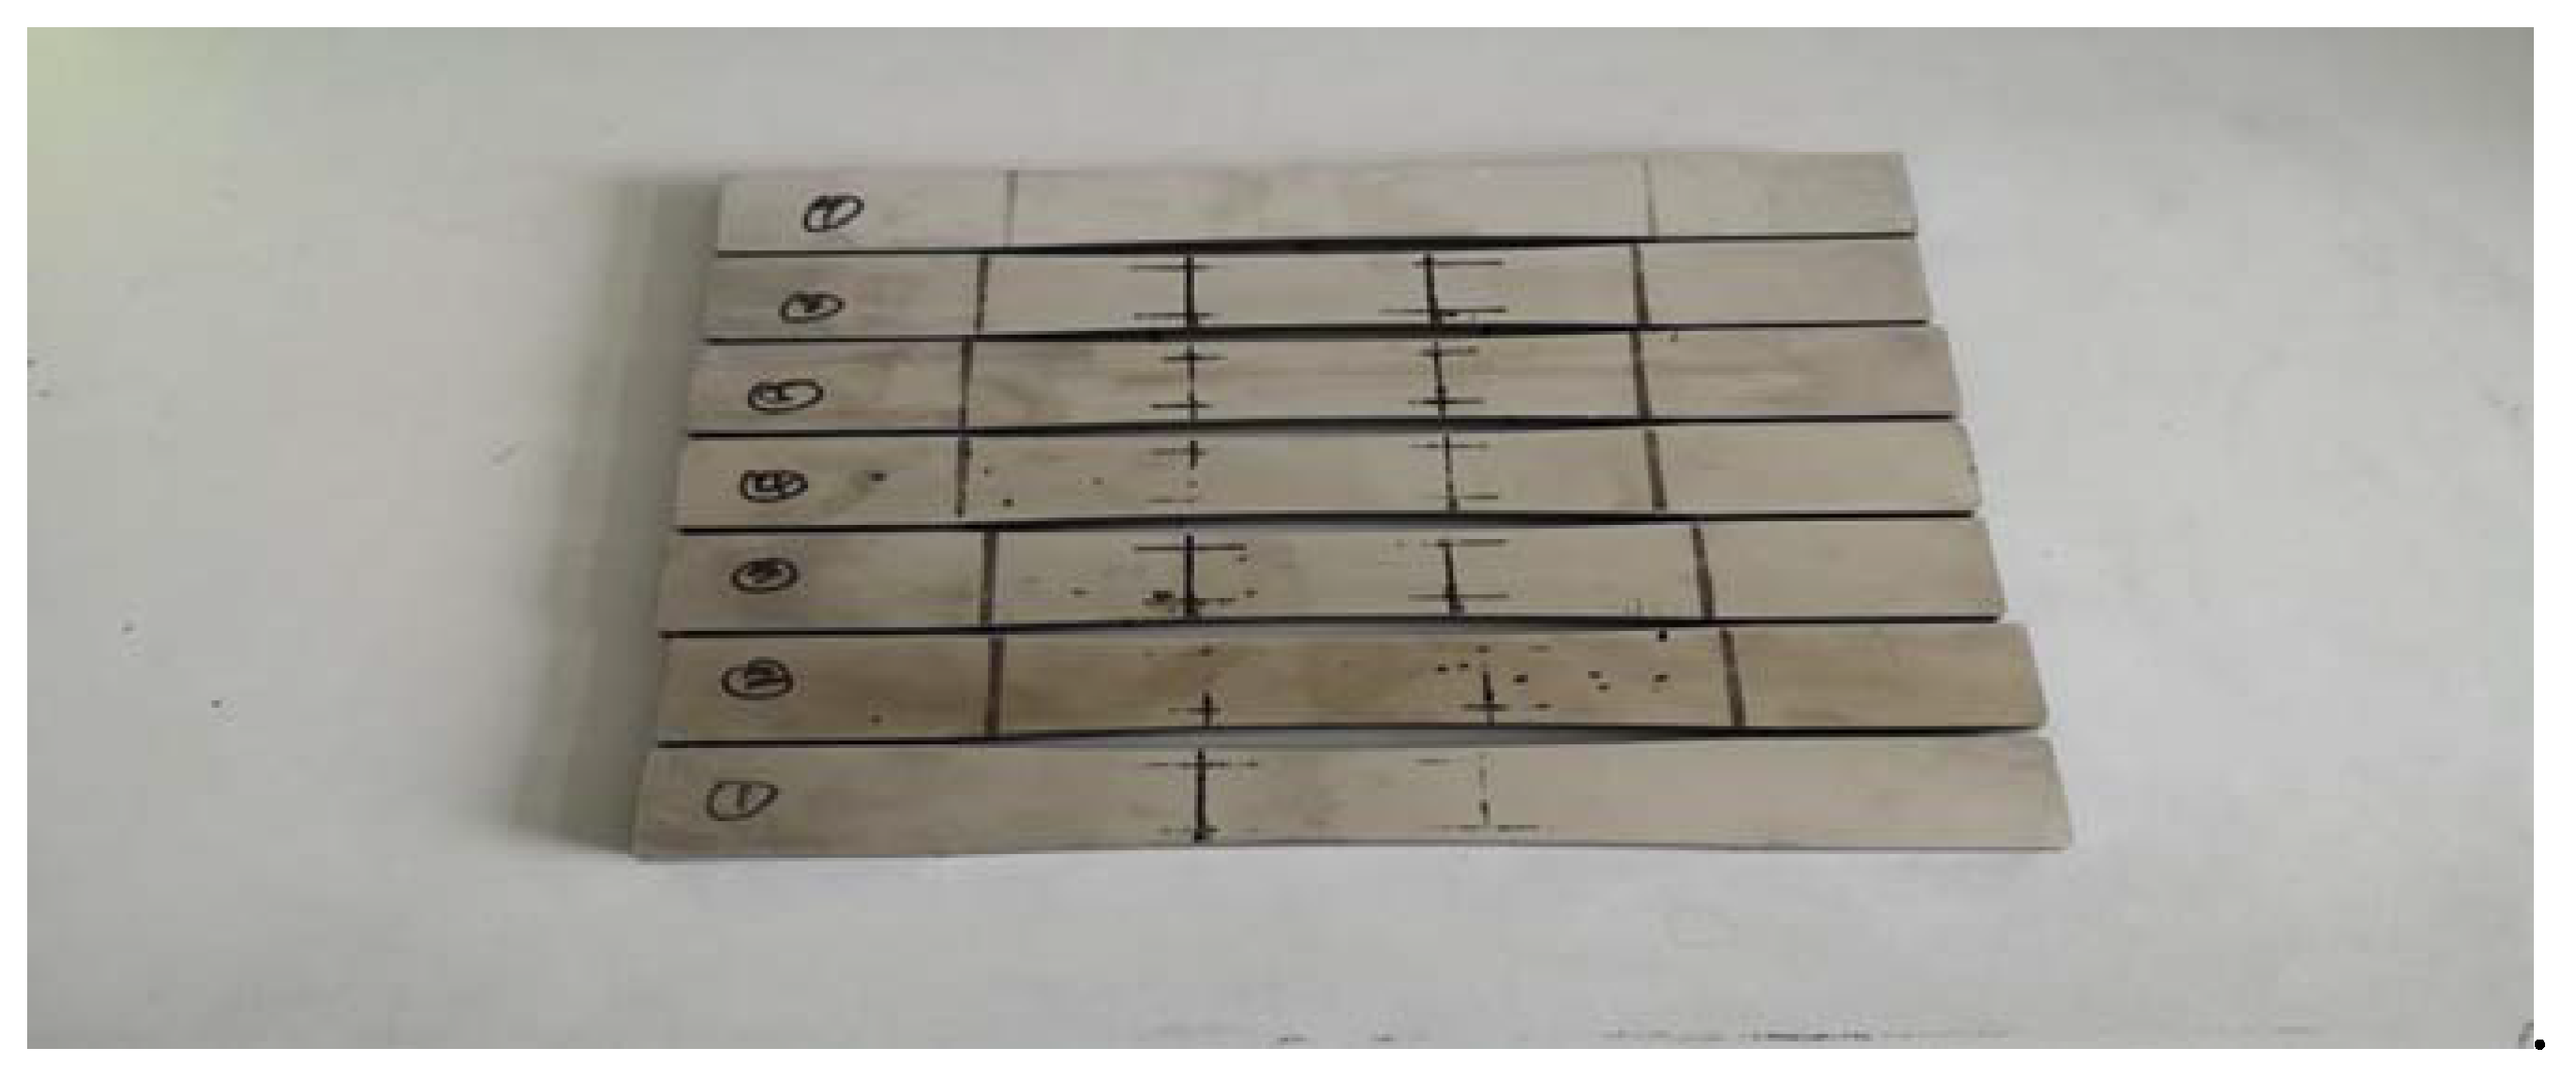
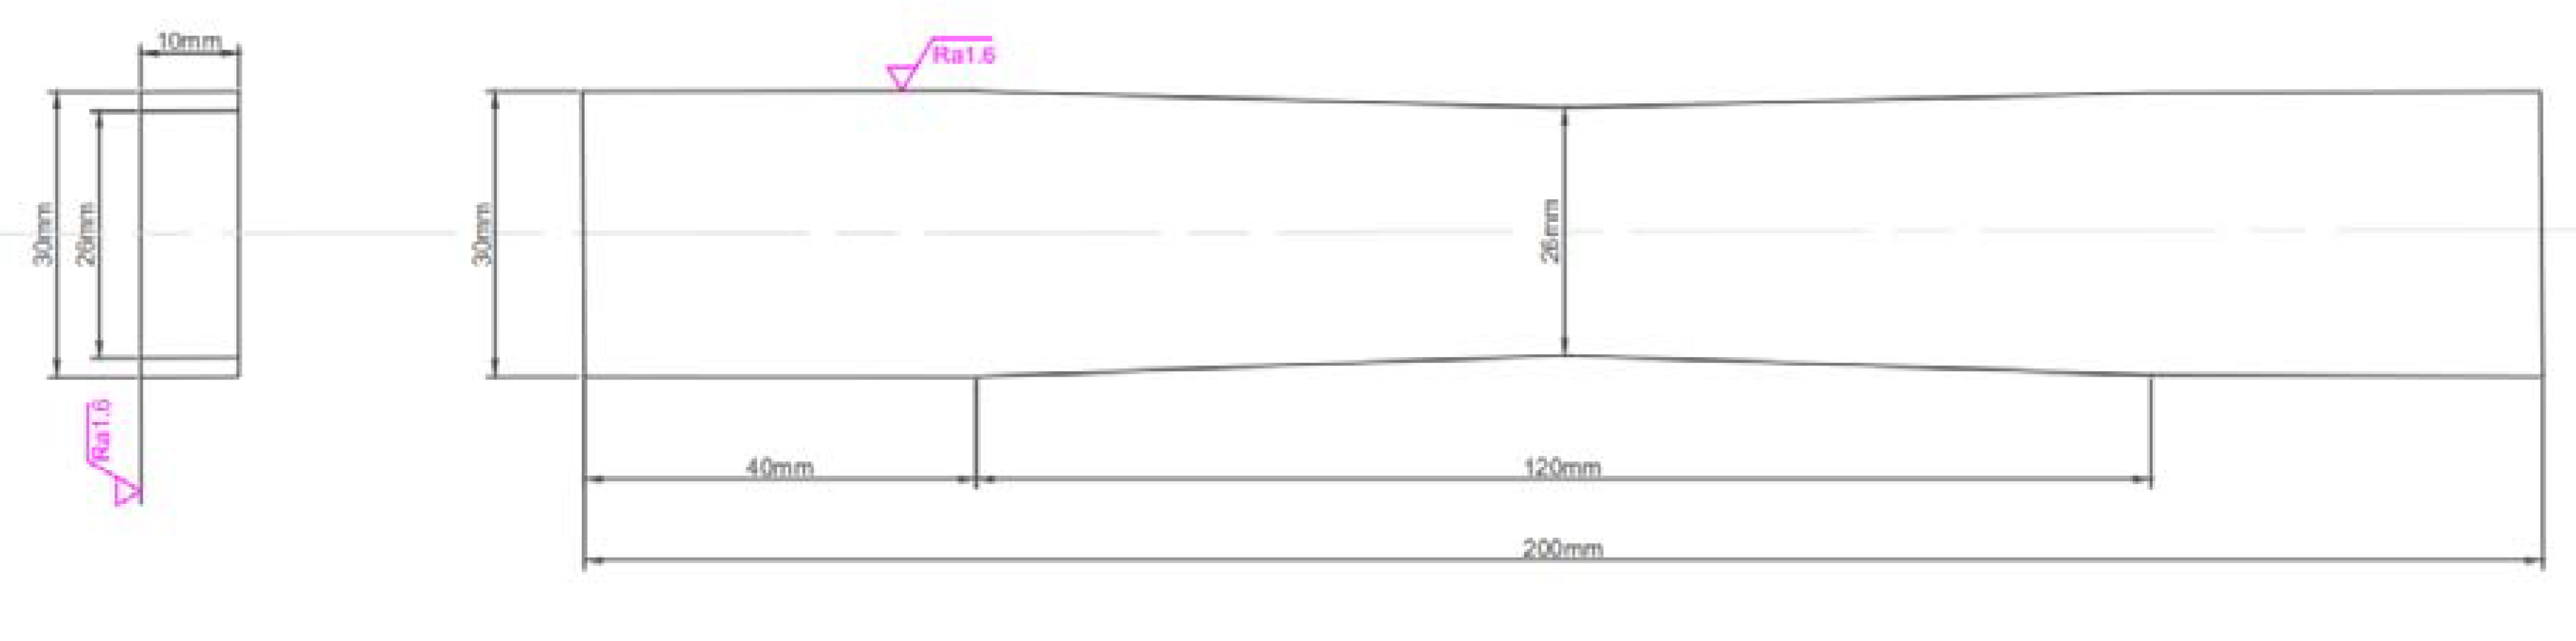
4.1. Specimens
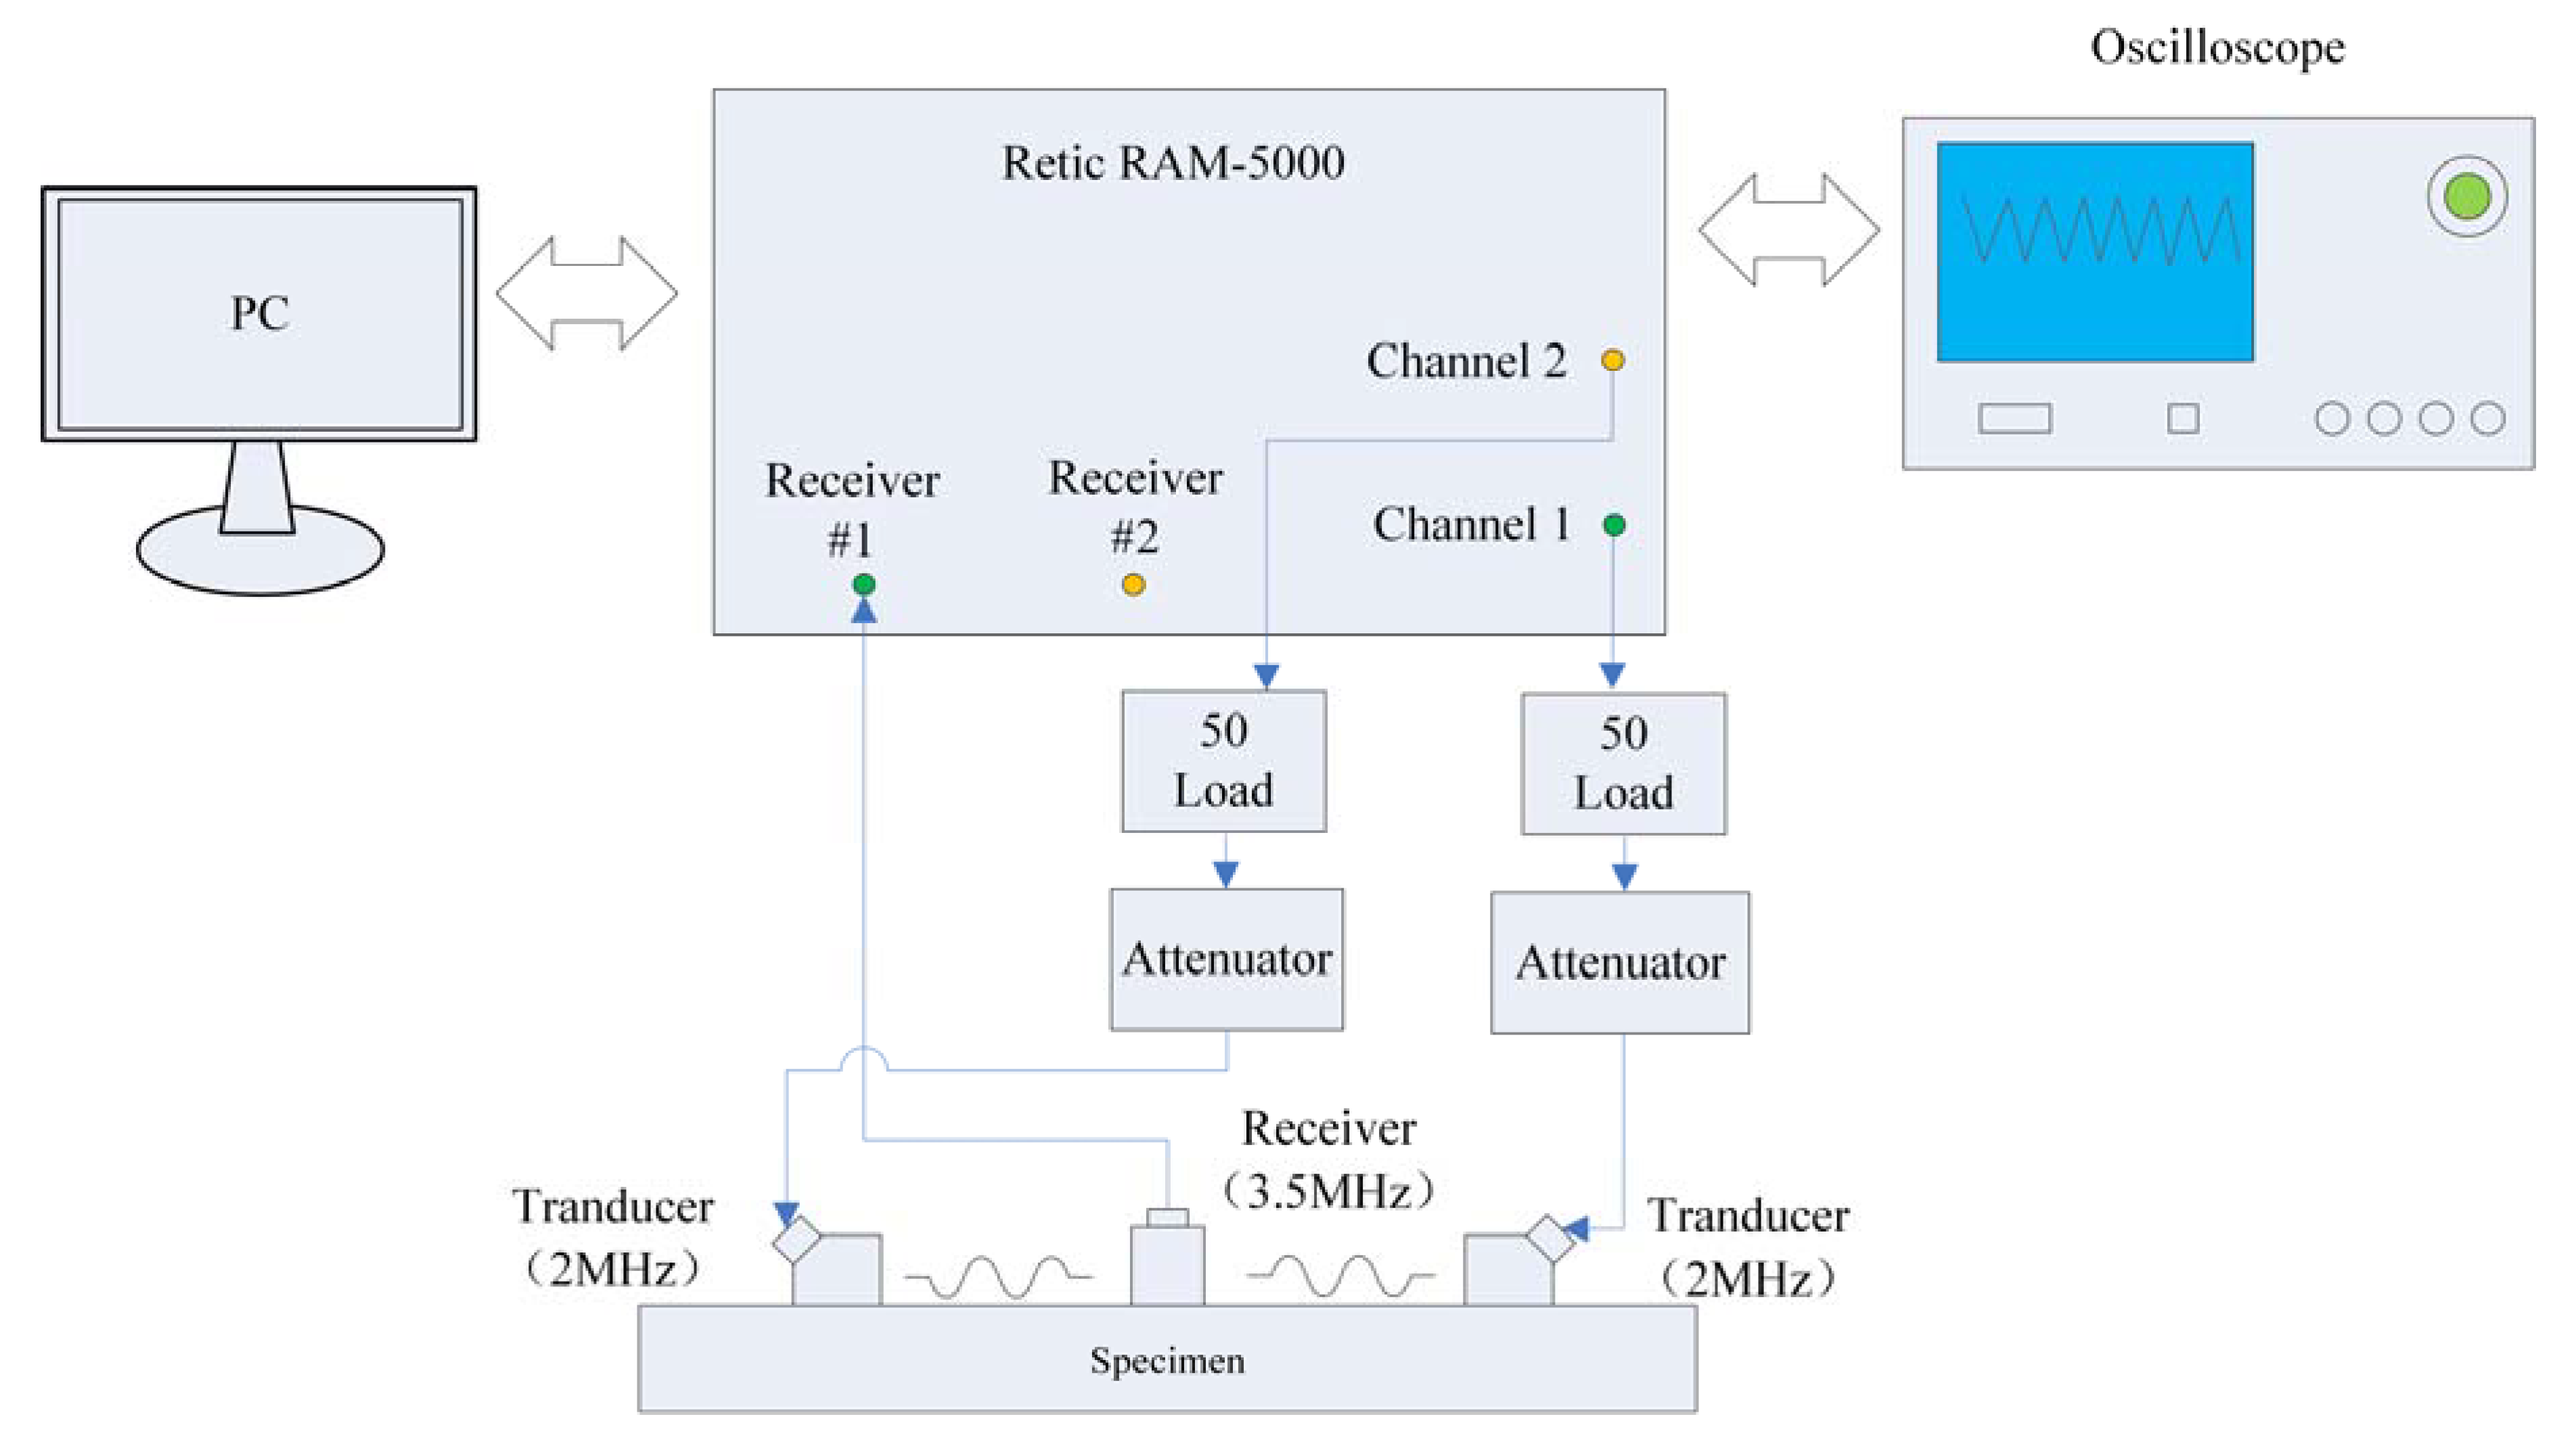
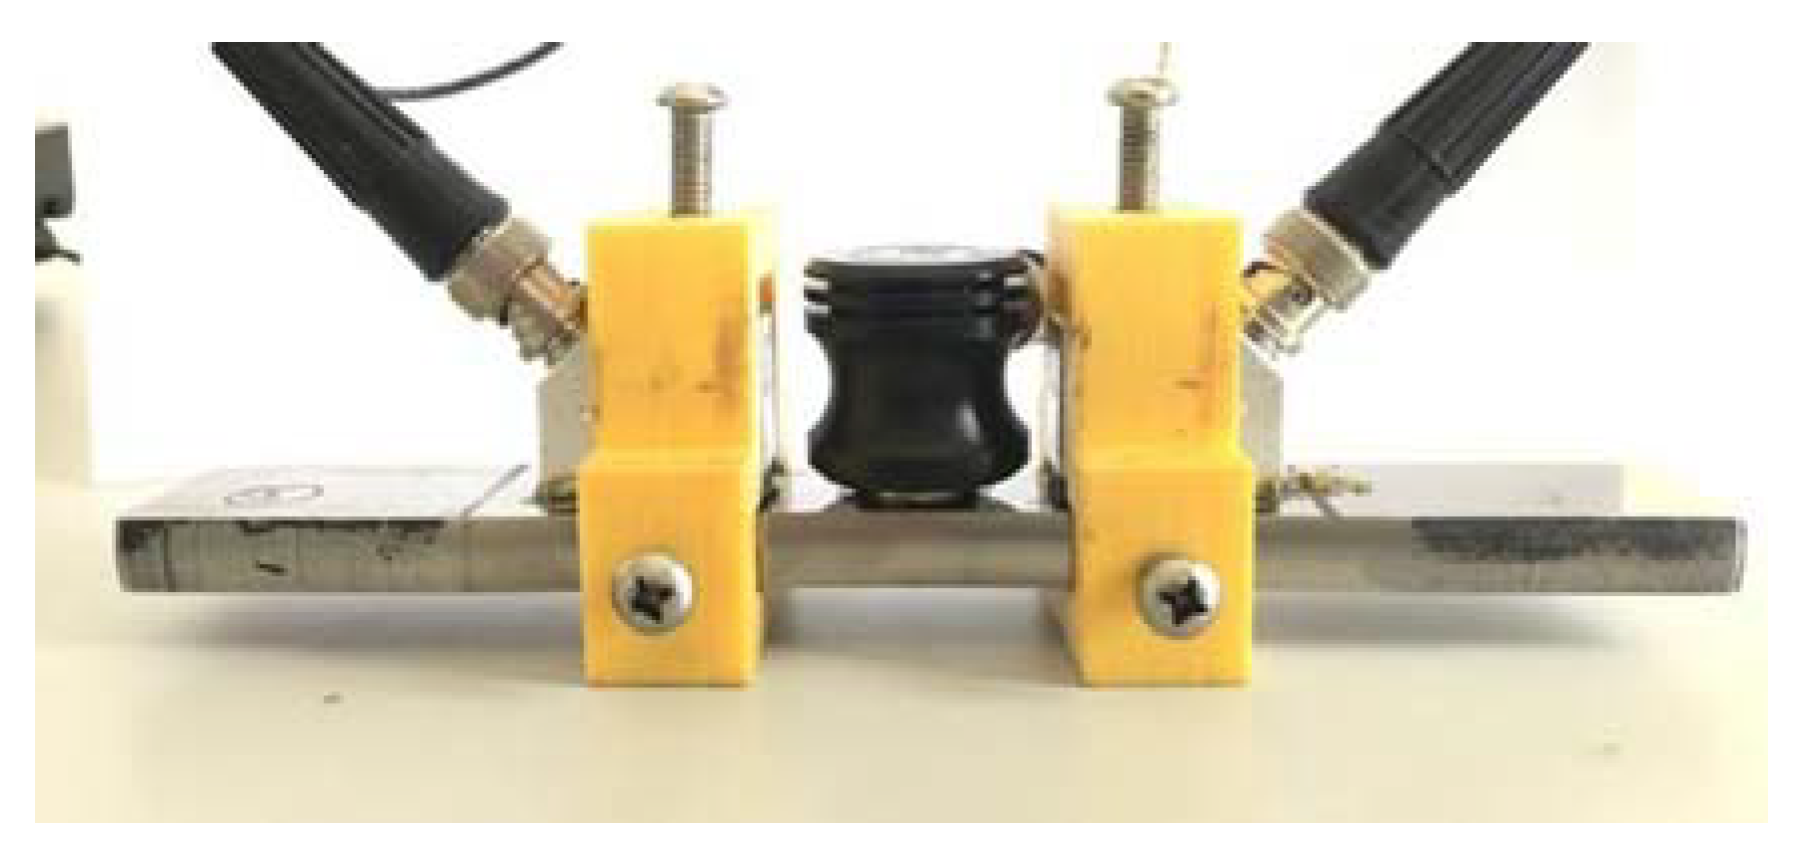
4.2. Testing System
4.3. Experimental Results and Analysis
5. Conclusions
Author Contributions
Funding
Conflicts of Interest
References
- Liu, P.; Jang, J.; Yang, S.; Sohn, H. Fatigue crack detection using dual laser induced nonlinear ultrasonic modulation. Opt. Lasers Eng. 2018, 110, 420–430. [Google Scholar] [CrossRef]
- Maier, S.; Kim, J.-Y.; Forstenhäusler, M.; Wall, J.J.; Jacobs, L.J. Noncontact nonlinear resonance ultrasound spectroscopy (NRUS) for small metallic specimens. NDT E Int. 2018, 98, 37–44. [Google Scholar] [CrossRef]
- Marcantonio, V.; Monarca, D.; Colantoni, A.; Cecchini, M. Ultrasonic waves for materials evaluation in fatigue, thermal and corrosion damage: A review. Mech. Syst. Signal Process. 2019, 120, 32–42. [Google Scholar] [CrossRef]
- Radecki, R.; Su, Z.; Cheng, L.; Packo, P.; Staszewski, W.J. Modelling nonlinearity of guided ultrasonic waves in fatigued materials using a nonlinear local interaction simulation approach and a spring model. Ultrasonics 2018, 84, 272–289. [Google Scholar] [CrossRef] [PubMed]
- Dib, G.; Roy, S.; Ramuhalli, P.; Chai, J. In-situ fatigue monitoring procedure using nonlinear ultrasonic surface waves considering the nonlinear effects in the measurement system. Nucl. Eng. Technol. 2019, 51, 867–876. [Google Scholar] [CrossRef]
- Guo, S.; Zhang, L.; Mirshekarloo, M.S.; Chen, S.; Chen, Y.F.; Wong, Z.Z.; Shen, Z.; Liu, H.; Yao, K. Method and analysis for determining yielding of titanium alloy with nonlinear Rayleigh surface waves. Mater. Sci. Eng. A 2016, 669, 41–47. [Google Scholar] [CrossRef]
- Ohara, Y.; Nakajima, H.; Tsuji, T.; Mihara, T. Nonlinear surface-acoustic-wave phased array with fixed-voltage fundamental wave amplitude difference for imaging closed cracks. NDT E Int. 2019, 108, 102170. [Google Scholar] [CrossRef]
- Lv, H.; Jiao, J.; Meng, X.; Cunfu, H.; Wu, B. Characterization of nonlinear ultrasonic effects using the dynamic wavelet fingerprint technique. J. Sound Vib. 2017, 389, 364–379. [Google Scholar] [CrossRef]
- Kim, J.-Y.; Jacobs, L.J.; Qu, J.; Littles, J.W. Experimental characterization of fatigue damage in a nickel-base superalloy using nonlinear ultrasonic waves. J. Acoust. Soc. Am. 2006, 120, 1266. [Google Scholar] [CrossRef]
- Torello, D.; Thiele, S.; Matlack, K.H.; Kim, J.-Y.; Qu, J.; Jacobs, L.J. Diffraction, attenuation, and source corrections for nonlinear Rayleigh wave ultrasonic measurements. Ultrasonics 2015, 56, 417–426. [Google Scholar] [CrossRef] [PubMed]
- Thiele, S.; Kim, J.-Y.; Qu, J.; Jacobs, L.J. Air-coupled detection of nonlinear Rayleigh surface waves to assess material nonlinearity. Ultrasonics 2014, 54, 1470–1475. [Google Scholar] [CrossRef] [PubMed]
- Shui, G.; Kim, J.-Y.; Qu, J.; Wang, Y.-S.; Jacobs, L.J. A new technique for measuring the acoustic nonlinearity of materials using Rayleigh waves. NDT E Int. 2008, 41, 326–329. [Google Scholar] [CrossRef]
- Hikata, A.; Chick, B.B.; Elbaum, C. Dislocation contribution to the second harmonic generation of ultrasonic waves. J. Appl. Phys. 1965, 36, 229. [Google Scholar] [CrossRef]
- Zabolotskaya, E.A. Nonlinear propagation of plane and circular Rayleigh-waves in isotropic solids. J. Acoust. Soc. Am. 1992, 91, 2569. [Google Scholar] [CrossRef]
- Walker, S.V.; Kim, J.-Y.; Qu, J.; Jacobs, L.J. Fatigue damage evaluation in A36 steel using nonlinear Rayleigh surface waves. NDT E Int. 2012, 48, 10–15. [Google Scholar] [CrossRef]


| Setting of Size and Location of Micro-Cracks | Excitation Mode | A1 (μm) | A2 (μm) | β |
|---|---|---|---|---|
| 20 nm × 150 μm (−10.5,5) 20 nm × 150 μm (10,5) | P1 | 3.74 × 10⁻² | 5.89 × 10⁻³ | 4.21 × 10³ |
| P2 | 3.41 × 10⁻² | 1.71 × 10⁻³ | 1.47 × 10³ | |
| P1 and P2 | 4.42 × 10⁻³ | 7.53 × 10⁻³ | 3.85 × 10⁵ | |
| 20 nm × 200 μm (−10,5) 20 nm × 150 μm (10,5) | P1 | 3.75 × 10⁻² | 5.61 × 10⁻³ | 3.99 × 10³ |
| P2 | 4.02 × 10⁻² | 5.30 × 10⁻³ | 3.28 × 10³ | |
| P1 and P2 | 4.66 × 10⁻³ | 1.08 × 10⁻² | 4.97 × 10⁵ | |
| 20 nm × 200 μm (−10.5,5) 20 nm × 150 μm(10,5) | P1 | 3.52 × 10⁻² | 5.58 × 10⁻³ | 4.50 × 10³ |
| P2 | 3.39 × 10⁻² | 8.18 × 10⁻⁴ | 7.12 × 10² | |
| P1 and P2 | 1.79 × 10⁻³ | 6.25 × 10⁻³ | 1.95 × 10⁶ |
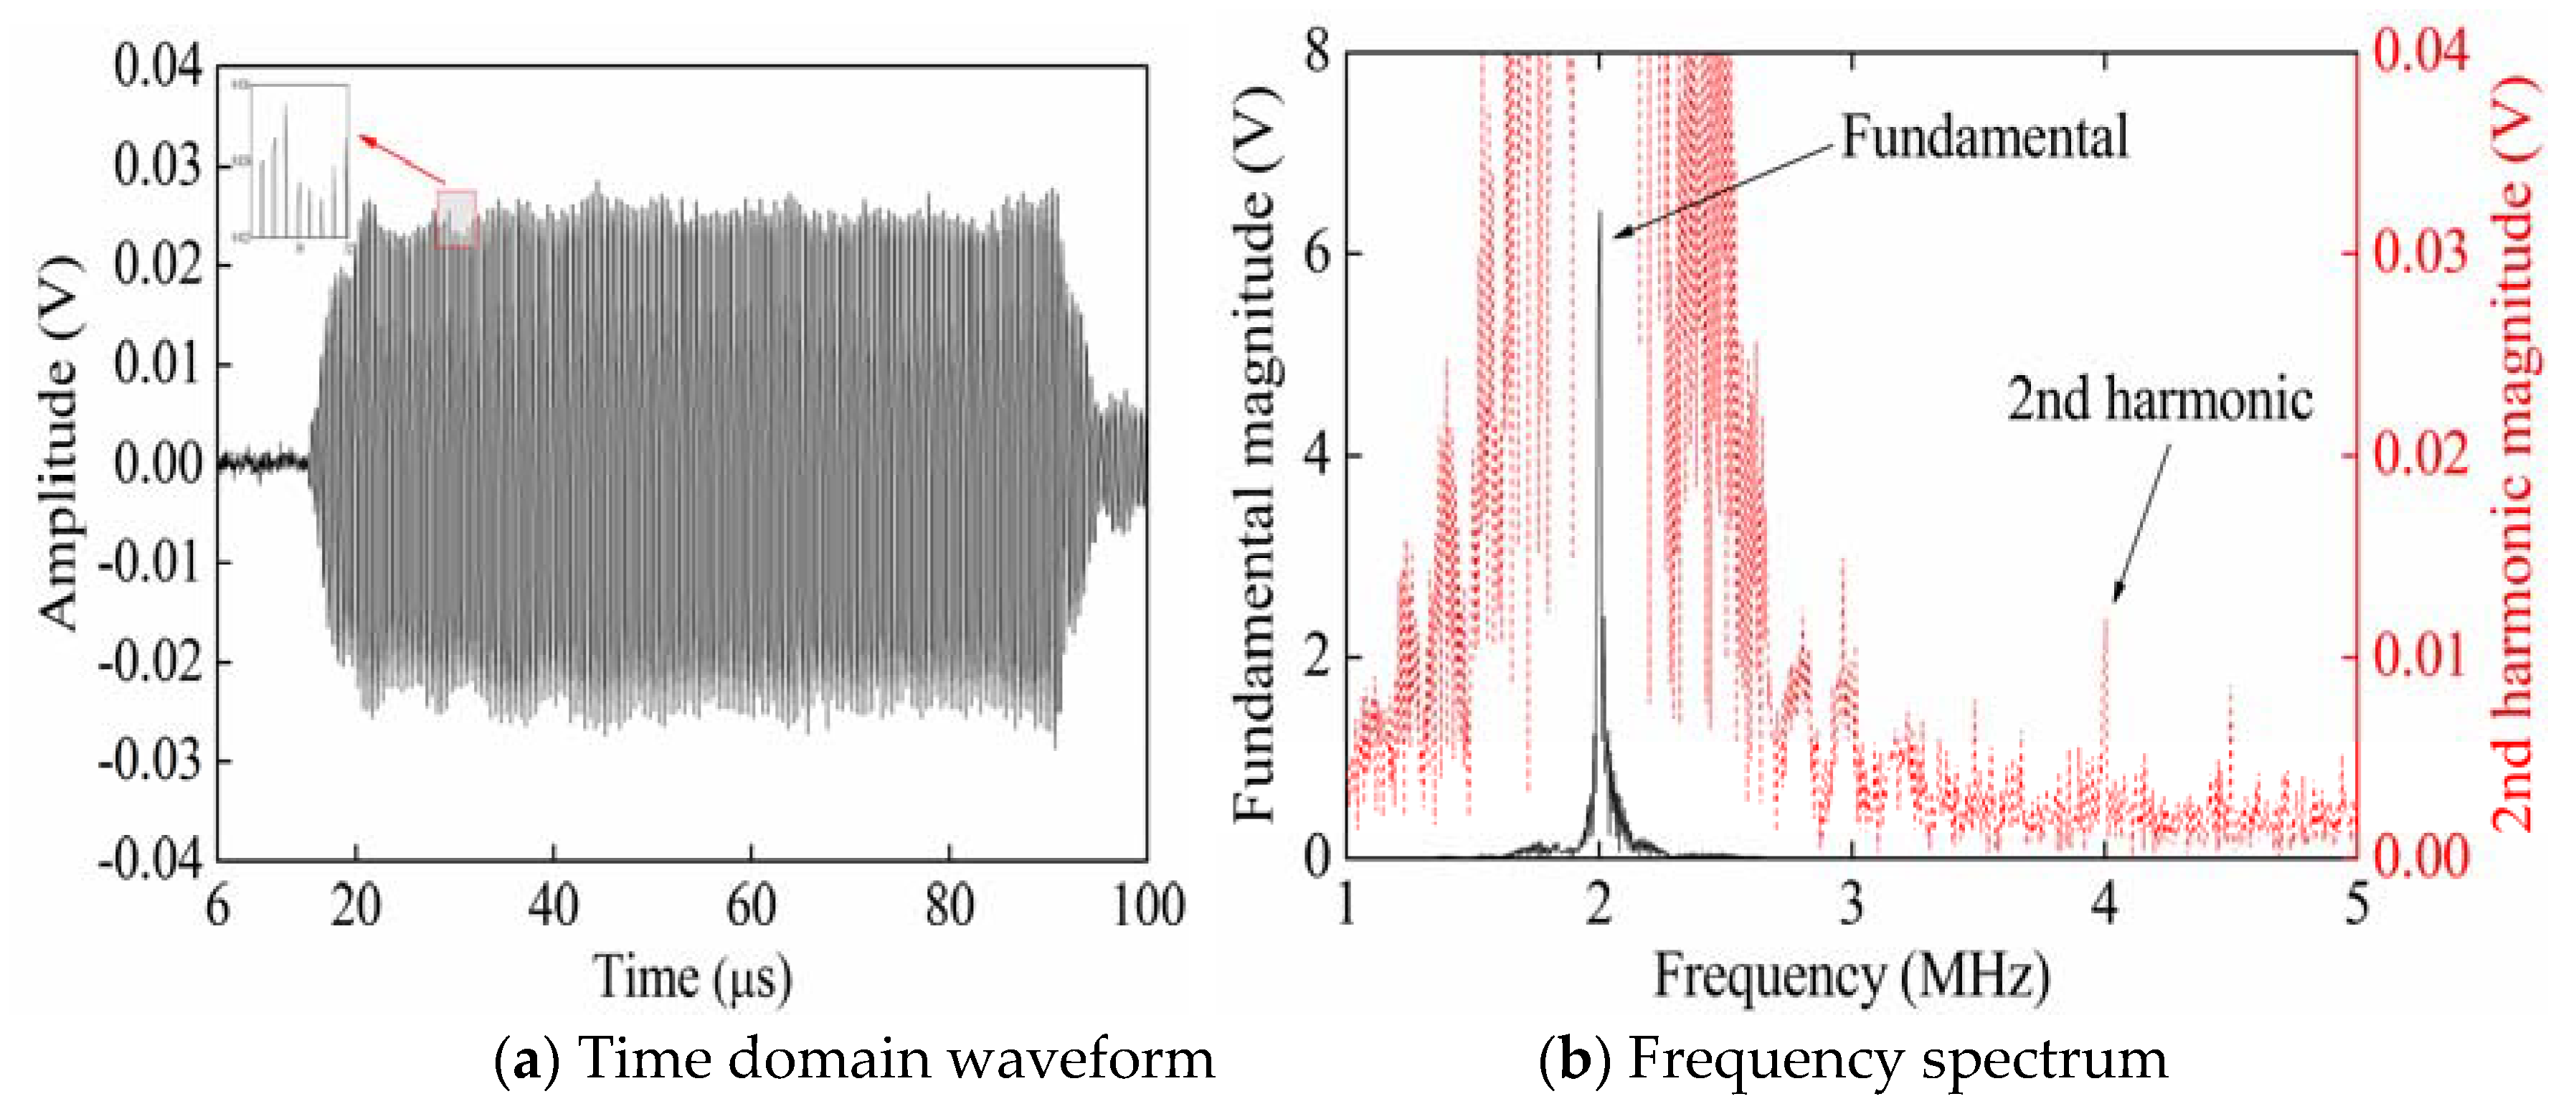
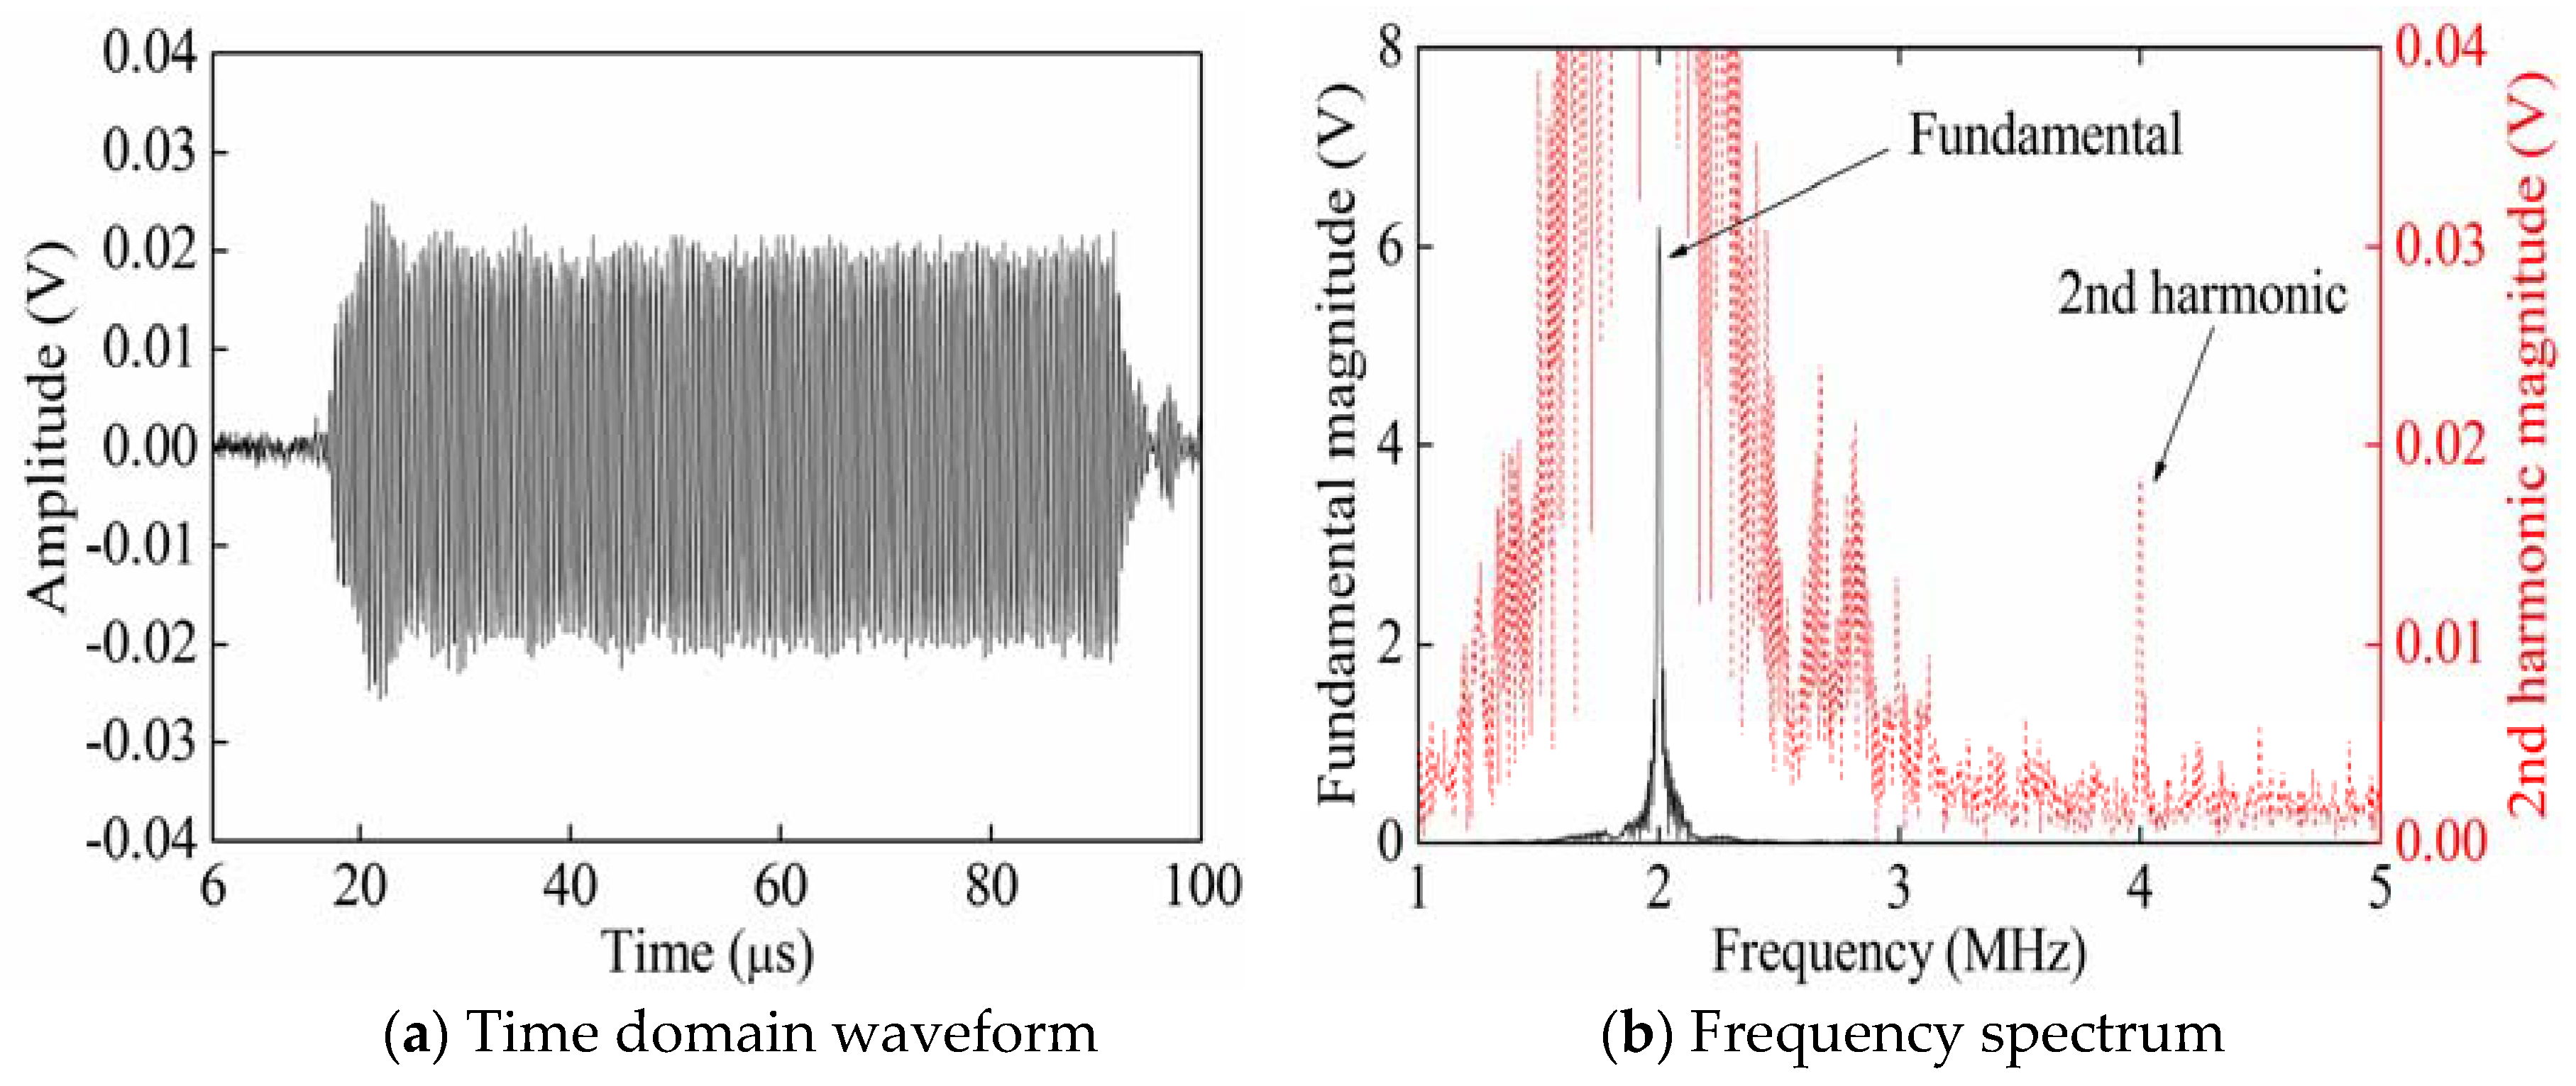
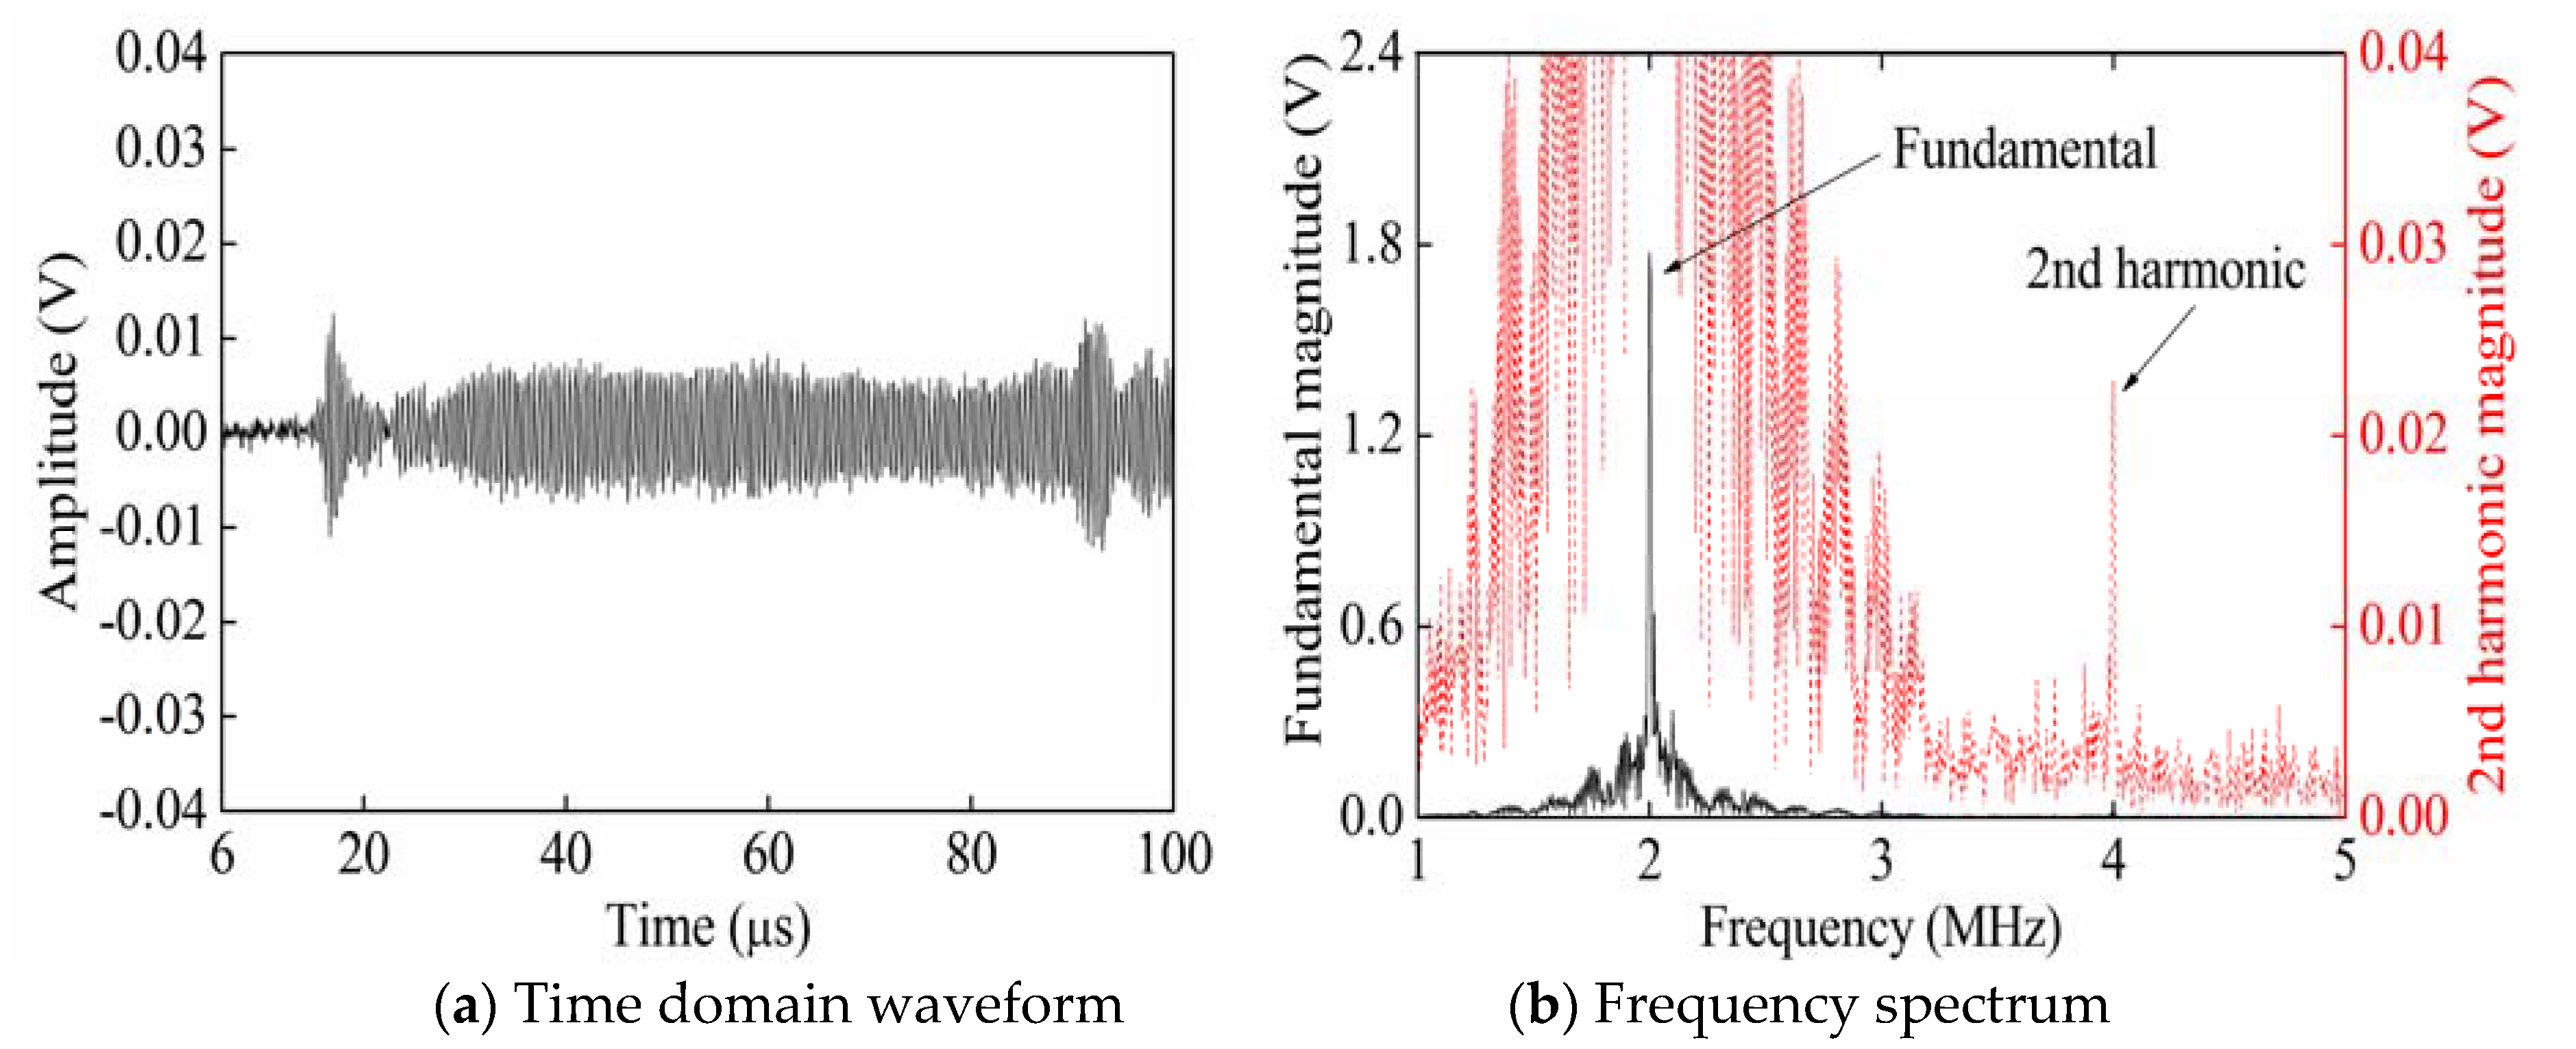
| Excitation Mode | A1 (V) | A2 (V) | β |
|---|---|---|---|
| Only opening Channel 1 | 6.43 | 1.19 × 10⁻² | 2.88 × 10⁻⁴ |
| Only opening Channel 2 | 6.20 | 1.87 × 10⁻² | 4.86 × 10⁻⁴ |
| Synchronously opening Channels 1 and 2 | 1.77 | 2.28 × 10⁻² | 7.27 × 10⁻³ |
© 2020 by the authors. Licensee MDPI, Basel, Switzerland. This article is an open access article distributed under the terms and conditions of the Creative Commons Attribution (CC BY) license (http://creativecommons.org/licenses/by/4.0/).
Share and Cite
Yan, B.; Song, Y.; Nie, S.; Yang, M.; Liu, Z. Measurement of the Acoustic Non-Linearity Parameter of Materials by Exciting Reversed-Phase Rayleigh Waves in Opposite Directions. Sensors 2020, 20, 1955. https://doi.org/10.3390/s20071955
Yan B, Song Y, Nie S, Yang M, Liu Z. Measurement of the Acoustic Non-Linearity Parameter of Materials by Exciting Reversed-Phase Rayleigh Waves in Opposite Directions. Sensors. 2020; 20(7):1955. https://doi.org/10.3390/s20071955
Chicago/Turabian StyleYan, Bingsheng, Yuzhou Song, Shijie Nie, Mingchao Yang, and Ziran Liu. 2020. "Measurement of the Acoustic Non-Linearity Parameter of Materials by Exciting Reversed-Phase Rayleigh Waves in Opposite Directions" Sensors 20, no. 7: 1955. https://doi.org/10.3390/s20071955
APA StyleYan, B., Song, Y., Nie, S., Yang, M., & Liu, Z. (2020). Measurement of the Acoustic Non-Linearity Parameter of Materials by Exciting Reversed-Phase Rayleigh Waves in Opposite Directions. Sensors, 20(7), 1955. https://doi.org/10.3390/s20071955