Article

A Large Detection-Range Plasmonic Sensor Based on An H-Shaped Photonic Crystal Fiber

1
Tianjin Key Laboratory of Electronic Materials and Devices, School of Electronics and Information Engineering, Hebei University of Technology, Tianjin 300401, China
2
State Key Laboratory of Luminescence and Applications, Changchun Institute of Optics, Fine Mechanics and Physics, Chinese Academy of Sciences, Changchun 130033, China
*
Author to whom correspondence should be addressed.
Sensors 2020, 20(4), 1009; https://doi.org/10.3390/s20041009
Submission received: 14 January 2020 / Revised: 11 February 2020 / Accepted: 12 February 2020 / Published: 13 February 2020
(This article belongs to the Section Optical Sensors)

Abstract

:
An H-shaped photonic crystal fiber (PCF)-based surface plasmon resonance (SPR) sensor is proposed for detecting large refractive index (RI) range which can either be higher or lower than the RI of the fiber material used. The grooves of the H-shaped PCF as the sensing channels are coated with gold film and then brought into direct contact with the analyte, which not only reduces the complexity of the fabrication but also provides reusable capacity compared with other designs. The sensing performance of the proposed sensor is investigated by using the finite element method. Numerical results show that the sensor can work normally in the large analyte RI (na) range from 1.33 to 1.49, and reach the maximum sensitivity of 25,900 nm/RIU (RI units) at the na range 1.47–1.48. Moreover, the sensor shows good stability in the tolerances of ±10% of the gold-film thickness.

1. Introduction

The surface plasmon resonance (SPR) phenomenon has been widely studied and applied in medical diagnostics, environmental monitoring, and biochemical research due to its high sensitivity, real-time and label-free monitoring [1,2,3,4,5,6]. Most commercial SPR sensors are based on a prism structure. However, because these structures require optical and mechanical components, they have the disadvantages of bulky configuration and high cost, which limits their practical application [1,2,3,4]. Using optical fiber-based SPR instead of a bulky prism can improve the integration degree. In these fiber-based designs, the fiber jacket is physically or chemically removed to expose the core to the sensing region in order to enhance the coupling between the core mode and the surface plasmon polariton (SPP) modes [1,2,3,4,5,6]. The laborious process will make the sensor more fragile. In recent years, many researchers have focused on different types of photonic crystal fiber (PCF)-based SPR sensor [7,8,9,10,11,12,13,14,15,16,17,18,19,20,21,22,23,24]. By introducing air holes in the core area of the PCF, the effective refractive index (neff) of the core mode can be reduced, thus easily realizing the phase matching between the core mode and the SPP modes [14,15,16,17,18]. These PCF-based SPR sensors have the advantages of miniaturization, high sensitivity and multi-parameter measurement, which make them more competitive in SPR sensing applications [7,8,9,10,11,12,13,14,15,16,17,18,19,20,21,22,23,24]. However, currently, PCF-based SPR sensors have two principal challenges: the first problem is the difficult process of the sensor’s fabrication, such as metal coating and analyte filling. In practice, the holes in these sensors are very small in size, generally in the order of micrometers [8,11,13,14,15,16,17,20,21,24]. Therefore, it is difficult to coat them with metal film uniformly and to fill them with liquid analyte within the predetermined parameters. Furthermore, these processing methods make it difficult to reuse for the replacement of analyte; Another problem is the narrow refractive index (RI) range of the sensor detection, either employing low RI or high RI PCF-SPR sensors [14,15,16,17,18,19,20,21,22,23]. In these sensors, in order to meet the total reflection condition, the highest RI value detected by the low RI PCF-SPR sensors is lower than that of the fiber materials [14,15,16,17,18,19], whereas the lowest RI value detected by the high RI PCF-SPR sensors must be higher than that of the fiber materials [20,21,22,23].
In this paper, we propose an open structure PCF-SPR sensor design that not only solves the problem of sensor fabrication but also can detect the RI over a larger range, either higher or lower than that of the fiber materials. The basic geometry of the PCF follows the H-shaped structure as shown in Figure 1. This open structure avoids coating in the holes with metal film and can be in direct contact with the analyte, thus reducing the manufacturing complexity and offering reusable capability. We use the finite element method based commercial COMSOL software to analysis the electromagnetic modes and the sensing performance of the sensor.

2. Structure Design and Principle

The schematic diagram of the proposed H-shaped PCF-SPR sensor is shown in Figure 1. The three layers of air holes are arranged in a hexagonal geometry, forming an H-shaped structure with symmetrical grooves. The gold film as a plasmonic material is placed on the internal surface of the grooves. These grooves are particularly advantageous for metal coating, and have the characteristics of good accessibility and easy replacement of analyte. The special structure can be made by femtosecond laser micromachining [25], focused ion-beam milling [26,27], or chemical etching of the original side-hole PCF [28,29].
In our simulation, the distance between the holes is Λ = 8 μm and the diameters of the cladding holes is 0.5Λ, respectively. The opening depth is set to h = 3Λ, the widths of the two grooves are both 0.5Λ, and the thickness of gold film is m1 = m2 = 40 nm. The RI of air is 1, and the RI of the fiber materials is fixed at 1.45 in order to clearly show that the RI of the analyte can either be higher or lower than that of the fiber materials. In addition, the complex dielectric constant (Ɛ(ω)) of gold is defined by using the Drude–Lorentz model [30]:
ε ( ω ) = ε ω D 2 ω ( ω + j γ D ) + Δ ε Ω L 2 ( ω 2 Ω L 2 ) + j Γ L ω
where ωD represents the plasma frequency, ϒD is the damping frequency. ΩL, ΓL and Δε can be interpreted as the oscillator strength, spectral width of the Lorentz oscillators, and weighting factor [30]. In addition, we use the artificial boundary condition of the outermost perfect matching layer (PML) to absorb the radiant energy as shown in Figure 1b [13,19,31].
Because the core mode with the electric field predominantly orthogonal to the metal surface can be more readily coupled to the SPP modes on the metal surface [8,9,18,22,32,33,34], in this design the y-polarized core mode has a better SPR phenomenon than the x-polarized core mode, thus providing a better sensing performance. In what follows, we mainly investigate the sensing performance of the y-polarized core mode. In Figure 2a, we plot the real part of the neff (Re(neff)) curves of the y-polarized core mode and SPP modes when the RI of the analyte (na) is 1.43, 1.45, and 1.47, respectively, to indicate that the proposed sensor has potential for RI sensing that can be higher or lower than the RI of fiber materials. The black solid line represents the Re(neff) of y-polarized core mode, whereas the red solid, red dashed and red dotted lines respectively represent the Re(neff) of y-polarized SPP modes at na = 1.43, 1.45, and 1.47, as shown in Figure 2a. Take the case of na at 1.43; the core mode and SPP mode are coupled where their neff curves intersect (C point in Figure 2a). Losses of the core mode increase sharply near this intersection (resonance wavelength) as shown in Figure 2b, because the energy of the core mode transfers to SPP modes which can be observed from the inset C in Figure 2c. Similar processes of this energy transfer also occur at the intersections D and E when the na is 1.45 and 1.47, respectively, which can be seen from Figure 2b and the insets D and E in Figure 2c. In Figure 2a,b, we also observed that the wavelength of resonance peak is 1006 nm, 1367 nm, and 1791 nm when na is 1.43, 1.45, and 1.47, respectively. That is, as na increases, the resonance peak shifts to longer wavelengths. This peak behavior can be used to measure the change of the analyte RI.

3. Results and Discussion

3.1. Sensing Performance

By measuring the shift of the peak wavelength, the change in na can be determined. The sensitivity of the sensor is given by [8,9,12,14,15,16,17,18,19,20,21,22,24]:
S λ = ( n m / R I U ) = Δ λ p e a k Δ n a
where, Δλpeak denote the shift of peak wavelength and Δna is the change of na. To give an example in Figure 2b, na changes from 1.45 to 1.47, and the corresponding peak wavelength shifts Δλpeak = 424 nm, which means that the sensitivity of the sensor is 21,200 nm/RIU (RI units). Figure 3b,d respectively depict the peak wavelengths and sensitivities curves of the sensor when the na changes from 1.33 to 1.49. On the whole, as na increases with the same Δna, the Δλpeak of the peak wavelength also becomes larger, according to Equation (2), the sensitivity of the sensor also increases correspondingly, reaching a maximum value of 25,900 nm/RIU when the na range of 1.47–1.48 as shown in Figure 3d. This sensing performance make it very suitable to measure some high RI organic chemical analytes, such as chloroform toluene or benzene [35].

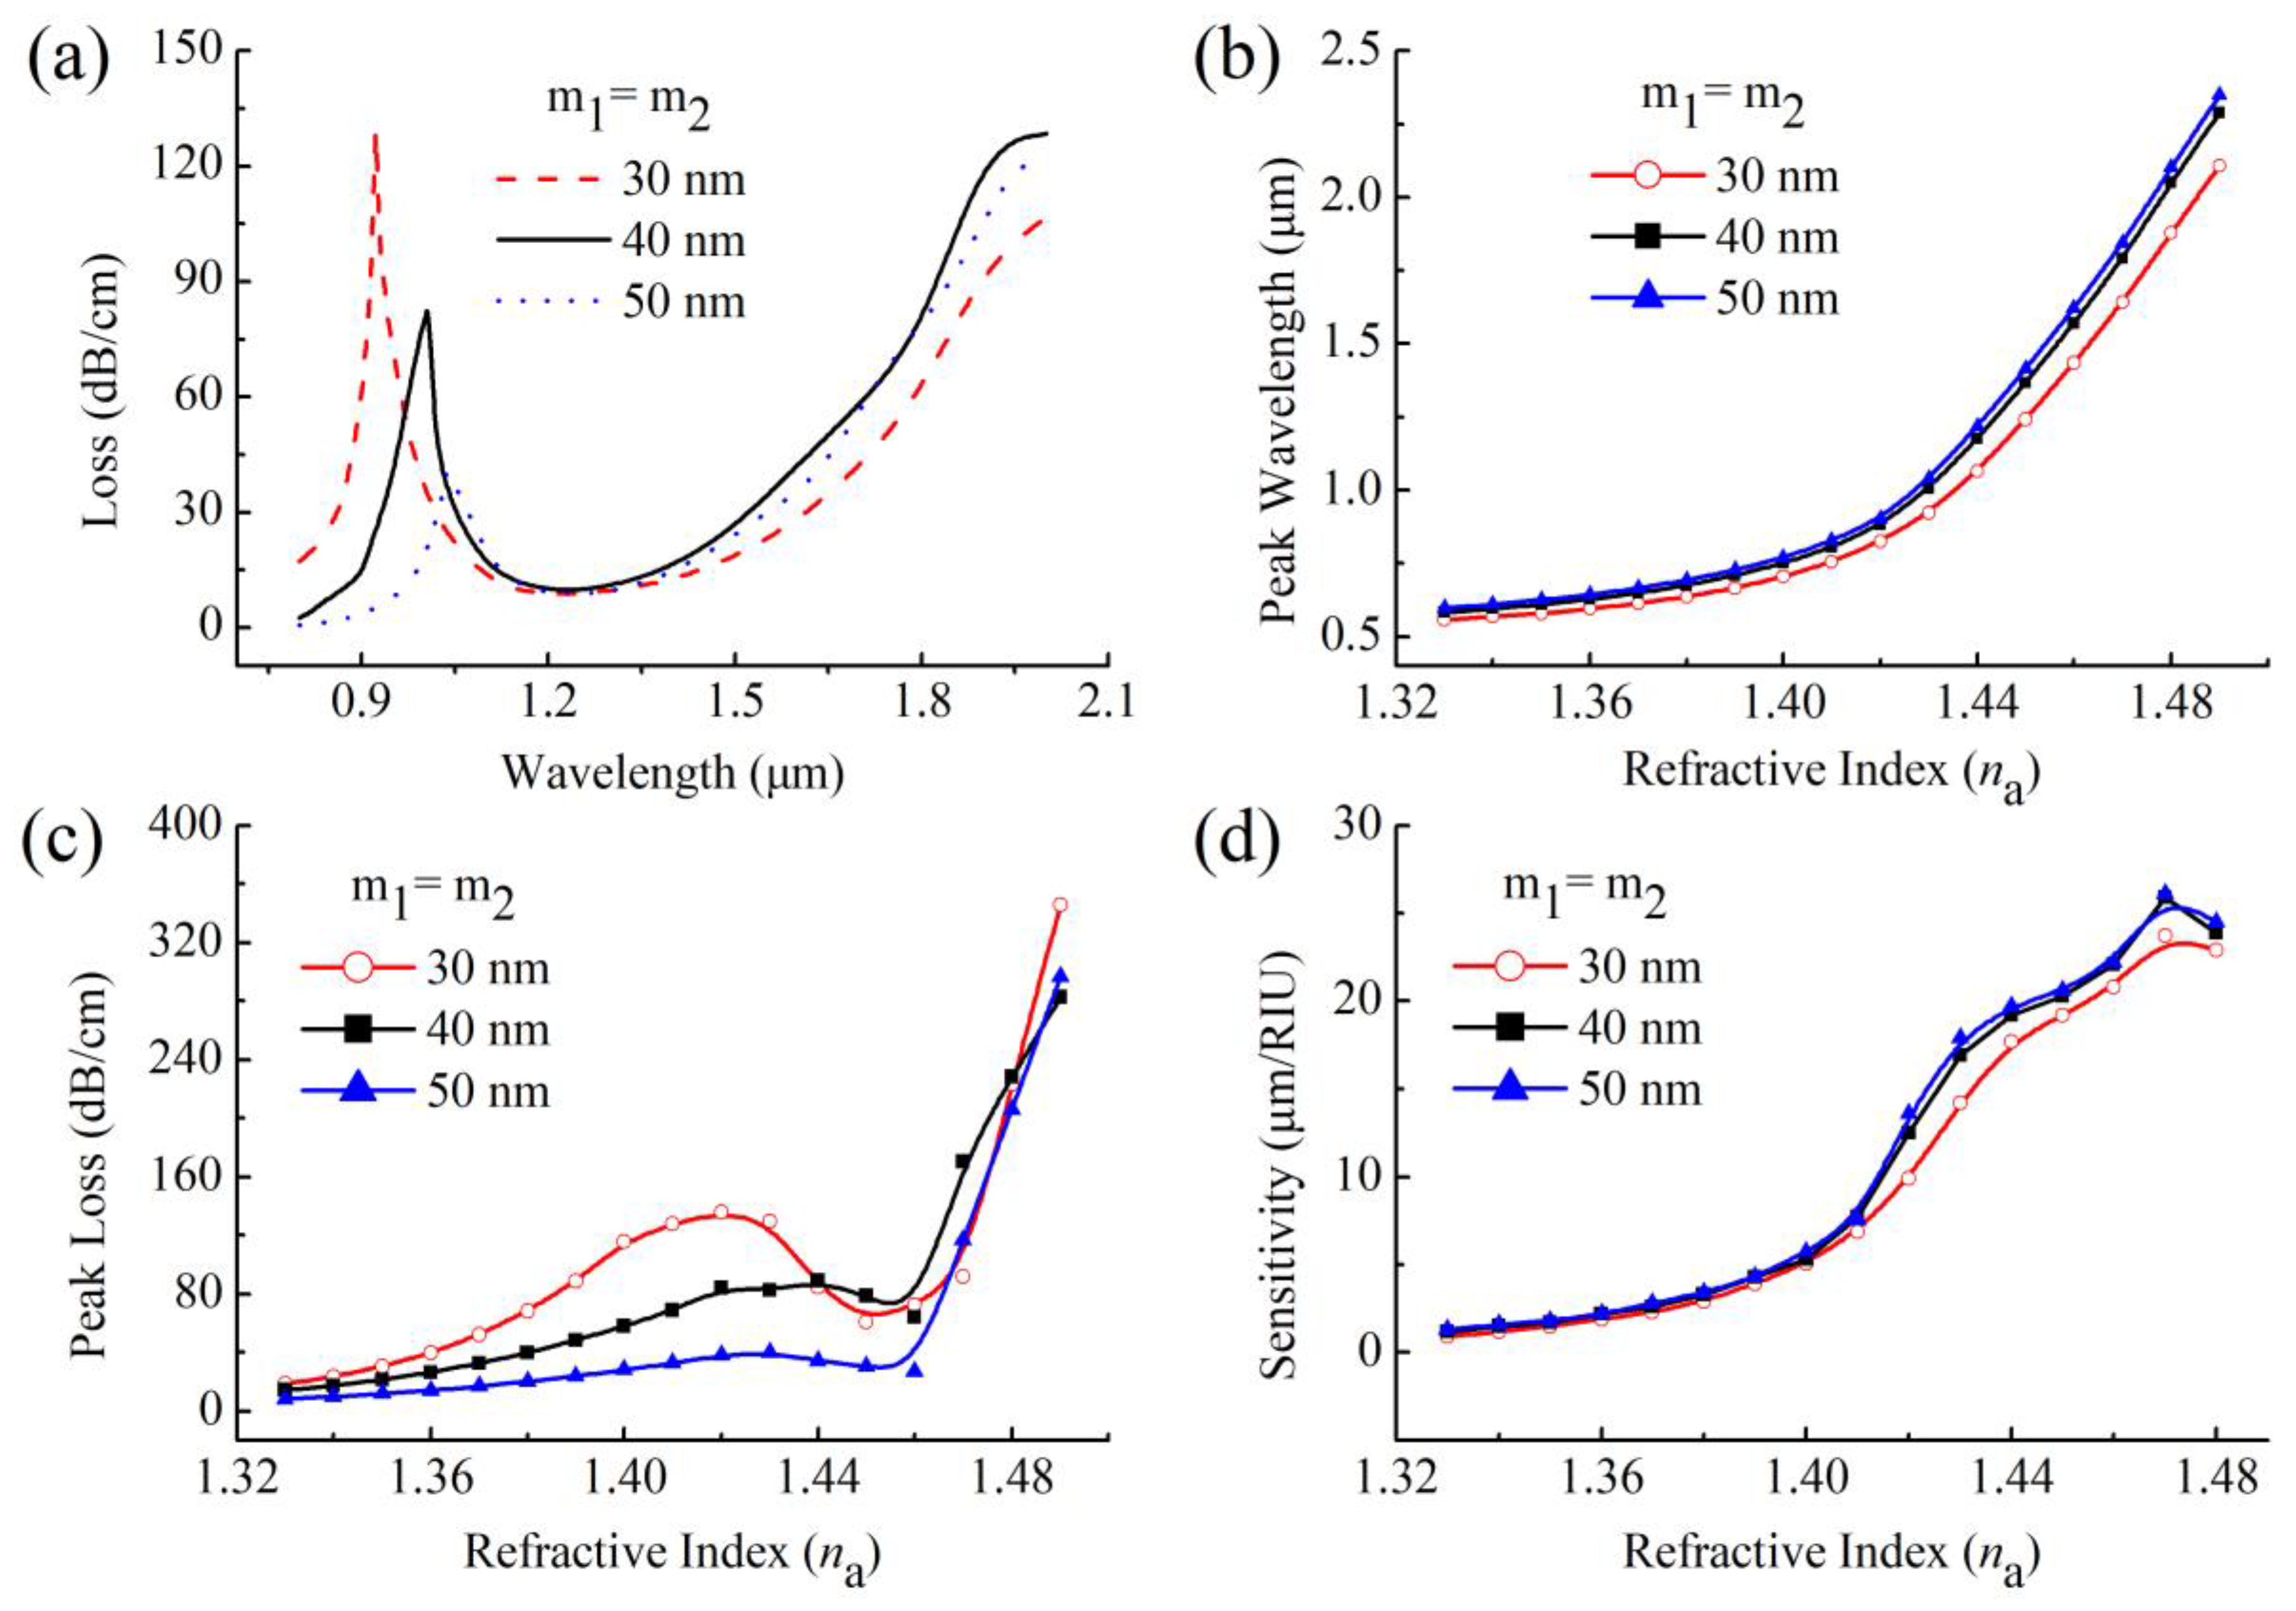
3.2. Gold-Film Thickness

The thickness of the metal film is a significant parameter affecting the resonance coupling between the core mode and the SPP modes [14,15,16]. Figure 3a shows the loss spectra of the y-polarized core mode at na = 1.43 for various thicknesses of gold film (m1 = m2) 30 nm, 40 nm, and 50 nm. As can be seen from the figure, with the thickness of the gold film becoming thicker, the corresponding peak wavelength shifts towards longer wavelengths and, meanwhile, the peak loss shows a downward trend. This peak behavior is also consistent with that at the other na, as shown in Figure 3b,c. The main reason for these phenomena is that the increase of gold-film thickness increases the distance between the core area and the gold surface, and only at longer wavelengths can the electric field of the core mode penetrate the gold film, coupling with the SPP modes on the gold surface. The increase of gold-film thickness also reduces the coupling intensity between the core mode and the SPP modes, thus reducing the peak loss. Note that the curves of peak loss appear to significantly decline in the vicinity of 1.45. This is due to the fact that the na is not very different from the RI of the background material, the confinement of the core mode becomes weaker and more energy of the core mode leaks out to the analyte region. To further study the effect of gold-film thickness on sensing performance, we also present the sensitivities of the sensor at different na with gold-film thickness at 30 nm, 40 nm, and 50 nm in Figure 3d. In general, the sensor shows a higher sensitivity with the thicker gold film, especially at the larger na range.

3.3. Fabrication Tolerance

Coating with gold film on surfaces of such grooves in this design is much simpler than that on inner surfaces of the air holes in the other designs [13,14,15,16,17,20,24]. In actual manufacturing, however, it is difficult to accurately deposit the gold film on the surface of the two grooves under the same thickness. It is necessary to investigate the effect of the fabrication tolerances of the gold film on the sensing performance of the sensor. Due to the symmetry of its structure, we only consider the case in which the variation of ±10% of m2 affects the sensing performance of the proposed sensor when the m1 is fixed to 40 nm. Figure 4 shows the loss spectra with slight variation of ±10% of m2 at na = 1.47. When m2 varies from -10% to +10%, the loss spectra present a slight change.
In order to further investigate the effect of the m2 on sensing performance of the proposed sensor, we summarize the peak wavelengths, peak losses and sensitivities for variation of ±10% of m2 in Table 1 when m1 is fixed at 40 nm and na changes from 1.33 to 1.49. In general, as m2 changes from −10% to +10%, the peak wavelength shows a slight decrease in the low na range and then follows an opposite trend in the high na range, and the peak loss shows a small decrease in the whole na range. Those slight changes have negligible influence on the sensitivities of the sensor as shown in Table 1, which indicates that the sensor has good stability within the variation of ±10% fabrication tolerances for the thickness of the gold film and low requirements of manufacturing precision.

4. Conclusions

In this paper, we propose a novel design of an open structure H-shaped PCF with a capability of a wide RI-detection range. The gold film and the analyte are placed on the surface of the grooves in the H-shaped PCF, making the fabrication of the sensor much easier than traditional PCF-SPR sensors in which the gold film and the analyte are placed in the air holes. The results demonstrate that the proposed sensor can work well in a large na range, and has good stability within tolerances of ±10% of the gold-film thickness. Compared with the other types of SPR sensor, our proposed SPR sensor has the advantages of convenient operation, simple fabrication, good stability, large detection range, high sensitivity, and is reusable, which make it more competitive in physical-, biological- and chemical-sensing fields.

Author Contributions

Conceptualization, H.H. and N.L.; investigation, H.H., D.H., L.Z. and N.L.; writing—original draft preparation, H.H.; writing—review and editing, H.H. and N.L.; supervision, N.L., L.S., Z.L., Y.L. and J.L.; funding acquisition, N.L., L.S. and Y.H. All authors have read and agreed to the published version of the manuscript.

Funding

This research was funded by the State Key Laboratory of Luminescence and Applications, grant number SKLA-2019-07, the National Natural Science Foundation of China, grant number 61905064 and 61905062, the Natural Science Foundation of Hebei province, grant number F2019202294, F2019202252 and F2019202320, and the Natural Science Foundation of Tianjin city, grant number 15JCYBJC17000.

Conflicts of Interest

The authors declare no conflict of interest.

References

  1. Homola, J.; Yee, S.S.; Gauglitz, G. Surface plasmon resonance sensors: Review. Sens. Actuators B Chem. 1999, 54, 3–15. [Google Scholar] [CrossRef]
  2. Singh, P. SPR biosensors: Historical perspectives and current challenges. Sens. Actuators B Chem. 2016, 229, 110–130. [Google Scholar] [CrossRef]
  3. Sharma, A.K.; Pandey, A.K.; Kaur, B. A review of advancements (2007–2017) in plasmonics-based optical fiber sensors. Opt. Fiber Technol. 2018, 43, 20–34. [Google Scholar] [CrossRef]
  4. Klantsataya, E.; Jia, P.; Ebendorff-Heidepriem, H.; Monro, T.M.; Francois, A. Plasmonic fiber optic refractometric sensors: From conventional architectures to recent design trends. Sensors 2016, 17, 12. [Google Scholar] [CrossRef] [PubMed] [Green Version]
  5. Zhao, Y.; Lei, M.; Liu, S.; Zhao, Q. Smart hydrogel-based optical fiber SPR sensor for pH measurements. Sens. Actuators B Chem. 2018, 261, 226–232. [Google Scholar] [CrossRef]
  6. Aruna Gandhi, M.S.; Chu, S.; Senthilnathan, K.; Babu, P.R.; Nakkeeran, K.; Li, Q. Recent advances in plasmonic sensor-based fiber optic probes for biological applications. Appl. Sci. 2019, 9, 949. [Google Scholar] [CrossRef] [Green Version]
  7. Zhao, Y.; Wu, Q.; Zhang, Y. Theoretical analysis of high-sensitive seawater temperature and salinity measurement based on C-type micro-structured fiber. Sens. Actuators B Chem. 2018, 258, 822–828. [Google Scholar] [CrossRef]
  8. Luan, N.; Ding, C.; Yao, J. A refractive index and temperature sensor based on surface plasmon resonance in an exposed-core microstructured optical fiber. IEEE Photonics J. 2016, 8, 1–8. [Google Scholar] [CrossRef]
  9. Zhao, L.; Han, H.; Lian, Y.; Luan, N.; Liu, J. Theoretical analysis of all-solid D-type photonic crystal fiber based plasmonic sensor for refractive index and temperature sensing. Opt. Fiber Technol. 2019, 50, 165–171. [Google Scholar] [CrossRef]
  10. Rifat, A.A.; Ahmed, R.; Yetisen, A.K.; Butt, H.; Sabouri, A.; Mahdiraji, G.A.; Yun, S.H.; Adikan, F.M. Photonic crystal fiber based plasmonic sensors. Sens. Actuators B Chem. 2017, 243, 311–325. [Google Scholar] [CrossRef]
  11. Zhao, Y.; Deng, Z.; Li, J. Photonic crystal fiber based surface plasmon resonance chemical sensors. Sens. Actuators B Chem. 2014, 202, 557–567. [Google Scholar] [CrossRef]
  12. Chen, X.; Xia, L.; Li, C. Surface plasmon resonance sensor based on a novel D-shaped photonic crystal fiber for low refractive index detection. IEEE Photonics J. 2018, 10, 1–9. [Google Scholar] [CrossRef]
  13. Fan, Z.; Li, S.; Qiang, L.; An, G.; Chen, H.; Li, J.; Dou, C.; Hui, L.; Zi, J.; Tian, W. High-sensitivity of refractive index sensor based on analyte-filled photonic crystal fiber with surface plasmon resonance. IEEE Photonics J. 2015, 7, 1–9. [Google Scholar] [CrossRef]
  14. Hassani, A.; Skorobogatiy, M. Design of the microstructured optical fiber-based surface plasmon resonance sensors with enhanced microfluidics. Opt. Express 2006, 14, 11616–11621. [Google Scholar] [CrossRef] [Green Version]
  15. Zhang, Y.; Xia, L.; Zhou, C.; Yu, X.; Liu, H.; Liu, D.; Zhang, Y. Microstructured fiber based plasmonic index sensor with optimized accuracy and calibration relation in large dynamic range. Opt. Commun. 2011, 284, 4161–4166. [Google Scholar] [CrossRef]
  16. Hassani, A.; Skorobogatiy, M. Design criteria for microstructured-optical fiber based surface plasmon resonance sensors. J. Opt. Soc. Am. B 2007, 24, 1423–1429. [Google Scholar] [CrossRef]
  17. Yu, X.; Zhang, Y.; Pan, S.; Shum, P.; Yan, M.; Leviatan, Y.; Li, C. A selectively coated photonic crystal fiber based surface plasmon resonance sensor. J. Opt. 2010, 12, 015005. [Google Scholar] [CrossRef] [Green Version]
  18. Luan, N.; Wang, R.; Lv, W.; Yao, J. Surface plasmon resonance sensor based on D-shaped microstructured optical fiber with hollow core. Opt. Express 2015, 23, 8576–8582. [Google Scholar] [CrossRef]
  19. Haque, E.; Hossain, M.A.; Ahmed, F.; Namihira, Y. Surface plasmon resonance sensor based on modified D-shaped photonic crystal fiber for wider range of refractive index detection. IEEE Sens. J. 2018, 18, 8287–8293. [Google Scholar] [CrossRef]
  20. Liu, B.H.; Jiang, Y.X.; Zhu, X.S.; Tang, X.L.; Shi, Y.W. Hollow fiber surface plasmon resonance sensor for the detection of liquid with high refractive index. Opt. Express 2013, 21, 32349–32357. [Google Scholar] [CrossRef]
  21. Luan, N.; Yao, J. High refractive index surface plasmon resonance sensor based on a silver wire filled hollow fiber. IEEE Photonics J. 2016, 8, 1–9. [Google Scholar] [CrossRef]
  22. Luan, N.; Zhao, L.; Lian, Y.; Lou, S. A high refractive index plasmonic sensor Based on D-shaped photonic crystal fiber with laterally accessible hollow-core. IEEE Photonics J. 2018, 10, 1–7. [Google Scholar] [CrossRef]
  23. Zhao, L.; Han, H.; Luan, N.; Liu, J.; Song, L.; Hu, Y. A temperature plasmonic sensor based on a side opening hollow fiber filled with high refractive index sensing medium. Sensors 2019, 19, 3730. [Google Scholar] [CrossRef] [PubMed] [Green Version]
  24. Shuai, B.; Xia, L.; Zhang, Y.; Liu, D. A multi-core holey fiber based plasmonic sensor with large detection range and high linearity. Opt. Express 2012, 20, 5974–5986. [Google Scholar] [CrossRef] [PubMed]
  25. Van Brakel, A.; Grivas, C.; Petrovich, M.N.; Richardson, D.J. Micro-channels machined in microstructured optical fibers by femtosecond laser. Opt. Express 2007, 15, 8731–8736. [Google Scholar] [CrossRef] [PubMed]
  26. Wang, F.; Yuan, W.; Hansen, O.; Bang, O. Selective filling of photonic crystal fibers using focused ion beam milled microchannel. Opt. Express 2011, 19, 17585–17590. [Google Scholar] [CrossRef] [Green Version]
  27. Martelli, C.; Olivero, P.; Canning, J.; Groothoff, N.; Gibson, B.; Huntington, S. Micromachining structured optical fibers using focused ion beam milling. Opt. Lett. 2007, 32, 1575–1577. [Google Scholar] [CrossRef] [Green Version]
  28. Frazão, O.; Martynkien, T.; Baptista, J.; Santos, J.; Urbanczyk, W.; Wojcik, J. Optical refractometer based on a birefringent Bragg grating written in an H-shaped fiber. Opt. Lett. 2009, 34, 76–78. [Google Scholar] [CrossRef]
  29. Erdmanis, M.; Viegas, D.; Hautakorpi, M.; Novotny, S.; Santos, J.L.; Ludvigsen, H. Comprehensive numerical analysis of a surface-plasmon-resonance sensor based on an H-shaped optical fiber. Opt. Express 2011, 19, 13980–13988. [Google Scholar] [CrossRef]
  30. Vial, A.; Grimault, A.S.; Macías, D.; Barchiesi, D.; de la Chapelle, M. Improved analytical fit of gold dispersion: Application to the modeling of extinction spectra with a finite-difference time-domain method. Phys. Rev. B 2005, 71, 085416. [Google Scholar] [CrossRef]
  31. Liu, C.; Yang, L.; Su, W.; Wang, F.; Sun, T.; Liu, Q.; Mu, H.; Chu, P.K. Numerical analysis of a photonic crystal fiber based on a surface plasmon resonance sensor with an annular analyte channel. Opt. Commun. 2017, 382, 162–166. [Google Scholar] [CrossRef]
  32. Zhang, X.; Wang, R.; Cox, F.; Kuhlmey, B.; Large, M. Selective coating of holes in microstructured optical fiber and its application to in-fiber absorptive polarizers. Opt. Express 2007, 15, 16270–16278. [Google Scholar] [CrossRef] [PubMed]
  33. Luan, N.; Wang, R.; Lv, W.; Yao, J. Surface plasmon resonance sensor based on exposed-core microstructured optical fibres. Electron. Lett. 2015, 51, 714–715. [Google Scholar] [CrossRef]
  34. Luan, N.; Han, H.; Zhao, L.; Liu, J.; Yao, J. Opening up dual-core microstructured optical fiber-based plasmonic sensor with large detection range and linear sensitivity. Opt. Mater. Express 2019, 9, 819–825. [Google Scholar] [CrossRef]
  35. Samoc, A. Dispersion of refractive properties of solvents: Chloroform, toluene, benzene, and carbon disulfide in ultraviolet, visible, and near-infrared. J. Appl. Phys. 2003, 94, 6167–6174. [Google Scholar] [CrossRef]
Figure 1. (a) Schematic diagram of the proposed H-shaped photonic crystal fiber-based surface plasmon resonance (PCF-SPR) sensor; (b) cross-section of the SPR sensor; (c) experimental setup of the SPR sensor for refractive index (RI) detection.
Sensors 20 01009 g001
Figure 2. (a) Re (neff) curves of the y-polarized core mode (black solid curve) and y-polarized surface plasmon polariton (SPP) mode at na = 1.43, 1.45, and 1.47 (red solid, red dashed and red dotted curves); (b) loss spectra of the y-polarized core mode at na = 1.43, 1.45, and 1.47; (c) y-polarized electric field distributions of core mode and SPP mode at specific wavelengths (A for core mode at 800 nm with na = 1.43, B for SPP mode at 992 nm with na = 1.43, C for core mode at 1006 nm with na = 1.43, D for core mode at 1367 nm with na = 1.45 and E for core mode at 1791 nm with na = 1.47), arrows indicate polarized direction of electric fields.
Sensors 20 01009 g002
Figure 3. (a) Loss spectra of the SPR sensor at na = 1.43 when the thickness of gold film (m1 = m2) is 30 nm,40 nm, and 50 nm; (b) peak wavelengths, (c) peak loss and (d) sensitivities of the SPR sensor at various na when the thickness of gold film (m1 = m2) is 30 nm, 40 nm, and 50 nm.
Sensors 20 01009 g003
Figure 4. Loss spectra of y-polarized core mode at na = 1.47 when m1 is fixed at 40 nm and m2 changes in the range of ±10%.
Sensors 20 01009 g004
Table 1. Summary of peak wavelengths, peak losses and sensitivities of y-polarized core mode at the na range of 1.33–1.49, when m1 is fixed at 40 nm and m2 changes in the range of ±10%.
Peak Wavelength(μm)Peak Loss (dB/cm)Sensitivities (μm/RIU)
m2−10%−5%40nm5%10%−10%−5%40nm5%10%−10%−5%40nm5%10%
na
1.330.5780.5810.5830.5850.58614.85114.81914.33713.56512.6751.41.21.21.21.2
1.340.5920.5930.5950.5970.59818.08618.12817.51916.49515.2981.21.41.51.51.5
1.350.6040.6070.6100.6120.61322.08222.27821.50920.12618.5341.61.81.71.71.7
1.360.620.6250.6270.6290.63027.02627.41626.46126.29822.4922.12.12.22.12.2
1.370.6410.6460.6490.650.65233.13233.74032.52532.20427.3052.52.62.62.72.6
1.380.6660.6720.6750.6770.67840.56241.37439.81936.64633.0593.33.33.33.43.4
1.390.6990.7050.7080.7110.71249.64750.44048.40444.36344.0664.14.24.34.24.2
1.400.7400.7470.7510.7530.75460.51661.04358.13353.30348.0085.65.45.35.65.6
1.410.7960.8010.8040.8090.81072.82072.82668.80363.32857.3837.97.37.77.47.3
1.420.8750.8740.8810.8830.88388.03783.01184.08873.57668.88110.410.612.512.312.4
1.430.9790.9801.0061.0061.007159.5590.62882.59886.32686.31215.116.816.917.117.0
1.441.1301.1481.1751.1771.177133.42152.0689.12141.24110.8720.320.919.219.819.8
1.451.3331.3571.3671.3751.37561.50475.28078.67384.26855.71523.821.420.319.419.4
1.461.5711.5711.5701.5691.56960.01668.64463.98344.70440.17622.222.222.122.022.1
1.471.7931.7931.7911.7891.790171.65167.58170.16173.26179.6426.226.025.925.925.8
1.482.0552.0532.0502.0482.048242.29253.29263.00254.08244.2123.823.823.923.823.7
1.492.2932.2912.2892.2862.285304.38302.30282.80299.62283.39

