Marine Biodiversity in Inútil Bay (Tierra del Fuego): Patterns of Zooplanktonic and Benthic Assemblages
Abstract
1. Introduction
2. Materials and Methods
2.1. Study Area
2.2. Zooplankton Sampling
2.3. Megabenthic Sampling
2.4. Macrobenthic Sampling
2.5. Statistical Analyses
3. Results
3.1. Zooplankton Assemblages
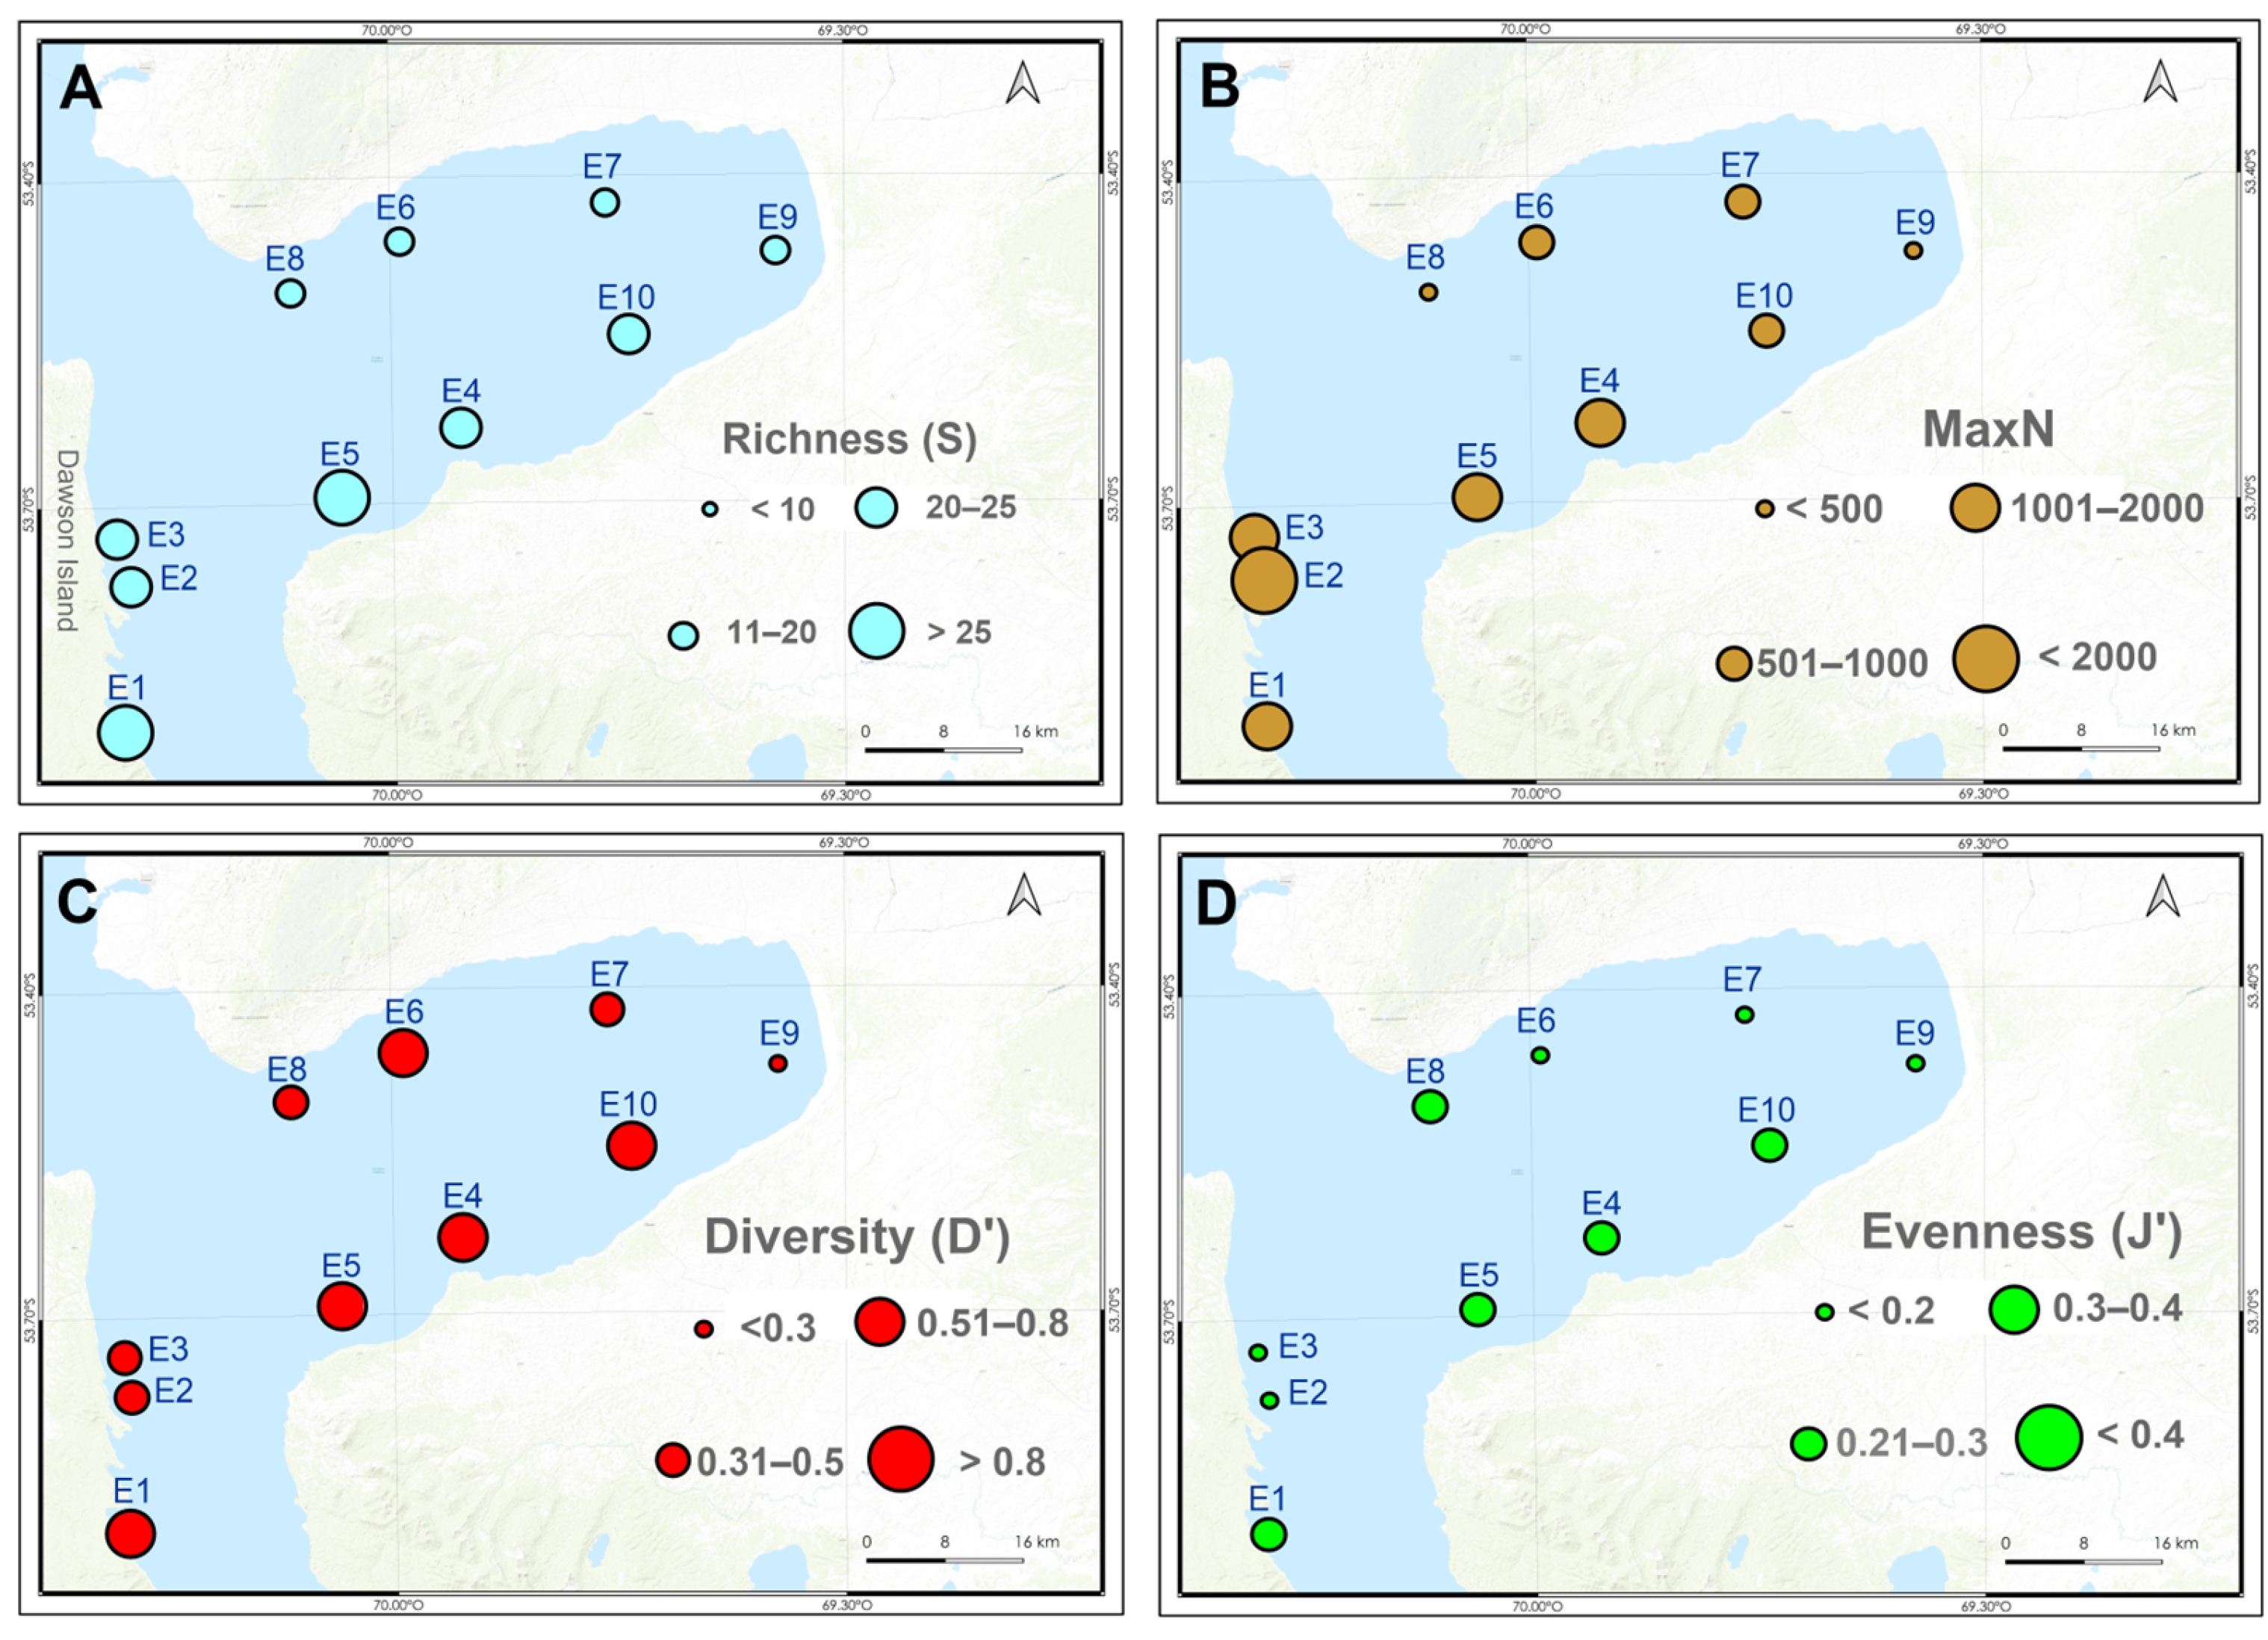
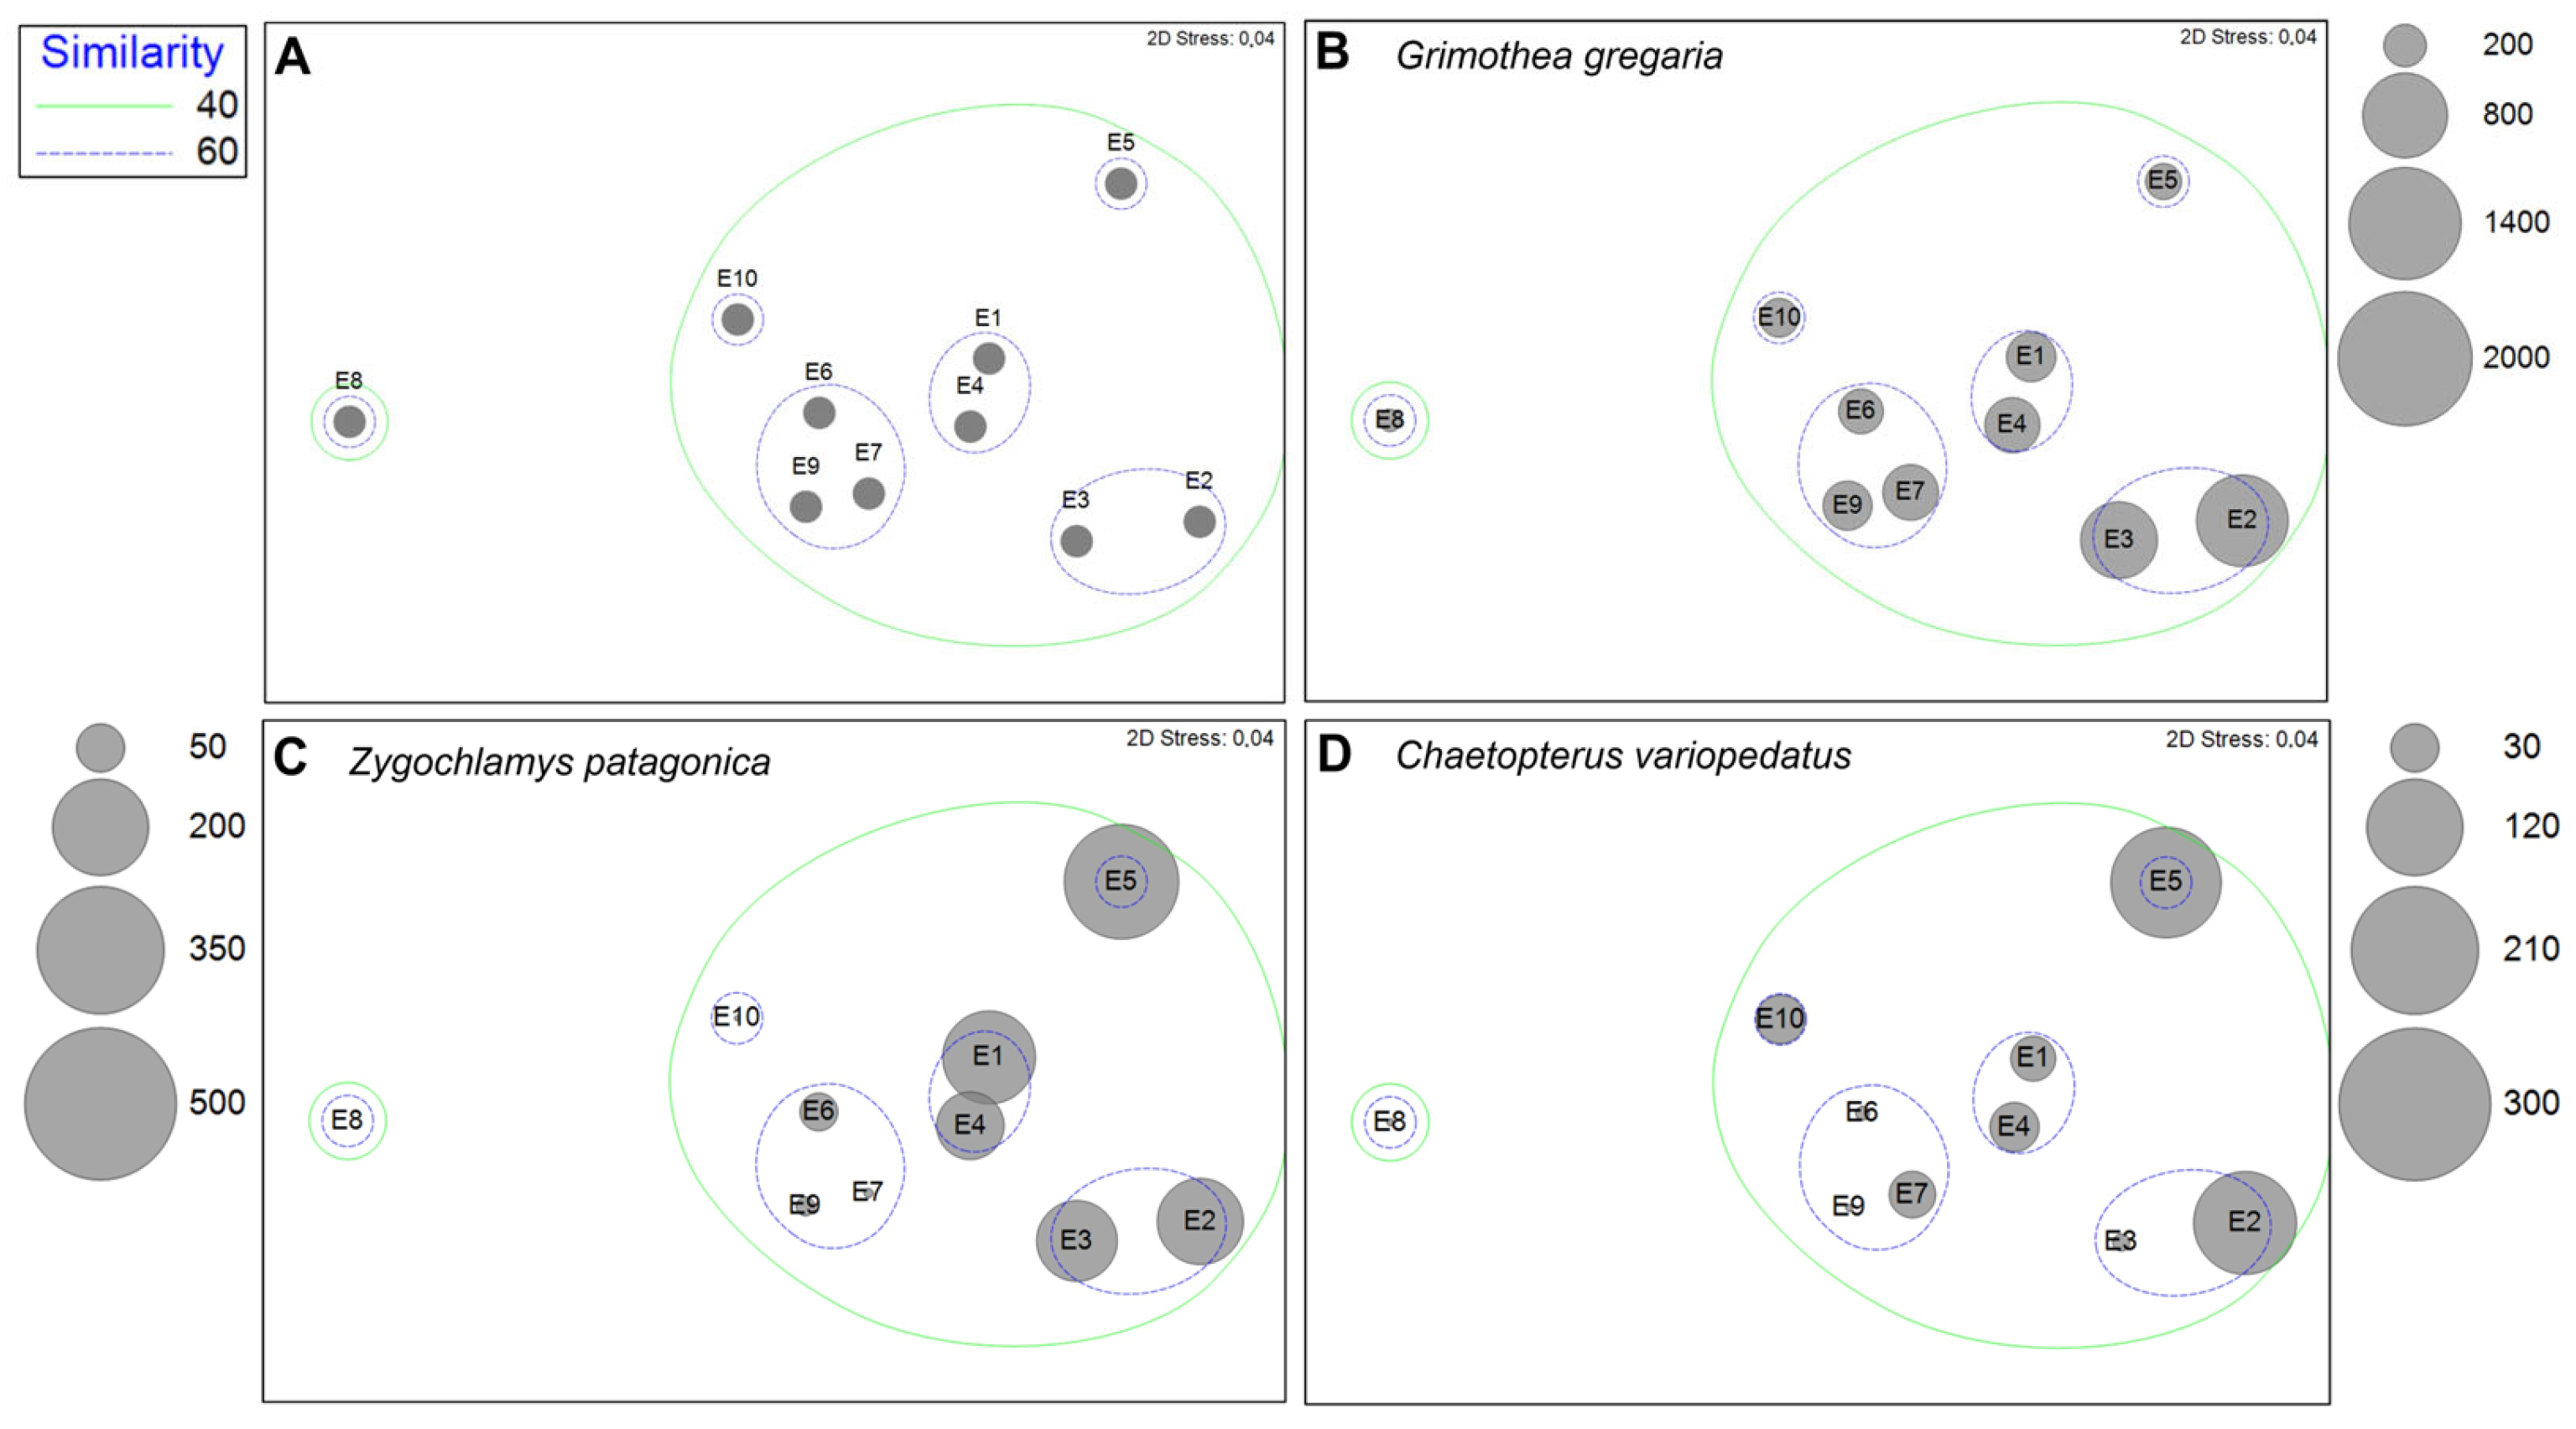
3.2. Megabenthic Assemblages
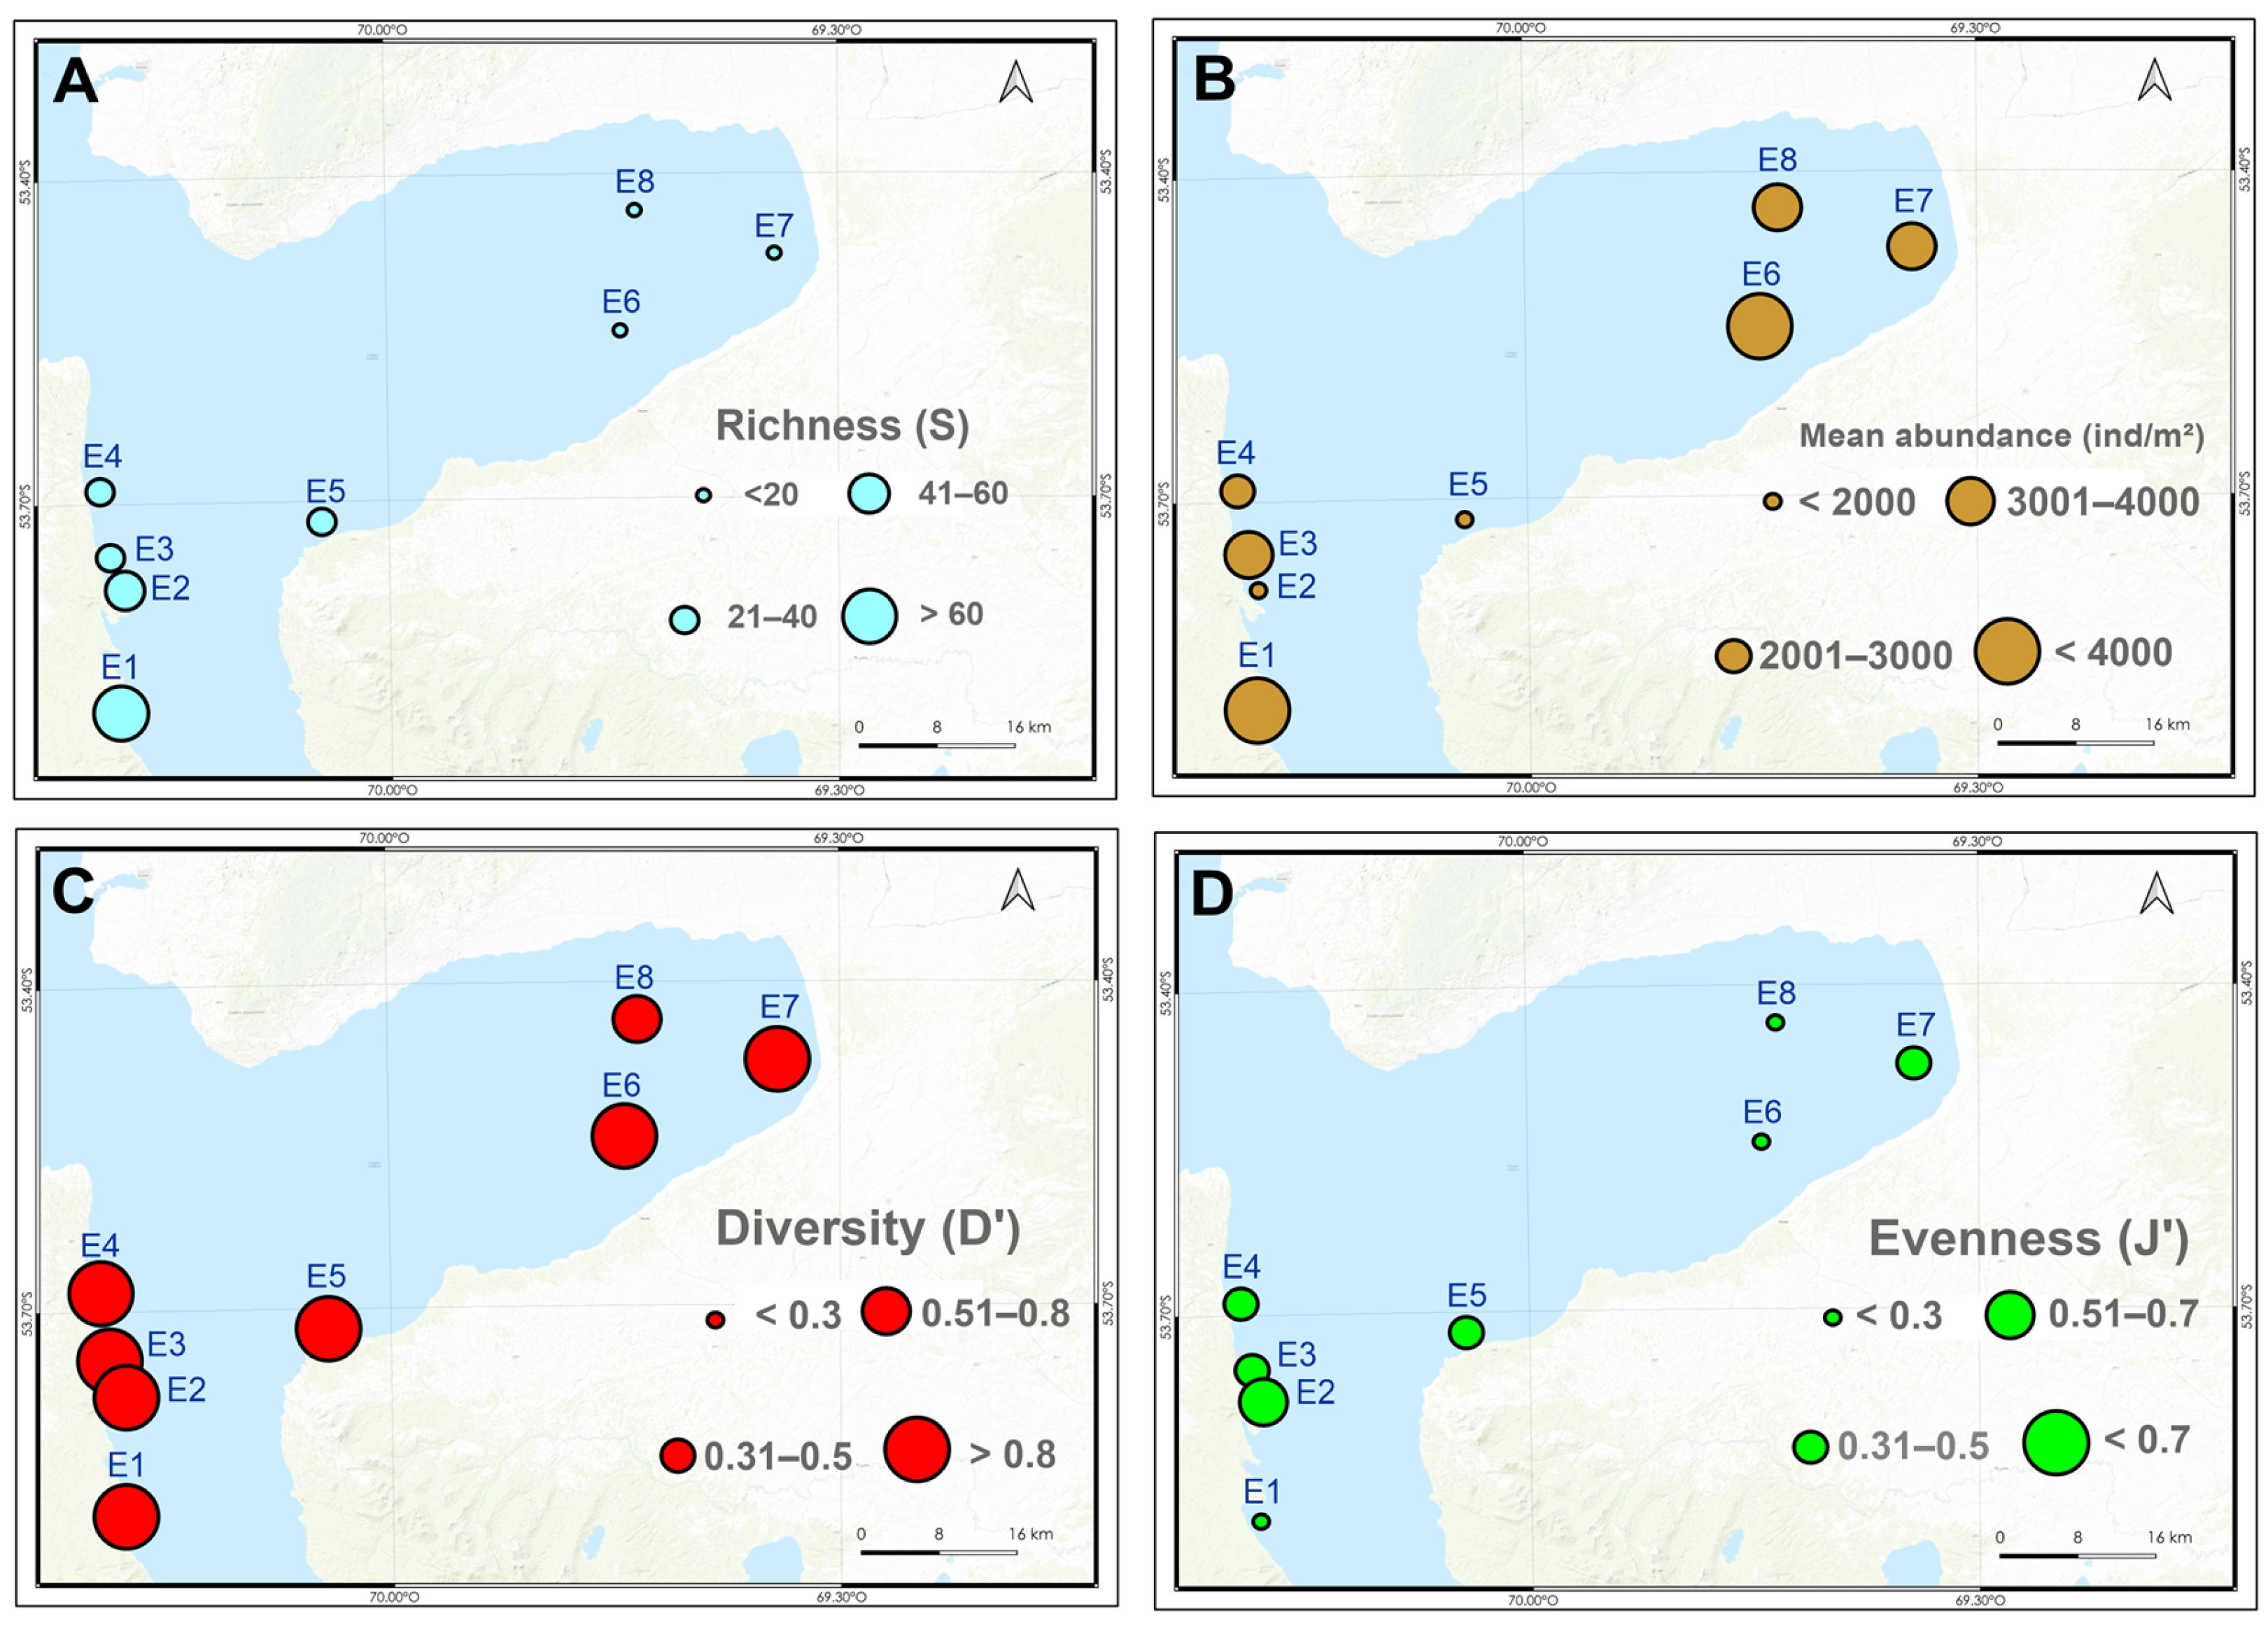
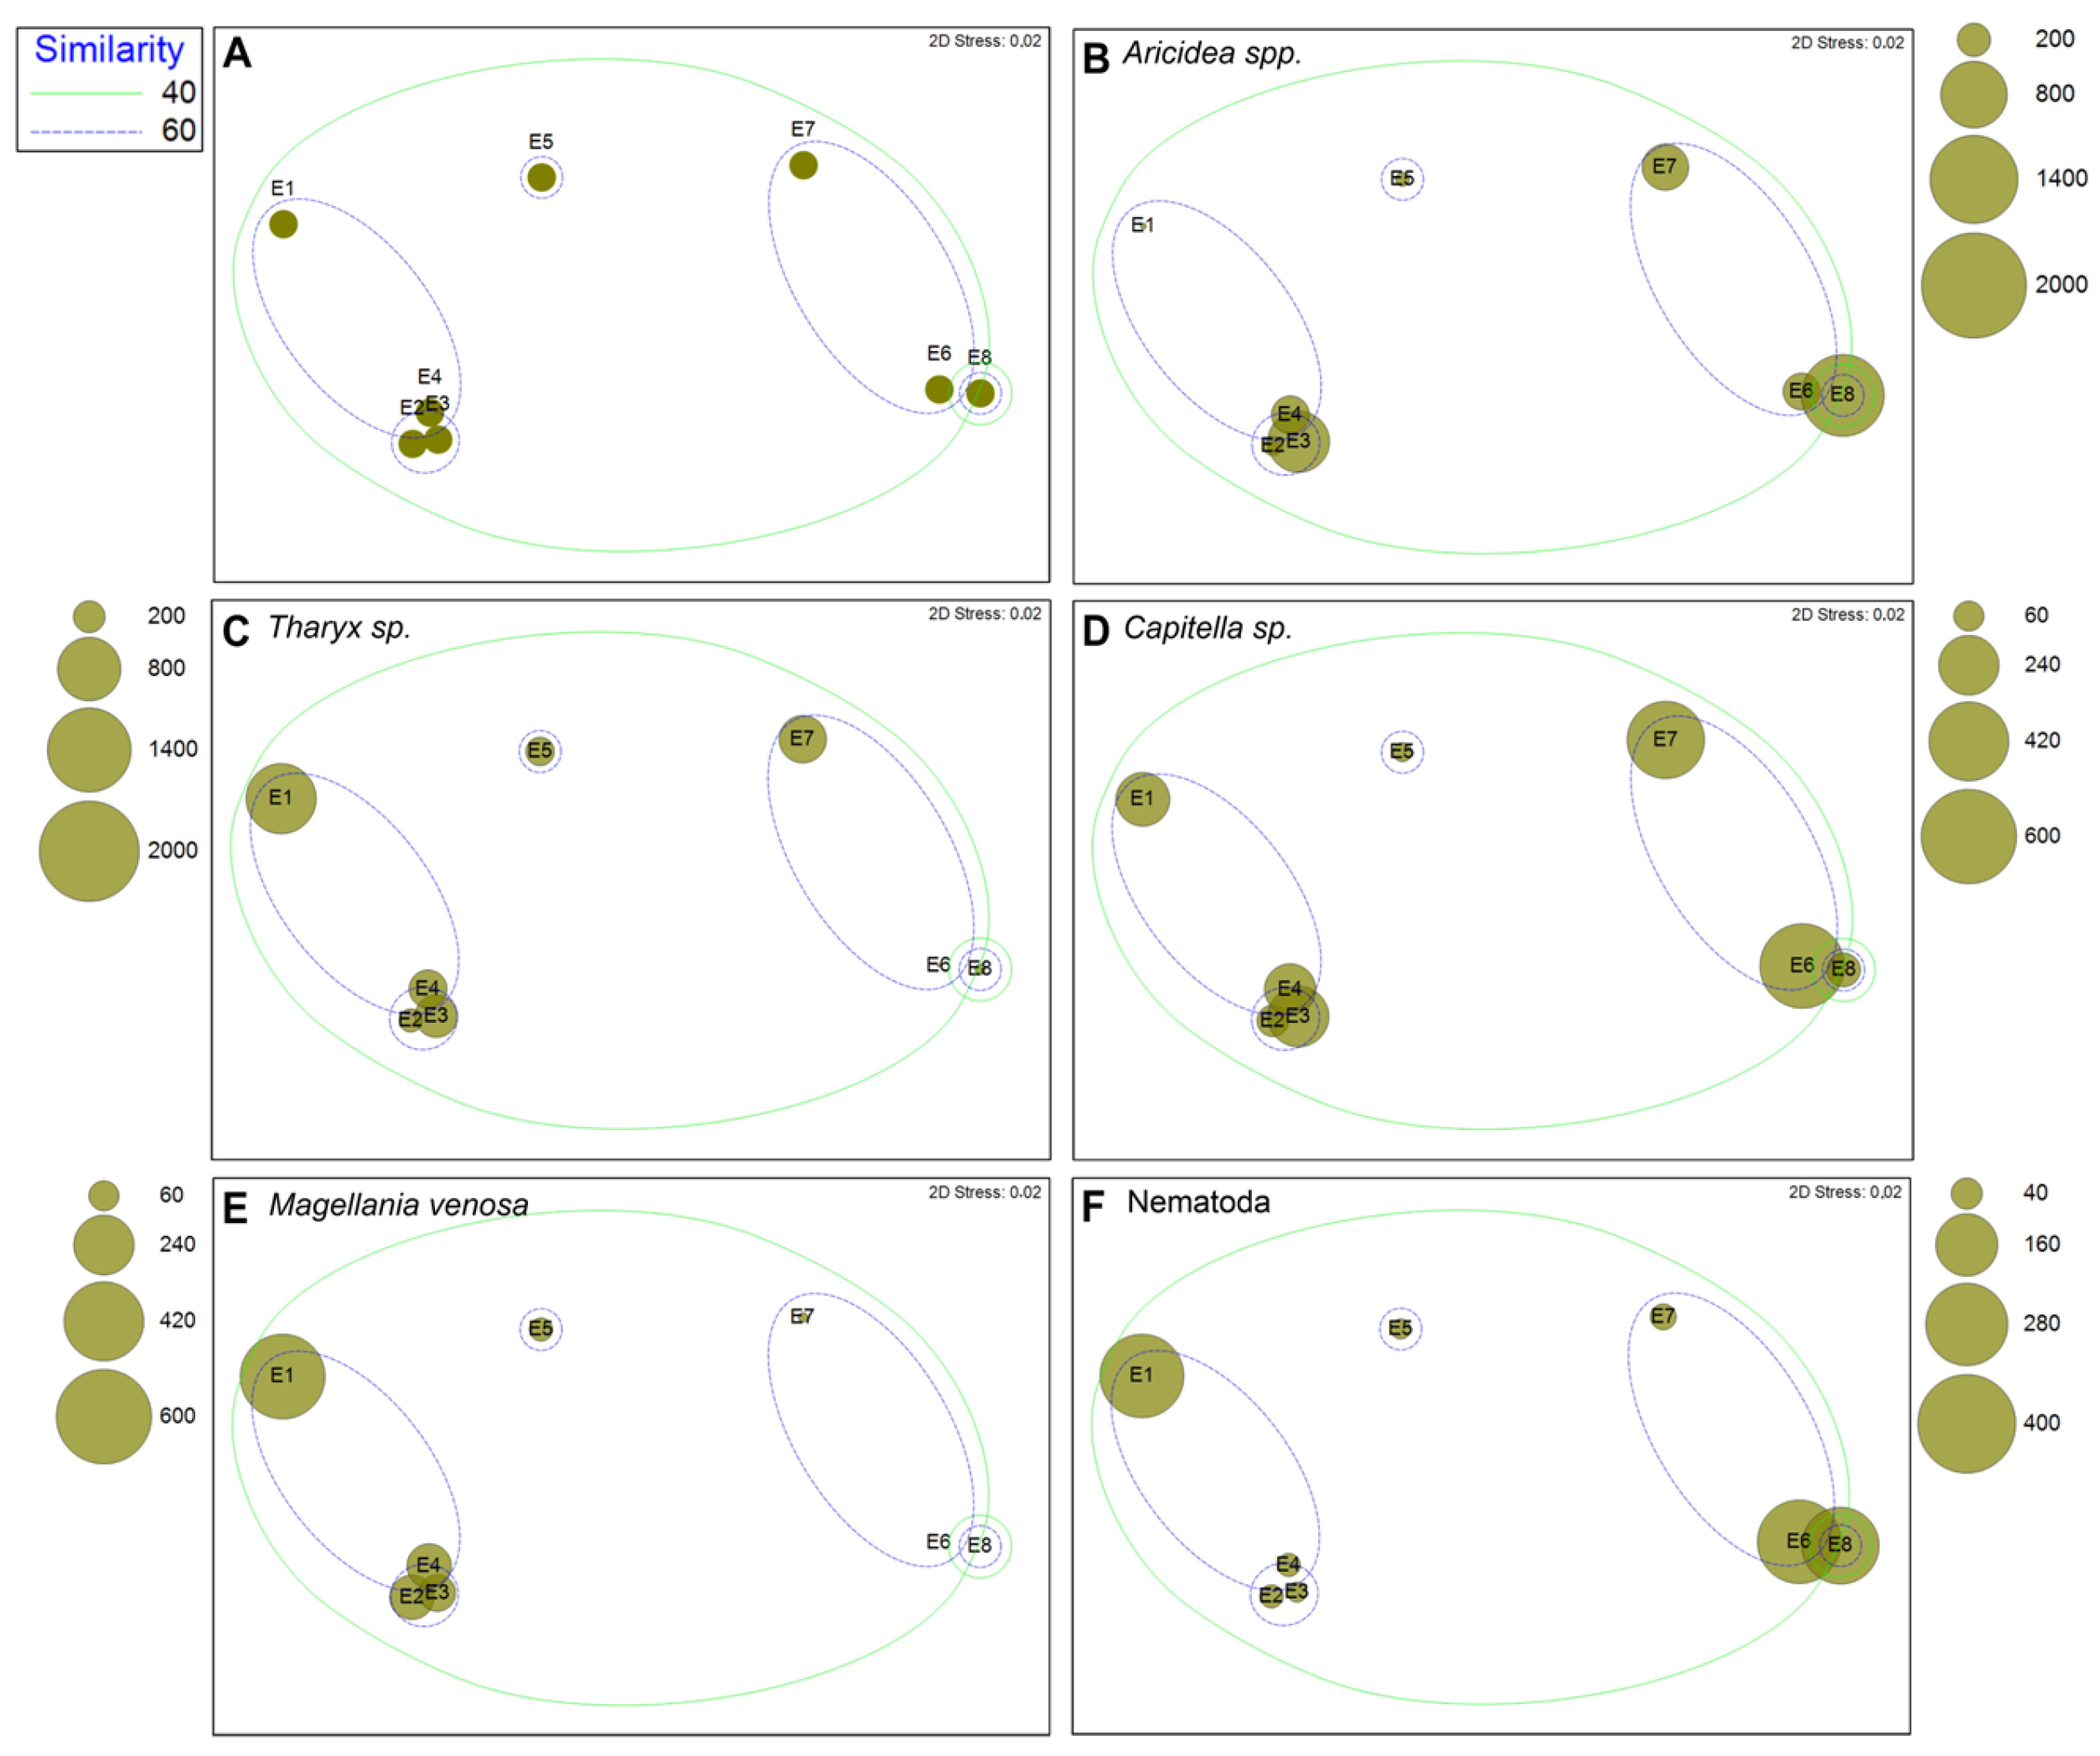
3.3. Macrobenthic Assemblages
4. Discussion
5. Conclusions
Author Contributions
Funding
Institutional Review Board Statement
Data Availability Statement
Acknowledgments
Conflicts of Interest
Appendix A
| Zooplankton | Megabenthos | Macrobenthos | |||
|---|---|---|---|---|---|
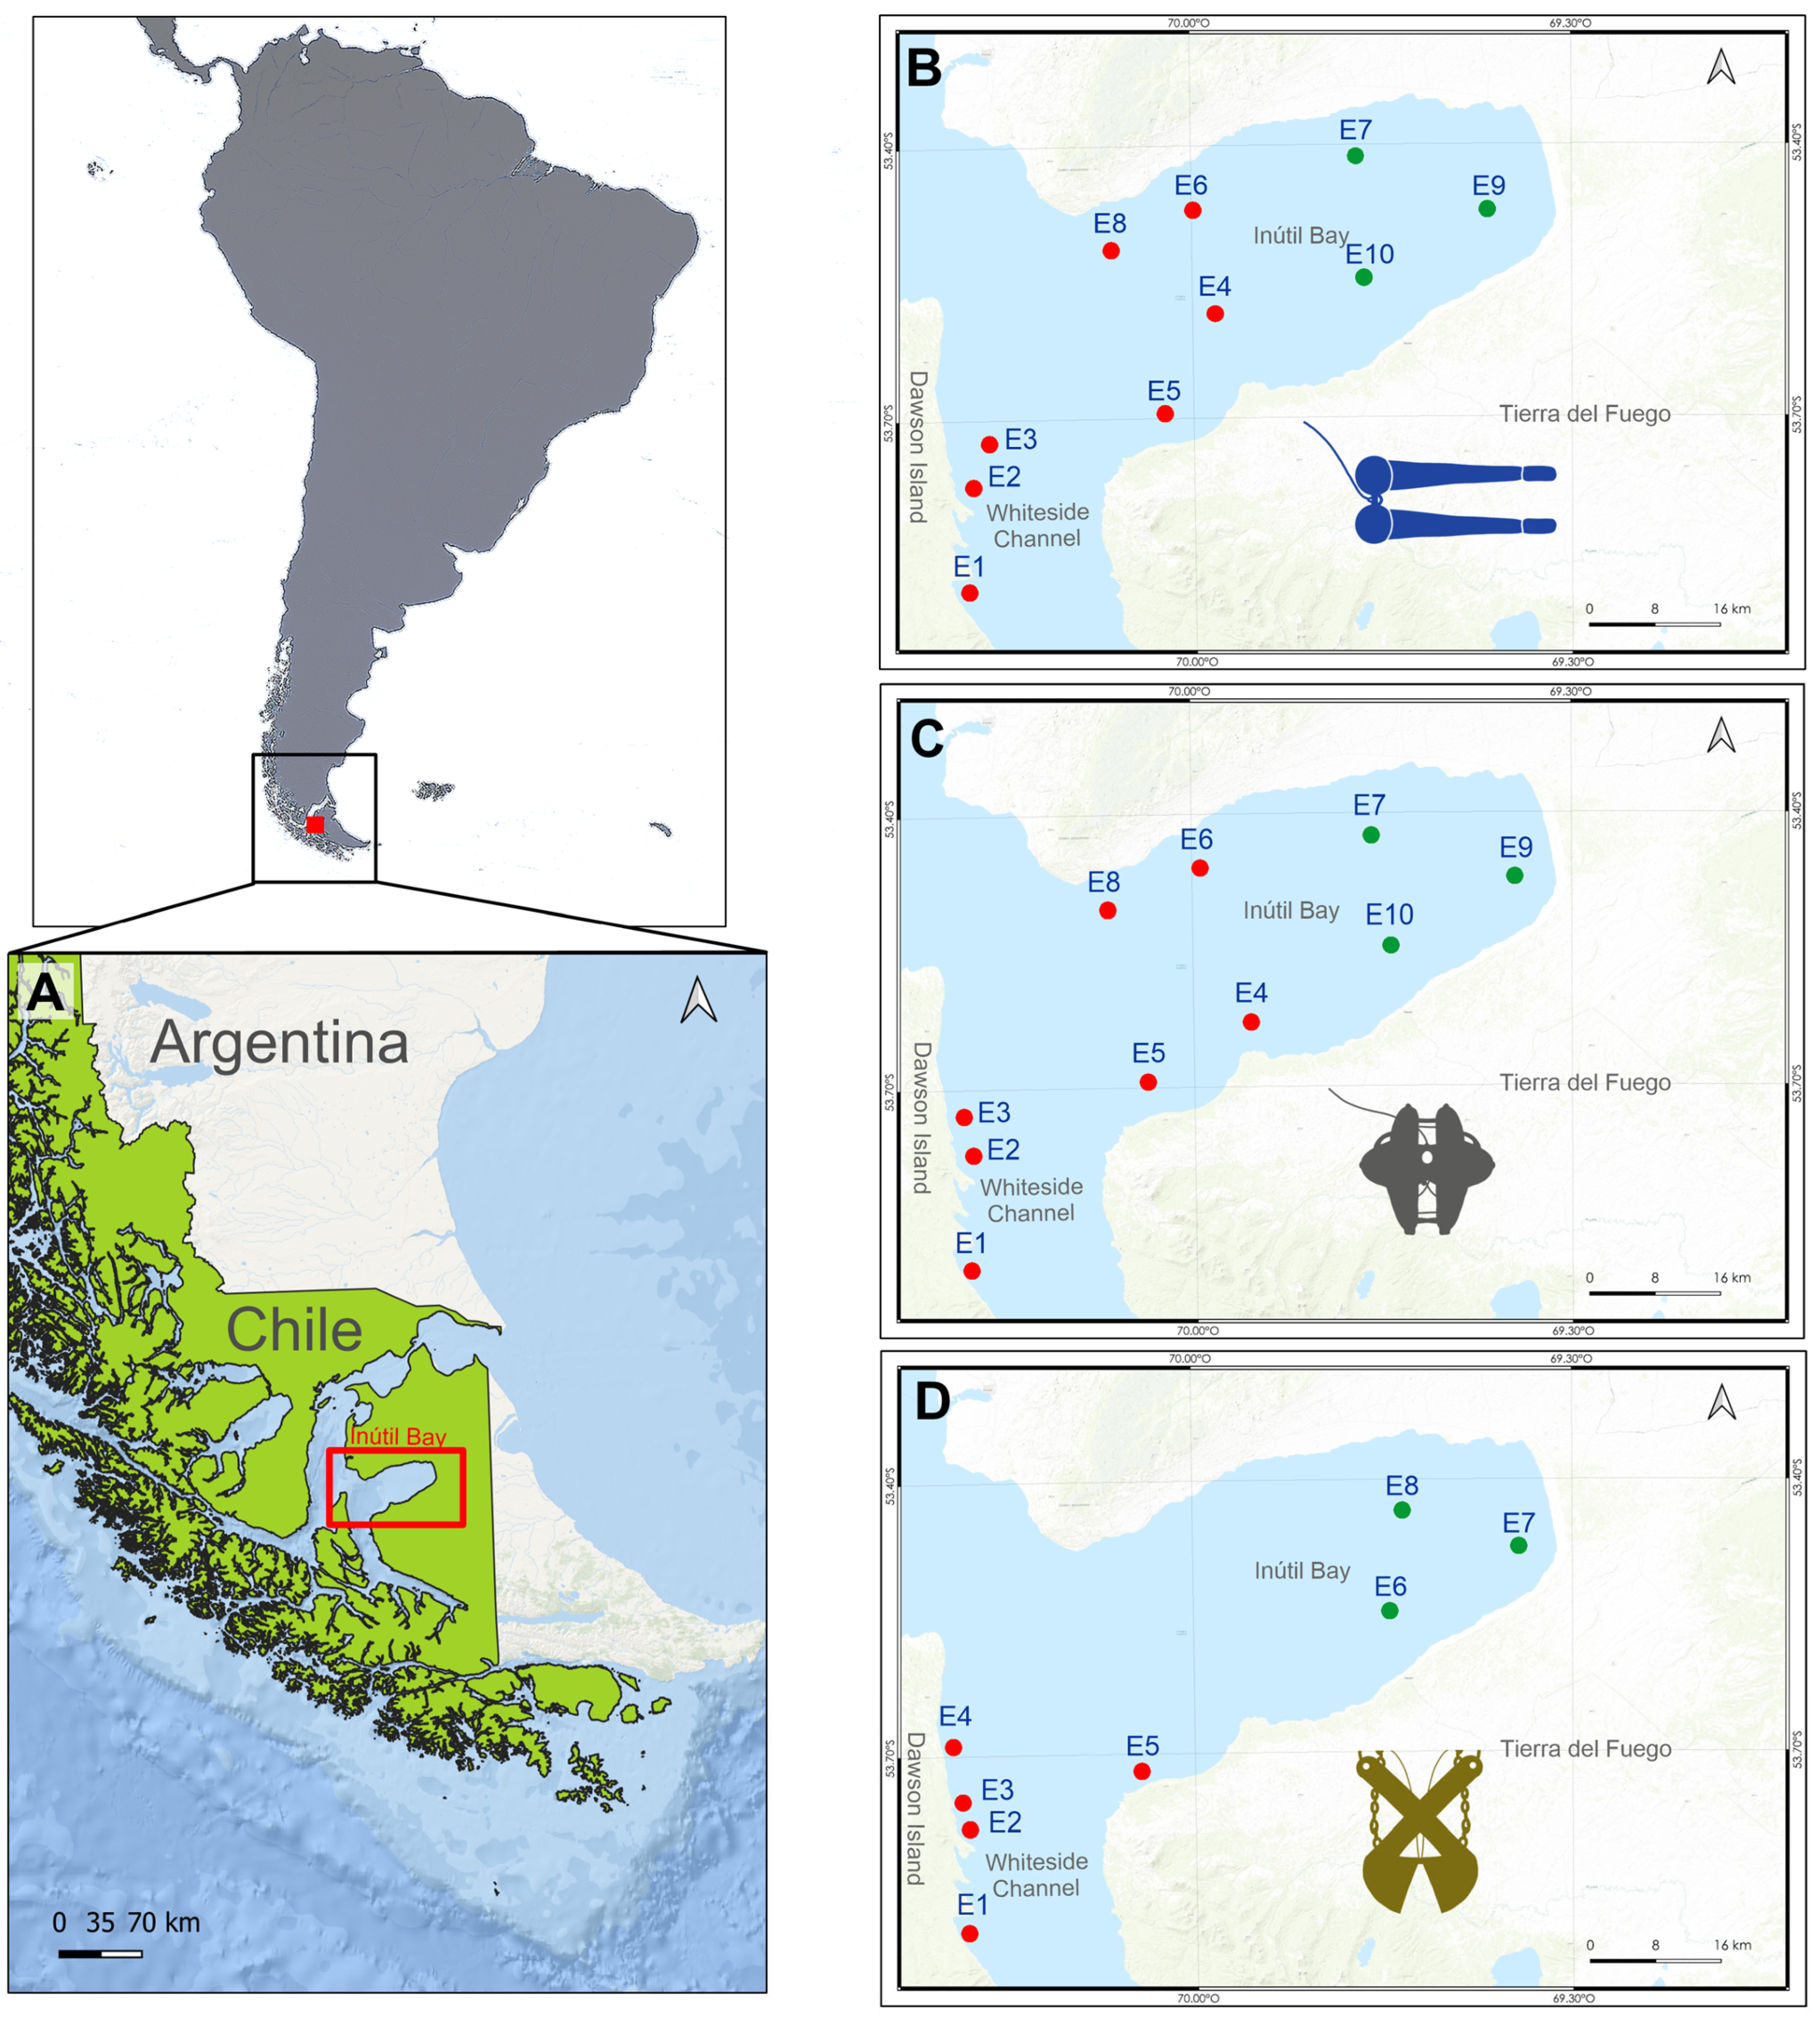
| Station | Depth (m) | Station | Depth (m) | Station | Depth (m) |
| E1 | 100 | E1 | 25–26 | E1 | 28 |
| E2 | 80 | E2 | 29–27 | E2 | 28 |
| E3 | 85 | E3 | 32–33 | E3 | 30 |
| E4 | 15 | E4 | 23–24 | E4 | 34 |
| E5 | 75 | E5 | 26–26 | E5 | 26 |
| E6 | 40 | E6 | 64–65 | E6 | 40 |
| E7 | 25 | E7 | 48–48 | E7 | 27 |
| E8 | 100 | E8 | 151–139 | E8 | 50 |
| E9 | 10 | E9 | 26–26 | ||
| E10 | 15 | E10 | 37–37 | ||
| Holoplankton | |||||||
|---|---|---|---|---|---|---|---|
| Phylum | Class | Order | Taxon | Median | 25Q | 75Q | % |
| Foraminifera | – | – | Foraminifera | 0.013 | 0.007 | 0.019 | 0.099 |
| Cnidaria | Hydrozoa | – | Siphonophora | 0.012 | 0.00375 | 0.333 | 4.739 |
| Cnidaria | Hydrozoa | – | Hydromedusae | 0.007 | 0.007 | 0.007 | 0.028 |
| Arthropoda | Copepoda | Calanoida | Calanus sp. | 0.043 | 0.013 | 0.205 | 1.828 |
| Arthropoda | Copepoda | Calanoida | Paracalanus sp. | 0.280 | 0.087 | 0.282 | 2.476 |
| Arthropoda | Copepoda | Calanoida | Acartia sp. | 0.028 | 0.007 | 0.084 | 1.940 |
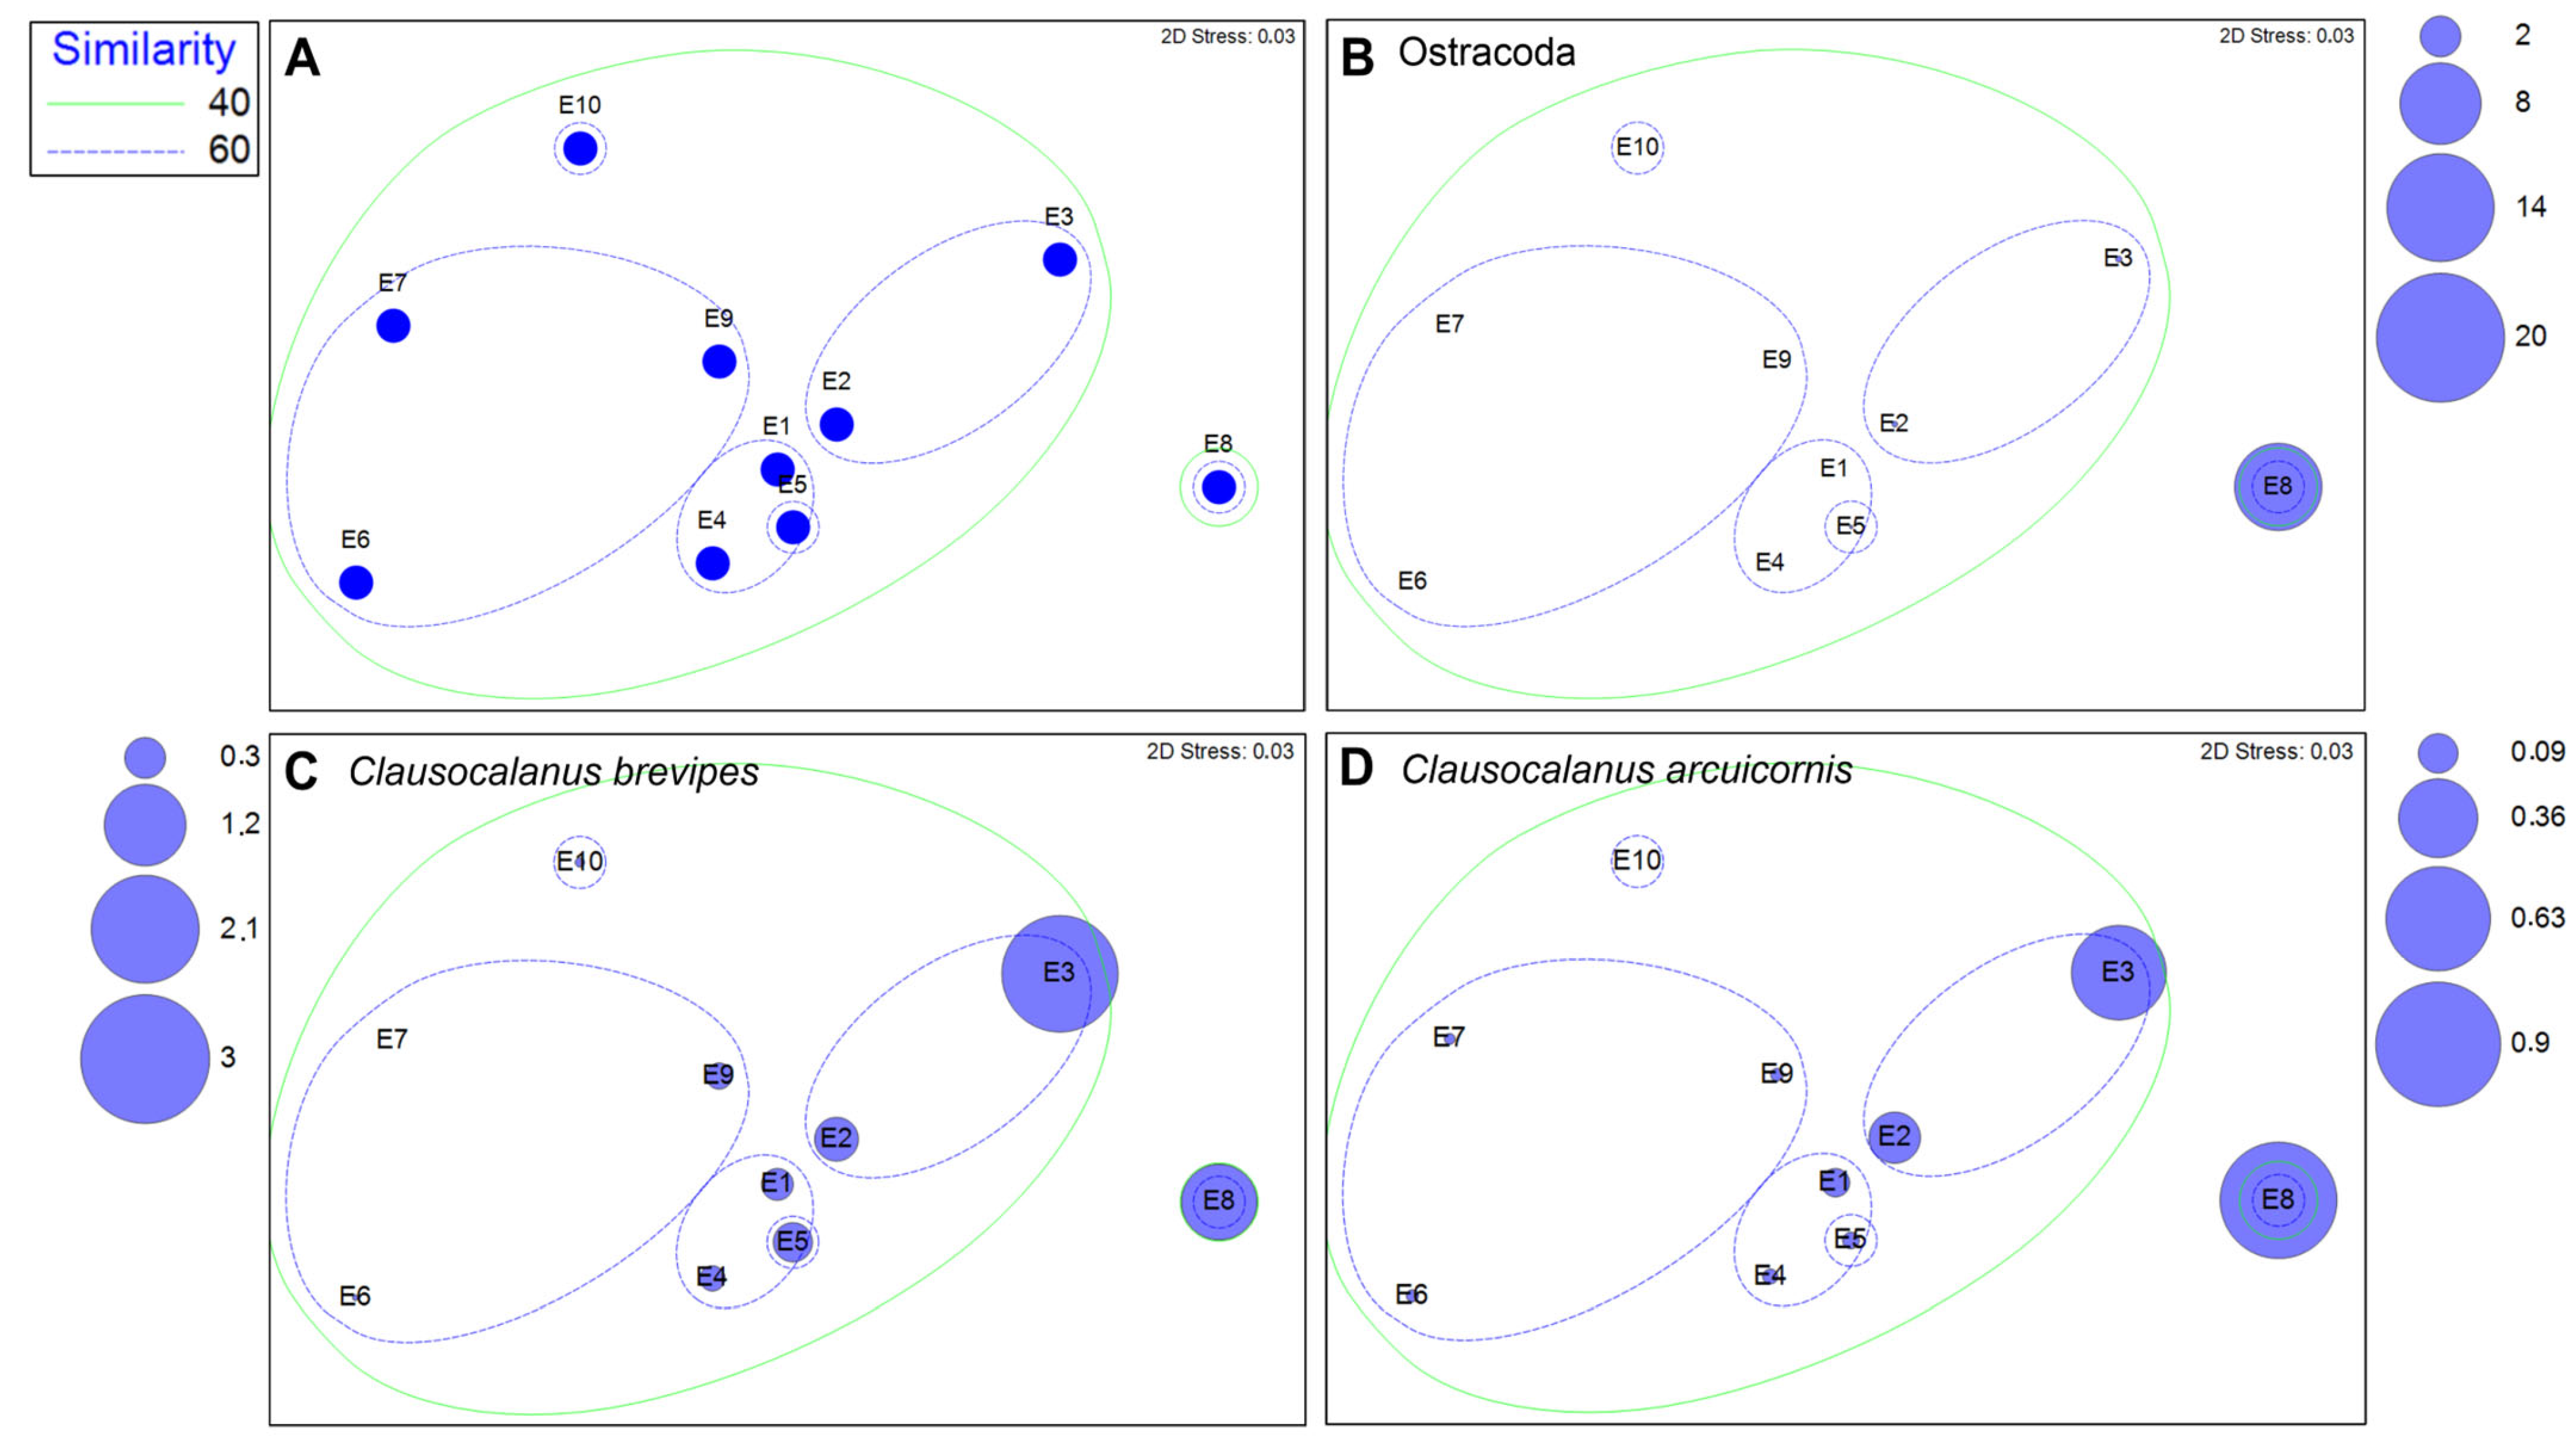
| Arthropoda | Copepoda | Calanoida | Clausocalanus arcuicornis | 0.017 | 0.0095 | 0.352 | 6.236 |
| Arthropoda | Copepoda | Calanoida | Clausocalanus brevipes | 0.220 | 0.078 | 0.828 | 20.800 |
| Arthropoda | Copepoda | Calanoida | Candacia sp. | 0.424 | 0.001 | 0.847 | 3.235 |
| Arthropoda | Copepoda | Calanoida | Centropages sp. | 0.006 | 0.001 | 0.010 | 0.042 |
| Arthropoda | Copepoda | Calanoida | Temora sp. | 0.017 | 0.017 | 0.017 | 0.065 |
| Arthropoda | Copepoda | Calanoida | Subeucalanus sp. | 0.197 | 0.003 | 0.391 | 1.501 |
| Arthropoda | Copepoda | Monstrilloida | Cymbasoma sp. | 0.002 | 0.001 | 0.045 | 0.184 |
| Arthropoda | Copepoda | Monstrilloida | Monstrilla sp. | 0.002 | 0.002 | 0.002 | 0.009 |
| Arthropoda | Copepoda | Harpacticoida | Alteutha sp. | 0.033 | 0.033 | 0.033 | 0.126 |
| Arthropoda | Copepoda | Cyclopoida | Oncaea sp. | 0.003 | 0.003 | 0.003 | 0.013 |
| Arthropoda | Eucarida | – | Furcilia | 0.001 | 0.001 | 0.001 | 0.005 |
| Arthropoda | Peracarida | Isopoda | Isopoda | 0.002 | 0.002 | 0.002 | 0.008 |
| Arthropoda | Peracarida | Amphipoda | Themisto gaudichaudii | 0.022 | 0.012 | 0.039 | 1.048 |
| Arthropoda | Peracarida | Amphipoda | Hyperiidae | 0.001 | 0.001 | 0.001 | 0.005 |
| Arthropoda | Peracarida | Amphipoda | Hyalellidae | 0.001 | 0.001 | 0.001 | 0.005 |
| Arthropoda | Ostracoda | – | Ostracoda | 0.055 | 0.012 | 6.654 | 51.079 |
| Arthropoda | Malacostraca | Decapoda | Grimothea gregaria | 0.007 | 0.004 | 0.020 | 0.120 |
| Chaetognatha | – | – | Chaetognatha | 0.014 | 0.0035 | 0.373 | 2.930 |
| Chordata | – | – | Appendicularia | 0.028 | 0.0075 | 0.068 | 0.804 |
| Meroplankton | |||||||
| Bryozoa | – | – | Cyphonauta larvae | 0.008 | 0.006 | 0.018 | 0.207 |
| Mollusca | Bivalvia | – | Bivalvia larvae | 0.004 | 0.004 | 0.004 | 0.014 |
| Arthropoda | Malacostraca | Decapoda | Mysis larvae | 0.005 | 0.002 | 0.013 | 0.102 |
| Arthropoda | Malacostraca | Decapoda | Zoea Grimothea gregaria | 0.003 | 0.001 | 0.020 | 0.282 |
| Arthropoda | Malacostraca | Decapoda | Zoea Pinnotheridae | 0.004 | 0.001 | 0.010 | 0.058 |
| Arthropoda | Malacostraca | Decapoda | Prezoea I | 0.002 | 0.002 | 0.002 | 0.008 |
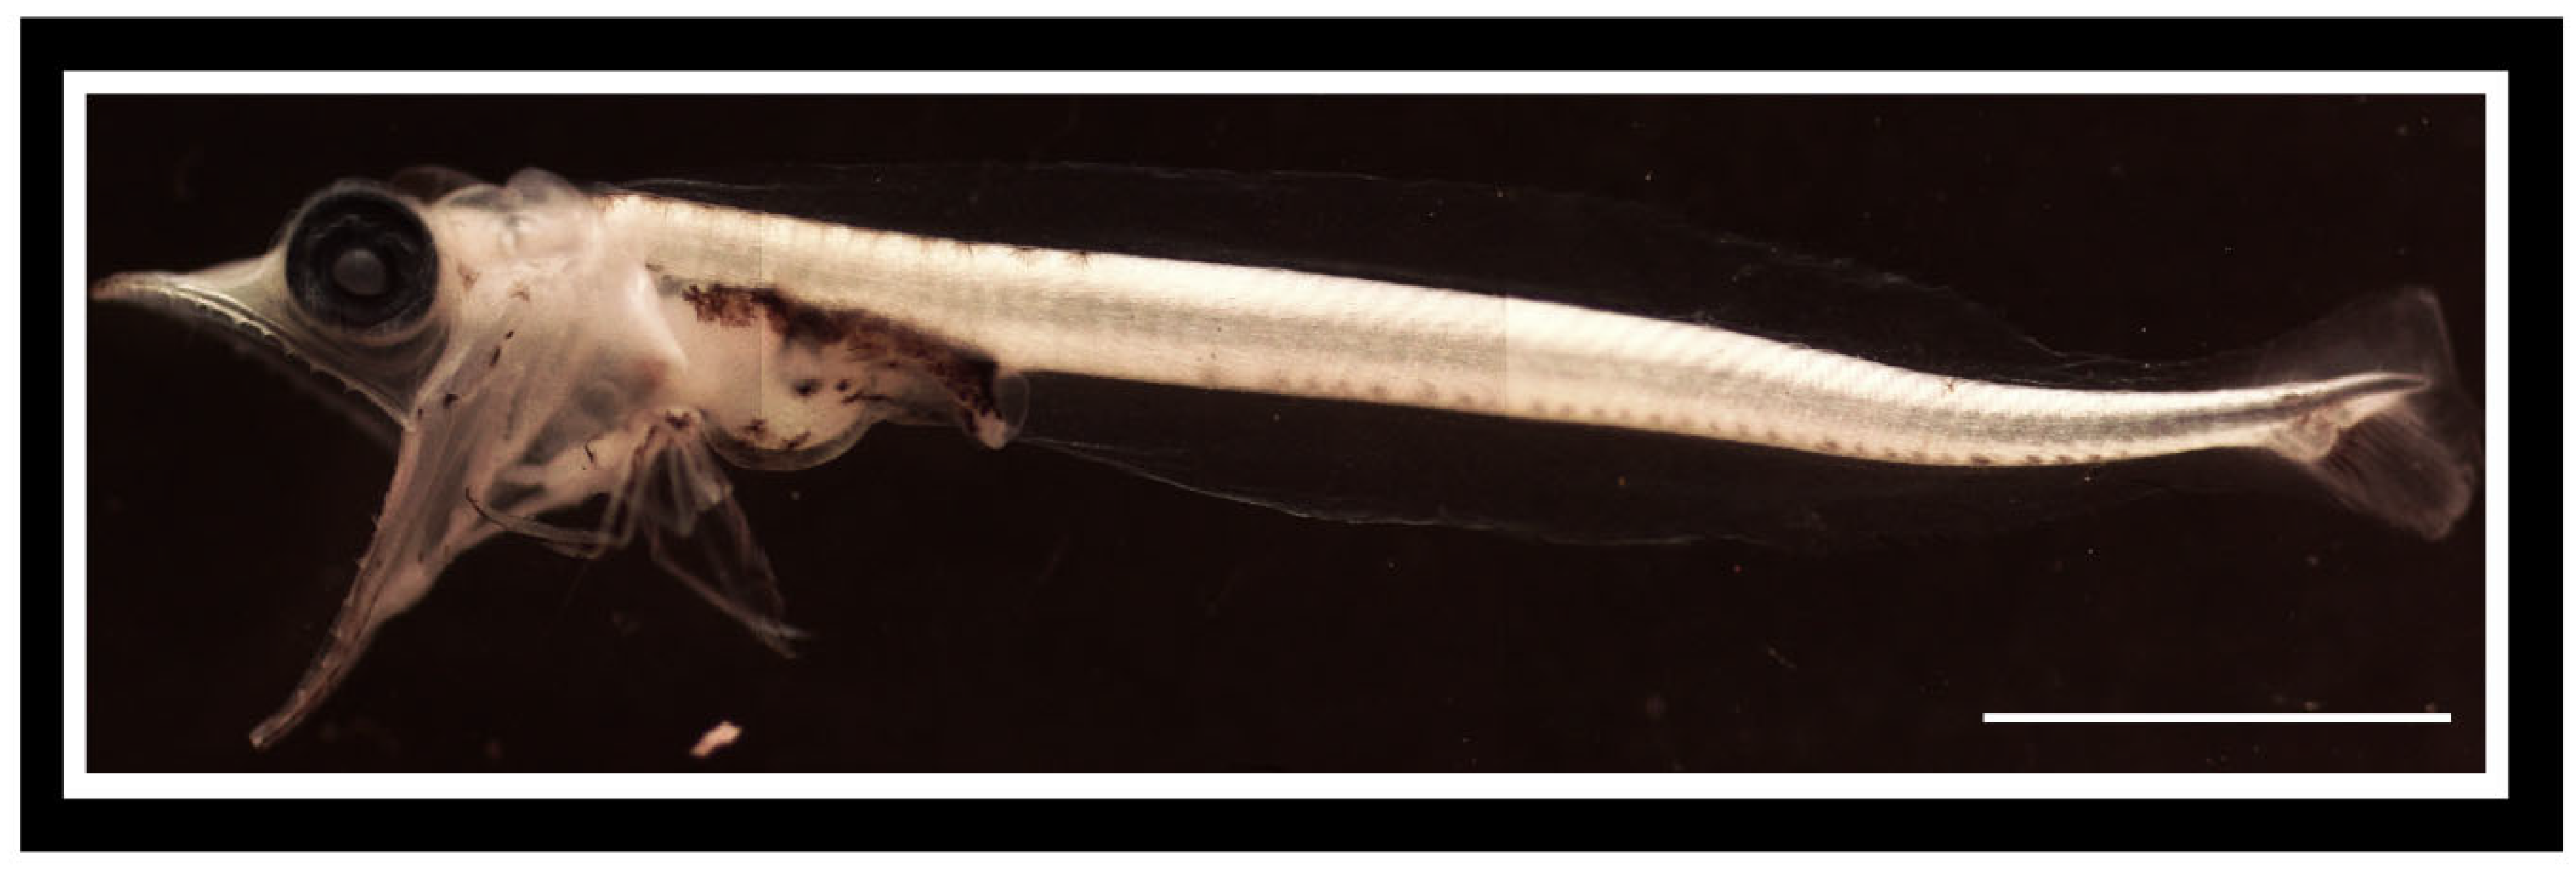
| Chordata | Actinopterygii | – | Champsocephalus esox larvae | 0.001 | 0.001 | 0.001 | 0.004 |
| Phylum | Class | Order | Taxa | Median | 25Q | 75Q | % |
|---|---|---|---|---|---|---|---|
| Porifera | Demospongiae | Poecilosclerida | Amphilectus americanus | 1.0 | 1.0 | 19.0 | 0.226 |
| Porifera | Demospongiae | Hadromerida | Cliona chilensis | 2.0 | 2.0 | 2.0 | 0.022 |
| Porifera | Demospongiae | Poecilosclerida | Mycale magellanica | 1.0 | 1.0 | 1.0 | 0.011 |
| Porifera | Demospongiae | Hadromerida | Polymastia sp. | 1.0 | 1.0 | 1.0 | 0.011 |
| Porifera | Demospongiae | – | Porifera | 28.0 | 5.0 | 56.25 | 6.989 |
| Porifera | Demospongiae | Poecilosclerida | Tedania mucosa | 1.0 | 1.0 | 1.0 | 0.011 |
| Porifera | Demospongiae | Hadromerida | Tethya papillosa | 1.0 | 1.0 | 1.0 | 0.011 |
| Cnidaria | Anthozoa | Actiniaria | Actiniaria | 3.5 | 3.0 | 4.0 | 0.075 |
| Cnidaria | Anthozoa | Actiniaria | Actinostola sp. | 2.0 | 1.0 | 35.0 | 0.409 |
| Cnidaria | Anthozoa | Alcyonacea | Alcyonium sp. | 3.0 | 2.0 | 5.0 | 0.108 |
| Cnidaria | Anthozoa | Scleractinia | Desmophyllum dianthus | 1.0 | 1.0 | 1.0 | 0.011 |
| Cnidaria | Anthozoa | Scleractinia | Hexacorallia | 1.0 | 1.0 | 3.0 | 0.441 |
| Cnidaria | Hydrozoa | Anthoathecata | Hydrozoa | 11.0 | 6.0 | 32.0 | 2.129 |
| Annelida | Polychaeta | Sabellida | Apomatus sp. | 1.0 | 1.0 | 6.0 | 0.086 |
| Annelida | Polychaeta | Terebellida | Chaetopterus variopedatus | 42.5 | 3.25 | 90.25 | 7.044 |
| Annelida | Polychaeta | – | Polychaeta | 2.0 | 1.0 | 13.0 | 0.527 |
| Mollusca | Gastropoda | Neogastropoda | Adelomelon ancilla | 1.0 | 1.0 | 1.0 | 0.011 |
| Mollusca | Bivalvia | Venerida | Ameghinomya antiqua | 2.0 | 1.0 | 25.0 | 0.581 |
| Mollusca | Bivalvia | Venerida | Bivalvia | 4.0 | 3.0 | 5.0 | 0.086 |
| Mollusca | Gastropoda | Trochida | Calliostoma consimilis | 1.0 | 1.0 | 1.0 | 0.011 |
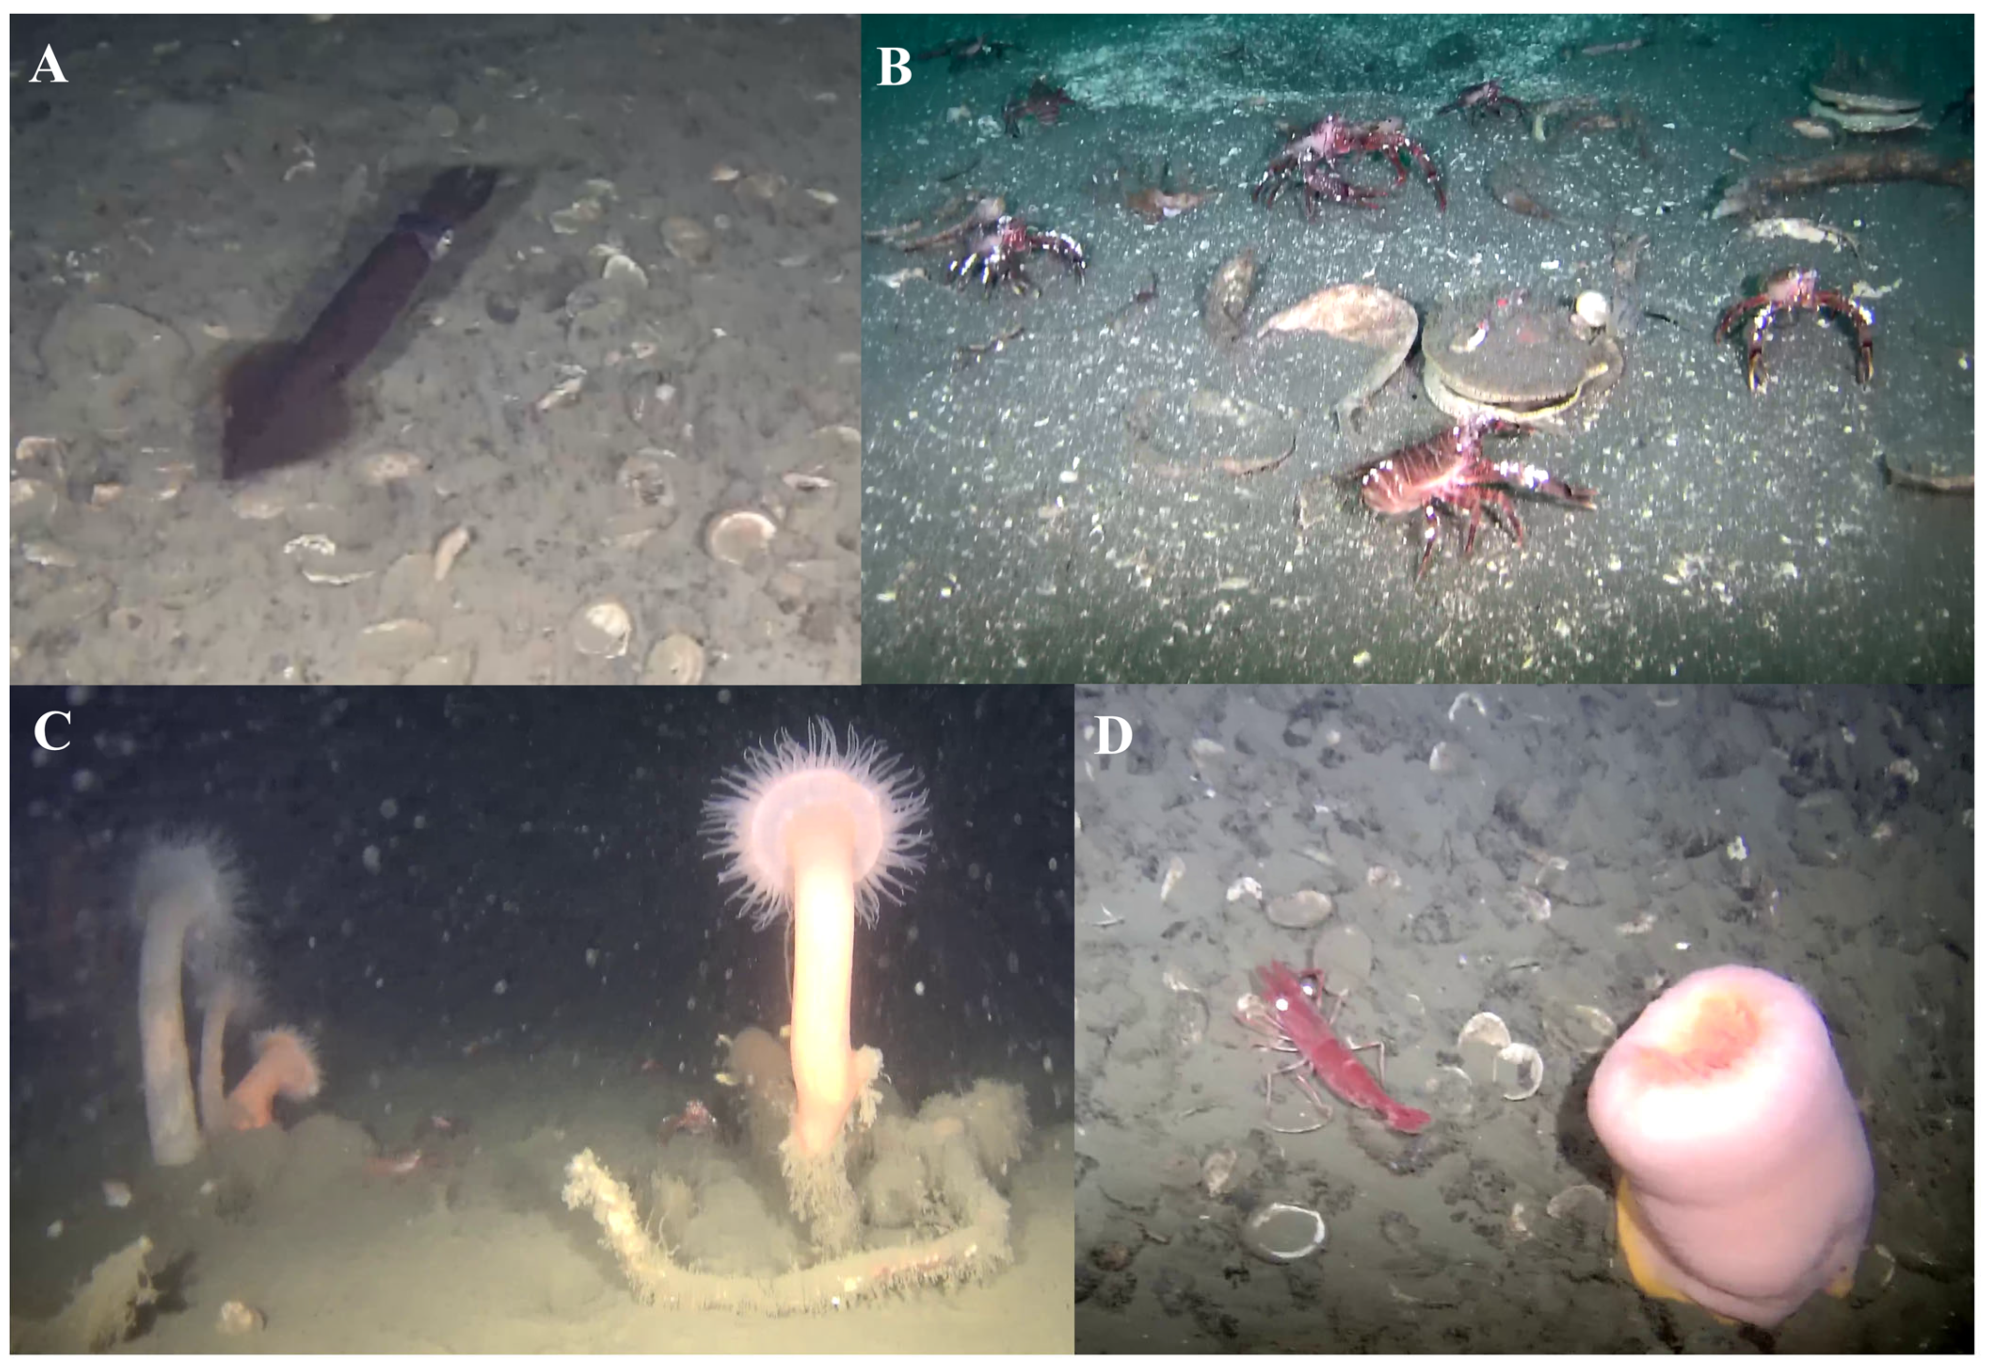
| Mollusca | Cephalopoda | Teuthida | Cephalopoda | 1.0 | 1.0 | 1.0 | 0.011 |
| Mollusca | Cephalopoda | Teuthida | Doryteuthis gahi | 1.0 | 1.0 | 1.0 | 0.011 |
| Mollusca | Gastropoda | Lepetellida | Fissurella sp. | 2.0 | 2.0 | 2.0 | 0.022 |
| Mollusca | Gastropoda | – | Gastropoda | 2.0 | 1.0 | 3.0 | 0.065 |
| Mollusca | Gastropoda | Heterobranchia | Heterobranchia | 1.0 | 1.0 | 1.0 | 0.022 |
| Mollusca | Bivalvia | Mytilida | Mytilus sp. | 1.0 | 1.0 | 3.0 | 0.054 |
| Mollusca | Bivalvia | Pectinida | Zygochlamys patagonica | 165.0 | 8.0 | 289.5 | 16.357 |
| Bryozoa | Gymnolaemata | Cheilostomatida | Aspidostoma giganteum | 2.0 | 2.0 | 2.0 | 0.022 |
| Bryozoa | Gymnolaemata | Cheilostomatida | Bryozoa sp. | 3.5 | 1.5 | 4.0 | 0.344 |
| Bryozoa | Gymnolaemata | Cheilostomatida | Carbasea ovoidea | 7.0 | 3.75 | 17.75 | 0.699 |
| Bryozoa | Gymnolaemata | Cheilostomatida | Cellaria sp. | 1.5 | 1.0 | 2.75 | 0.075 |
| Arthropoda | Malacostraca | Sessilia | Austromegabalanus psittacus | 21.0 | 21.0 | 21.0 | 0.226 |
| Arthropoda | Malacostraca | Caridea | Caridea | 3.0 | 1.5 | 14.0 | 0.366 |
| Arthropoda | Malacostraca | Sessilia | Cirripedia sp. | 2.0 | 1.0 | 154.0 | 1.688 |
| Arthropoda | Malacostraca | Decapoda | Decapoda | 2.0 | 1.0 | 6.0 | 0.280 |
| Arthropoda | Malacostraca | Decapoda | Eurypodius latreillii | 3.0 | 1.0 | 6.0 | 0.237 |
| Arthropoda | Malacostraca | Decapoda | Grimothea gregaria | 375.0 | 185.25 | 641.0 | 55.490 |
| Arthropoda | Malacostraca | Decapoda | Lithodes santolla | 1.5 | 1.0 | 2.0 | 0.032 |
| Arthropoda | Malacostraca | Decapoda | Lophon proximum | 11.0 | 1.0 | 21.0 | 0.237 |
| Arthropoda | Malacostraca | Decapoda | Metacarcinus edwardsii | 1.0 | 1.0 | 1.0 | 0.011 |
| Arthropoda | Malacostraca | Decapoda | Nauticaris magellanica | 1.0 | 1.0 | 1.0 | 0.011 |
| Arthropoda | Malacostraca | Decapoda | Pagurus sp. | 1.0 | 1.0 | 1.0 | 0.011 |
| Arthropoda | Malacostraca | Decapoda | Pseudocorystes sicarius | 2.0 | 2.0 | 7.0 | 0.001 |
| Echinodermata | Echinoidea | Arbacioida | Arbacia dufresnii | 5.5 | 1.75 | 37.0 | 0.634 |
| Echinodermata | Asteroidea | Valvatida | Asteroidea | 2.0 | 1.0 | 5.25 | 0.118 |
| Echinodermata | Asteroidea | Valvatida | Cosmasterias lurida | 10.5 | 3.5 | 25.0 | 1.592 |
| Echinodermata | Asteroidea | Valvatida | Glabraster antarctica | 1.0 | 1.0 | 1.0 | 0.011 |
| Echinodermata | Holothuroidea | Dendrochirotida | Holothuroidea | 2.5 | 1.25 | 5.25 | 0.129 |
| Echinodermata | Asteroidea | Paxillosida | Labidiaster radiosus | 4.5 | 4.0 | 5.0 | 0.097 |
| Echinodermata | Asteroidea | Valvatida | Odontaster penicillatus | 1.0 | 1.0 | 1.0 | 0.011 |
| Echinodermata | Ophiuroidea | Ophiurida | Ophiura sp. | 1.0 | 1.0 | 1.0 | 0.011 |
| Echinodermata | Asteroidea | Valvatida | Patiria chilensis | 1.0 | 1.0 | 1.0 | 0.011 |
| Chordata | Ascidiacea | Stolidobranchia | Ascidiacea | 4.0 | 1.25 | 8.0 | 0.613 |
| Chordata | Ascidiacea | Stolidobranchia | Cnemidocarpa sp. | 3.0 | 3.0 | 3.0 | 0.032 |
| Chordata | Ascidiacea | Aplousobranchia | Didemnum studeri | 1.0 | 1.0 | 57.25 | 1.043 |
| Chordata | Ascidiacea | Aplousobranchia | Distaplia cylindrica | 1.0 | 1.0 | 1.0 | 0.032 |
| Chordata | Ascidiacea | Stolidobranchia | Pyura legumen | 3.5 | 1.0 | 6.0 | 0.001 |
| Chordata | Ascidiacea | Aplousobranchia | Sycozoa sp. | 2.0 | 2.0 | 2.0 | 0.022 |
| Chordata | Ascidiacea | Aplousobranchia | Sycozoa gaimardi | 5.0 | 1.0 | 9.0 | 0.258 |
| Chordata | Ascidiacea | Aplousobranchia | Sycozoa sigillinoides | 7.5 | 1.0 | 14.0 | 0.108 |
| Phylum | Class | Order | Family | Taxa | Median | 25Q | 75Q | % |
|---|---|---|---|---|---|---|---|---|
| Annelida | Polychaeta | Terebellida | Ampharetidae | Amage sp. | 13.4 | 13.4 | 13.4 | 0.066 |
| Annelida | Polychaeta | Terebellida | Ampharetidae | Ampharete sp. | 10.05 | 6.7 | 13.4 | 0.098 |
| Annelida | Polychaeta | Terebellida | Ampharetidae | Anobothrus sp. | 13.4 | 13.4 | 13.4 | 0.066 |
| Annelida | Polychaeta | Terebellida | Ampharetidae | Phyllocomus sp. | 26.8 | 26.8 | 26.8 | 0.131 |
| Annelida | Polychaeta | Amphinomida | Amphinomidae | Paramphinome australis | 10.05 | 6.7 | 13.4 | 0.098 |
| Annelida | Polychaeta | — | Apistobranchidae | Apistobranchus spp. | 1.5 | 1.5 | 1.5 | 0.007 |
| Annelida | Polychaeta | Capitellida | Capitellidae | Capitella spp. | 204.35 | 76.275 | 400.325 | 8.993 |
| Annelida | Polychaeta | Capitellida | Capitellidae | Notomastus sp. | 6.7 | 6.7 | 6.7 | 0.033 |
| Annelida | Polychaeta | Canalipalpata | Chaetopteridae | Chaetopterus variopedatus | 13.4 | 6.7 | 16.75 | 0.180 |
| Annelida | Polychaeta | Cirratulida | Cirratulidae | Aphelochaeta spp. | 13.4 | 6.7 | 469 | 6.617 |
| Annelida | Polychaeta | Cirratulida | Cirratulidae | Cirratulus cirratus | 6.7 | 6.7 | 6.7 | 0.066 |
| Annelida | Polychaeta | Cirratulida | Paraonidae | Kirkegaardia spp. | 6.7 | 6.7 | 46.9 | 0.557 |
| Annelida | Polychaeta | Cirratulida | Cirratulidae | Tharyx spp. | 244.55 | 22.45 | 529.3 | 13.477 |
| Annelida | Polychaeta | Cossurida | Cossuridae | Cossura spp. | 46.9 | 13.4 | 93.8 | 0.753 |
| Annelida | Polychaeta | Terebellida | Flabelligeridae | Flabelligera sp. | 6.7 | 6.7 | 6.7 | 0.033 |
| Annelida | Polychaeta | Phyllodocida | Glyceridae | Glycera sp. | 13.4 | 6.3 | 24.5 | 0.495 |
| Annelida | Polychaeta | Eunicida | Onuphidae | Hemipodia sp. | 17.85 | 4.925 | 92.125 | 1.568 |
| Annelida | Polychaeta | Phyllodocida | Hesionidae | Psamathe sp. | 6.7 | 2.8 | 11.725 | 0.138 |
| Annelida | Polychaeta | Eunicida | Lumbrineridae | Lumbrineris spp. | 20.1 | 2.225 | 48.575 | 1.117 |
| Annelida | Polychaeta | Eunicida | Lumbrineridae | Ninoe sp. | 13.4 | 13.4 | 13.4 | 0.131 |
| Annelida | Polychaeta | Spionida | Magelonidae | Magelona sp. | 6.7 | 6.7 | 6.7 | 0.033 |
| Annelida | Polychaeta | Terebellida | Ampharetidae | Asychis sp. | 6.7 | 1.5 | 6.7 | 0.073 |
| Annelida | Polychaeta | Maldanida | Maldanidae | Clymenella minor | 4.4 | 2.1 | 6.7 | 0.086 |
| Annelida | Polychaeta | Terebellida | Terebellidae | Nicomache sp. | 6.7 | 6.7 | 6.7 | 0.033 |
| Annelida | Polychaeta | Phyllodocida | Hesionidae | Isolda viridis | 10.05 | 4.825 | 23.45 | 0.250 |
| Annelida | Polychaeta | Phyllodocida | Nephtyidae | Aglaophamus heteroserrata | 134 | 17.2 | 174.2 | 3.715 |
| Annelida | Polychaeta | Phyllodocida | Nephtyidae | Aglaophamus sp. | 22 | 92.125 | 73.7 | 1.492 |
| Annelida | Polychaeta | Eunicida | Onuphidae | Eunereis patagonica | 3.15 | 3.15 | 3.15 | 0.015 |
| Annelida | Polychaeta | Phyllodocida | Nereididae | Nereididae sp. | 6.7 | 6.7 | 6.7 | 0.033 |
| Annelida | Polychaeta | Phyllodocida | Nereididae | Nicon spp. | 6.7 | 6.7 | 6.7 | 0.066 |
| Annelida | Polychaeta | Phyllodocida | Nereididae | Perinereis sp. | 13.4 | 6.7 | 14.45 | 0.169 |
| Annelida | Polychaeta | Phyllodocida | Nereididae | Platynereis sp. | 4.1 | 1.5 | 6.7 | 0.040 |
| Annelida | Polychaeta | Eunicida | Onuphidae | Drilonereis sp. | 6.7 | 6.7 | 6.7 | 0.066 |
| Annelida | Polychaeta | Opheliida | Opheliidae | Ophelina sp. | 6.7 | 5.55 | 6.7 | 0.153 |
| Annelida | Polychaeta | Phyllodocida | Nereididae | Nainereis sp. | 6.7 | 6.7 | 6.7 | 0.033 |
| Annelida | Polychaeta | Orbiniida | Orbiniidae | Orbinia sp. | 6.7 | 6.7 | 6.7 | 0.033 |
| Annelida | Polychaeta | Orbiniida | Orbiniidae | Phylo felix | 6.7 | 6.7 | 6.7 | 0.033 |
| Annelida | Polychaeta | Orbiniida | Orbiniidae | Scoloplos spp. | 2.1 | 2.1 | 2.1 | 0.010 |
| Annelida | Polychaeta | Spionida | Paraonidae | Aricidea spp. | 348.4 | 58.625 | 842.525 | 19.596 |
| Annelida | Polychaeta | Maldanida | Maldanidae | Levinsenia sp. | 8.8 | 2.1 | 26.8 | 0.184 |
| Annelida | Polychaeta | Terebellida | Pectinariidae | Austrophyllum sp. | 6.7 | 6.7 | 6.7 | 0.033 |
| Annelida | Polychaeta | Phyllodocida | Phyllodocidae | Eteone sp. | 6.7 | 6.7 | 10.05 | 0.197 |
| Annelida | Polychaeta | Phyllodocida | Phyllodocidae | Nereiphylla sp. | 6.7 | 6.7 | 6.7 | 0.033 |
| Annelida | — | Echiura | — | Echiura | 44.6 | 44.6 | 44.6 | 0.218 |
| Sipuncula | — | — | — | Sipuncula | 6.7 | 6.7 | 13.4 | 0.369 |
| Annelida | Polychaeta | Phyllodocida | Polynoidae | Harmothoe spp. | 7.225 | 2.1 | 31.825 | 0.626 |
| Annelida | Polychaeta | Terebellida | Sabellariidae | Idanthyrsus macropaleus | 6.7 | 4.4 | 6.7 | 0.141 |
| Annelida | Polychaeta | Sabellida | Sabellariidae | Phragmatopoma sp. | 6.7 | 6.7 | 6.7 | 0.033 |
| Annelida | Polychaeta | Sabellida | Sabellidae | Chone sp. | 6.7 | 3.15 | 13.4 | 0.114 |
| Annelida | Polychaeta | Sabellida | Sabellidae | Notaulax phaeotaenia | 5.25 | 2.1 | 13.4 | 0.101 |
| Annelida | Polychaeta | Terebellida | Terebellidae | Perkinsiana spp. | 13.4 | 6.7 | 33.5 | 0.262 |
| Annelida | Polychaeta | Opheliida | Scalibregmatidae | Scalibregma inflatum | 6.7 | 6.7 | 6.7 | 0.098 |
| Annelida | Polychaeta | Sabellida | Serpulidae | Apomatus sp. | 6.7 | 6.7 | 6.7 | 0.033 |
| Annelida | Polychaeta | Sabellida | Serpulidae | Helicosiphon sp. | 6.7 | 6.7 | 6.7 | 0.033 |
| Annelida | Polychaeta | Sabellida | Serpulidae | Hyalopomatus nigropileatus | 4.1 | 1.5 | 6.7 | 0.040 |
| Annelida | Polychaeta | Sabellida | Serpulidae | Serpula narconensis | 10.05 | 3.25 | 159.125 | 0.190 |
| Annelida | Polychaeta | Sabellida | Serpulidae | Vermiliopsis sp. | 6.7 | 6.7 | 6.7 | 0.033 |
| Annelida | Polychaeta | Phyllodocida | Sigalionidae | Leanira quatrefagesi | 8.9 | 4.4 | 13.4 | 0.087 |
| Annelida | Polychaeta | Phyllodocida | Pholoidae | Pholoe sp. | 6.7 | 6.7 | 6.7 | 0.033 |
| Annelida | Polychaeta | Spionida | Spionidae | Boccardia sp. | 6.7 | 6.55 | 21.775 | 0.228 |
| Annelida | Polychaeta | Spionida | Spionidae | Malacoceros sp. | 6.7 | 6.7 | 6.7 | 0.033 |
| Annelida | Polychaeta | Spionida | Spionidae | Polydora sp. | 7.125 | 6.7 | 7.55 | 0.070 |
| Annelida | Polychaeta | Spionida | Spionidae | Prionospio spp. | 6.7 | 4.1 | 40.2 | 0.466 |
| Annelida | Polychaeta | Spionida | Spionidae | Spiophanes sp. | 4.4 | 1.65 | 51.925 | 0.378 |
| Annelida | Polychaeta | Phyllodocida | Syllidae | Exogone spp. | 6.7 | 6.075 | 544.375 | 1.052 |
| Annelida | Polychaeta | Phyllodocida | Syllidae | Syllidae | 10.05 | 3.25 | 242.875 | 0.493 |
| Annelida | Polychaeta | Terebellida | Terebellidae | Amphitrite sp. | 6.7 | 6.7 | 6.7 | 0.033 |
| Annelida | Polychaeta | Terebellida | Terebellidae | Artacama sp. | 4.4 | 4.4 | 4.4 | 0.022 |
| Annelida | Polychaeta | Terebellida | Terebellidae | Leaena spp. | 6.7 | 2.1 | 6.7 | 0.076 |
| Annelida | Polychaeta | Terebellida | Terebellidae | Streblosoma sp. | 10.05 | 6.7 | 13.4 | 0.098 |
| Annelida | Polychaeta | Terebellida | Terebellidae | Terebella sp. | 6.7 | 6.7 | 6.7 | 0.033 |
| Annelida | Polychaeta | Terebellida | Terebellidae | Thelepus spp. | 6.7 | 6.7 | 7.75 | 0.103 |
| Annelida | Polychaeta | Opheliida | Opheliidae | Travisia sp. | 10.05 | 2.8 | 28.475 | 0.269 |
| Annelida | Polychaeta | Terebellida | Trichobranchidae | Terebellides stroemi | 6.7 | 6.7 | 6.7 | 0.033 |
| Annelida | Polychaeta | Terebellida | Trichobranchidae | Trichobranchus spp. | 6.3 | 6.3 | 6.3 | 0.031 |
| Priapulida | — | — | — | Priapulida | 6.3 | 6.3 | 6.3 | 0.031 |
| Arthropoda | Pycnogonida | — | — | Pycnogonida | 6.7 | 6.7 | 13.4 | 0.131 |
| Arthropoda | Copepoda | — | — | Copepoda | 6.7 | 6.7 | 6.7 | 0.033 |
| Arthropoda | Ostracoda | — | — | Ostracoda | 8.4 | 6.7 | 13.4 | 0.139 |
| Arthropoda | Malacostraca | Decapoda | Paguridae | Pagurus sp. | 6.7 | 6.7 | 6.7 | 0.033 |
| Arthropoda | Malacostraca | Decapoda | Pinnotheridae | Pinnixa sp. | 4.4 | 2.1 | 6.7 | 0.043 |
| Arthropoda | Malacostraca | Amphipoda | Aoridae | Aora sp. | 7.75 | 2.1 | 13.4 | 0.076 |
| Arthropoda | Malacostraca | Amphipoda | Caprellidae | Caprellidae | 6.7 | 6.7 | 6.7 | 0.033 |
| Arthropoda | Malacostraca | Amphipoda | Phoxocephalidae | Cephalophoxoides sp. | 6.7 | 1.5 | 73.7 | 0.400 |
| Arthropoda | Malacostraca | Amphipoda | — | Cheirocratidae | 2.1 | 2.1 | 13.4 | 0.162 |
| Arthropoda | Copepoda | Harpacticoida | Cletodidae | Cletodes sp. | 10.05 | 6.7 | 13.4 | 0.197 |
| Arthropoda | Malacostraca | Cumacea | — | Cumacea | 13.4 | 3.15 | 30.15 | 0.391 |
| Arthropoda | Malacostraca | Cumacea | Diastylidae | Diastylidae | 6.7 | 6.7 | 6.7 | 0.033 |
| Arthropoda | Malacostraca | Amphipoda | Phoxocephalidae | Fuegiphoxus sp. | 53.6 | 53.6 | 53.6 | 0.262 |
| Arthropoda | Malacostraca | Amphipoda | Phoxocephalidae | Fuegiphoxus uncinatus | 6.7 | 6.7 | 6.7 | 0.066 |
| Arthropoda | Malacostraca | Isopoda | — | Isopoda | 13.4 | 13.4 | 13.4 | 0.066 |
| Arthropoda | Malacostraca | Amphipoda | Lysianassoidea | Lysianassoidea | 6.7 | 6.7 | 6.7 | 0.033 |
| Arthropoda | Malacostraca | Amphipoda | Corophiidae | Monocorophium sp. | 6.7 | 6.7 | 13.4 | 1.845 |
| Arthropoda | Malacostraca | Amphipoda | Oedicerotidae | Oedicerotidae | 5.55 | 4.4 | 6.7 | 0.054 |
| Arthropoda | Malacostraca | Amphipoda | Phoxocephalidae | Phoxocephalidae | 10.575 | 6.7 | 14.45 | 0.103 |
| Arthropoda | Malacostraca | Amphipoda | Phoxocephalidae | Phoxocephalinae | 6.7 | 6.7 | 6.7 | 0.033 |
| Arthropoda | Malacostraca | Amphipoda | — | Pseudiphimediella glabra | 6.7 | 6.7 | 6.7 | 0.033 |
| Arthropoda | Malacostraca | Amphipoda | Stenothoidae | Stenothoidae | 7.75 | 6.7 | 37.375 | 0.338 |
| Arthropoda | Malacostraca | Tanaidacea | — | Tanaidacea | 7.55 | 34.625 | 23.45 | 0.481 |
| Arthropoda | Malacostraca | Amphipoda | Uristidae | Uristes schellenbergi | 6.7 | 6.7 | 6.7 | 0.066 |
| Arthropoda | Malacostraca | Amphipoda | Urothoidae | Urothoe falcata | 6.7 | 6.7 | 33.5 | 0.229 |
| Arthropoda | Malacostraca | Amphipoda | Urothoidae | Urothoidae | 6.7 | 6.7 | 6.7 | 0.033 |
| Arthropoda | Hexanauplia | Thecostraca | — | Cirripedia | 2.1 | 2.1 | 2.1 | 0.010 |
| Brachiopoda | Rhynchonellata | Terebratulida | Terebratellidae | Magellania venosa | 77.05 | 3.525 | 244.55 | 4.122 |
| Cnidaria | Anthozoa | Actiniaria | Edwardsiidae | Edwardsia sp. | 6.7 | 6.7 | 6.7 | 0.033 |
| Echinodermata | Asteroidea | — | — | Asteroidea | 1.5 | 1.5 | 1.5 | 0.007 |
| Echinodermata | Echinoidea | — | — | Echinoidea | 6.7 | 2.1 | 13.4 | 0.109 |
| Echinodermata | Holothuroidea | Dendrochirotida | Psolidae | Psolus sp. | 13.4 | 6.7 | 13.4 | 0.262 |
| Echinodermata | Ophiuroidea | — | — | Ophiuroidea | 26.8 | 26.8 | 26.8 | 0.131 |
| Entoprocta | — | — | Pedicellinidae | Pedicellina cernua | 13.4 | 13.4 | 13.4 | 0.066 |
| Mollusca | Bivalvia | Cardiida | Carditidae | Cyclocardia thouarsii | 14.675 | 8.175 | 242.875 | 0.307 |
| Mollusca | Bivalvia | Venerida | Veneridae | Eurhomalea sp. | 26.8 | 26.8 | 26.8 | 0.131 |
| Mollusca | Bivalvia | Adapedonta | Hiatellidae | Hiatella sp. | 27.85 | 27.85 | 27.85 | 0.136 |
| Mollusca | Bivalvia | Mytilida | Mytilidae | Mytilidae | 7.75 | 2.1 | 13.4 | 0.076 |
| Mollusca | Bivalvia | Nuculida | Nuculidae | Nucula spp. | 6.7 | 5.25 | 13.4 | 0.303 |
| Mollusca | Bivalvia | Nuculanida | Neilonellidae | Pseudoneilonella sp. | 26.8 | 13.4 | 110.55 | 1.343 |
| Mollusca | Bivalvia | Lucinida | Thyasiridae | Thyasira sp. | 26.8 | 12.8 | 368.5 | 3.859 |
| Mollusca | Bivalvia | Nuculanida | Yoldiidae | Yoldiella sp. | 30.15 | 4.975 | 139.025 | 1.135 |
| Mollusca | Bivalvia | Pectinida | Pectinidae | Zygochlamys patagonica | 6.7 | 4.4 | 20.1 | 0.272 |
| Mollusca | Gastropoda | Acteonida | Acteonidae | Acteon sp. | 7.75 | 2.1 | 13.4 | 0.114 |
| Mollusca | Gastropoda | Littorinimorpha | Calyptraeidae | Calyptraeidae | 5.55 | 4.4 | 6.7 | 0.054 |
| Mollusca | Gastropoda | Caenogastropoda | Cerithiidae | Cerithidium sp. | 8.4 | 6.7 | 20.1 | 0.303 |
| Mollusca | Gastropoda | Caenogastropoda | — | Colpospirella sp. | 29.95 | 6.7 | 33.5 | 0.343 |
| Mollusca | Gastropoda | Littorinimorpha | Cymatiidae | Fusitriton sp. | 10.05 | 6.7 | 13.4 | 0.033 |
| Mollusca | Gastropoda | Vetigastropoda | Lepetidae | Iothia sp. | 10.05 | 5.55 | 41.375 | 0.782 |
| Mollusca | Gastropoda | Nudibranchia | — | Nudibranchia | 6.7 | 6.7 | 6.7 | 0.033 |
| Mollusca | Gastropoda | Neogastropoda | Cominellidae | Pareuthria sp. 1 | 10.05 | 6.7 | 23.45 | 0.262 |
| Mollusca | Gastropoda | Neogastropoda | Cominellidae | Pareuthria sp. 2 | 45.225 | 108.875 | 87.1 | 0.934 |
| Mollusca | Polyplacophora | Chitonida | Callochitonidae | Callochiton sp. | 6.7 | 6.7 | 6.7 | 0.066 |
| Mollusca | Polyplacophora | Chitonida | Chitonidae | Chiton sp. | 13.4 | 13.4 | 13.4 | 0.066 |
| Mollusca | Polyplacophora | Chitonida | Ischnochitonidae | Lepidozona sp. | 13.4 | 13.4 | 13.4 | 0.066 |
| Mollusca | Polyplacophora | Lepidopleurida | Lepidopleuridae | Leptochiton sp. | 2.1 | 1.5 | 38.95 | 0.406 |
| Mollusca | Polyplacophora | Chitonida | Chitonidae | Tonicia sp. | 13.4 | 13.4 | 13.4 | 0.066 |
| Nematoda | — | — | — | Nematoda | 50.25 | 26.8 | 335 | 10.361 |
| Nemertea | — | — | — | Nemertea | 27.85 | 2.1 | 53.6 | 0.272 |
| Phoronida | — | — | Phoronidae | Phoronis sp. | 154.1 | 154.1 | 154.1 | 0.753 |
References
- Food and Agriculture Organization of the United Nations (FAO). Global Forest Resources Assessment 2000. Chapter 5: Forest Management and Conservation. In FAO Forestry Paper No. 140; FAO: Rome, Italy, 2001; 479p. [Google Scholar]
- Ballesteros, M.; Hopkins, A.; Salicrú, M.; Nimbs, M.J. Heterobranch Sea Slugs s.l. (Mollusca, Gastropoda) from the Southern Ocean: Biodiversity and Taxonomy. Diversity 2025, 17, 330. [Google Scholar] [CrossRef]
- Quiñones, R.A.; Fuentes, M.; Montes, R.M.; Soto, D.; León-Muñoz, J. Environmental issues in Chilean salmon farming: A review. Rev. Aquac. 2019, 11, 375–402. [Google Scholar] [CrossRef]
- Buschmann, A.H.; Niklitschek, E.J.; Pereda, S.V. Aquaculture and Its Impacts on the Conservation of Chilean Patagonia. In Conservation in Chilean Patagonia; Castilla, J.C., Armesto Zamudio, J.J., Martínez-Harms, M.J., Tecklin, D., Eds.; Integrated Science; Springer: Cham, Switzerland, 2023; Volume 19, pp. 303–320. [Google Scholar] [CrossRef]
- Norambuena, H.V.; Labra, F.A.; Matus, R.; Gómez, H.; Luna-Quevedo, D.; Espoz, C. Green energy threatens Chile’s Magallanes Region. Science 2022, 376, 361–362. [Google Scholar] [CrossRef]
- Acosta, K.; Salazar, I.; Saldaña, M.; Ramos, J.; Navarra, A.; Toro, N. Chile and Its Potential Role among the Most Affordable Green Hydrogen Producers in the World. Front. Environ. Sci. 2022, 10, 890104. [Google Scholar] [CrossRef]
- Molinet, C.; Niklitschek, E.J. Fisheries and Marine Conservation in Chilean Patagonia. In Conservation in Chilean Patagonia; Castilla, J.C., Armesto Zamudio, J.J., Martínez-Harms, M.J., Tecklin, D., Eds.; Integrated Science; Springer: Cham, Switzerland, 2023; Volume 19, pp. 283–301. [Google Scholar] [CrossRef]
- Palma, S. Zooplankton distribution and abundance in the austral Chilean channels and fjords. In Progress in the Oceanographic Knowledge of Chilean Interior Waters, from Puerto Montt to Cape Horn; Silva, N., Palma, S., Eds.; Comité Oceanográfico Nacional–Pontificia Universidad Católica de Valparaíso: Valparaíso, Chile, 2008; pp. 107–113. [Google Scholar]
- Bernal, R.; Balbontín, F. Distribución y abundancia de las larvas de peces desde el estrecho de Magallanes al cabo de Hornos. Rev. Cienc. Tecnol. Mar 2003, 26, 85–92. [Google Scholar]
- Salas-Berrios, F.; Valdés-Aguilera, J.; Landaeta, M.F.; Bustos, C.A.; Pérez-Vargas, A.; Balbontín, F. Feeding habits and diet overlap of marine fish larvae from the peri-Antarctic Magellan region. Polar Biol. 2013, 36, 1401–1414. [Google Scholar] [CrossRef]
- Zagami, G.; Antezana, T.; Ferrari, I.; Granata, A.; Sitran, R.; Minutoli, R.; Guglielmo, L. Species diversity, spatial distribution, and assemblages of zooplankton within the Strait of Magellan in austral summer. Polar Biol. 2011, 34, 1319–1333. [Google Scholar] [CrossRef]
- Palma, S.; Aravena, G. Distribución de Quetognatos, Eufáusidos y Sifonóforos en la región Magallánica. Rev. Cienc. Tecnol. Mar 2001, 24, 47–59. [Google Scholar]
- Cañete, J.I.; Gallardo, C.S.; Olave, C.; Romero, M.S.; Figueroa, T.; Haro, D. Abundance and spatial distribution of neustonic copepodits of Microsetella rosea (Harpacticoida: Ectinosomatidae) along the western Magellan coast, southern Chile. Lat. Am. J. Aquat. Res. 2016, 44, 576–587. [Google Scholar] [CrossRef]
- Gambi, M.C.; Giangrande, A. Polychaetes of the soft bottoms of the Straits of Magellan collected during the Italian oceanographic cruise in February–March 1991. An. Inst. Patagon. 1993, 21, 179–192. [Google Scholar]
- Thatje, S.; Brown, A. The macrobenthic ecology of the Straits of Magellan and the Beagle Channel. An. Inst. Patagon. 2009, 37, 17–27. [Google Scholar] [CrossRef][Green Version]
- Jara, N.; Montiel, A.; Céceres, B. The Roles of Alpha, Beta, and Functional Diversity Indices in the Ecological Connectivity between Two Sub-Antarctic Macrobenthic Assemblages. Diversity 2024, 16, 430. [Google Scholar] [CrossRef]
- Mutschke, E.; Ríos, C. Distribución espacial y abundancia relativa de equinodermos en el Estrecho de Magallanes, Chile. Rev. Cienc. Tecnol. Mar 2006, 29, 91–102. [Google Scholar]
- Ríos, C.; Mutschke, E.; Montiel, A.; Gerdes, D.; Arntz, W.E. Soft-bottom macrobenthic faunal associations in the southern Chilean glacial fjord complex. Sci. Mar. 2005, 69 (Suppl. 2), 225–236. [Google Scholar] [CrossRef]
- Ríos, C.; Mutschke, E. Community structure of intertidal boulder-cobble fields in the Strait of Magellan, Chile. Sci. Mar. 1999, 63 (Suppl. 1), 193–201. [Google Scholar] [CrossRef]
- Lange, I.D.; Perry, C.T. A quick, easy and non-invasive method to quantify coral growth rates using photogrammetry and 3D model comparisons. Methods Ecol. Evol. 2020, 11, 714–726. [Google Scholar] [CrossRef]
- Bicknell, A.W.; Godley, B.J.; Sheehan, E.V.; Votier, S.C.; Witt, M.J. Camera technology for monitoring marine biodiversity and human impact. Front. Ecol. Environ. 2016, 14, 424–432. [Google Scholar] [CrossRef]
- Gutt, J.; Helsen, E.; Arntz, W.; Buschmann, A. Biodiversity and community structure of the mega-epibenthos in the Magellan region (South America). Sci. Mar. 1999, 63 (Suppl. S1), 155–170. [Google Scholar] [CrossRef]
- Friedlander, A.M.; Ballesteros, E.; Caselle, J.E.; Hüne, M.; Adler, A.M.; Sala, E. Patterns and drivers of benthic macroinvertebrate assemblages in the kelp forests of southern Patagonia. PLoS ONE 2023, 18, e0279200. [Google Scholar] [CrossRef]
- Cárdenas, C.; Montiel, A. The influence of depth and substrate inclination on sessile assemblages in subantarctic rocky reefs (Magellan region). Polar Biol. 2015, 38, 1631–1644. [Google Scholar] [CrossRef]
- Villalobos, V.; Valdivia, N.; Försterra, G.; Ballyman, S.; Espinoza, J.; Wadham, J.; Burgos-Andrade, K.; Häussermann, V. Depth-dependent diversity patterns of rocky subtidal macrobenthic communities along a temperate fjord in Northern Chilean Patagonia. Front. Mar. Sci. 2021, 8, 635855. [Google Scholar] [CrossRef]
- Betti, F.; Bavestrello, G.; Bo, M.; Enrichetti, F.; Loi, A.; Wanderlingh, A.; Pérez-Santos, I.; Daneri, G. Benthic biodiversity and ecological gradients in the Seno Magdalena (Puyuhuapi Fjord, Chile). Estuar. Coast. Shelf Sci. 2017, 198, 269–278. [Google Scholar] [CrossRef]
- Ortiz, P.; Hamamé, M. Distribución de las comunidades epibentónicas y caracterización de hábitats en el fiordo Puyuhuapi, Patagonia Norte. An. Inst. Patagon. 2022, 50, 1–19. [Google Scholar] [CrossRef]
- Zapata, G.; Gorny, M.; Montiel, A. Filling ecological gaps in Chilean Central Patagonia: Patterns of biodiversity and distribution of sublittoral benthic invertebrates from the Katalalixar National Reserve waters (~48°S). Front. Mar. Sci. 2022, 9, 951195. [Google Scholar] [CrossRef]
- Rovira, J.; Herreros, J. Clasificación de Ecosistemas Marinos Chilenos de la Zona Económica Exclusiva; Ministerio del Medio Ambiente: Santiago, Chile, 2016.
- Spalding, M.D.; Fox, H.E.; Allen, G.R.; Davidson, N.; Ferdaña, Z.A.; Finlayson, M.; Halpern, B.S.; Jorge, M.A.; Lombana, A.; Lourie, S.A.; et al. Marine ecoregions of the world: A bioregionalization of coastal and shelf areas. Bioscience 2007, 57, 573–583. [Google Scholar] [CrossRef]
- Panella, S.; Michelato, A.; Perdicaro, R.; Magazzú, G.; Decembrini, F.; Scarazzato, P. A preliminary contribution to understanding the hydrological characteristics of the Strait of Magellan: Austral spring 1989. Boll. Oceanol. Teor. Appl. 1991, 9, 107–126. [Google Scholar]
- Brambati, A. Introduction to the Magellan Project. Boll. Oceanol. Teor. Appl. 1991, 9, 83–92. [Google Scholar]
- Valdenegro Mancilla, A. Caracterización Oceanográfica Física y Química de la Zona de Canales y Fiordos Australes de Chile Entre el Estrecho de Magallanes y Cabo de Hornos (Cimar 3 Fiordo). Bachelor’s Thesis, Escuela de Ciencias del Mar, Facultad de Recursos Naturales, Universidad Católica de Valparaíso, Valparaíso, Chile, 2002. [Google Scholar]
- Boltovskoy, D. Atlas del Zooplancton del Atlántico Sudoccidental y Métodos de Trabajo con el Zooplancton Marino; INIDEP: Mar del Plata, Argentina, 1981. [Google Scholar]
- Guglielmo, L.; Ianora, A. Atlas of Marine Zooplankton: Straits of Magellan. In Amphipods, Euphausiids, Mysids, Ostracods, and Chaetognaths; Springer: Berlin/Heidelberg, Germany, 1997. [Google Scholar] [CrossRef]
- Guglielmo, L.; Ianora, A. (Eds.) Atlas of Marine Zooplankton: Straits of Magellan. Copepods; Springer: Berlin/Heidelberg, Germany; New York, NY, USA,, 1995; 279p. [Google Scholar]
- Smith, D.B.L.; Johnson, K.B. A Guide to Marine Coastal Plankton and Marine Invertebrate Larvae, 2nd ed.; Kendall/Hunt Publishing Company: Dubuque, IA, USA, 1996. [Google Scholar]
- Tagliapietra, D.; Sigovini, M. Benthic fauna: Collection and identification of macrobenthic invertebrates. Terre Environ. 2010, 88, 253–261. [Google Scholar]
- Ontrup, J.; Ehnert, N.; Bergmann, M.; Nattkemper, T.W. BIIGLE—Web 2.0 enabled labelling and exploring of images from the Arctic deep sea observatory HAUSGARTEN. In Proceedings of the OCEANS 2009–Europe, Bremen, Germany, 11–14 May 2009; IEEE: Piscataway, NJ, USA, 2009; pp. 1–7. [Google Scholar] [CrossRef]
- Castellanos, Z.J.A. Catálogo descriptivo de la malacofauna magallánica 8. In Neogastropoda, Columbellidae, Pyrenidae, Cominellidae y Fasciolariidae; Comisión de Investigaciones Científicas, Provincia de Buenos Aires: Buenos Aires, Argentina, 1992; 41p. [Google Scholar]
- Hartman, O. Polychaeta Errantia of Antarctica. Antarct. Res. Ser. 1964, 3, 1–131. [Google Scholar]
- Hartman, O. Polychaeta Myzostomidae and Sedentaria of Antarctica. Antarct. Res. Ser. 1966, 7, 1–158. [Google Scholar]
- Licher, F. Revision der Gattung Typosyllis Langerhans, 1879 (Polychaeta: Syllidae) Morphologie, taxonomie und phylogenie. Abh. Senckenberg. Naturforschenden Ges. 1999, 551, 1–363. [Google Scholar]
- Böggemann, M. Revision of the Glyceridae Grube 1850 (Annelida: Polychaeta). Abh. Senckenberg. Naturforschenden Ges. 2002, 555, 1–249. [Google Scholar]
- Wilson, R.S.; Hutchings, P.A.; Glasby, C.J. Polychaetes: An Interactive Identification Guide; CSIRO Publishing: Melbourne, Australia, 2003. [Google Scholar]
- Häussermann, V.; Försterra, G. Fauna Marina Bentónica de la Patagonia Chilena. Guía de Identificación Ilustrada; Nature in Focus: Santiago, Chile, 2009; 1000p, ISBN 978-956-332-244-6. [Google Scholar]
- Hammer, Ø.; Harper, D.A.T.; Ryan, P.D. PAST: Paleontological statistics software package for education and data analysis. Palaeontol. Electron. 2001, 4, 1–9. [Google Scholar]
- Jones, F.C. Taxonomic sufficiency: The influence of taxonomic resolution on freshwater bioassessments using benthic macroinvertebrates. Environ. Rev. 2008, 16, 45–69. [Google Scholar] [CrossRef]
- Clarke, K.R.; Gorley, R.N. PRIMER v7: User Manual/Tutorial; PRIMER-E: Plymouth, UK, 2015. [Google Scholar]
- Brasier, M.J.; Barnes, D.K.A.; Bax, N.; Brandt, A.; Christianson, A.B.; Constable, A.J.; Downey, R.; Figuerola, B.; Griffiths, H.; Gutt, J.; et al. Responses of Southern Ocean seafloor habitats and communities to global and local drivers of change. Front. Mar. Sci. 2021, 8, 622721. [Google Scholar] [CrossRef]
- Landaeta, M.F.; Skamiotis, K.; Lara, P.; Olivera, F. Spatio-temporal variations in the mesozooplankton assemblages off Clarence Island, Magellan Strait, Chile. Reg. Stud. Mar. Sci. 2024, 73, 103507. [Google Scholar] [CrossRef]
- Balbontín, F.; Bernal, R. Cambios estacionales en la composición y abundancia del ictioplancton de los canales australes entre el Golfo Corcovado y Golfo Elefantes, Chile. Rev. Cienc. Tecnol. Mar 2005, 28, 99–111. [Google Scholar]
- Biancalana, F.; Dutto, M.S.; Berasategui, A.A.; Kopprio, G.; Hoffmeyer, M.S. Mesozooplankton assemblages and their relationship with environmental variables: A study case in a disturbed bay (Beagle Channel, Argentina). Environ. Monit. Assess. 2014, 186, 8629–8647. [Google Scholar] [CrossRef]
- Suárez-Morales, E.; Gasca, R. Cymbasoma bowmani sp. nov., a new monstrilloid (Copepoda: Monstrilloida) from a Caribbean reef, with notes on species variation. J. Mar. Syst. 1998, 15, 433–439. [Google Scholar] [CrossRef]
- Suárez-Morales, E.; Castellanos-Osorio, I.A. A new species of Monstrilla (Copepoda, Monstrilloida) from the plankton of a large coastal system of the northwestern Caribbean with a key to species. ZooKeys 2019, 876, 111–123. [Google Scholar] [CrossRef]
- Angel, M.V.; Blachowiak-Samolyk, K. Halocyprid ostracods of the Southern Ocean. In Biogeographic Atlas of the Southern Ocean; De Broyer, C., Koubbi, P., Griffiths, H.J., Raymond, B., Udekem d’Acoz, C.d’, Eds.; Scientific Committee on Antarctic Research: Cambridge, UK, 2014; pp. 297–302. [Google Scholar]
- Hamamé, M.; Antezana, T. Chlorophyll and zooplankton in microbasins along the Straits of Magellan–Beagle Channel passage. Sci. Mar. 1999, 63 (Suppl. 1), 35–42. [Google Scholar] [CrossRef]
- Gorny, M.; Pereda, R. Descripción de la composición y distribución geográfica de ictiofauna bentónica por medio de imágenes submarinas en las aguas interiores de la Reserva Nacional Katalalixar (Patagonia Central Chilena). An. Inst. Patagon. 2022, 50, 1–14. [Google Scholar] [CrossRef]
- Gorny, M.M. Proyecto D00I1181. In Desarrollo de la Pesquería de Langostino de los Canales (Munida subrugosa) en la XII Región, Magallanes y Antártica Chilena; Universidad de Magallanes: Punta Arenas, Chile, 2000; Proyecto FONDEF, Octavo Concurso Nacional de Proyectos de I+D. [Google Scholar]
- Thatje, S.; Schnack-Schiel, S.; Arntz, W.E. Developmental trade-offs in Subantarctic meroplankton communities and the enigma of low decapod diversity in high southern latitudes. Mar. Ecol. Prog. Ser. 2003, 260, 195–207. [Google Scholar] [CrossRef]
- Sabatini, M.E.; Giménez, J.; Rocco, V. Características del zooplancton del área costera de la plataforma patagónica austral (Argentina). Bol. Inst. Español Oceanogr. 2001, 17, 245–254. Available online: http://hdl.handle.net/11336/41896 (accessed on 13 July 2025).
- Bowden, D.A.; Clarke, A.; Peck, L.S. Seasonal variation in the diversity and abundance of pelagic larvae of Antarctic marine invertebrates. Mar. Biol. 2009, 156, 2033–2047. [Google Scholar] [CrossRef]
- Nahuelhual, L.; Saavedra, G.; Mellado, M.A.; Vergara, X.; Vallejos, T. A social-ecological trap perspective to explain the emergence and persistence of illegal fishing in small-scale fisheries. Marit. Stud. 2020, 19, 105–117. [Google Scholar] [CrossRef]
- Zimmerling, J.R.; Pomeroy, A.C.; d’Entremont, M.V.; Francis, C.M. Canadian estimate of bird mortality due to collisions and direct habitat loss associated with wind turbine developments. Avian Conserv. Ecol. 2013, 8, 10. [Google Scholar] [CrossRef]
- Solé, M.; Kaifu, K.; Mooney, T.A.; Nedelec, S.L.; Olivier, F.; Radford, A.N.; Vazzana, M.; Wale, M.A.; Semmens, J.M.; Simpson, S.D.; et al. Effects of anthropogenic noise on marine invertebrates. Front. Mar. Sci. 2023, 10, 1129057. [Google Scholar] [CrossRef]
- Green, R.; Higginbottom, K. The Negative Effects of Wildlife Tourism on Wildlife (Wildlife Tourism Report Series No. 5); CRC for Sustainable Tourism Pty Ltd.: Gold Coast, Australia, 2001. [Google Scholar] [CrossRef]
- Sanderson, E.W.; Redford, K.H.; Chetkiewicz, C.-L.B.; Medellín, R.R.; Rabinowitz, A.R.; Robinson, J.G.; Taber, A.B. Planning to save a species: The jaguar as a model. Conserv. Biol. 2002, 16, 58–72. [Google Scholar] [CrossRef]
- Noss, R.F. Landscape connectivity: Different functions at different scales. In Landscape Linkage and Biodiversity; Hudson, W.E., Ed.; Island Press: Washington, DC, USA, 1991; pp. 27–39. [Google Scholar]
- García Quiroga, F. La problemática de la expansión geográfica de las especies exóticas invasoras. Análisis y distribución de dos especies en la provincia de Ávila e iniciativas para la minimización de sus efectos. Obs. Medioambient. 2012, 15, 175–196. [Google Scholar] [CrossRef]
- Estay, M.; Chávez, C. Location decisions and regulatory changes: The case of the Chilean aquaculture. Lat. Am. J. Aquat. Res. 2015, 43, 700–717. [Google Scholar] [CrossRef]

| Taxa | Av. Dissim | Contrib. % | Cumulative % | Mean Outside | Mean Inside |
|---|---|---|---|---|---|
| Tharyx spp. | 1.568 | 2.612 | 2.612 | 1.41 | 4.56 |
| Magellania venosa | 1.41 | 2.348 | 4.96 | 3.49 | 0.536 |
| Pholoe sp. | 1.262 | 2.102 | 7.063 | 0 | 2.55 |
| Kirkegaardia spp. | 0.9944 | 1.657 | 8.719 | 4.4 | 2.78 |
| Lepidozona sp. | 0.9777 | 1.629 | 10.35 | 2.01 | 0 |
| Levinsenia sp. | 0.9569 | 1.594 | 11.94 | 3.46 | 5.17 |
| Yoldiella sp. | 0.9061 | 1.509 | 13.45 | 2.22 | 0.902 |
| Eunireis patagonica | 0.9034 | 1.505 | 14.96 | 0 | 1.82 |
| Nematoda | 0.9006 | 1.5 | 16.46 | 2.77 | 4.19 |
Disclaimer/Publisher’s Note: The statements, opinions and data contained in all publications are solely those of the individual author(s) and contributor(s) and not of MDPI and/or the editor(s). MDPI and/or the editor(s) disclaim responsibility for any injury to people or property resulting from any ideas, methods, instructions or products referred to in the content. |
© 2025 by the authors. Licensee MDPI, Basel, Switzerland. This article is an open access article distributed under the terms and conditions of the Creative Commons Attribution (CC BY) license (https://creativecommons.org/licenses/by/4.0/).
Share and Cite
Rodríguez-Stepke, B.; Montiel, A.; Poblete, J.; F. Landaeta, M.; Pérez, D.; Pérez-Schultheiss, J.; Skamiotis, K.; Garrido, I.; Orrego, F.S.; Hüne, M. Marine Biodiversity in Inútil Bay (Tierra del Fuego): Patterns of Zooplanktonic and Benthic Assemblages. Diversity 2025, 17, 763. https://doi.org/10.3390/d17110763
Rodríguez-Stepke B, Montiel A, Poblete J, F. Landaeta M, Pérez D, Pérez-Schultheiss J, Skamiotis K, Garrido I, Orrego FS, Hüne M. Marine Biodiversity in Inútil Bay (Tierra del Fuego): Patterns of Zooplanktonic and Benthic Assemblages. Diversity. 2025; 17(11):763. https://doi.org/10.3390/d17110763
Chicago/Turabian StyleRodríguez-Stepke, Benjamín, Américo Montiel, Jonathan Poblete, Mauricio F. Landaeta, Daniel Pérez, Jorge Pérez-Schultheiss, Kharla Skamiotis, Ignacio Garrido, Fernanda S. Orrego, and Mathias Hüne. 2025. "Marine Biodiversity in Inútil Bay (Tierra del Fuego): Patterns of Zooplanktonic and Benthic Assemblages" Diversity 17, no. 11: 763. https://doi.org/10.3390/d17110763
APA StyleRodríguez-Stepke, B., Montiel, A., Poblete, J., F. Landaeta, M., Pérez, D., Pérez-Schultheiss, J., Skamiotis, K., Garrido, I., Orrego, F. S., & Hüne, M. (2025). Marine Biodiversity in Inútil Bay (Tierra del Fuego): Patterns of Zooplanktonic and Benthic Assemblages. Diversity, 17(11), 763. https://doi.org/10.3390/d17110763


