
Comment on Krüger, L. Decreasing Trends of Chinstrap Penguin Breeding Colonies in a Region of Major and Ongoing Rapid Environmental Changes Suggest Population Level Vulnerability. Diversity 2023, 15, 327


Abstract
1. Introduction
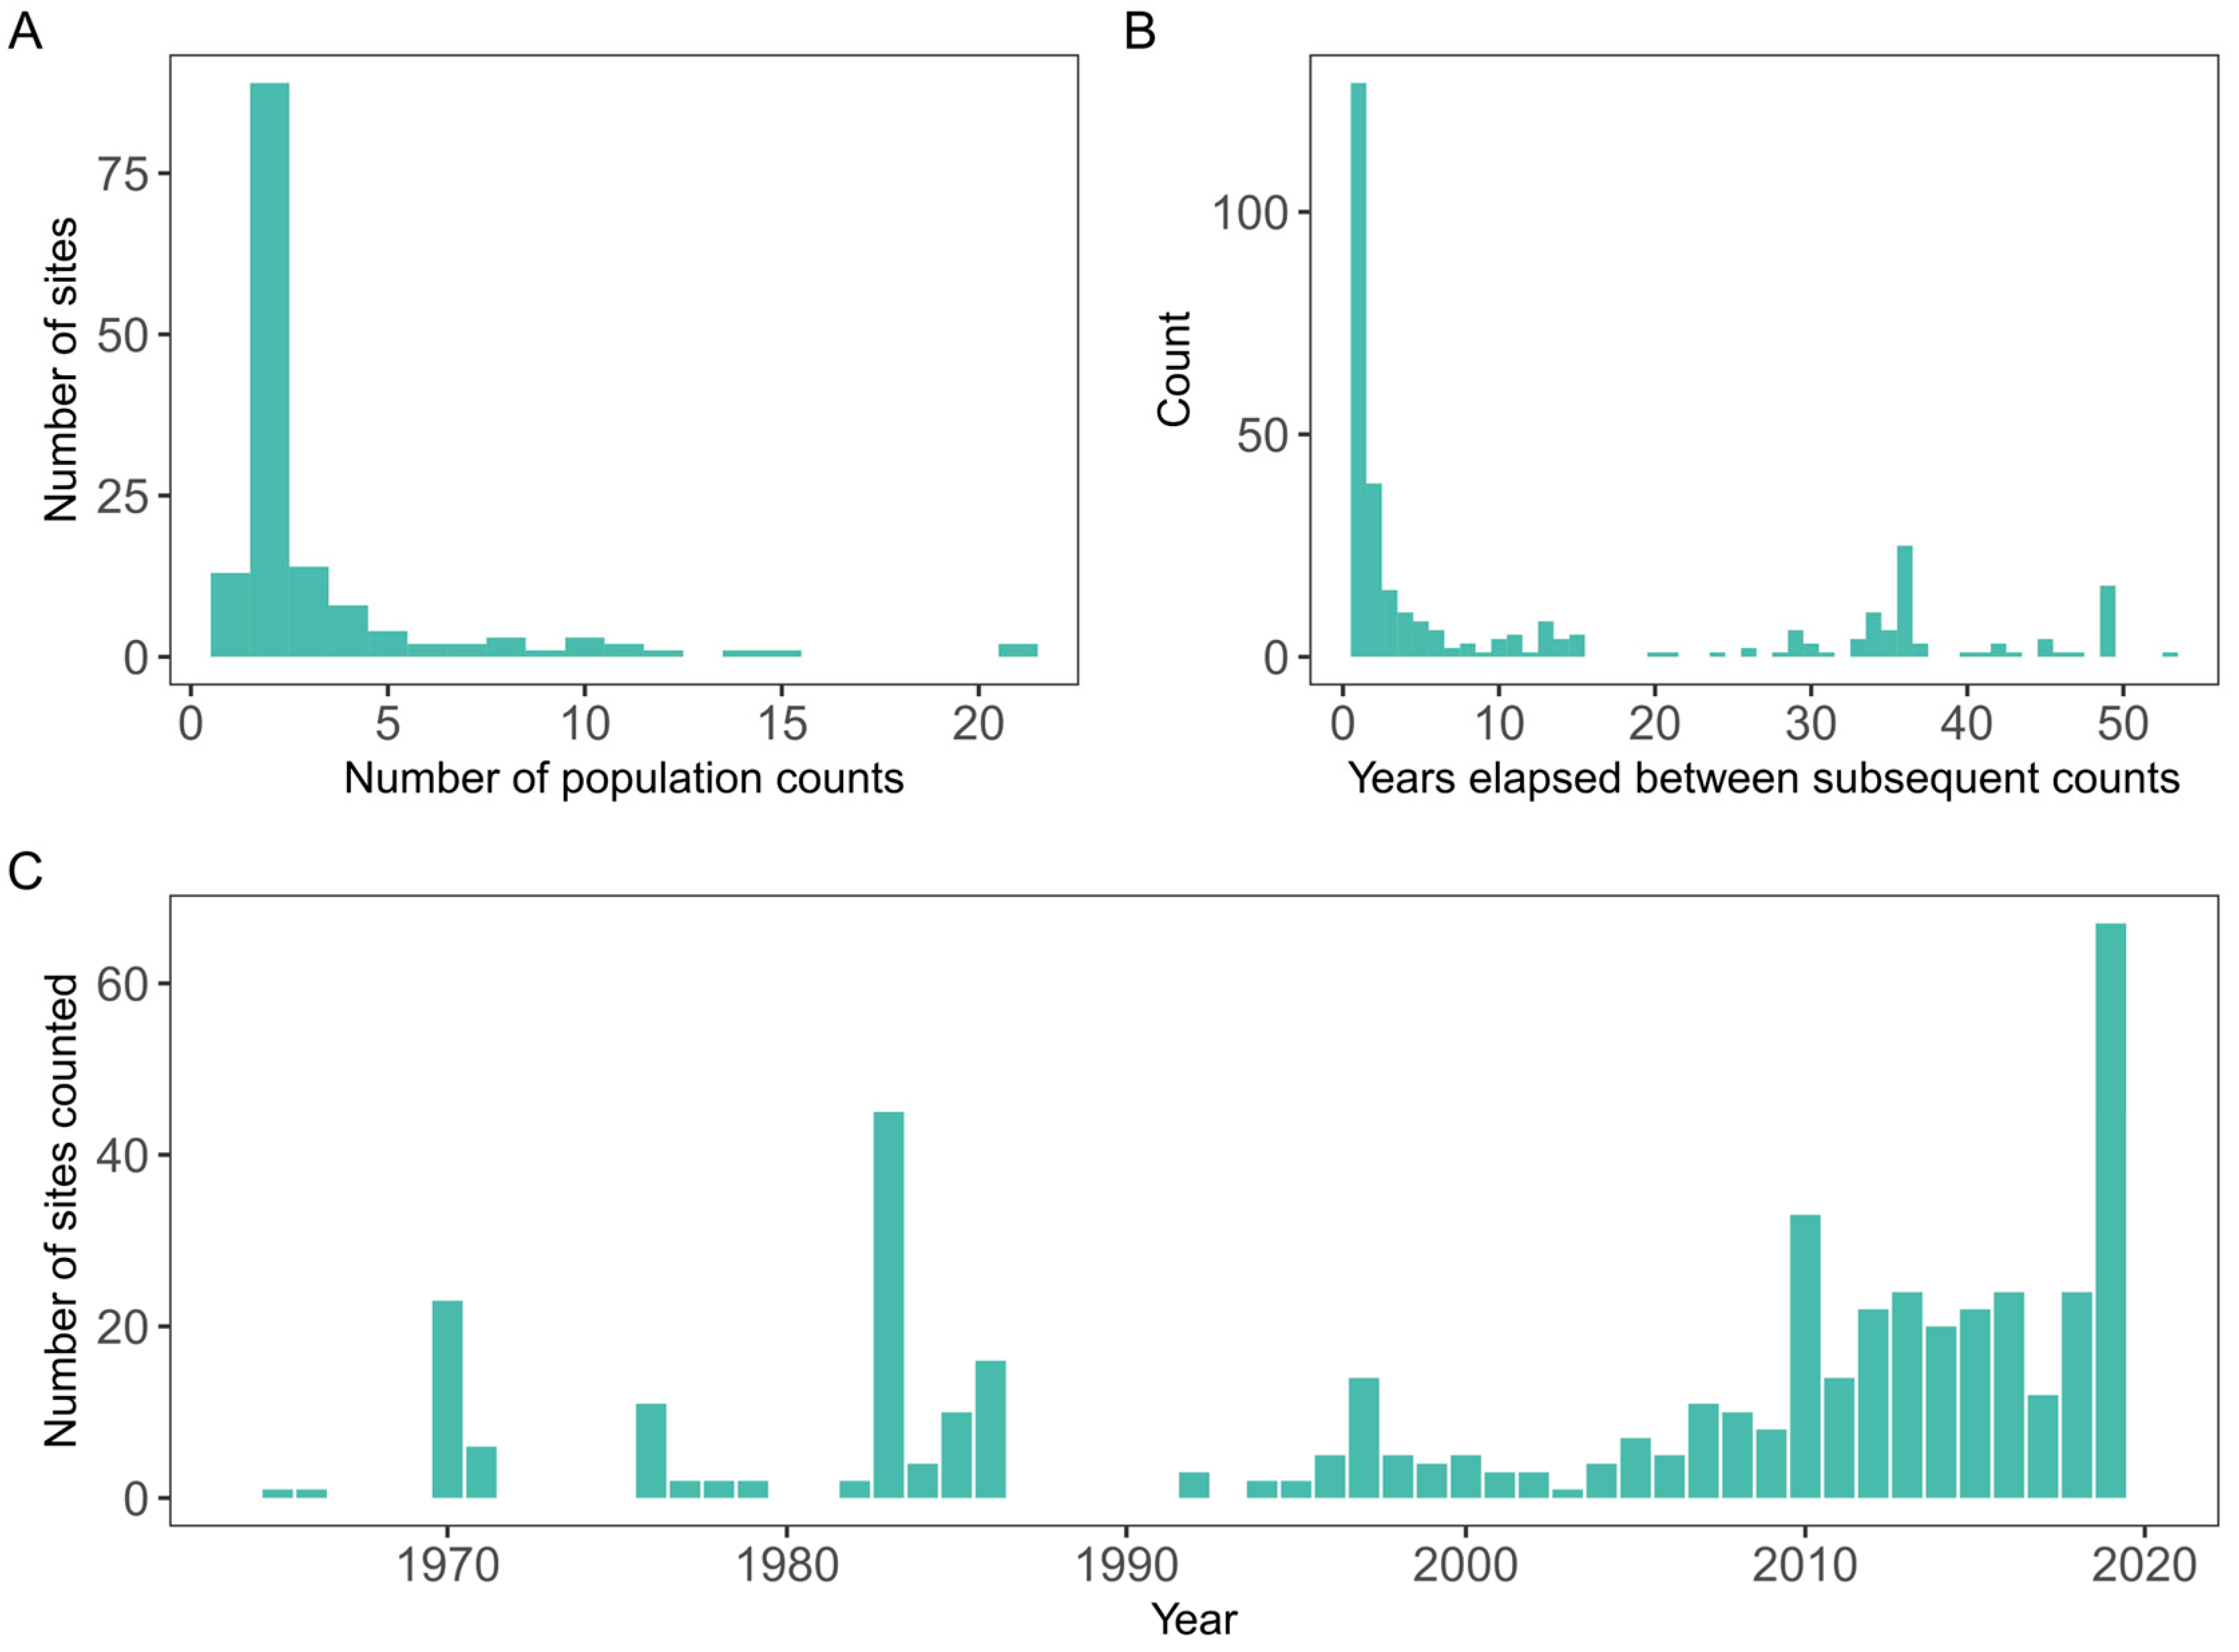
2. Data Processing and Exploratory Data Analysis
3. Modelling Penguin Population Trends with GLMMs: A Statistical Critique
4. Modelling Penguin Population Trends with GLMMs: A Reanalysis
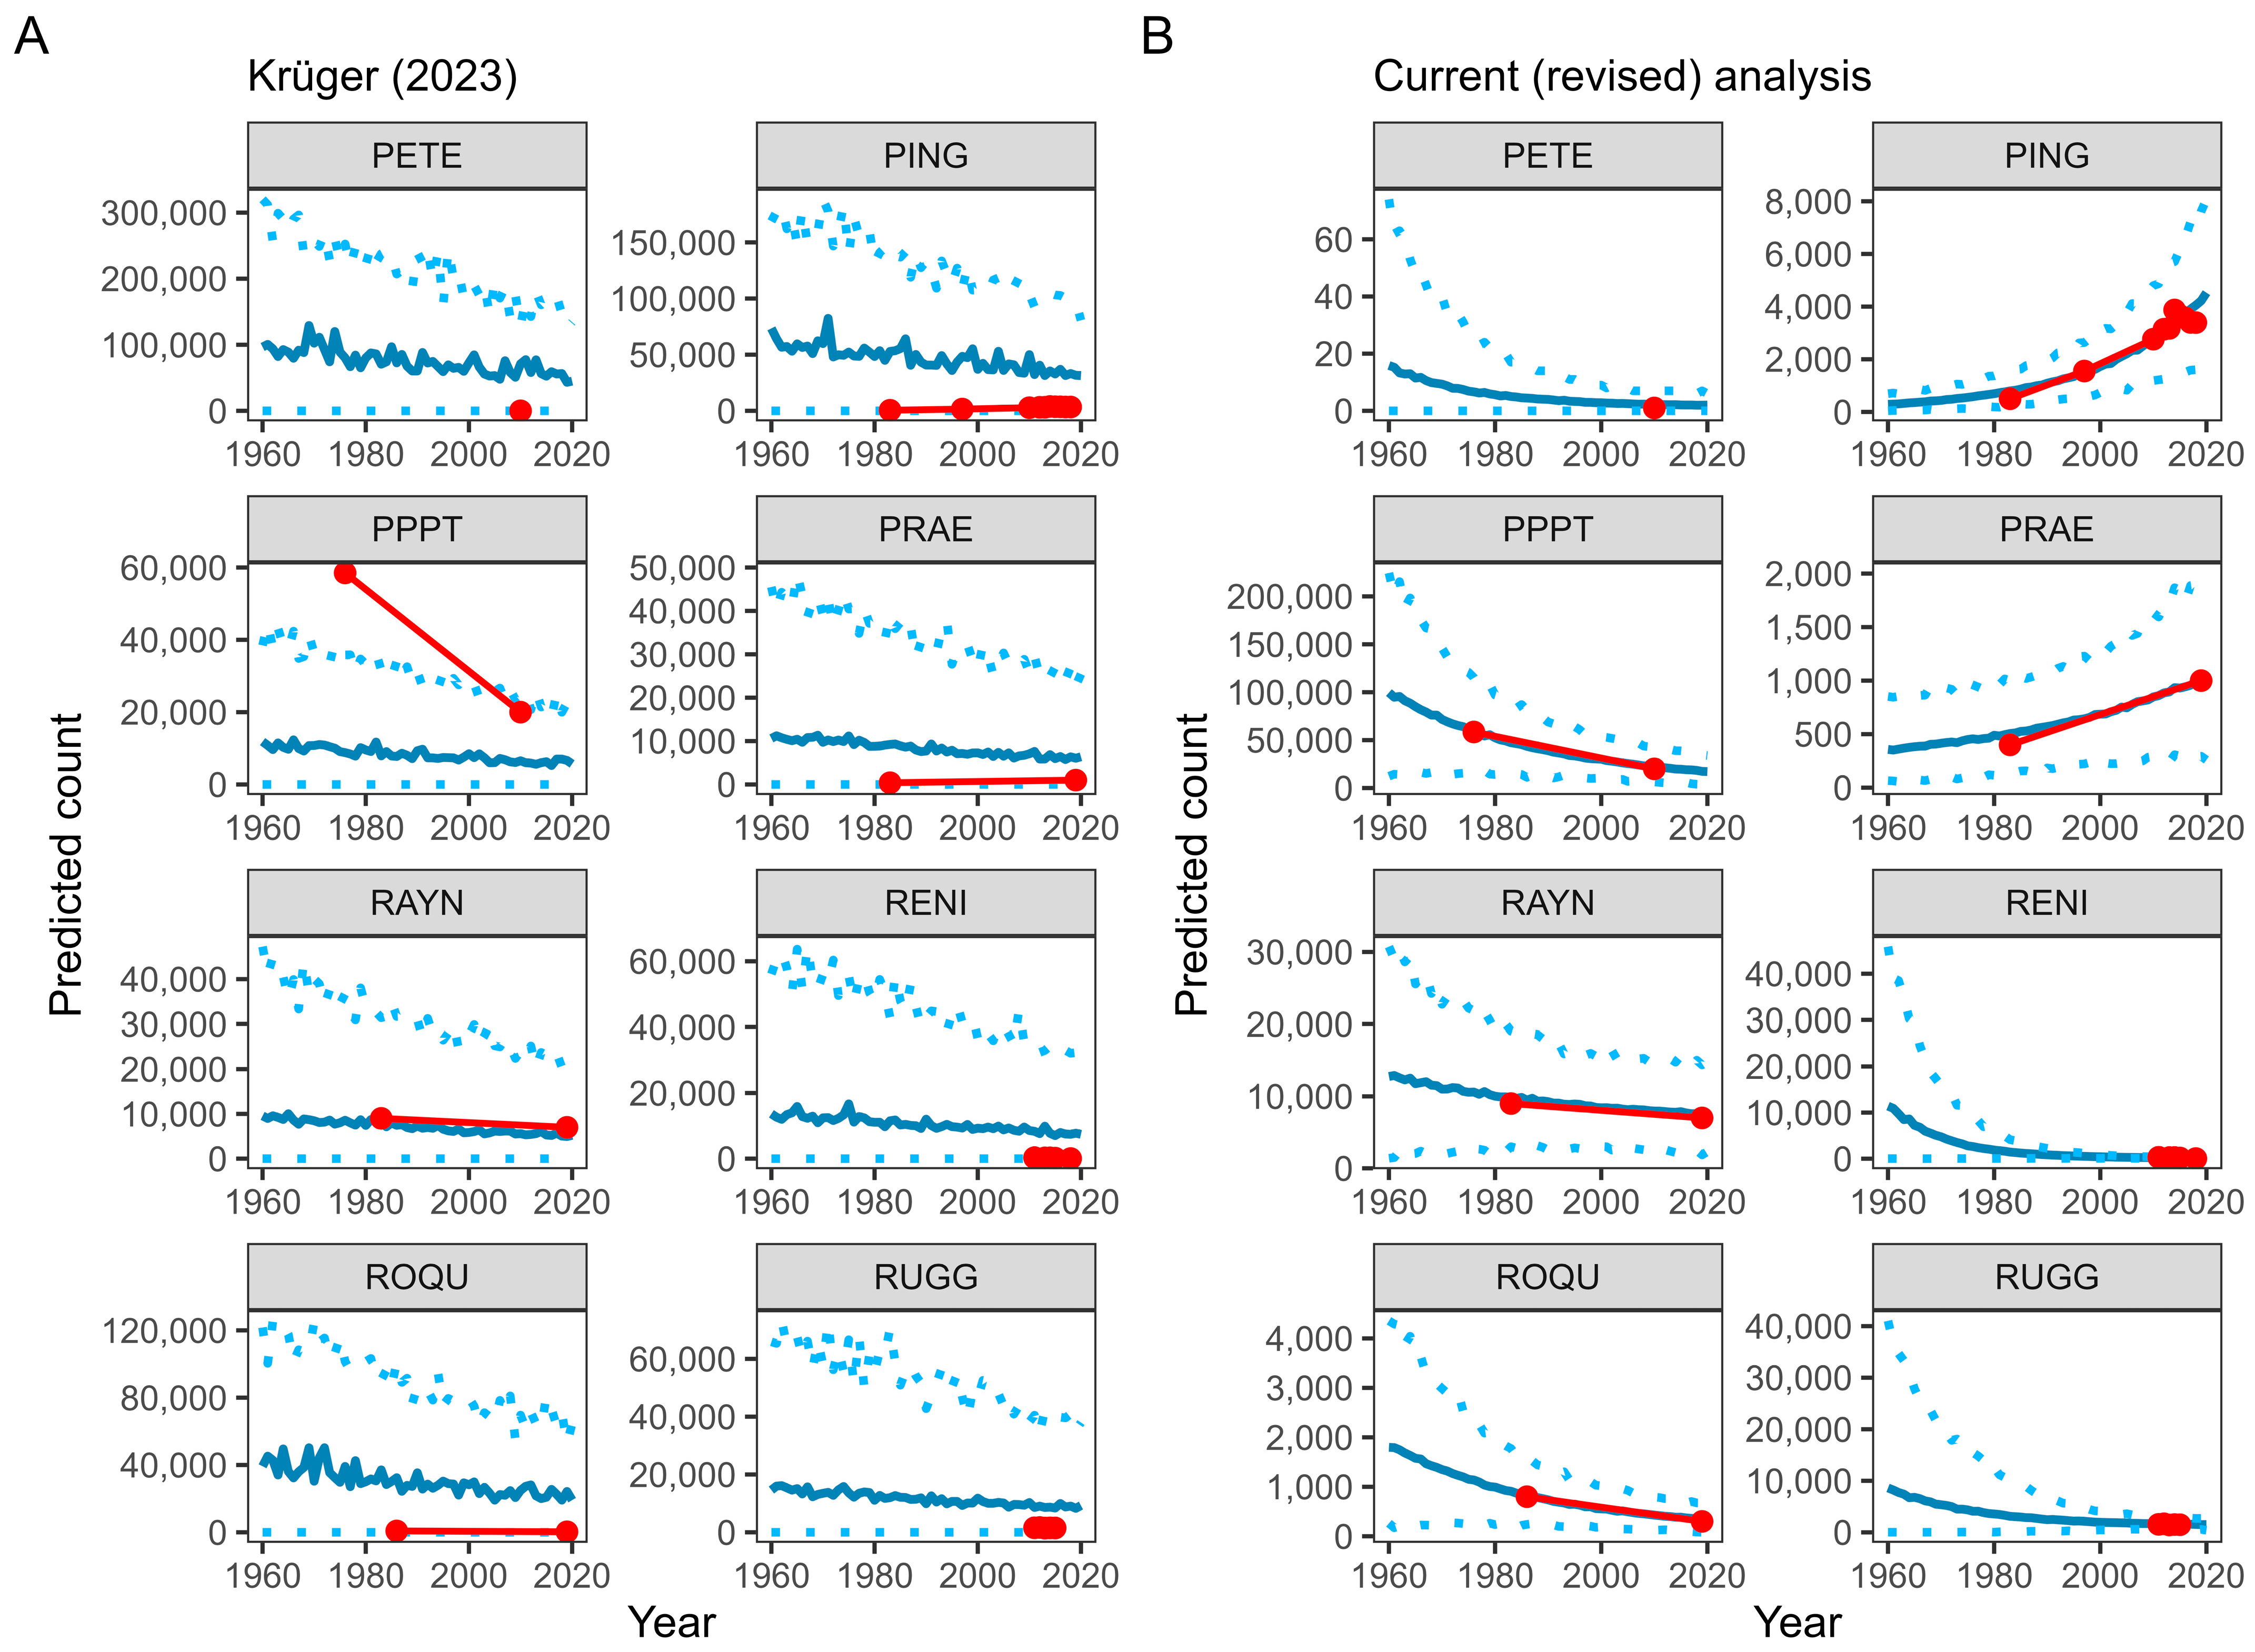
5. Predicting Penguin Population Trends with GLMMs
6. How Sparse Is Too Sparse?
7. Conclusions
Supplementary Materials
Author Contributions
Funding
Data Availability Statement
Conflicts of Interest
References
- IUCN (International Union for Conservation of Nature). IUCN Red List Categories & Criteria, 2nd ed.; Version 3.1; IUCN: Gland, Switzerland, 2012. [Google Scholar]
- Paleczny, M.; Hammill, E.; Karpouzi, V.; Pauly, D. Population trend of the world’s monitored seabirds, 1950–2010. PLoS ONE 2015, 10, 0129342. [Google Scholar] [CrossRef] [PubMed]
- White, E.R. Minimum time required to detect population trends: The need for long-term monitoring programs. BioScience 2019, 69, 40–46. [Google Scholar] [CrossRef]
- Clark, J.S.; Bjørnstad, O.N. Population time series: Process variability, observation errors, missing values, lags, and hidden states. Ecology 2004, 85, 3140–3150. [Google Scholar] [CrossRef]
- Authier, M.; Galatius, A.; Gilles, A.; Spitz, J. Of power and despair in cetacean conservation: Estimation and detection of trend in abundance with noisy and short time-series. PeerJ 2020, 8, e9436. [Google Scholar] [CrossRef] [PubMed]
- Strycker, N.; Wethington, M.; Borowicz, A.; Forrest, S.; Witharana, C.; Hart, T.; Lynch, H.J. A global population assessment of the Chinstrap penguin (Pygoscelis antarctica). Sci. Rep. 2020, 10, 19474. [Google Scholar] [CrossRef] [PubMed]
- Humphries, G.R.W.; Naveen, R.; Schwaller, M.; Che-Castaldo, C.; McDowall, P.; Schrimpf, M.; Lynch, H.J. Mapping application for penguin populations and projected dynamics (MAPPPD): Data and tools for dynamic management and decision support. Polar Rec. 2017, 53, 160–166. [Google Scholar] [CrossRef]
- Krüger, L. Decreasing Trends of Chinstrap Penguin Breeding Colonies in a Region of Major and Ongoing Rapid Environmental Changes Suggest Population Level Vulnerability. Diversity 2023, 15, 327. [Google Scholar] [CrossRef]
- Warwick-Evans, V.; Kelly, N.; Dalla Rosa, L.; Friedlaender, A.; Hinke, J.T.; Kim, J.H.; Trathan, P.N. Using seabird and whale distribution models to estimate spatial consumption of krill to inform fishery management. Ecosphere 2022, 13, e4083. [Google Scholar] [CrossRef]
- R Core Team. R: A Language and Environment for Statistical Computing; R Foundation for Statistical Computing: Vienna, Austria, 2022; Available online: https://www.R-project.org/ (accessed on 5 October 2023).
- Hill, S.L.; Atkinson, A.; Pakhomov, E.A.; Siegel, V. Evidence for a decline in the population density of Antarctic krill Euphausia superba still stands. A comment on Cox et al. J. Crustac. Biol. 2019, 39, 316–322. [Google Scholar] [CrossRef]
- Lynch, H.J.; Naveen, R.; Trathan, P.N.; Fagan, W.F. Spatially integrated assessment reveals widespread changes in penguin populations on the Antarctic Peninsula. Ecology 2012, 93, 1367–1377. [Google Scholar] [CrossRef]
- Hadfield, J.D. MCMC methods for multi-response generalized linear mixed models: The MCMCglmm R package. J. Stat. Softw. 2010, 33, 1–22. [Google Scholar] [CrossRef]
- Zuur, A.F.; Ieno, E.N.; Walker, N.J.; Saveliev, A.A.; Smith, G.M. Mixed Effects Models and Extensions in Ecology with R; Springer: New York, NY, USA, 2009. [Google Scholar]
- Gelman, A.; Carlin, J.B.; Stern, H.S.; Dunson, D.B.; Vehtari, A.; Rubin, D.B. Bayesian Data Analysis; CRC Press: Boca Raton, FL, USA, 2013. [Google Scholar]
- Conn, P.B.; Johnson, D.S.; Williams, P.J.; Melin, S.R.; Hooten, M.B. A guide to Bayesian model checking for ecologists. Ecol. Monogr. 2018, 88, 526–542. [Google Scholar] [CrossRef]
- Gelman, A.; Hill, J. Data Analysis Using Regression and Multilevel/Hierarchical Models; Cambridge University Press: Cambridge, UK, 2006. [Google Scholar]
- McElreath, R. Statistical Rethinking: A Bayesian Course with Examples in R and Stan, 2nd ed.; Chapman and Hall/CRC: Boca Raton, FL, USA, 2020. [Google Scholar]
- Heiss, A. A Guide to Correctly Calculating Posterior Predictions and Average Marginal Effects with Multilievel Bayesian Models. 10 November 2021. Available online: https://www.andrewheiss.com/blog/2021/11/10/ame-bayes-re-guide/ (accessed on 1 October 2023).
- Conn, P.B.; Johnson, D.S.; Boveng, P.L. On extrapolating past the range of observed data when making statistical predictions in ecology. PLoS ONE 2015, 10, e0141416. [Google Scholar] [CrossRef] [PubMed]
- Gould, E.; Fraser, H.S.; Parker, T.H.; Nakagawa, S.; Griffith, S.C.; Vesk, P.A.; Fidler, F.; Hamilton, D.G.; Abbey-Lee, R.N.; Abbott, J.K.; et al. Same data, different analysts: Variation in effect sizes due to analytical decisions in ecology and evolutionary biology. EcoEvoRxiv online. 2023. [Google Scholar] [CrossRef]
- Lynch, H.J.; White, R.; Naveen, R.; Black, A.; Meixler, M.S.; Fagan, W.F. In stark contrast to widespread declines along the Scotia Arc, a survey of the South Sandwich Islands finds a robust seabird community. Polar Biol. 2016, 39, 1615–1625. [Google Scholar] [CrossRef]
- Silk, M.J.; Harrison, X.A.; Hodgson, D.J. Perils and pitfalls of mixed-effects regression models in biology. PeerJ 2020, 8, e9522. [Google Scholar] [CrossRef]
- Popovic, G.; Mason, T.J.; Drobniak, S.M.; Marques, T.A.; Potts, J.; Joo, R.; Altwegg, R.; Burns, C.C.I.; McCarthy, M.A.; Johnston, A.; et al. Four principles for improved statistical ecology. Methods Ecol. Evol. 2024, 15, 266–281. [Google Scholar] [CrossRef]
- Hodgson, J.C.; Mott, R.; Baylis, S.M.; Pham, T.T.; Wotherspoon, S.; Kilpatrick, A.D.; Segaran, R.R.; Reid, I.; Terauds, A.; Koh, L.P. Drones count wildlife more accurately and precisely than humans. Methods Ecol. Evol. 2018, 9, 1160–1167. [Google Scholar] [CrossRef]
- Hinke, J.T.; Salwicka, K.; Trivelpiece, S.G.; Watters, G.M.; Trivelpiece, W.Z. Divergent responses of Pygoscelis penguins reveal a common environmental driver. Oecologia 2007, 153, 845–855. [Google Scholar] [CrossRef] [PubMed]
- Weegman, M.D.; Arnold, T.W.; Dawson, R.D.; Winkler, D.W.; Clark, R.G. Integrated population models reveal local weather conditions are the key drivers of population dynamics in an aerial insectivore. Oecologia 2017, 185, 119–130. [Google Scholar] [CrossRef] [PubMed]
- Schweinsberg, M.; Feldman, M.; Staub, N.; van den Akker, O.R.; van Aert, R.C.; Van Assen, M.A.; Liu, Y.; Althoff, T.; Heer, J.; Kale, A.; et al. Same data, different conclusions: Radical dispersion in empirical results when independent analysts operationalize and test the same hypothesis. Organ. Behav. Hum. Decis. Process. 2021, 165, 228–249. [Google Scholar] [CrossRef]
- Croxall, J.P.; Kirkwood, E.D. The Distribution of Penguins on the Antarctic Peninsula and Islands of the Scotia Sea; British Antarctic Survey: Cambridge, UK, 1979. [Google Scholar]


| Analysis Step | Krüger (2023) | Current Study |
|---|---|---|
| MAPPPD data | Ignored count uncertainty. | Excluded counts with very high uncertainty (“to an order of magnitude”; MAPPPD level 5) to mitigate the impact of potentially extreme observation errors on population trends. While we do not address this issue here, count uncertainty should ideally also be accounted for in the remaining data. |
| MAPPPD data | Removed nest counts with unknown ‘day’ and ‘month’ of count (day/month not used otherwise). | Kept nest counts where ‘day’ and ‘month’ of count were unknown to increase the initial sample size. |
| MAPPPD data | Removed ‘true zeros’ (counts with zero nests). | Kept ‘true zeros’ (counts with zero nests). |
| MAPPPD data | Considered all data between 1965 and 2019. | Limited data to the period with most observations (1980–2019). |
| MAPPPD data | Considered all sites with two or more counts (but 13 sites with a single non-zero count unintentionally remained in the GLMM dataset). | Sites with two or more counts were considered, but case studies attempted to avoid extreme extrapolation of population predictions at sites where counts covered only a small fraction of the time series. |
| Model fitting | Incorrect GLMM structure for fixed and random effects. | Improved GLMM structure for fixed and random effects. |
| Model fitting | Did not standardize covariates, encumbering model fitting and convergence. | Standardized covariates to mean 0, standard deviation 1 before model fitting. |
| Model fitting | Used default MCMCglmm sampling parameters. | Increased the MCMC sampling and burn-in period (though this was not strictly required). |
| Model evaluation | Did not evaluate MCMC diagnostics and model fit. | Evaluated the model’s effective sample size and mixing (trace plots) and plotted model predictions against observed values. |
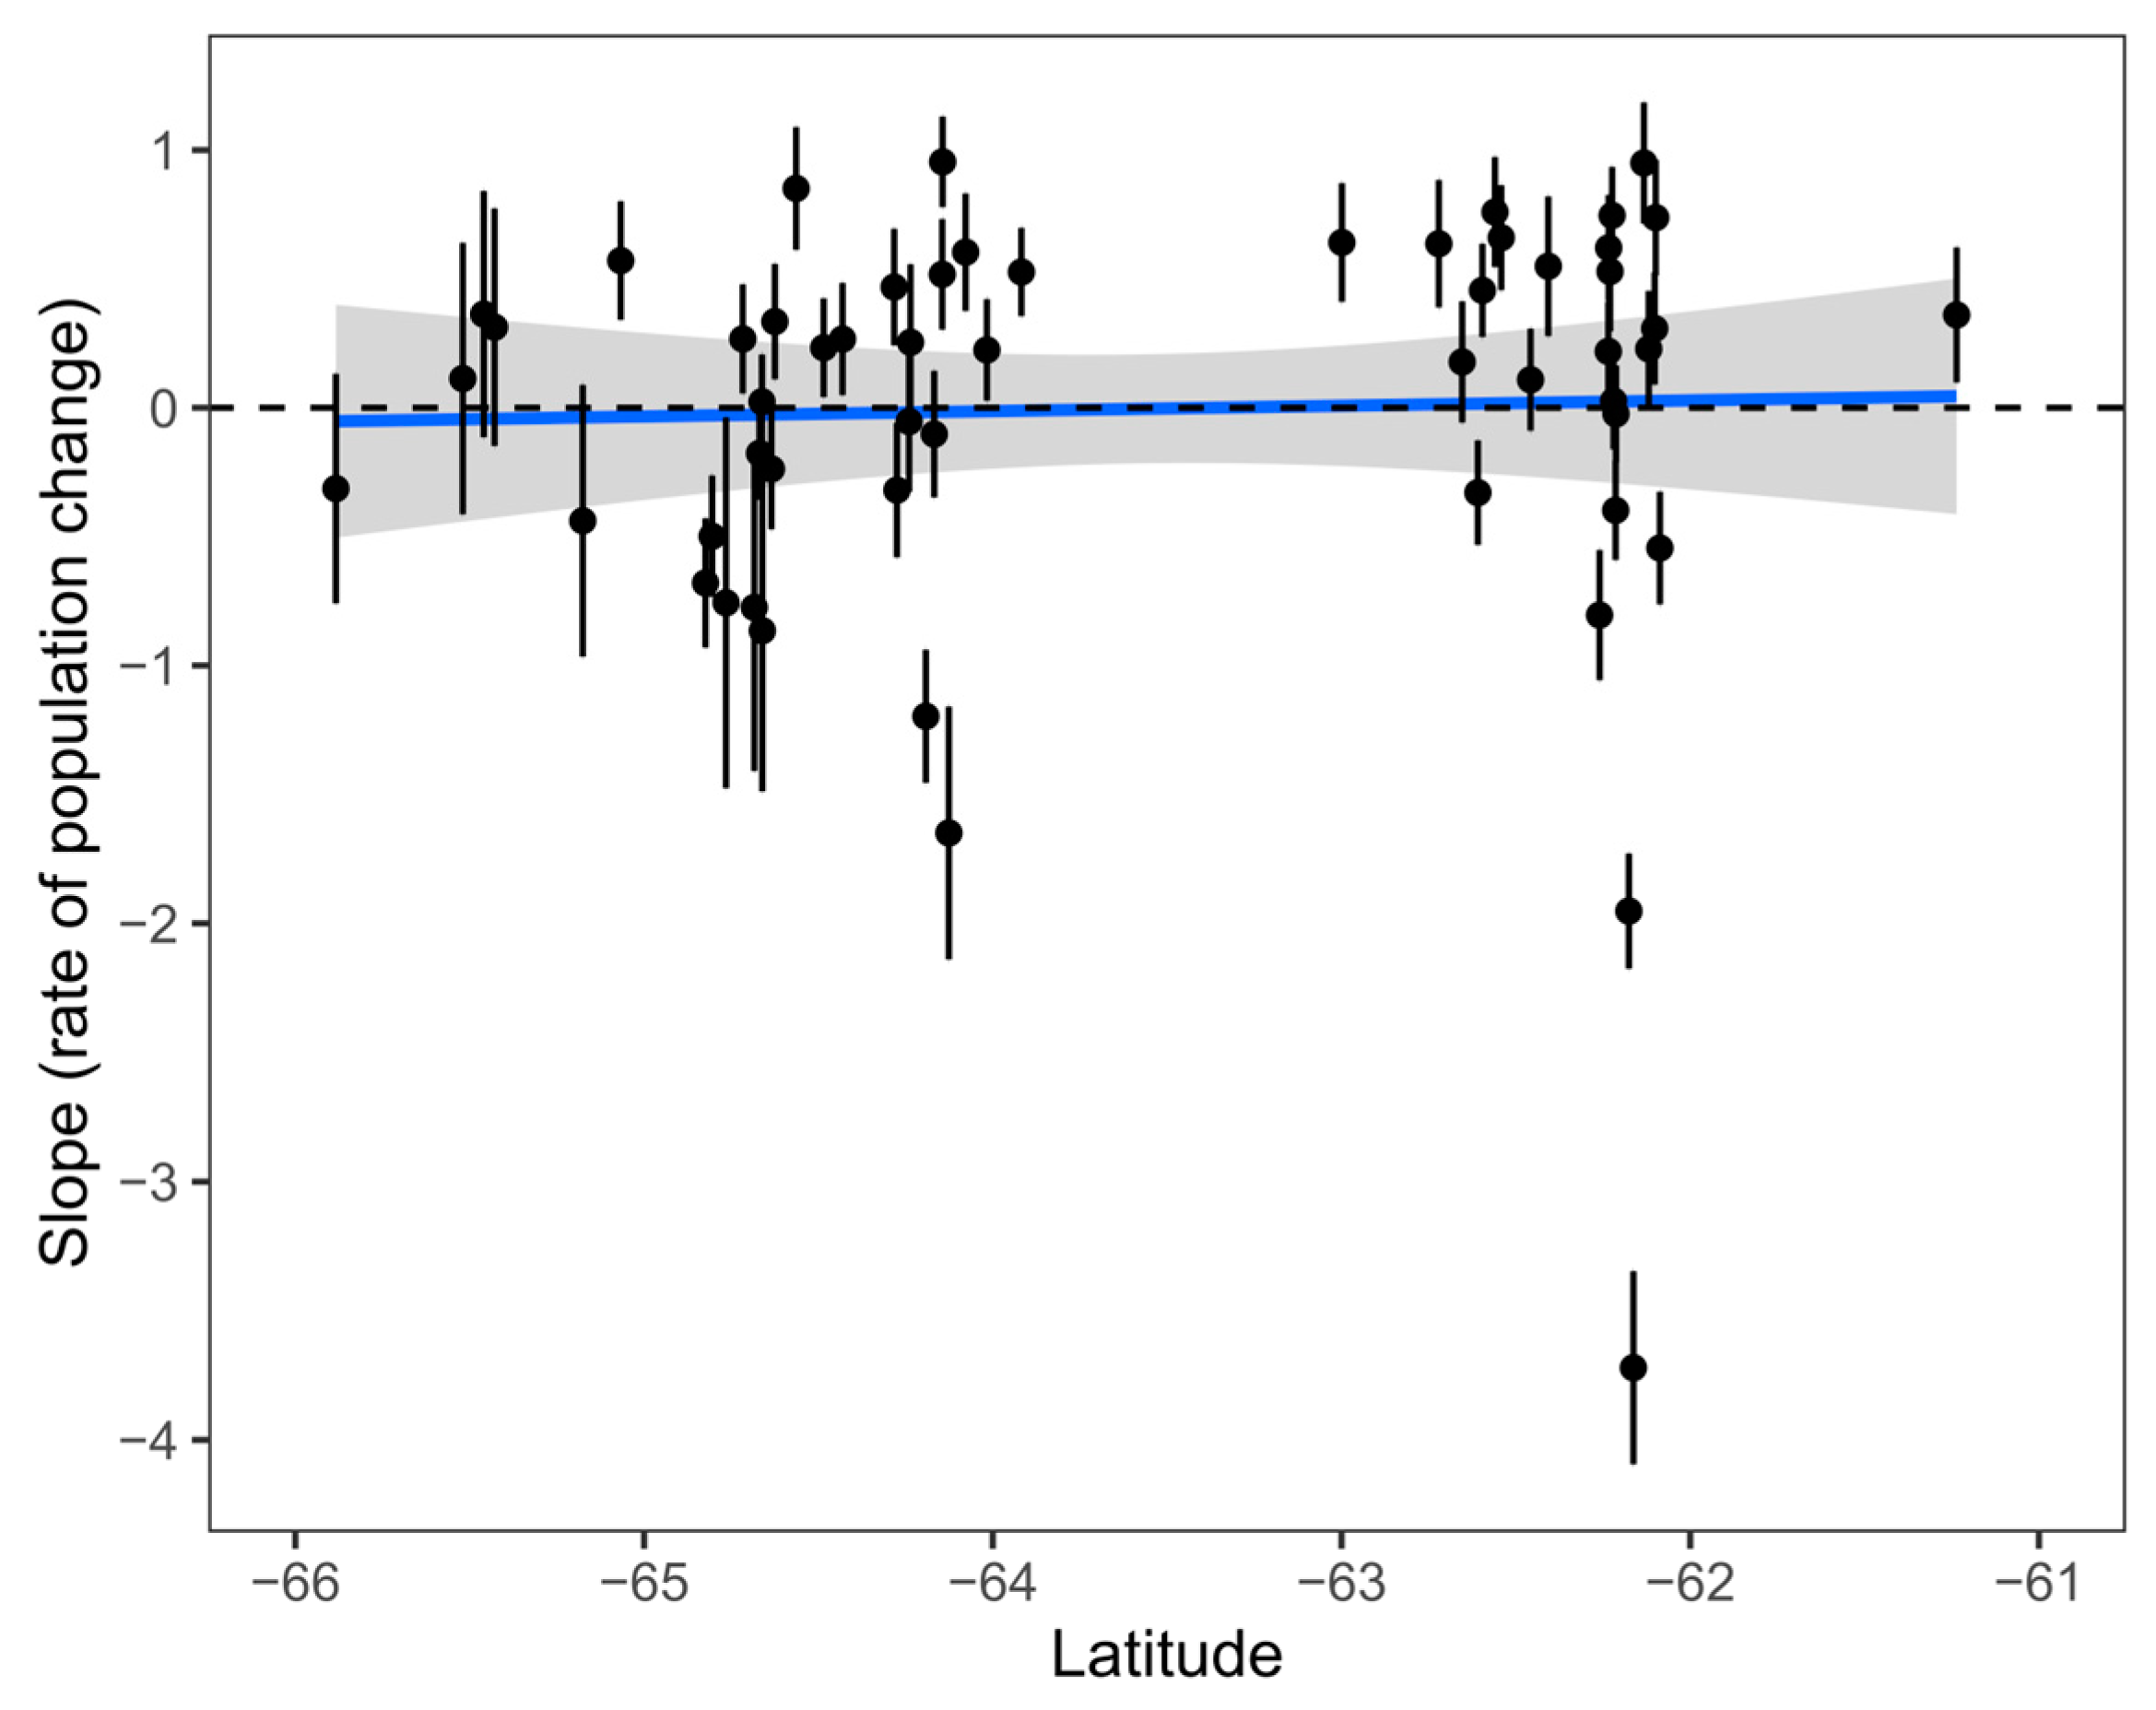
| Model inference | Random intercepts were incorrectly presented as random slopes (population change), with standard deviations halved. | Random slopes give latitudinal variation in population change. |
| Model prediction | Prediction did not include random effects. | Predicted with random effects to obtain accurate site-level predictions. |
| Model prediction | Prediction did not propagate model uncertainty (assumed the posterior mean was the true size of the population). | Used the entire posterior sample to propagate uncertainty of prediction to rates of population change. |
| Model prediction | Extrapolated population predictions far beyond observed data (back to 1960). | Attempted to limit extrapolation of population trends beyond observed data. Limited predictions to 1980–2019 and calculated 30-year population change between 1990 and 2019. |
Disclaimer/Publisher’s Note: The statements, opinions and data contained in all publications are solely those of the individual author(s) and contributor(s) and not of MDPI and/or the editor(s). MDPI and/or the editor(s) disclaim responsibility for any injury to people or property resulting from any ideas, methods, instructions or products referred to in the content. |
© 2024 by the authors. Licensee MDPI, Basel, Switzerland. This article is an open access article distributed under the terms and conditions of the Creative Commons Attribution (CC BY) license (https://creativecommons.org/licenses/by/4.0/).
Share and Cite
Oosthuizen, W.C.; Christian, M.; Ngwenya, M. Comment on Krüger, L. Decreasing Trends of Chinstrap Penguin Breeding Colonies in a Region of Major and Ongoing Rapid Environmental Changes Suggest Population Level Vulnerability. Diversity 2023, 15, 327. Diversity 2024, 16, 651. https://doi.org/10.3390/d16110651
Oosthuizen WC, Christian M, Ngwenya M. Comment on Krüger, L. Decreasing Trends of Chinstrap Penguin Breeding Colonies in a Region of Major and Ongoing Rapid Environmental Changes Suggest Population Level Vulnerability. Diversity 2023, 15, 327. Diversity. 2024; 16(11):651. https://doi.org/10.3390/d16110651
Chicago/Turabian StyleOosthuizen, W. Chris, Murray Christian, and Mzabalazo Ngwenya. 2024. "Comment on Krüger, L. Decreasing Trends of Chinstrap Penguin Breeding Colonies in a Region of Major and Ongoing Rapid Environmental Changes Suggest Population Level Vulnerability. Diversity 2023, 15, 327" Diversity 16, no. 11: 651. https://doi.org/10.3390/d16110651
APA StyleOosthuizen, W. C., Christian, M., & Ngwenya, M. (2024). Comment on Krüger, L. Decreasing Trends of Chinstrap Penguin Breeding Colonies in a Region of Major and Ongoing Rapid Environmental Changes Suggest Population Level Vulnerability. Diversity 2023, 15, 327. Diversity, 16(11), 651. https://doi.org/10.3390/d16110651