
The Characterization and Phylogenetic Implications of the Mitochondrial Genomes of Antheminia varicornis and Carpocoris purpureipennis (Hemiptera: Pentatomidae)


Abstract
:1. Introduction
2. Materials and Methods
2.1. Sample Collection and DNA Extraction
2.2. Mitogenome Sequencing, Assembly and Annotation
2.3. Bioinformatic Analyses
2.4. Phylogenetic Analyses
3. Results and Discussion
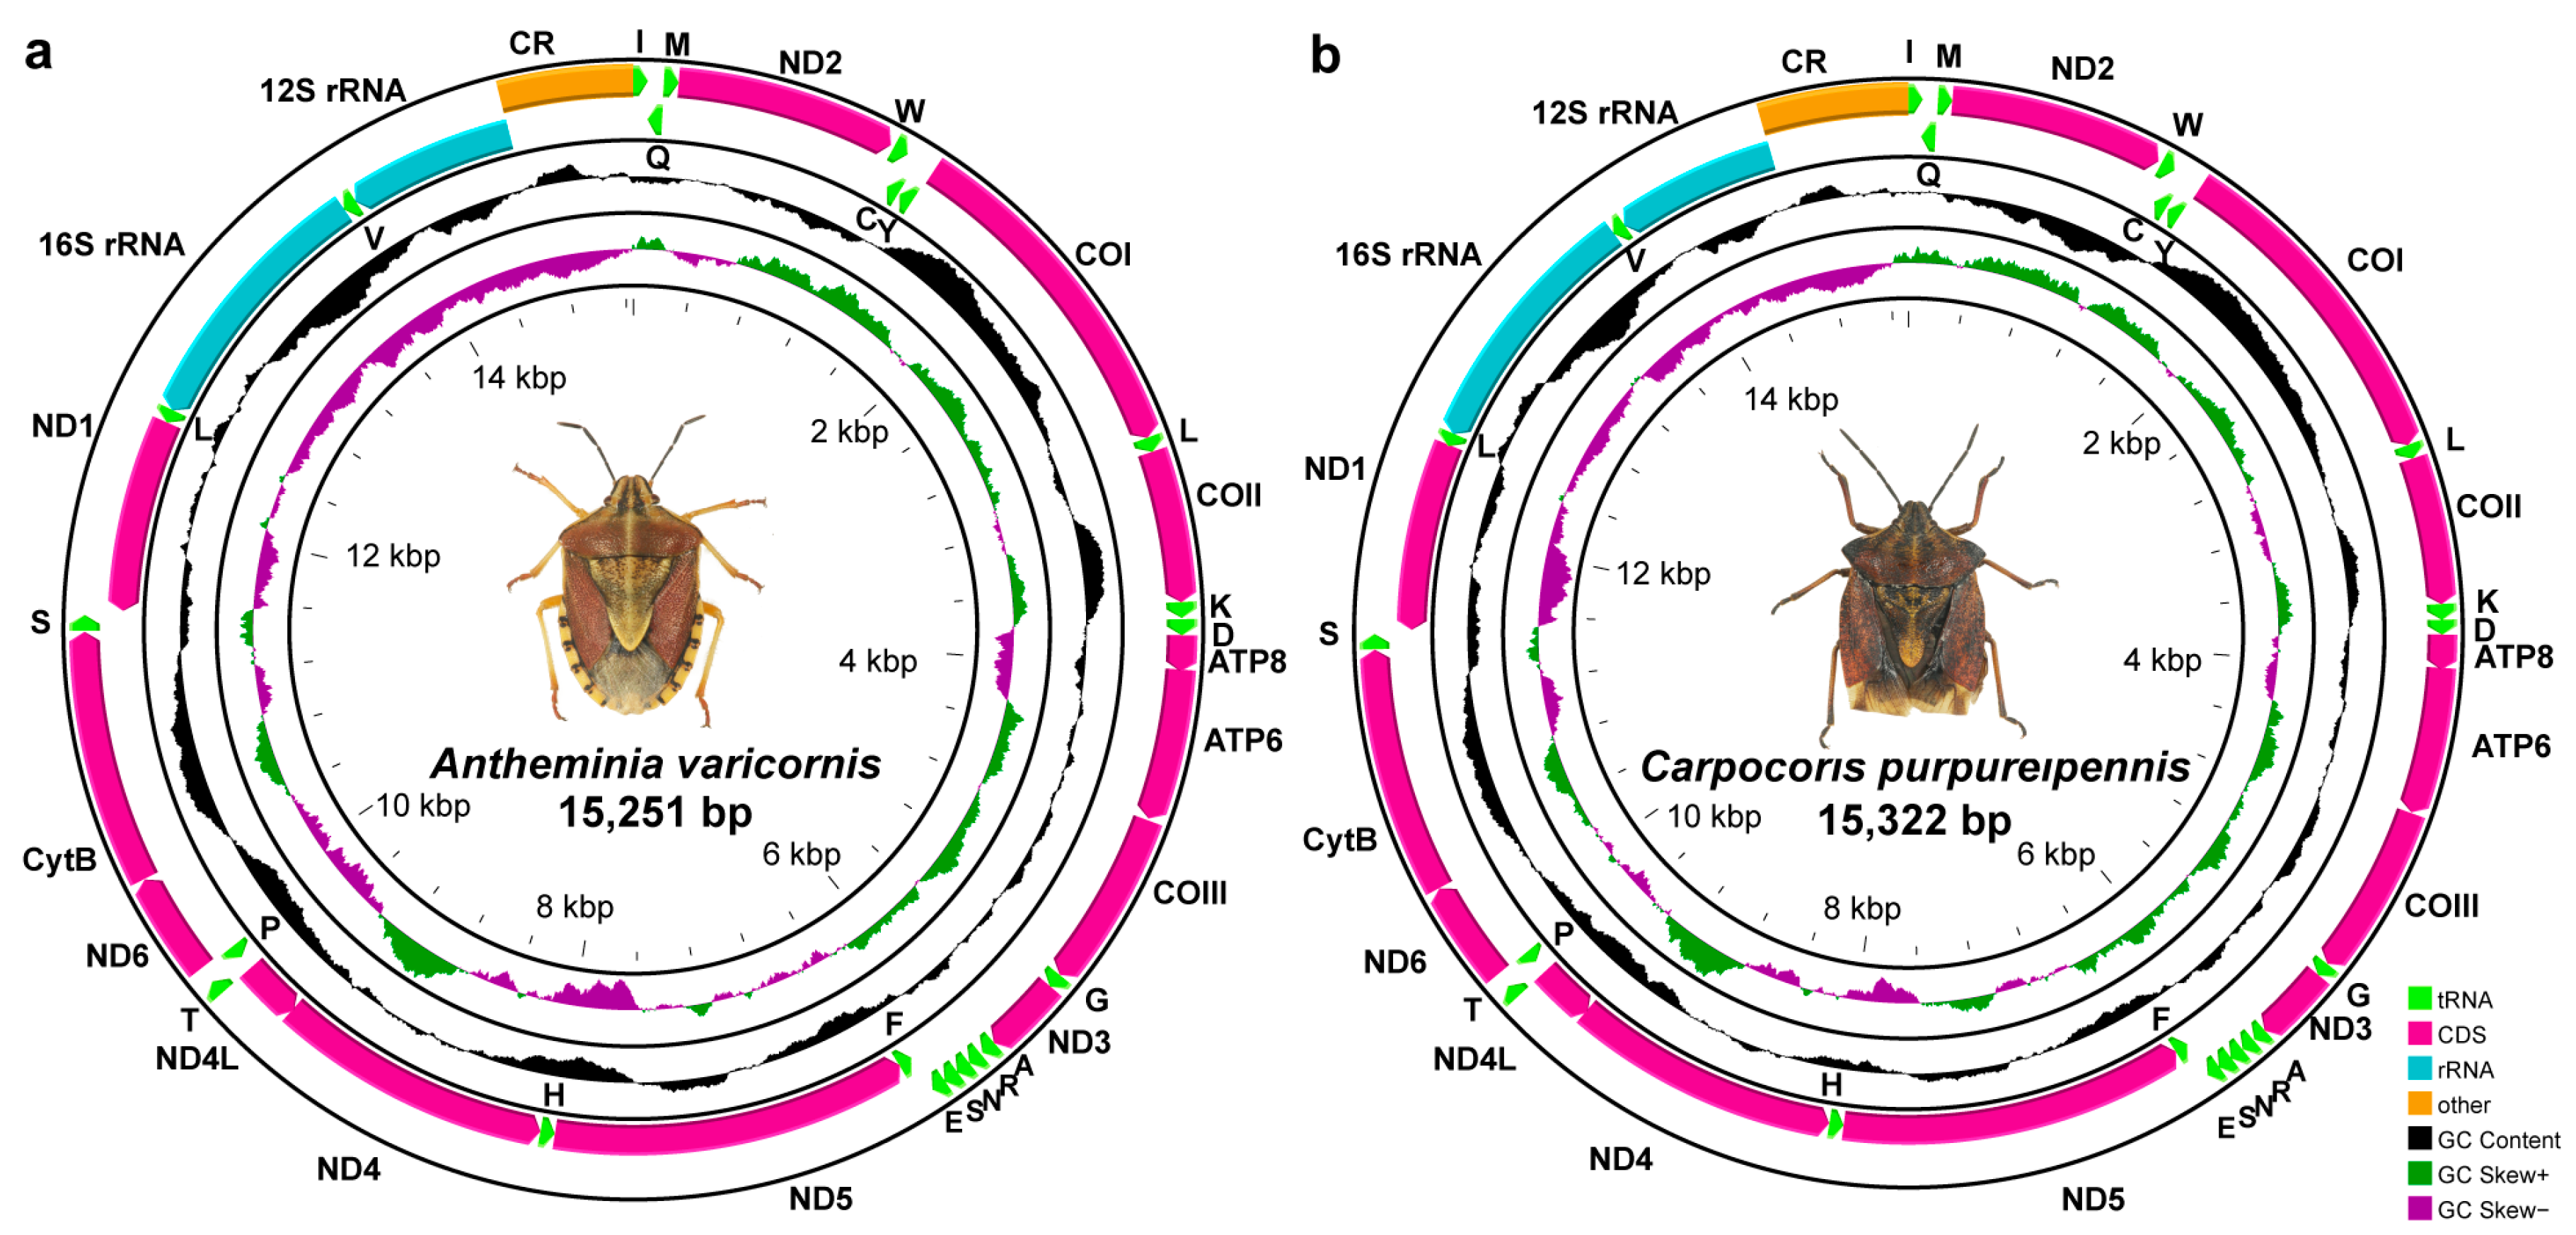
3.1. Mitogenome Organization and Composition
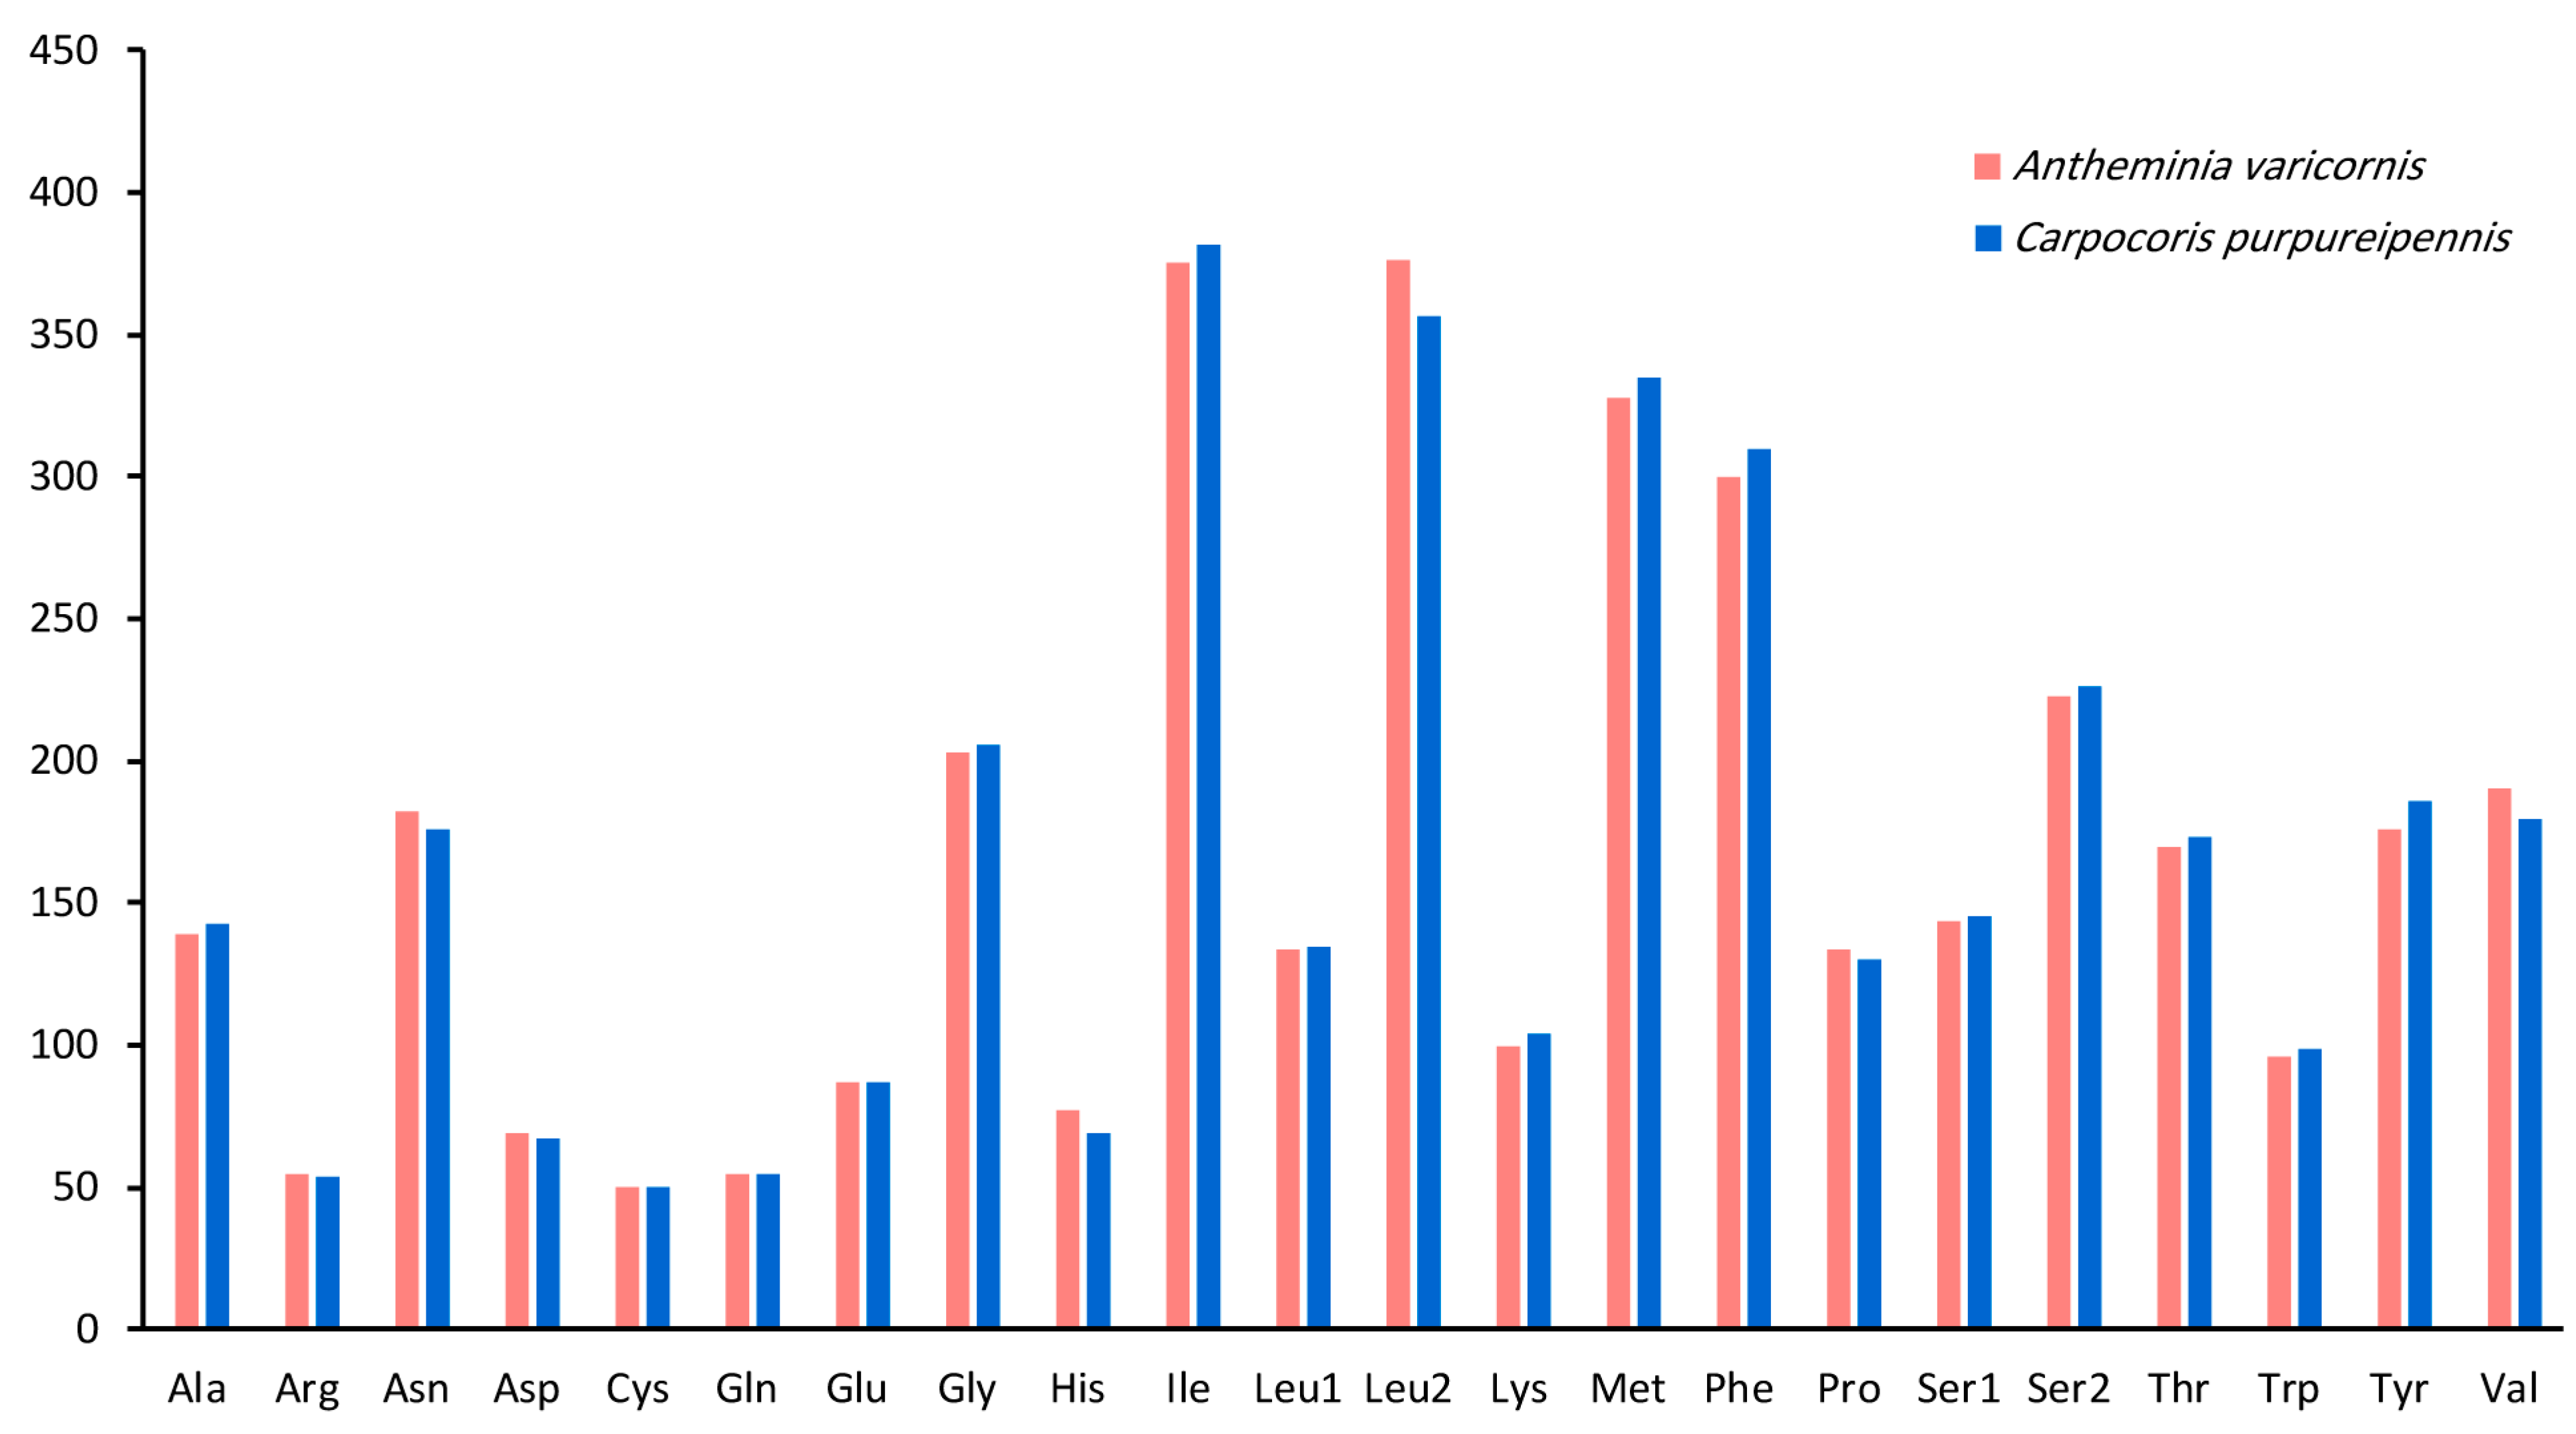
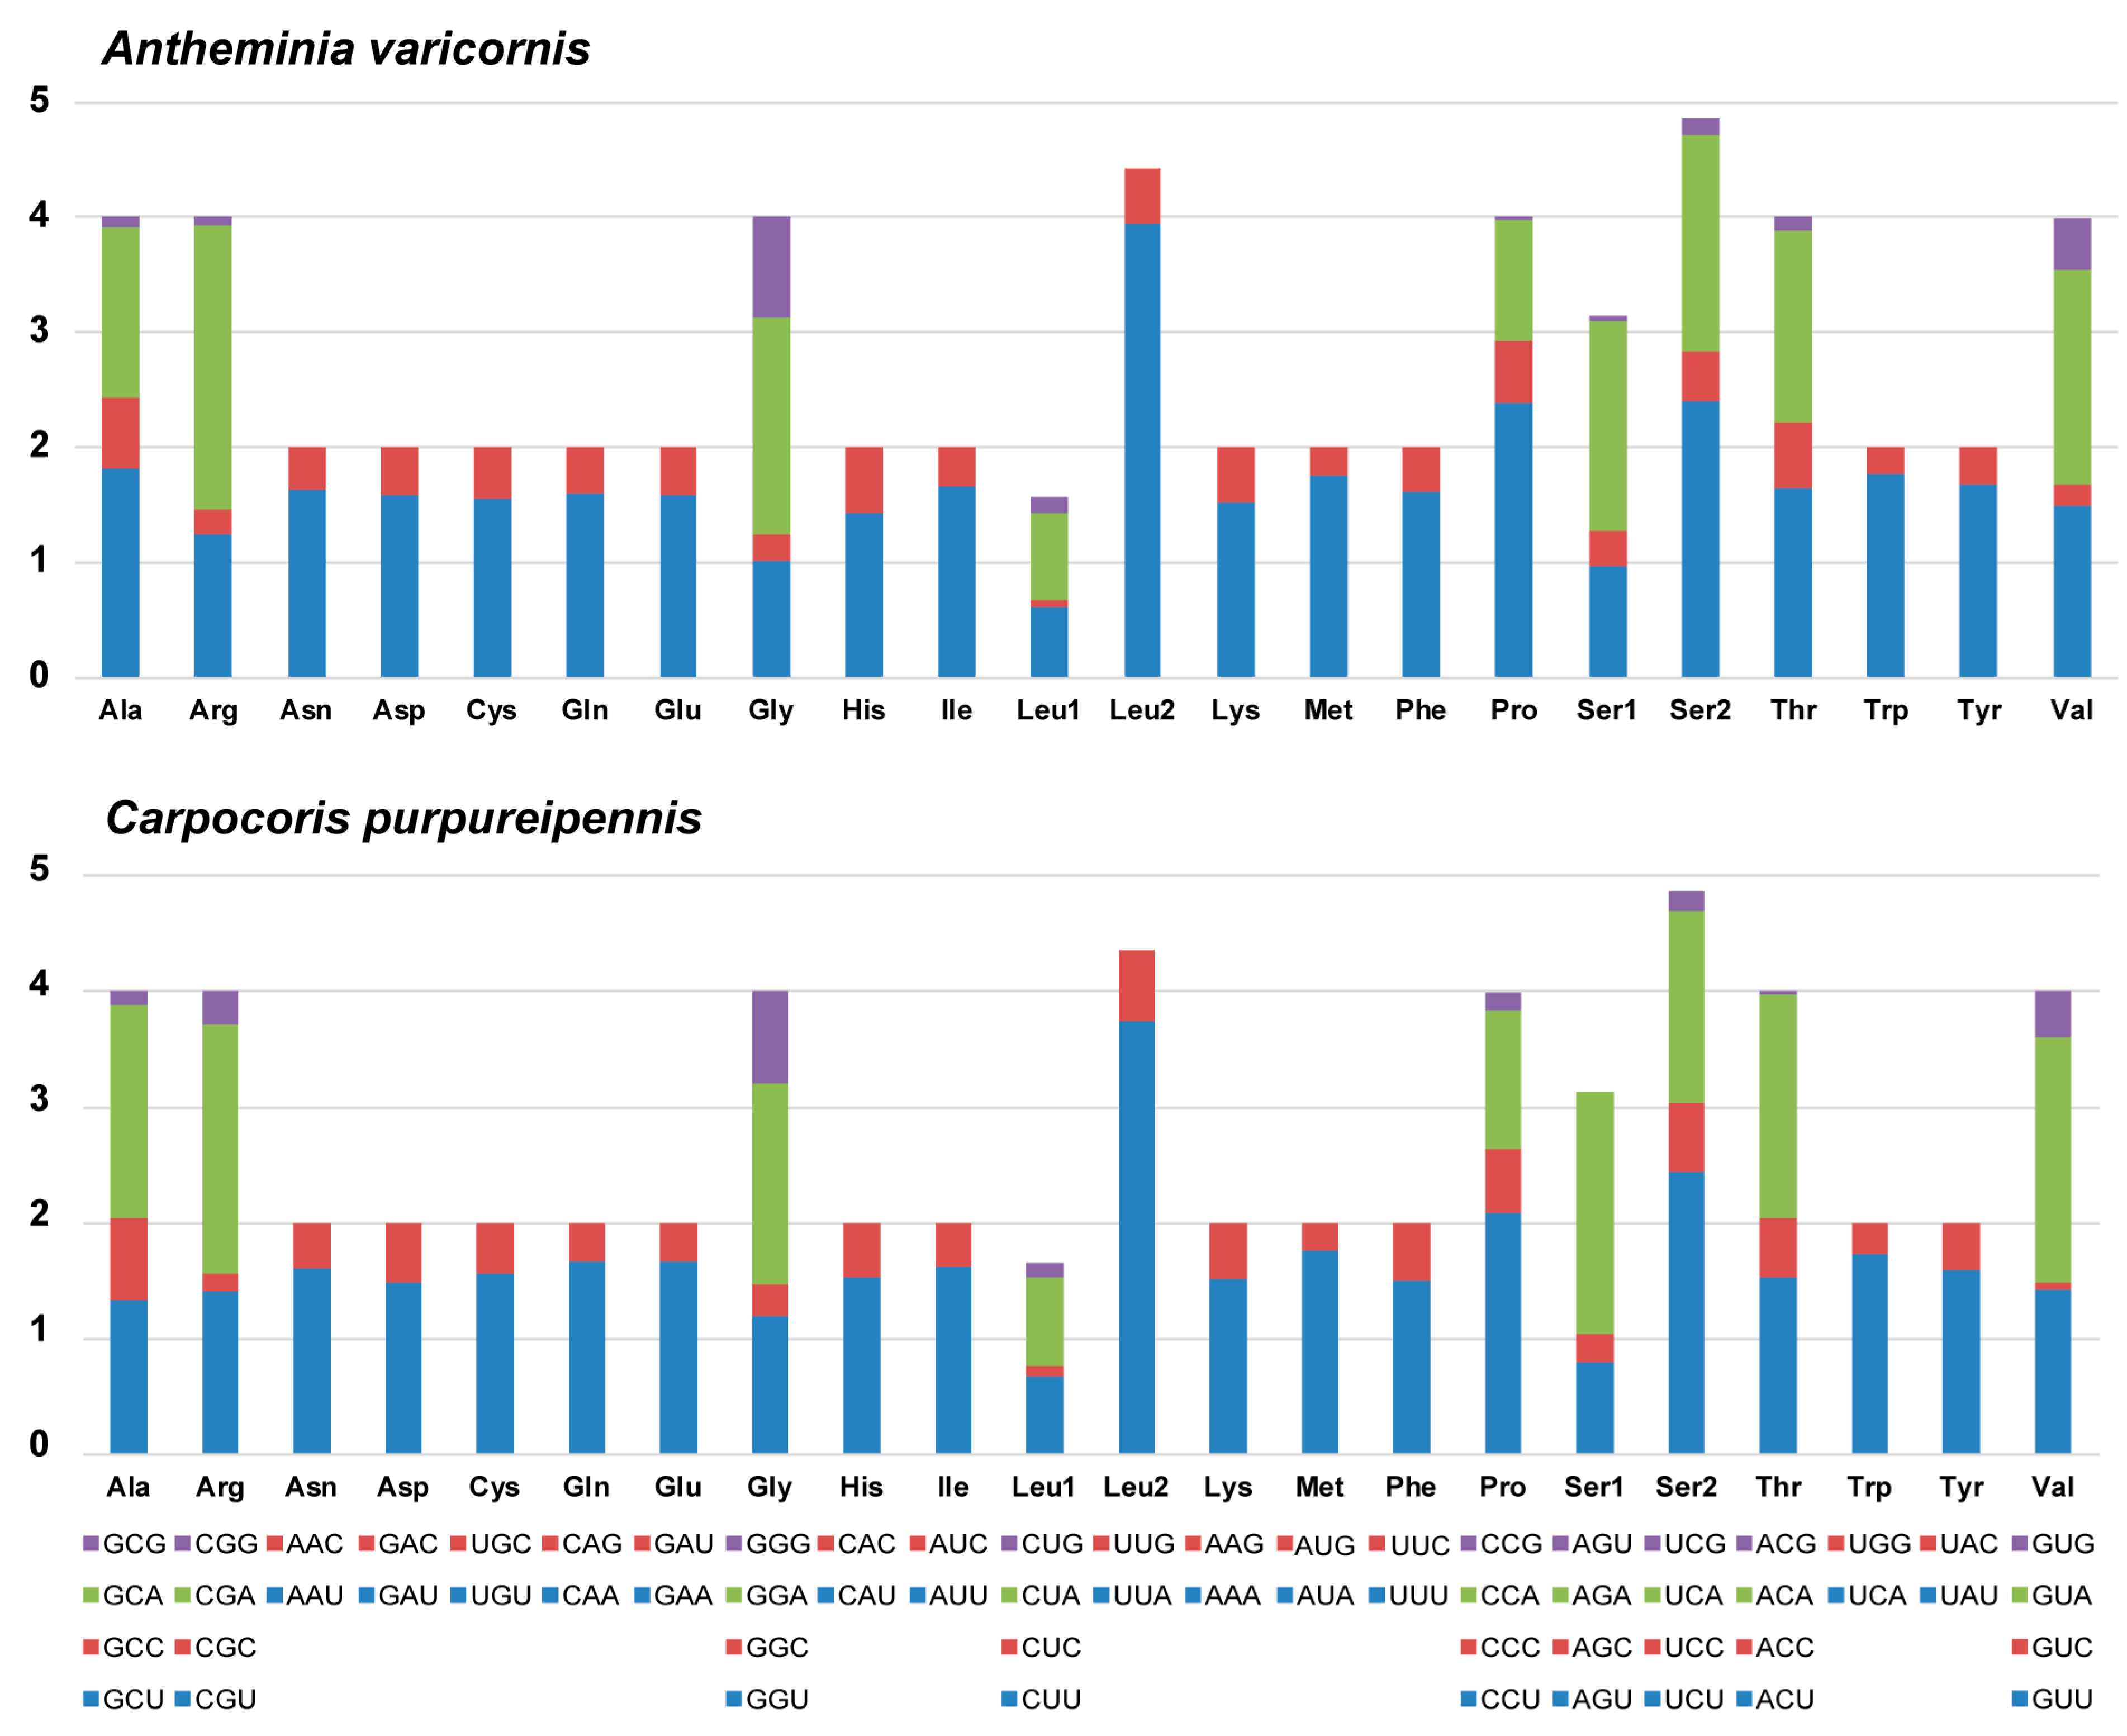
3.2. Protein-Coding Genes and Codon Usage
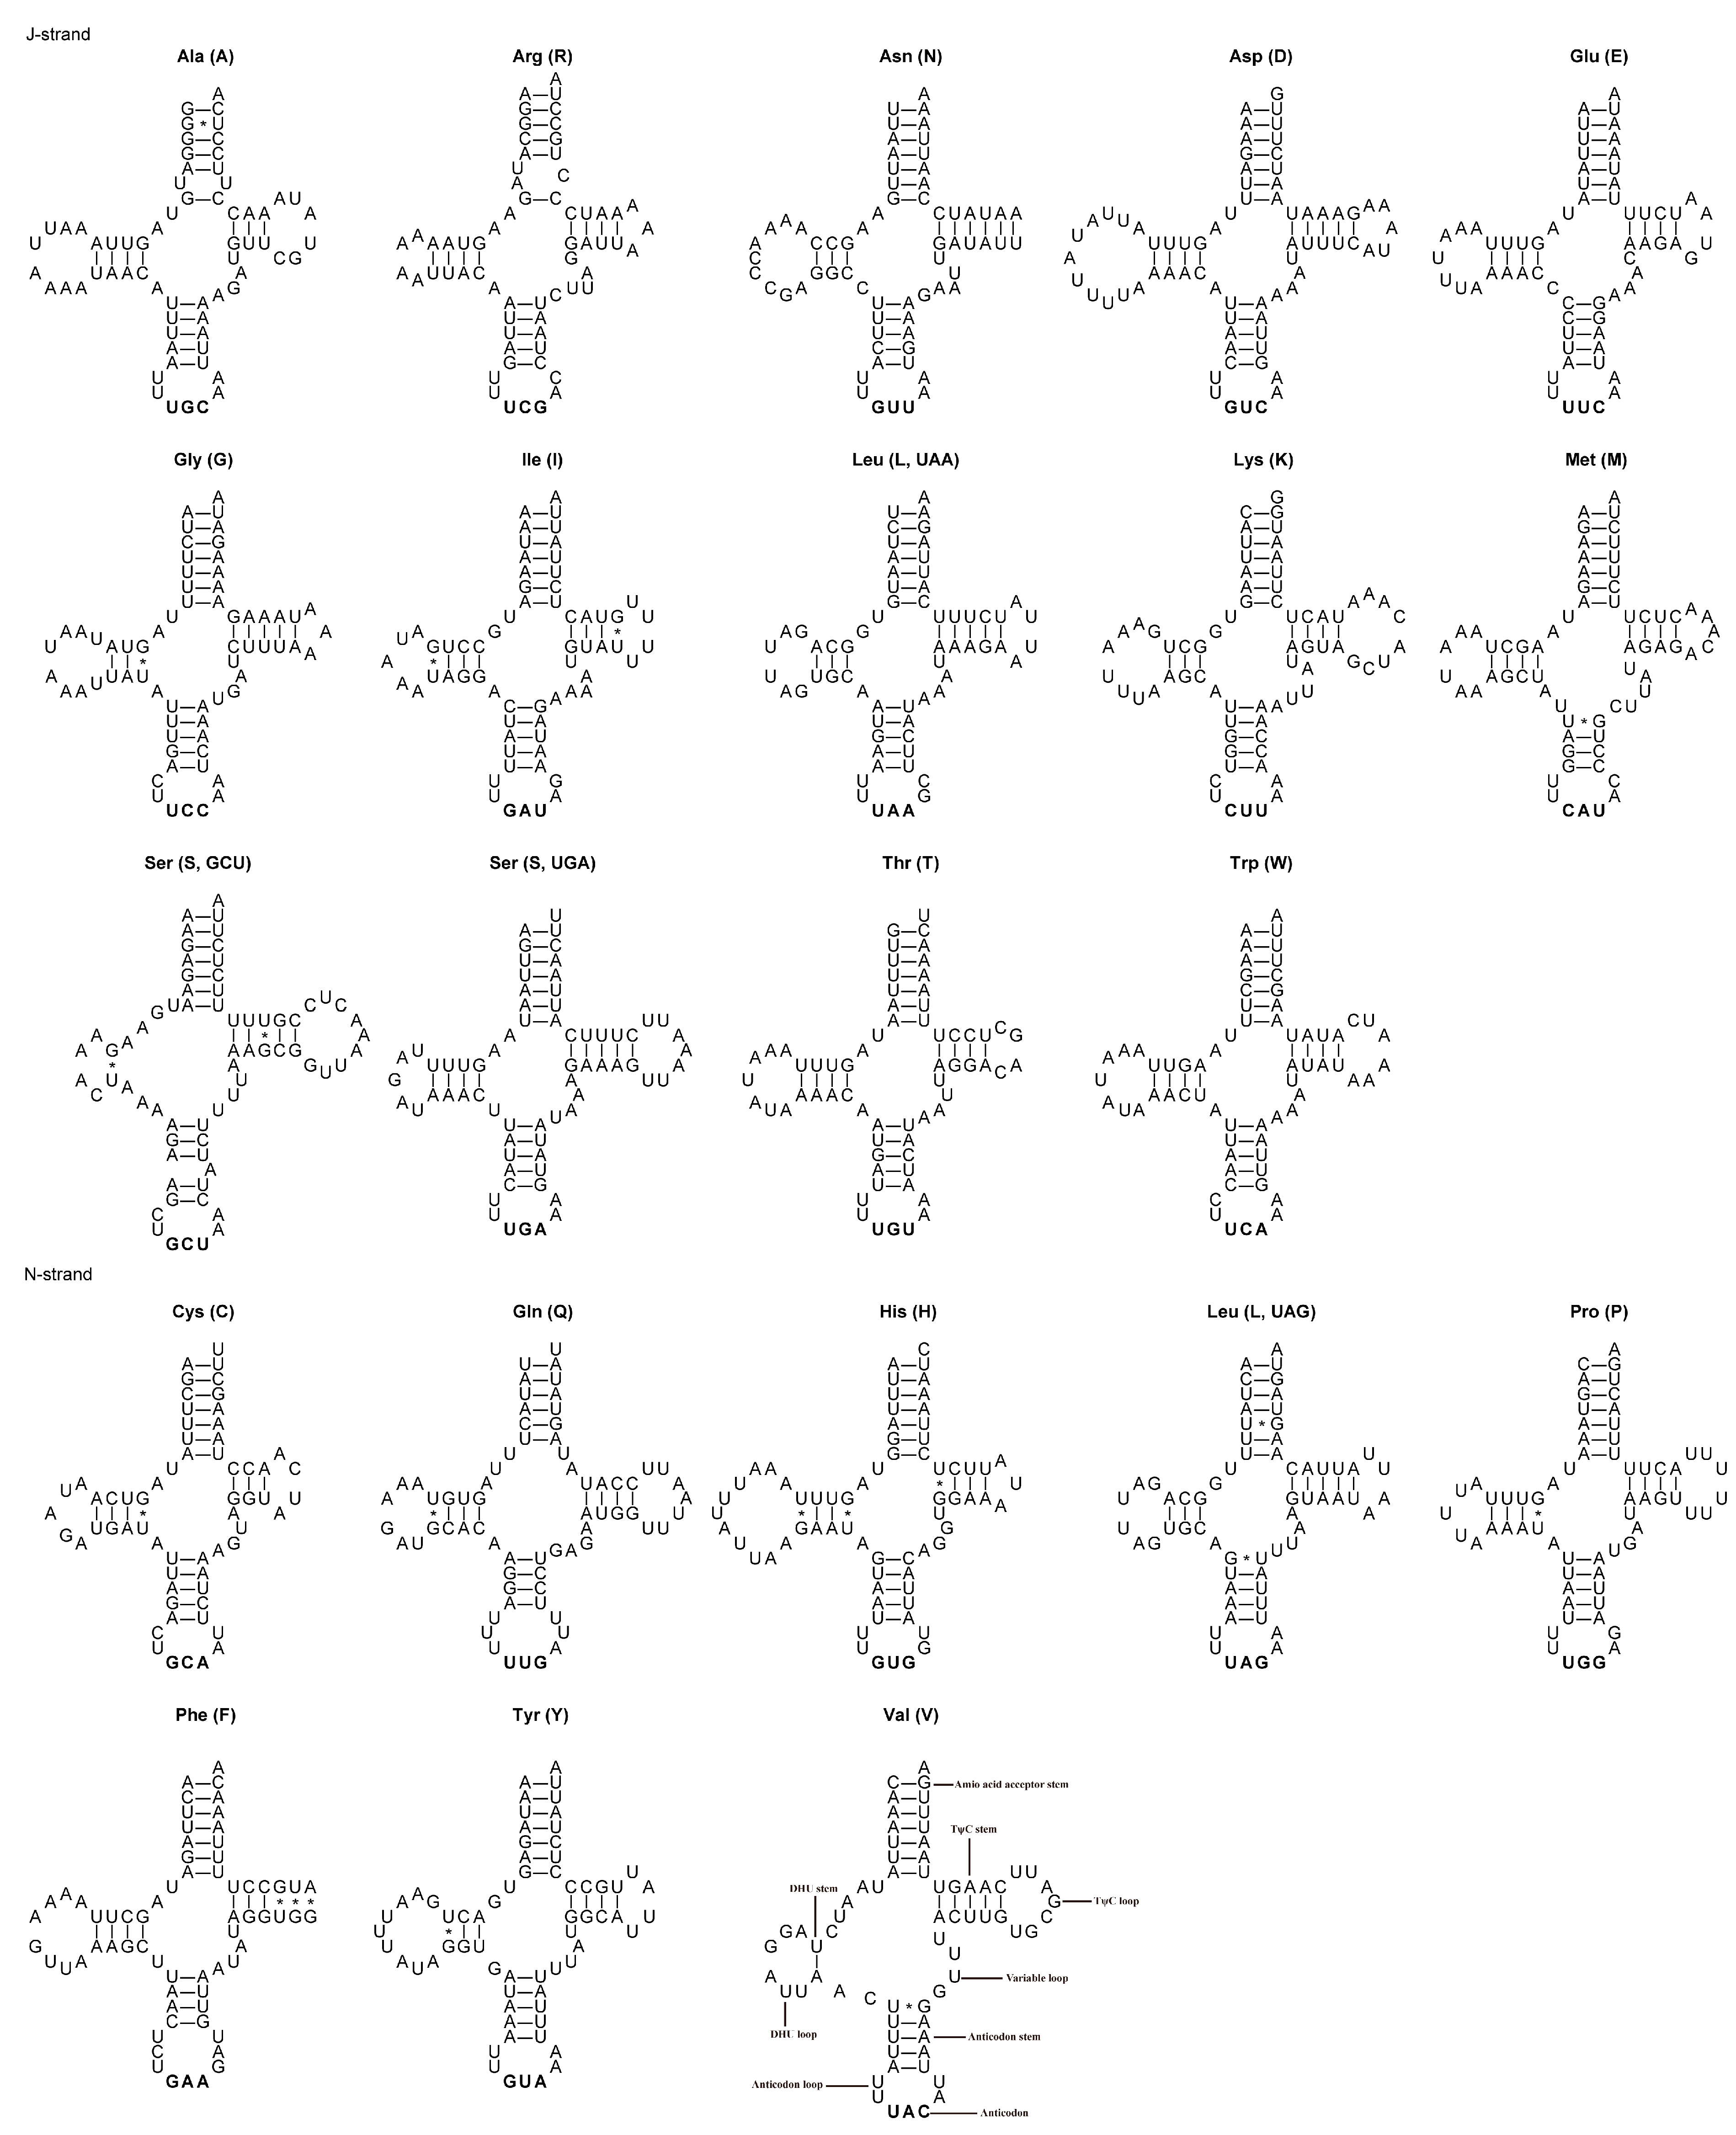
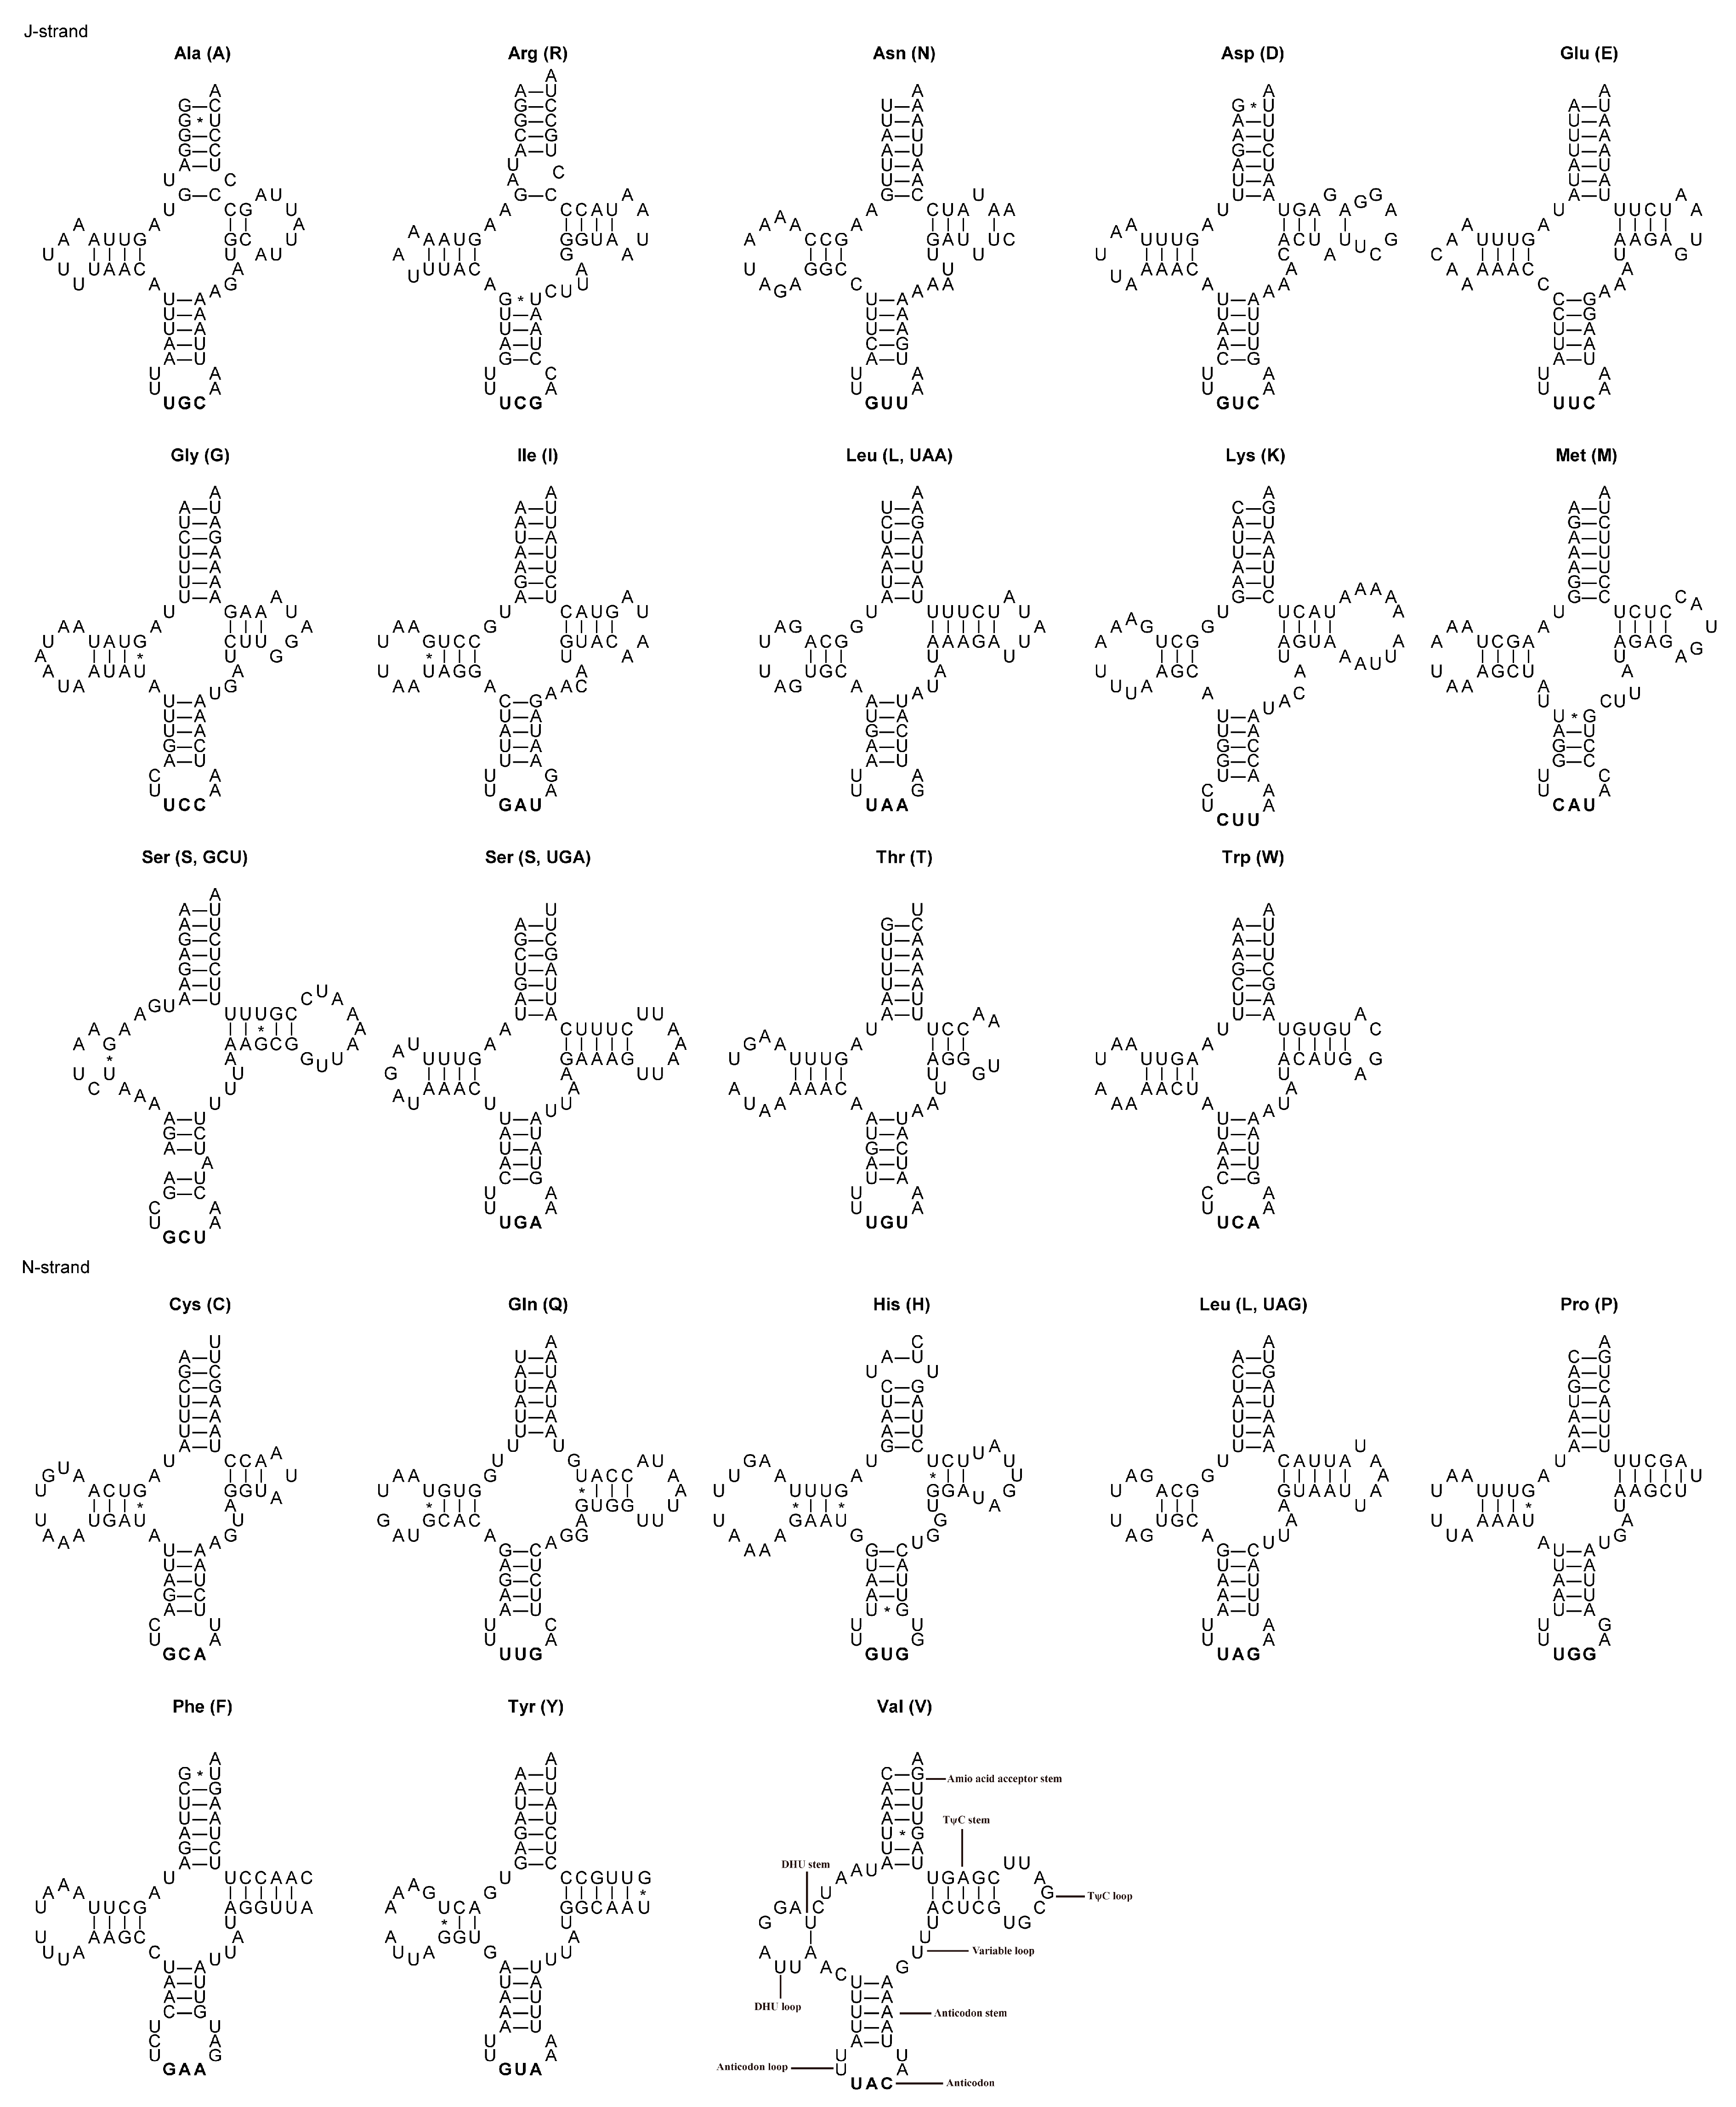
3.3. tRNAs, rRNAs and Control Region
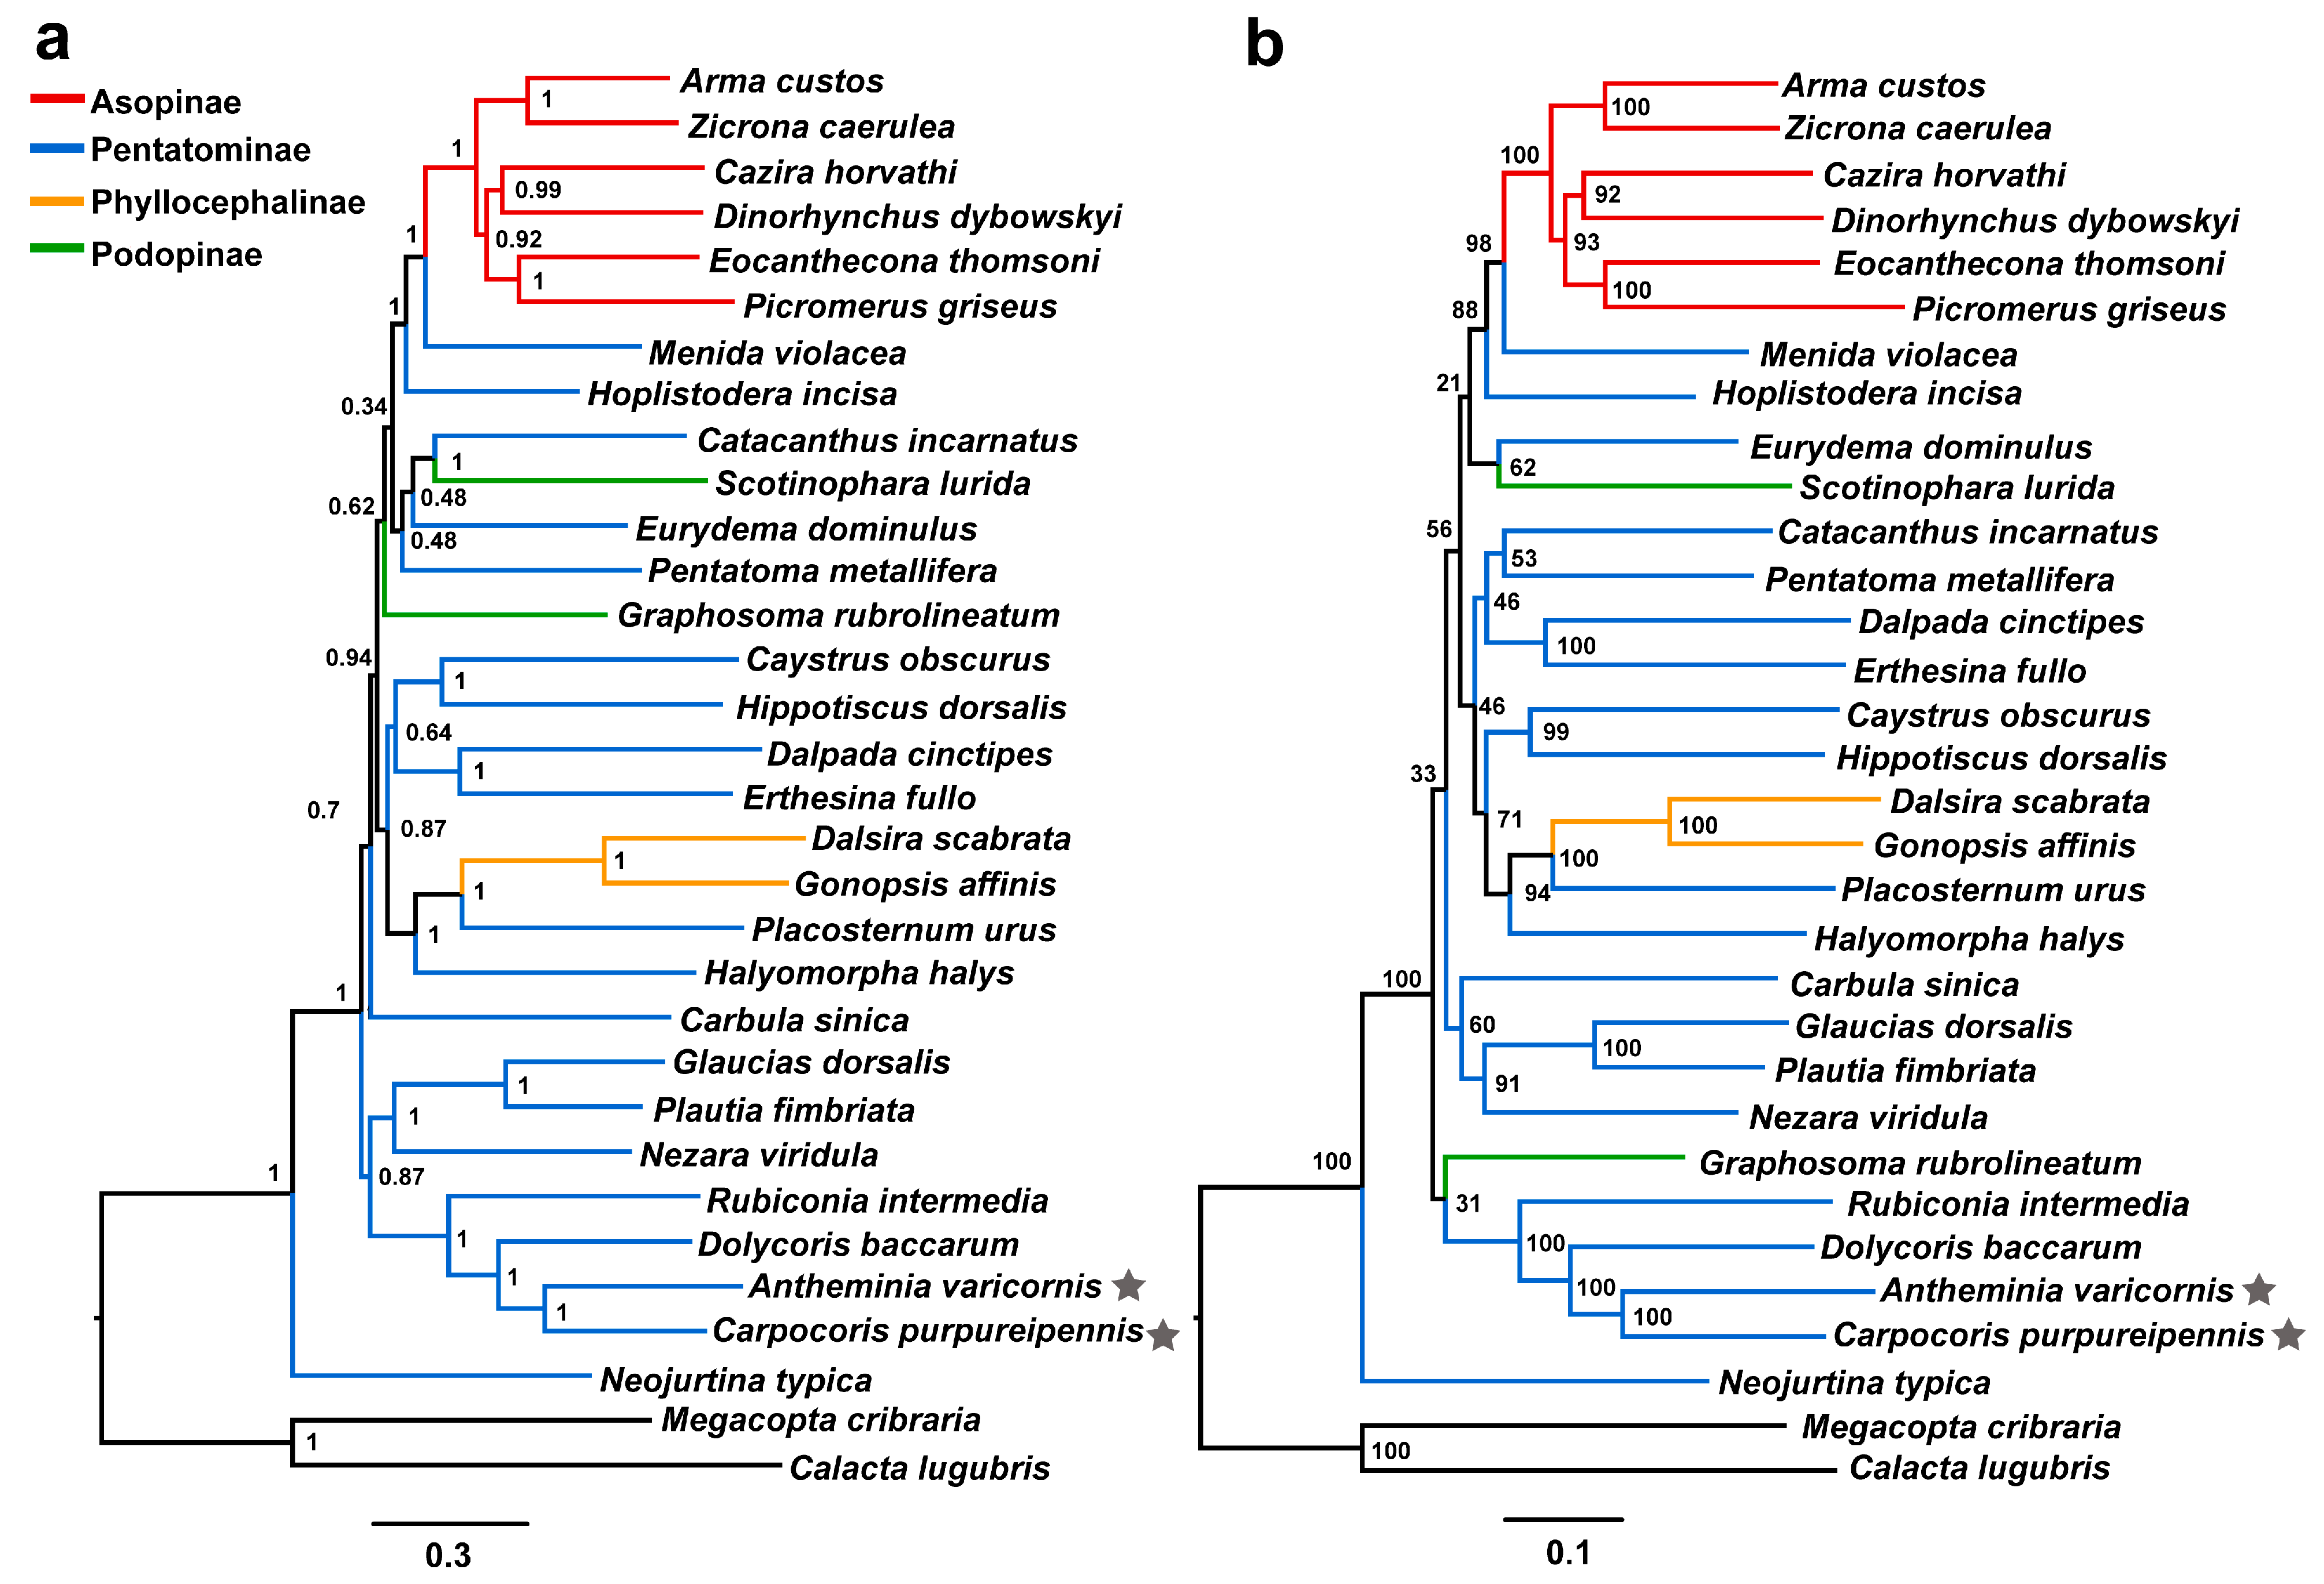
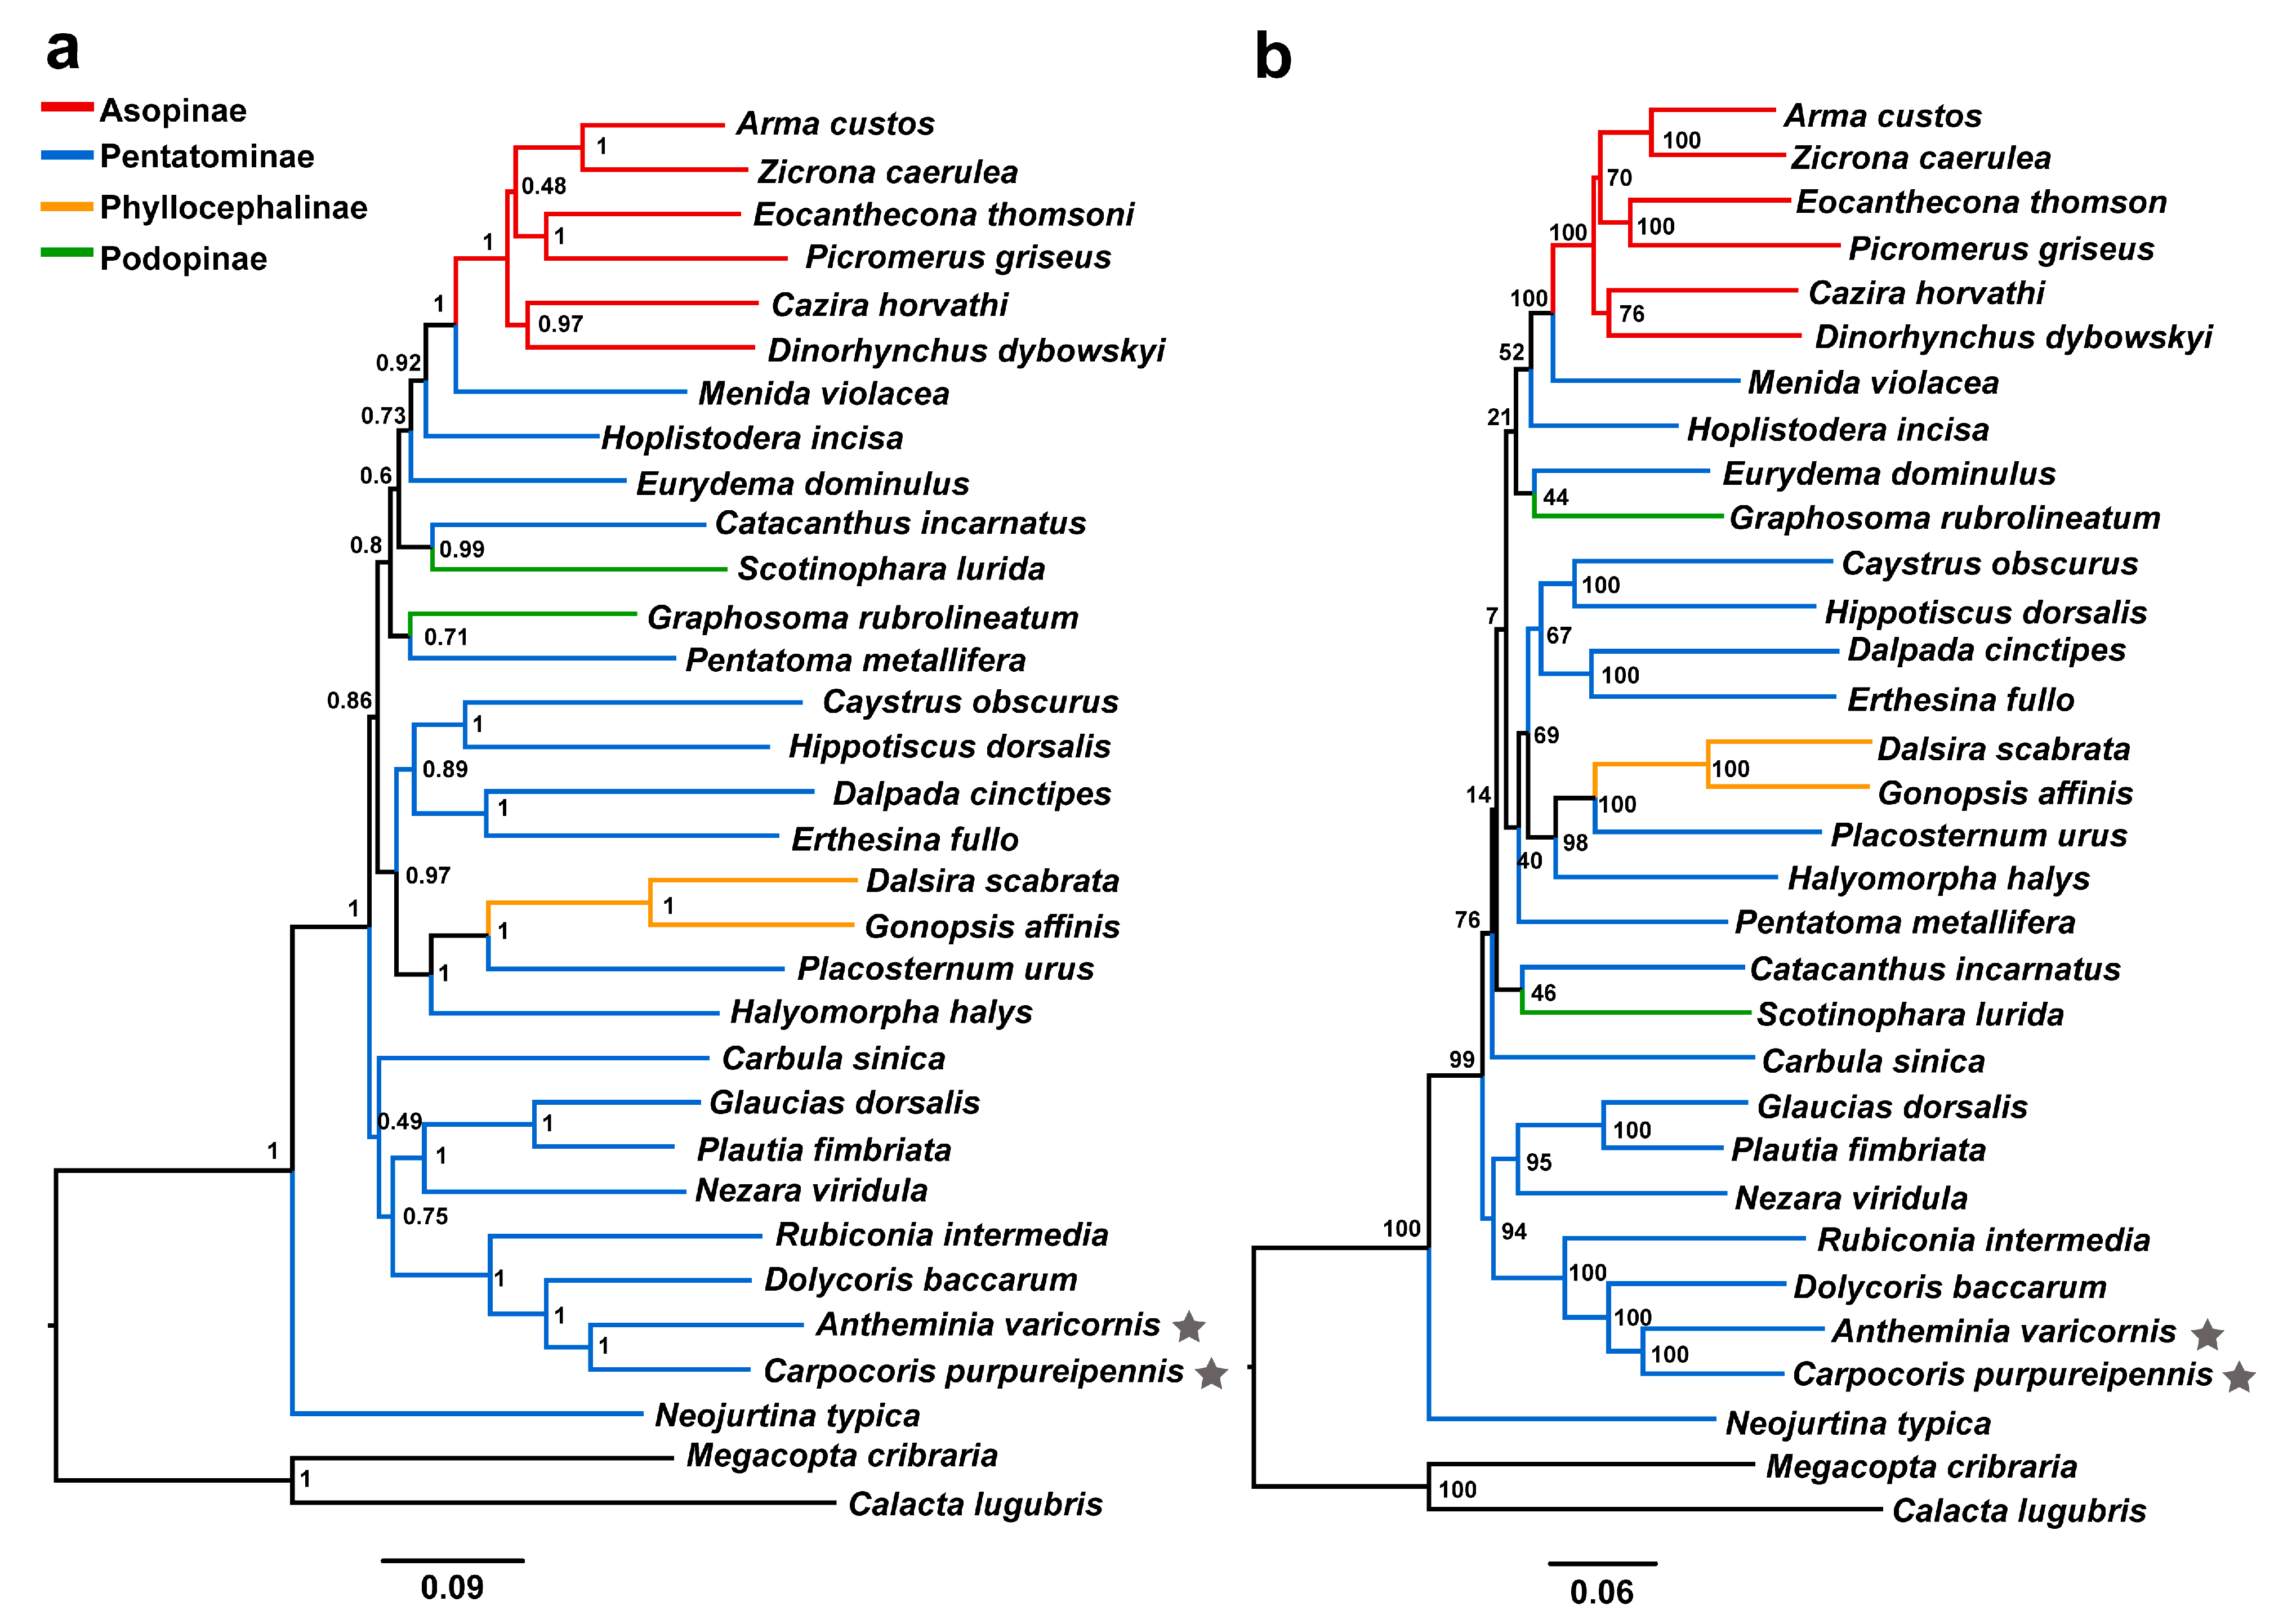
3.4. Phylogenetic Relationships
4. Conclusions
Author Contributions
Funding
Institutional Review Board Statement
Data Availability Statement
Conflicts of Interest
References
- Wolstenholme, D.R. Animal mitochondrial DNA: Structure and evolution. Int. Rev. Cytol. 1992, 141, 173–216. [Google Scholar] [PubMed]
- Boore, J.L. Animal mitochondrial genomes. Nucleic Acids Res. 1999, 27, 1767–1780. [Google Scholar] [CrossRef] [PubMed]
- Cameron, S.L. Insect mitochondrial genomics: Implications for evolution and phylogeny. Annu. Rev. Entomol. 2014, 59, 95–117. [Google Scholar] [CrossRef] [PubMed]
- Brown, W.M.; George, M.; Wilson, A.C. Rapid evolution of animal mitochondrial DNA. Proc. Natl. Acad. Sci. USA 1979, 76, 1967–1971. [Google Scholar] [CrossRef]
- Curole, J.P.; Kocher, T.D. Mitogenomics: Digging deeper with complete mitochondrial genomes. Trends Ecol. Evol. 1999, 14, 394–398. [Google Scholar] [CrossRef]
- Song, F.; Li, H.; Liu, G.H.; Wang, W.; James, P.; Colwell, D.D.; Tran, A.; Gong, S.; Cai, W.; Shao, R. Mitochondrial Genome Fragmentation Unites the Parasitic Lice of Eutherian Mammals. Syst. Biol. 2019, 68, 430–440. [Google Scholar] [CrossRef]
- Du, Z.; Hasegawa, H.; Cooley, J.R.; Simon, C.; Yoshimura, J.; Cai, W.; Sota, T.; Li, H. Mitochondrial Genomics Reveals Shared Phylogeographic Patterns and Demographic History among Three Periodical Cicada Species Groups. Mol. Biol. Evol. 2019, 36, 1187–1200. [Google Scholar] [CrossRef]
- Camacho, M.A.; Cadar, D.; Horváth, B.; Merino-Viteri, A.; Murienne, J. Revised phylogeny from complete mitochondrial genomes of phyllostomid bats resolves subfamilial classification. Zool. J. Linn. Soc. 2022, 196, 1591–1607. [Google Scholar] [CrossRef]
- Ge, X.; Peng, L.; Vogler, A.P.; Morse, J.C.; Yang, L.; Sun, C.; Wang, B. Massive gene rearrangements of mitochondrial genomes and implications for the phylogeny of Trichoptera (Insecta). Syst. Entomol. 2022, 48, 278–295. [Google Scholar] [CrossRef]
- Nielsen, M.; Margaryan, A.; Nielsen, T.L.; Enghoff, H.; Allentoft, M.E. Complete mitochondrial genomes from museum specimens clarify millipede evolution in the Eastern Arc Mountains. Zool. J. Linn. Soc. 2022, 196, 924–939. [Google Scholar] [CrossRef]
- Kunde, M.N.; Barlow, A.; Klittich, A.M.; Yakupova, A.; Patel, R.P.; Fickel, J.; Forster, D.W. First mitogenome phylogeny of the sun bear Helarctos malayanus reveals a deep split between Indochinese and Sundaic lineages. Ecol. Evol. 2023, 13, e9969. [Google Scholar] [CrossRef] [PubMed]
- Xing, Z.P.; Liang, X.; Wang, X.; Hu, H.Y.; Huang, Y.X. Novel gene rearrangement pattern in mitochondrial genome of Ooencyrtusplautus Huang & Noyes, 1994: New gene order in Encyrtidae (Hymenoptera, Chalcidoidea). Zookeys 2022, 1124, 1–21. [Google Scholar] [PubMed]
- Pakrashi, A.; Patidar, A.; Singha, D.; Kumar, V.; Tyagi, K. Comparative analysis of the two suborders of Thysanoptera and characterization of the complete mitochondrial genome of Thrips parvispinus. Arch. Insect Biochem. Physiol. 2023, 114, e22010. [Google Scholar] [CrossRef] [PubMed]
- Wu, Y.-Z.; Rédei, D.; Eger, J., Jr.; Wang, Y.-H.; Wu, H.-Y.; Carapezza, A.; Kment, P.; Cai, B.; Sun, X.-Y.; Guo, P.-L.; et al. Phylogeny and the colourful history of jewel bugs (Insecta: Hemiptera: Scutelleridae). Cladistics 2017, 34, 502–516. [Google Scholar] [CrossRef] [PubMed]
- Zhang, D.L.; Li, M.; Li, T.; Yuan, J.J.; Bu, W.J. A mitochondrial genome of Micronectidae and implications for its phylogenetic position. Int. J. Biol. Macromol. 2018, 119, 747–757. [Google Scholar] [CrossRef]
- Dong, X.; Wang, K.; Tang, Z.; Zhang, Y.; Yi, W.; Xue, H.; Zheng, C.; Bu, W. Phylogeny of Coreoidea based on mitochondrial genomes show the paraphyly of Coreidae and Alydidae. Arch. Insect Biochem. Physiol. 2022, 110, e21878. [Google Scholar] [CrossRef]
- Liu, X.; He, J.; Du, Z.; Zhang, R.; Cai, W.; Li, H. Weak genetic structure of flower thrips Frankliniella intonsa in China revealed by mitochondrial genomes. Int. J. Biol. Macromol. 2023, 231, 123301. [Google Scholar] [CrossRef]
- Li, H.; Leavengood, J.M.; Chapman, E.G., Jr.; Burkhardt, D.; Song, F.; Jiang, P.; Liu, J.; Zhou, X.; Cai, W. Mitochondrial phylogenomics of Hemiptera reveals adaptive innovations driving the diversification of true bugs. Proc. R. Soc. B Biol. Sci. 2017, 284, 20171223. [Google Scholar] [CrossRef]
- Yang, H.; Li, T.; Dang, K.; Bu, W. Compositional and mutational rate heterogeneity in mitochondrial genomes and its effect on the phylogenetic inferences of Cimicomorpha (Hemiptera: Heteroptera). BMC Genom. 2018, 19, 264. [Google Scholar] [CrossRef]
- Liu, Y.; Li, H.; Song, F.; Zhao, Y.; Wilson, J.J.; Cai, W. Higher-level phylogeny and evolutionary history of Pentatomomorpha (Hemiptera: Heteroptera) inferred from mitochondrial genome sequences. Syst. Entomol. 2019, 44, 810–819. [Google Scholar] [CrossRef]
- Zheng, C.; Ye, Z.; Zhu, X.; Zhang, H.; Dong, X.; Chen, P.; Bu, W. Integrative taxonomy uncovers hidden species diversity in the rheophilic genus Potamometra (Hemiptera: Gerridae). Zool. Scr. 2019, 49, 174–186. [Google Scholar] [CrossRef]
- Xu, S.; Wu, Y.; Liu, Y.; Zhao, P.; Chen, Z.; Song, F.; Li, H.; Cai, W. Comparative Mitogenomics and Phylogenetic Analyses of Pentatomoidea (Hemiptera: Heteroptera). Genes 2021, 12, 1306. [Google Scholar] [CrossRef] [PubMed]
- Zhu, X.; Zheng, C.; Dong, X.; Zhang, H.; Ye, Z.; Xue, H.; Bu, W. Species boundary and phylogeographical pattern provide new insights into the management efforts of Megacopta cribraria (Hemiptera: Plataspidae), a bean bug invading North America. Pest Manag. Sci. 2022, 78, 4871–4881. [Google Scholar] [CrossRef] [PubMed]
- Francoso, E.; Zuntini, A.R.; Ricardo, P.C.; Araujo, N.D.; Silva, J.P.N.; Brown, M.J.F.; Arias, M.C. The complete mitochondrial genome of Trigonisca nataliae (Hymenoptera, Apidae) assemblage reveals heteroplasmy in the control region. Gene 2023, 881, 147621. [Google Scholar] [CrossRef] [PubMed]
- Zhou, S.X.; Wei, N.; Jost, M.; Wanke, S.; Rees, M.; Liu, Y.; Zhou, R.C. The Mitochondrial Genome of the Holoparasitic Plant Thonningia sanguinea Provides Insights into the Evolution of the Multichromosomal Structure. Genome Biol. Evol. 2023, 15, e155. [Google Scholar] [CrossRef] [PubMed]
- Ke, S.J.; Liu, D.K.; Tu, X.D.; He, X.; Zhang, M.M.; Zhu, M.J.; Zhang, D.Y.; Zhang, C.L.; Lan, S.R.; Liu, Z.J. Apostasia Mitochondrial Genome Analysis and Monocot Mitochondria Phylogenomics. Int. J. Mol. Sci. 2023, 24, 7837. [Google Scholar] [CrossRef]
- Kim, Y.K.; Jo, S.; Cheon, S.H.; Hong, J.R.; Kim, K.J. Ancient Horizontal Gene Transfers from Plastome to Mitogenome of a Nonphotosynthetic Orchid, Gastrodia pubilabiata (Epidendroideae, Orchidaceae). Int. J. Mol. Sci. 2023, 24, 11448. [Google Scholar] [CrossRef] [PubMed]
- Xia, C.Y.; Li, J.L.; Zuo, Y.W.; He, P.; Zhang, H.; Zhang, X.X.; Wang, B.R.; Zhang, J.B.; Yu, J.; Deng, H.P. Complete mitochondrial genome of Thuja sutchuenensis and its implications on evolutionary analysis of complex mitogenome architecture in Cupressaceae. BMC Plant Biol. 2023, 23, 84. [Google Scholar] [CrossRef]
- Wang, Y.; Chen, S.J.; Chen, J.J.; Chen, C.J.; Lin, X.J.; Peng, H.; Zhao, Q.; Wang, X.Y. Characterization and phylogenetic analysis of the complete mitochondrial genome sequence of Photinia serratifolia. Sci. Rep. 2023, 13, 770. [Google Scholar] [CrossRef]
- Rider, D.; Schwertner, C.; Vilimova, J.; Redei, D.; Kment, P.; Thomas, D. Higher Systematics of the Pentatomoidea; CRC Press: Boca Raton, FL, USA, 2018. [Google Scholar]
- Cesari, M.; Maistrello, L.; Ganzerli, F.; Dioli, P.; Rebecchi, L.; Guidetti, R. A pest alien invasion in progress: Potential pathways of origin of the brown marmorated stink bug Halyomorpha halys populations in Italy. J. Pest Sci. 2014, 88, 1–7. [Google Scholar] [CrossRef]
- Mi, Q.; Zhang, J.; Gould, E.; Chen, J.; Sun, Z.; Zhang, F. Biology, Ecology, and Management of Erthesina fullo (Hemiptera: Pentatomidae): A Review. Insects 2020, 11, 346. [Google Scholar] [CrossRef] [PubMed]
- Hua, J.; Li, M.; Dong, P.; Cui, Y.; Xie, Q.; Bu, W. Comparative and phylogenomic studies on the mitochondrial genomes of Pentatomomorpha (Insecta: Hemiptera: Heteroptera). BMC Genom. 2008, 9, 610. [Google Scholar] [CrossRef] [PubMed]
- Zhang, Q.L.; Yuan, M.L.; Shen, Y.Y. The complete mitochondrial genome of Dolycoris baccarum (Insecta: Hemiptera: Pentatomidae). Mitochondrial DNA 2013, 24, 469–471. [Google Scholar] [CrossRef] [PubMed]
- Yuan, M.L.; Zhang, Q.L.; Guo, Z.L.; Wang, J.; Shen, Y.Y. Comparative mitogenomic analysis of the superfamily Pentatomoidea (Insecta: Hemiptera: Heteroptera) and phylogenetic implications. BMC Genom. 2015, 16, 460. [Google Scholar] [CrossRef] [PubMed]
- Zhao, L.; Wei, J.; Zhao, W.; Chen, C.; Gao, X.; Zhao, Q. The complete mitochondrial genome of Pentatoma rufipes (Hemiptera, Pentatomidae) and its phylogenetic implications. Zookeys 2021, 1042, 51–72. [Google Scholar] [CrossRef] [PubMed]
- Lian, D.; Wei, J.; Chen, C.; Niu, M.; Zhang, H.; Zhao, Q. Comparative analysis and phylogeny of mitochondrial genomes of Pentatomidae (Hemiptera: Pentatomoidea). Front. Genet. 2022, 13, 1045193. [Google Scholar] [CrossRef] [PubMed]
- Roca-Cusachs, M.; Schwertner, C.F.; Kim, J.; Eger, J.; Grazia, J.; Jung, S. Opening Pandora’s box: Molecular phylogeny of the stink bugs (Hemiptera: Heteroptera: Pentatomidae) reveals great incongruences in the current classification. Syst. Entomol. 2021, 47, 36–51. [Google Scholar] [CrossRef]
- Chen, S.; Zhou, Y.; Chen, Y.; Gu, J. fastp: An ultra-fast all-in-one FASTQ preprocessor. Bioinformatics 2018, 34, i884–i890. [Google Scholar] [CrossRef]
- Meng, G.; Li, Y.; Yang, C.; Liu, S. MitoZ: A toolkit for animal mitochondrial genome assembly, annotation and visualization. Nucleic Acids Res. 2019, 47, e63. [Google Scholar] [CrossRef]
- Peng, Y.; Leung, H.C.; Yiu, S.M.; Chin, F.Y. IDBA-UD: A de novo assembler for single-cell and metagenomic sequencing data with highly uneven depth. Bioinformatics 2012, 28, 1420–1428. [Google Scholar] [CrossRef]
- Grant, J.R.; Enns, E.; Marinier, E.; Mandal, A.; Herman, E.K.; Chen, C.Y.; Graham, M.; Van Domselaar, G.; Stothard, P. Proksee: In-Depth characterization and visualization of bacterial genomes. Nucleic Acids Res. 2023, 51, W484–W492. [Google Scholar] [CrossRef]
- Kumar, S.; Stecher, G.; Li, M.; Knyaz, C.; Tamura, K. MEGA X: Molecular Evolutionary Genetics Analysis across Computing Platforms. Mol. Biol. Evol. 2018, 35, 1547–1549. [Google Scholar] [CrossRef] [PubMed]
- Katoh, K.; Standley, D.M. MAFFT Multiple Sequence Alignment Software Version 7: Improvements in Performance and Usability. Mol. Biol. Evol. 2013, 30, 772–780. [Google Scholar] [CrossRef] [PubMed]
- Zhang, D.; Gao, F.; Jakovlić, I.; Zou, H.; Zhang, J.; Li, W.X.; Wang, G.T. PhyloSuite: An integrated and scalable desktop platform for streamlined molecular sequence data management and evolutionary phylogenetics studies. Mol. Ecol. Resour. 2019, 20, 348–355. [Google Scholar] [CrossRef] [PubMed]
- Lanfear, R.; Frandsen, P.B.; Wright, A.M.; Senfeld, T.; Calcott, B. PartitionFinder 2: New Methods for Selecting Partitioned Models of Evolution for Molecular and Morphological Phylogenetic Analyses. Mol. Biol. Evol. 2017, 34, 772–773. [Google Scholar] [CrossRef] [PubMed]
- Ronquist, F.; Teslenko, M.; Van Der Mark, P.; Ayres, D.L.; Darling, A.; Hohna, S.; Larget, B.; Liu, L.; Suchard, M.A.; Huelsenbeck, J.P. MrBayes 3.2: Efficient Bayesian phylogenetic inference and model choice across a large model space. Syst. Biol. 2012, 61, 539–542. [Google Scholar] [CrossRef]
- Nguyen, L.T.; Schmidt, H.A.; Von Haeseler, A.; Minh, B.Q. IQ-TREE: A fast and effective stochastic algorithm for estimating maximum-likelihood phylogenies. Mol. Biol. Evol. 2015, 32, 268–274. [Google Scholar] [CrossRef]
- Clary, D.O.; Wolstenholme, D.R. The mitochondrial DNA molecule of Drosophila yakuba: Nucleotide sequence, gene organization, and genetic code. J. Mol. Evol. 1985, 22, 252–271. [Google Scholar] [CrossRef]
- Hassanin, A.; Leger, N.; Deutsch, J. Evidence for multiple reversals of asymmetric mutational constraints during the evolution of the mitochondrial genome of Metazoa, and consequences for phylogenetic inferences. Syst. Biol. 2005, 54, 277–298. [Google Scholar] [CrossRef]
- Ojala, D.; Montoya, J.; Attardi, G. tRNA punctuation model of RNA processing in human mitochondria. Nature 1981, 290, 470–474. [Google Scholar] [CrossRef]

| Family | Subfamily | Species | Accession Number |
|---|---|---|---|
| Pentatomidae | Asopinae | Arma custos | MT535604 |
| Cazira horvathi | NC_042817 | ||
| Dinorhynchus dybowskyi | NC_037724 | ||
| Eocanthecona thomsoni | NC_042816 | ||
| Picromerus griseus | NC_036418 | ||
| Zicrona caerulea | MW847250 | ||
| Pentatominae | Carbula sinica | KY069964 | |
| Catacanthus incarnatus | MF497716 | ||
| Caystrus obscurus | MF497717 | ||
| Dalpada cinctipes | MW847236 | ||
| Dolycoris baccarum | NC_020373 | ||
| Erthesina fullo | JQ743673 | ||
| Eurydema dominulus | MW847238 | ||
| Glaucias dorsalis | MW847239 | ||
| Halyomorpha halys | NC_013272 | ||
| Hippotiscus dorsalis | MW847240 | ||
| Hoplistodera incisa | MF620037 | ||
| Menida violacea | MK617948 | ||
| Neojurtina typica | MW847243 | ||
| Nezara viridula | NC_011755 | ||
| Pentatoma metallifera | MW847244 | ||
| Placosternum urus | MF497730 | ||
| Plautia fimbriata | MF497731 | ||
| Rubiconia intermedia | KP207596 | ||
| Phyllocephalinae | Dalsira scabrata | NC_037374 | |
| Gonopsis affinis | NC_036745 | ||
| Podopinae | Graphosoma rubrolineatum | NC_033875 | |
| Scotinophara lurida | NC_042815 | ||
| Plataspidae | Megacopta cribraria | OP123001 | |
| Calacta lugubris | NC_058965 |
| Datasets | Partition Names | Best Model |
|---|---|---|
| PCG123R | ND3, ATP6, COI, COIII, COII, CytB; | GTR + I + G |
| ND2, ND6, ATP8; | GTR + I + G | |
| ND1, ND4L, ND4, ND5; | GTR + I + G | |
| 12S rRNA, 16S rRNA. | GTR + I + G | |
| PCG12R | ND3, ATP6, COI, COIII, COII, CytB; | GTR + I + G |
| ND2, ATP8, ND6, ND4, ND1, ND5, ND4L; | TVM + I + G | |
| 12S rRNA, 16S rRNA; | GTR + I + G |
| Gene | Strand | Position | Anticodon | Size (bp) | Start Codon | Termination Codon | Intergenic Nucleotides | |
|---|---|---|---|---|---|---|---|---|
| tRNA-I | J | 1 | 65 | GAT | 65 | |||
| tRNA-Q | N | 69 | 137 | TTG | 69 | 3 | ||
| tRNA-M | J | 137 | 202 | CAT | 66 | −1 | ||
| ND2 | J | 203 | 1186 | 984 | ATA | TAA | 0 | |
| tRNA-W | J | 1204 | 1271 | TCA | 68 | 17 | ||
| tRNA-C | N | 1264 | 1325 | GCA | 62 | −8 | ||
| tRNA-Y | N | 1335 | 1400 | GTA | 66 | 9 | ||
| COI | J | 1410 | 2946 | 1537 | TTG | T- | 9 | |
| tRNA-L | J | 2947 | 3012 | TAA | 66 | 0 | ||
| COII | J | 3013 | 3691 | 679 | ATA | T- | 0 | |
| tRNA-K | J | 3692 | 3761 | CTT | 70 | 0 | ||
| tRNA-D | J | 3768 | 3838 | GTC | 71 | 6 | ||
| ATP8 | J | 3839 | 3997 | 159 | TTG | TAA | 0 | |
| ATP6 | J | 3991 | 4665 | 675 | ATG | TAG | −7 | |
| COIII | J | 4676 | 5464 | 789 | ATG | TAA | 10 | |
| tRNA-G | J | 5467 | 5532 | TCC | 66 | 2 | ||
| ND3 | J | 5533 | 5884 | 352 | ATA | T- | 0 | |
| tRNA-A | J | 5885 | 5951 | TGC | 67 | 0 | ||
| tRNA-R | J | 5962 | 6025 | TCG | 64 | 10 | ||
| tRNA-N | J | 6027 | 6093 | GTT | 67 | 1 | ||
| tRNA-S | J | 6093 | 6161 | GCT | 69 | −1 | ||
| tRNA-E | J | 6161 | 6226 | TTC | 66 | −1 | ||
| tRNA-F | N | 6229 | 6295 | GAA | 67 | 2 | ||
| ND5 | N | 6295 | 8000 | 1706 | ATT | TA- | −1 | |
| tRNA-H | N | 8002 | 8070 | GTG | 69 | 1 | ||
| ND4 | N | 8072 | 9400 | 1329 | ATG | TAG | 1 | |
| ND4L | N | 9394 | 9681 | 288 | ATT | TAA | −7 | |
| tRNA-T | J | 9684 | 9749 | TGT | 66 | 2 | ||
| tRNA-P | N | 9750 | 9815 | TGG | 66 | 0 | ||
| ND6 | J | 9827 | 10,291 | 465 | ATA | TAA | 11 | |
| CytB | J | 10,296 | 11,429 | 1134 | ATG | TAA | 4 | |
| tRNA-S | J | 11,436 | 11,504 | TGA | 69 | 6 | ||
| ND1 | N | 11,530 | 12,453 | 924 | TTG | TAA | 25 | |
| tRNA-L | N | 12,454 | 12,518 | TAG | 65 | 0 | ||
| 16S rRNA | N | 12,519 | 13,787 | 1269 | 0 | |||
| tRNA-V | N | 13,788 | 13,855 | TAC | 68 | 0 | ||
| 12S r RNA | N | 13,856 | 14,656 | 801 | 0 | |||
| Control Region | 14,657 | 15,251 | 595 | 0 | ||||
| Gene | Strand | Position | Anticodon | Size (bp) | Start Codon | Termination Codon | Intergenic Nucleotides | |
|---|---|---|---|---|---|---|---|---|
| tRNA-I | J | 1 | 66 | GAT | 66 | |||
| tRNA-Q | N | 64 | 132 | TTG | 69 | −3 | ||
| tRNA-M | J | 137 | 202 | CAT | 66 | 4 | ||
| ND2 | J | 203 | 1189 | 987 | ATA | TAA | 0 | |
| tRNA-W | J | 1207 | 1273 | TCA | 67 | 17 | ||
| tRNA-C | N | 1266 | 1329 | GCA | 64 | −8 | ||
| tRNA-Y | N | 1342 | 1406 | GTA | 65 | 12 | ||
| COI | J | 1417 | 2953 | 1537 | TTG | T- | 10 | |
| tRNA-L | J | 2954 | 3019 | TAA | 66 | 0 | ||
| COII | J | 3020 | 3698 | 679 | ATA | T- | 0 | |
| tRNA-K | J | 3699 | 3770 | CTT | 72 | 0 | ||
| tRNA-D | J | 3771 | 3838 | GTC | 68 | 0 | ||
| ATP8 | J | 3839 | 3997 | 159 | GTG | TAA | 0 | |
| ATP6 | J | 3991 | 4665 | 675 | ATG | TAA | −7 | |
| COIII | J | 4671 | 5459 | 789 | ATG | TAA | 5 | |
| tRNA-G | J | 5463 | 5527 | TCC | 65 | 3 | ||
| ND3 | J | 5528 | 5879 | 352 | ATA | T- | 0 | |
| tRNA-A | J | 5880 | 5942 | TGC | 63 | 0 | ||
| tRNA-R | J | 5948 | 6011 | TCG | 64 | 5 | ||
| tRNA-N | J | 6014 | 6079 | GTT | 66 | 2 | ||
| tRNA-S | J | 6079 | 6147 | GCT | 69 | −1 | ||
| tRNA-E | J | 6147 | 6210 | TTC | 64 | −1 | ||
| tRNA-F | N | 6209 | 6275 | GAA | 67 | −2 | ||
| ND5 | N | 6276 | 7980 | 1705 | ATT | T- | 0 | |
| tRNA-H | N | 7982 | 8051 | GTG | 70 | 1 | ||
| ND4 | N | 8054 | 9382 | 1329 | ATG | TAA | 2 | |
| ND4L | N | 9376 | 9663 | 288 | ATT | TAA | −7 | |
| tRNA-T | J | 9666 | 9730 | TGT | 65 | 2 | ||
| tRNA-P | N | 9731 | 9794 | TGG | 64 | 0 | ||
| ND6 | J | 9803 | 10,276 | 474 | ATA | TAA | 8 | |
| CytB | J | 10,280 | 11,416 | 1137 | ATG | TAA | 3 | |
| tRNA-S | J | 11,420 | 11,488 | TGA | 69 | 3 | ||
| ND1 | N | 11,510 | 12,439 | 930 | ATA | TAA | 21 | |
| tRNA-L | N | 12,434 | 12,499 | TAG | 66 | −6 | ||
| 16S rRNA | N | 12,500 | 13,771 | 1272 | 0 | |||
| tRNA-V | N | 13,772 | 13,839 | TAC | 68 | 0 | ||
| 12S rRNA | N | 13,840 | 14,640 | 801 | 0 | |||
| Control Region | 14,641 | 15,322 | 682 | 0 | ||||
| Species | Whole Genome | Protein Coding Genes | 1st Codon Position | 2nd Codon Position | 3rd Codon Position | tRNA Genes | 12S rRNA | 16S rRNA | Control Region | |
|---|---|---|---|---|---|---|---|---|---|---|
| A + T % | A. varicornis | 76.7 | 73.2 | 68.8 | 66.9 | 83.7 | 75.7 | 77.4 | 78.3 | 70.4 |
| C. purpureipennis | 73.4 | 72.9 | 69.3 | 66.6 | 82.7 | 73.9 | 75.9 | 76.7 | 70.5 | |
| AT-Skew | A. varicornis | −0.14 | −0.11 | 0.03 | −0.39 | −0.02 | 0.07 | 0.11 | −0.13 | −0.03 |
| C. purpureipennis | 0.13 | −0.11 | 0.03 | −0.39 | 0.01 | 0.06 | 0.14 | 0.17 | −0.04 | |
| GC-Skew | A. varicornis | −0.06 | 0.00 | 0.21 | −0.10 | −0.19 | −0.10 | −0.28 | 0.24 | −0.24 |
| C. purpureipennis | −0.14 | −0.01 | 0.21 | −0.10 | −0.24 | −0.07 | −0.25 | −0.24 | −0.22 |
| Amino Acid | Codon | A. varicornis | C. purpureipennis | Amino Acid | Codon | A. varicornis | C. purpureipennis | ||||
|---|---|---|---|---|---|---|---|---|---|---|---|
| Count | RSCU | Count | RSCU | Count | RSCU | Count | RSCU | ||||
| Phe | UUU(F) | 243 | 1.62 | 234 | 1.51 | Tyr | UAU(Y) | 148 | 1.68 | 149 | 1.6 |
| UUC(F) | 57 | 0.38 | 76 | 0.49 | UAC(Y) | 28 | 0.32 | 37 | 0.4 | ||
| Leu | UUA(L) | 335 | 3.94 | 307 | 3.74 | His | CAU(H) | 55 | 1.43 | 53 | 1.54 |
| UUG(L) | 41 | 0.48 | 50 | 0.61 | CAC(H) | 22 | 0.57 | 16 | 0.46 | ||
| CUU(L) | 52 | 0.61 | 55 | 0.67 | Gln | CAA(Q) | 44 | 1.6 | 46 | 1.67 | |
| CUC(L) | 5 | 0.06 | 7 | 0.09 | CAG(Q) | 11 | 0.4 | 9 | 0.33 | ||
| CUA(L) | 65 | 0.76 | 63 | 0.77 | Asn | AAU(N) | 148 | 1.63 | 142 | 1.61 | |
| CUG(L) | 12 | 0.14 | 10 | 0.12 | AAC(N) | 34 | 0.37 | 34 | 0.39 | ||
| Ile | AUU(I) | 311 | 1.66 | 310 | 1.62 | Lys | AAA(K) | 76 | 1.52 | 79 | 1.52 |
| AUC(I) | 64 | 0.34 | 72 | 0.38 | AAG(K) | 24 | 0.48 | 25 | 0.48 | ||
| Met | AUA(M) | 289 | 1.76 | 295 | 1.76 | Asp | GAU(D) | 55 | 1.59 | 50 | 1.49 |
| AUG(M) | 39 | 0.24 | 40 | 0.24 | GAC(D) | 14 | 0.41 | 17 | 0.51 | ||
| Val | GUU(V) | 71 | 1.49 | 64 | 1.42 | Glu | GAA(E) | 69 | 1.59 | 73 | 1.68 |
| GUC(V) | 9 | 0.19 | 3 | 0.07 | GAG(E) | 18 | 0.41 | 14 | 0.32 | ||
| GUA(V) | 89 | 1.87 | 95 | 2.11 | Cys | UGU(C) | 39 | 1.56 | 39 | 1.56 | |
| GUG(V) | 21 | 0.44 | 18 | 0.4 | UGC(C) | 11 | 0.44 | 11 | 0.44 | ||
| Ser | UCU(S) | 110 | 2.4 | 113 | 2.44 | Trp | UGA(W) | 85 | 1.77 | 86 | 1.74 |
| UCC(S) | 20 | 0.44 | 28 | 0.6 | UGG(W) | 11 | 0.23 | 13 | 0.26 | ||
| UCA(S) | 86 | 1.87 | 77 | 1.66 | Arg | CGU(R) | 17 | 1.24 | 19 | 1.41 | |
| UCG(S) | 7 | 0.15 | 8 | 0.17 | CGC(R) | 3 | 0.22 | 2 | 0.15 | ||
| Pro | CCU(P) | 80 | 2.39 | 68 | 2.09 | CGA(R) | 34 | 2.47 | 29 | 2.15 | |
| CCC(P) | 18 | 0.54 | 18 | 0.55 | CGG(R) | 1 | 0.07 | 4 | 0.3 | ||
| CCA(P) | 35 | 1.04 | 39 | 1.2 | Ser | AGU(S) | 44 | 0.96 | 37 | 0.8 | |
| CCG(P) | 1 | 0.03 | 5 | 0.15 | AGC(S) | 14 | 0.31 | 11 | 0.24 | ||
| Thr | ACU(T) | 70 | 1.65 | 66 | 1.53 | AGA(S) | 84 | 1.83 | 97 | 2.09 | |
| ACC(T) | 24 | 0.56 | 22 | 0.51 | AGG(S) | 2 | 0.04 | 0 | 0 | ||
| ACA(T) | 71 | 1.67 | 84 | 1.94 | Gly | GGU(G) | 52 | 1.02 | 62 | 1.2 | |
| ACG(T) | 5 | 0.12 | 1 | 0.02 | GGC(G) | 11 | 0.22 | 14 | 0.27 | ||
| Ala | GCU(A) | 63 | 1.81 | 48 | 1.34 | GGA(G) | 96 | 1.89 | 89 | 1.73 | |
| GCC(A) | 22 | 0.63 | 25 | 0.7 | GGG(G) | 44 | 0.87 | 41 | 0.8 | ||
| GCA(A) | 51 | 1.47 | 66 | 1.85 | |||||||
| GCG(A) | 3 | 0.09 | 4 | 0.11 | |||||||
Disclaimer/Publisher’s Note: The statements, opinions and data contained in all publications are solely those of the individual author(s) and contributor(s) and not of MDPI and/or the editor(s). MDPI and/or the editor(s) disclaim responsibility for any injury to people or property resulting from any ideas, methods, instructions or products referred to in the content. |
© 2023 by the authors. Licensee MDPI, Basel, Switzerland. This article is an open access article distributed under the terms and conditions of the Creative Commons Attribution (CC BY) license (https://creativecommons.org/licenses/by/4.0/).
Share and Cite
Wang, Y.; Yang, R.; Zhu, X.; Zheng, C.; Bu, W. The Characterization and Phylogenetic Implications of the Mitochondrial Genomes of Antheminia varicornis and Carpocoris purpureipennis (Hemiptera: Pentatomidae). Diversity 2023, 15, 1209. https://doi.org/10.3390/d15121209
Wang Y, Yang R, Zhu X, Zheng C, Bu W. The Characterization and Phylogenetic Implications of the Mitochondrial Genomes of Antheminia varicornis and Carpocoris purpureipennis (Hemiptera: Pentatomidae). Diversity. 2023; 15(12):1209. https://doi.org/10.3390/d15121209
Chicago/Turabian StyleWang, Ying, Ruijuan Yang, Xiuxiu Zhu, Chenguang Zheng, and Wenjun Bu. 2023. "The Characterization and Phylogenetic Implications of the Mitochondrial Genomes of Antheminia varicornis and Carpocoris purpureipennis (Hemiptera: Pentatomidae)" Diversity 15, no. 12: 1209. https://doi.org/10.3390/d15121209
APA StyleWang, Y., Yang, R., Zhu, X., Zheng, C., & Bu, W. (2023). The Characterization and Phylogenetic Implications of the Mitochondrial Genomes of Antheminia varicornis and Carpocoris purpureipennis (Hemiptera: Pentatomidae). Diversity, 15(12), 1209. https://doi.org/10.3390/d15121209