Article

SERS- and SEIRA-Based Characterization and Sensing of Highly Selective Bradykinin B2 Receptor Antagonists

1
Faculty of Foundry Engineering, AGH University of Krakow, 30-059 Krakow, Poland
2
Faculty of Chemistry, University of Gdansk, Wita Stwosza 63, 80-308 Gdansk, Poland
*
Author to whom correspondence should be addressed.
Int. J. Mol. Sci. 2025, 26(16), 8089; https://doi.org/10.3390/ijms26168089 (registering DOI)
Submission received: 17 July 2025 / Revised: 9 August 2025 / Accepted: 18 August 2025 / Published: 21 August 2025
(This article belongs to the Special Issue Nanoparticle-Based Biosensors and Their Applications)

Abstract

One of the major challenges in diagnosing various diseases, including neurological and neurodegenerative disorders, as well as carcinogenesis, is detecting unlabeled neurotransmitters. Surface-enhanced Raman spectroscopy (SERS) and surface-enhanced infrared spectroscopy (SEIRA) are promising methods for neurotransmitter biosensing and bioimaging. These methods are unique in that they are non-destructive and can identify molecular fingerprints. In this study, these methods were used to detect the following potent bradykinin (BK) antagonists: [D-Arg0,Hyp3,Thi5,D-Tic7,Oic8]BK, [D-Arg0,Hyp3,Thi5,D-Phe7,Thi8]BK, [D-Arg0,Hyp3,Igl5,D-Phe(5F)7,Oic8]BK, and [D-Arg0,Hyp3,Igl5,D-Igl7,Oic8]BK. The peptides were immobilized on a sensor surface consisting of silver (AgNPs) and gold (AuNPs) nanoparticles. These sensors have uniform particle sizes and small size distributions. Thanks to fast synthesis, easy handling, and reproducible results, these sensors enable routine testing. The vibrational structure of these peptides could not be determined using classical vibrational methods (Raman and IR) or surface-enhanced methods (SERS and SEIRA). This work presents the results of that research. Additionally, the SEIRA spectrum for BK or its analogs has not yet been published. This study presents research using SERS and SEIRA that shows that AgNP and AuNP sensors can detect the peptides under investigation. SERS is a more selective method than SEIRA because it allows for the differentiation of peptides based on the enhancement of certain bands in the SERS spectra. Furthermore, each peptide uniquely interacts with AuNPs, whereas all peptides bind to AgNPs via the C-terminus in different orientations. Consequently, the AuNP sensor is more selective than the AgNP sensor. Some bands were selected as markers for the sensing of specific peptides.

Graphical Abstract

1. Introduction

In 2022, there were 20 million new cancer cases worldwide. This number is expected to increase to 35 million cases per year over the next two decades [1]. The most commonly diagnosed cancers were lung, breast, and colorectal cancers. Most of these cancers are caused by genetic abnormalities in the transformed cells, which can result from exposure to substances that interfere with normal body processes, known as carcinogens. Other cancer-promoting genetic abnormalities may be related to mutations in DNA or damage to mechanisms that control cell growth at the epigenetic and molecular levels. These irregularities may also be present in all cells from birth [2]. The variation between individual cancers is usually influenced by complex interactions between carcinogens and the host genome. One such agent is neurotransmitters. These signaling molecules control the activity of organs and tissues and influence the immune system. Neurotransmitters also promote cell proliferation, progression, and metastasis, thereby a playing role in cancer development [3,4,5]. Cancer tissue secretes endogenous neurotransmitters in response to various environmental and nervous system stimuli [6,7]. Conversely, many malignant tumors overexpress certain types of metabotropic seven-transmembrane receptors belonging to the G-protein-coupled superfamily (GPCR) on their surface. These receptors are found in small cell lung cancer (SCLC) (85–100%), glioblastoma (85%), gastric cancer, pancreatic cancer (75%), prostate cancer (62–100%), breast cancer (62–91%), squamous cell carcinoma (100%), and neuroblastoma (72%). They bind to neurotransmitters secreted by the autonomic nervous system in the brain, the peripheral nervous system, the ganglia, and the adrenal medulla [3,8,9,10,11,12,13,14,15]. Therefore, these receptors can serve as potential cancer markers for imaging and therapy with synthetic antagonists and agonists. These agents can be used for the early diagnosis and detection of lesions expressing these receptors [16,17,18].
Bradykinin (BK), whose primary sequence is shown in Table 1, is a neurotransmitter found in the human body and a natural ligand for type B2 G-protein-coupled receptors. BK mediates the following processes via these receptors: sustained smooth muscle contraction, vascular permeability, mucosal secretion, the stimulation of sensory neurons, the alteration of epithelial cell ion secretion, the release of cytokine from leukocytes, and the production of eicosanoids from various cell types [19]. Notably, BK is considered a growth factor involved in carcinogenesis and neoplastic cell progression [20,21]. Therefore, several studies have focused on developing BK analogs with a significantly higher affinity for B2 receptors and antagonistic or weaker agonistic properties [22,23]. These properties enable BK analogs to effectively compete with the native peptide by preferentially binding to B2 receptors and blocking the signaling pathway, thereby inhibiting neoplastic cell proliferation. BK antagonists also exhibit desirable characteristics for combination therapy. A single analog can selectively stimulate apoptosis in tumors, while inhibiting angiogenesis and matrix metalloproteinase (MMP) activity in treated lung and prostate tumors in nude mice [24].
An example of a highly potent and specific bradykinin B2 receptor antagonist with a nanomolar affinity is [D-Arg-Hyp3,Thi5,D-Tic7,Oic8]BK. See Table 1 for the primary sequence. This analog differs from other known BK antagonists because residues 7 and 8 are replaced with more rigid, lipophilic amino acids. It is highly stable and slowly degenerates in human plasma [25]. It prevents pancreatic edema, resulting in hypotension and hemoconcentration. It also facilitates the removal of activated enzymes from the tissue during cerulenin-induced acute pancreatitis [26]. In clinical studies, its efficacy in treating hereditary angioedema and ascites associated with liver cirrhosis has been tested [27]. Another important B2 receptor antagonist is [D-Arg0,Hyp3,Thi5,D-Phe7,Thi8]BK, which causes vasodilation and can therefore be used to treat hypertension. It induces and influences inflammatory reactions. Consequently, it could be beneficial in treating diseases associated with excessive or chronic inflammation. It is also involved in pain mechanisms and could therefore act as an algogenic substance or as a regulator of pain perception [28]. Understanding this antagonist’s role in pain mechanisms could lead to new analgesics or methods for treating chronic pain [29]. Conversely, D-Arg0,Hyp3,Igl5,D-Igl7,Oic8]BK reduces the number of leukocytes that adhere to the endothelial surface and improves cerebral microcirculation in gerbils following global cerebral ischemia [30]. An interesting modification of this peptide involves replacing the amino acid at position 8 with L-octahydroindole-2-carboxylic acid (Oic). Recently, several potential inhibitors of protein S binding to ACE2 have been developed based on this non-natural amino acid. These inhibitors prevent SARS-CoV-2 from entering cells, thereby weakening the progression of the 2019 novel coronavirus disease (COVID-19) [31]. Including D-pentafluorophenylalanine at position 7 (Phe(5F)7) modifies the peptide structure, improving the potency and selectivity of the [D-Arg0,Hyp3,Igl5,D-Phe(5F)7]BK analog toward the B2 receptor while maintaining its antibacterial properties [32,33].
The presence of neurotransmitters, as well as imbalances in their levels, which exhibit dose-dependent effects, may indicate disorders affecting brain function, blood pressure regulation, smooth muscle contraction, inflammatory processes, and cancer growth. Therefore, the ability to detect neurotransmitters is becoming increasingly important in various fields, including the diagnosis of brain and neurological diseases and tumors. This is the motivation for the research in the present study. This study employed spectroscopic methods, including surface-enhanced Raman spectroscopy (SERS) and surface-enhanced infrared spectroscopy (SEIRA), to detect four potent bradykinin antagonists: [D-Arg0,Hyp3, Thi5,D-Tic7,Oic8]BK, [D-Arg0,Hyp3,Thi5,D-Phe7,Thi8]BK, [D-Arg0,Hyp3,Igl5,D-Phe(5F)7,Oic8]BK, and [D-Arg0,Hyp3,Igl5,D-Igl7,Oic8]BK. The molecular structures of these peptides remain unknown. Another aim of this work is to characterize these antagonists’ structures using vibrational spectroscopy, by means of Raman spectroscopy and attenuated total reflection Fourier transform infrared (ATR-FTIR) spectroscopy.
SERS and SEIRA are highly effective analytical tools for screening and sensing peptides, even at the single-molecule level, and offer exceptional specificity [34,35,36]. In these methods, the analyte is adsorbed onto or placed near a nanometer-sized metal surface, where the metal surface’s plasmon filed is effectively amplified [37]. Silver surfaces have been used in 90% of SERS studies because they most effectively amplify the metal surface plasmon field [38]. Gold has also been used as an SERS-active substrate for its stability and ability to provide surface plasmon resonance conditions in the visible and near-infrared spectral regions. However, gold does not produce as strong an enhancement as silver. In protein screening, selecting a suitable substrate preparation method is crucial because it facilitates routine testing. Therefore, the method should be fast, simple, and inexpensive. It should also allow for the preparation of repeatable, uniform nanometal surfaces and reproducible results. Thus, this study employes colloidal silver (AgNPs) and gold nanoparticles (AuNPs).
Previously the surface- (SERS) and tip-enhanced Raman scattering (TERS) techniques were used to determine the adsorption of bradykinin (BK) and its two isotopically labeled analogs, [(Phe-D5)5]BK and [(Phe-D5)8]BK, under various environmental conditions, including peptide concentrations (10−5–10−7 M) and excitation wavelengths (514.5 and 785.0 nm), the pH of the solution (from pH = 3 to pH = 11), and the roughness and size of the metal surface. Examples include colloidal, suspended Ag nanospheres with a diameter of 10 nm and Ag, Au, and Cu electrode surfaces under different applied electrode potentials (−1.200 V to 0.200 V) in aqueous solutions [39,40,41]. The SERS results indicated that a peptide concentration of 10−5 M was optimal for monolayer colloidal coverage. The Phe5/8 and Arg9 residues of BK generally interacted with the colloidal Ag surfaces. The amide group arranged itself similarly on the Ag surface within the pH range of 3 to 11. At an acidic pH of the solution (pH = 3 to 5), the BK –COO terminal group bound to the Ag surface as a bidentate (at pH = 3) or monodentate (at pH = 5) chelating ligand. At a pH = 11, the imino group of Arg9 was not involved in interacting with AgNPs, likely due to its protonated state (–C = NH2). Reducing the alkalinity of the solution (pH = 9) caused the deprotonation of the –C = NH2 group, followed by rearrangement of the group to favor interactions between the lone electron pair on N and Ag. The TERS studies confirmed BK’s behavior on colloidal Ag surfaces at a pH = 7, as proposed based on SERS.
The behavior of four potent B2 bradykinin receptor antagonists—including [D-Arg0,Hyp3,Thi5,8,L-Pip7]BK, Aaa[D-Arg0,Hyp3,Thi5,8,L-Pip7]BK, [D-Arg0,Hyp3,Thi5,D-Phe7, L-Pip8]BK, and Aaa[D-Arg0,Hyp3,Thi5,D-Phe7,L-Pip8]BK, adsorbed onto different surfaces, such as colloidal Ag spheres with diameters of approximately 20–25 nm and colloidal Ag nanowires with a diameter ranging from 350 to 500 nm and a length ranging from 2 to 50 µm, as well as an electrochemically roughened Ag surface with a 50–150 nm Ag island on its surface—was also monitored by SERS [42,43,44]. The adsorption of the other five BK analogs, which act as antagonists of the B1 receptor in the presence of bradykinin in the T-REx 293/B1R cell line, was discussed in the context of enhancing the vibrations of the molecular fragments responsible for the biological properties of these analogs at the liquid/AuNPs interface (with a diameter of 20 nm) [45].

2. Results and Discussion

Before using Ag and Au nanoparticle sensors to detect peptides, the dimensions and size distribution of these nanoparticles were determined using a UV-Vis spectrophotometer, a scanning electron microscope (SEM), and dynamic light scattering (DLS). Figure 1 shows the excitation spectra of an aqueous solution of AgNPs (Figure 1A, solid line) and AuNPs (Figure 1B, solid line). The plasmon resonance at 392 and 527 nm is due to the collective oscillation of the free electrons in the conduction band of the nanoparticles. This resonance band is accompanied by a full width at half maximum of 80 nm and 50 nm, respectively. These observations suggest the precise control of the particle size, with values of 10 nm and 20 nm, respectively. The SEM images (Figure 1C,D) and DLS analysis (Figure 1E,F) corroborate the UV-Vis results. Additionally, the calculated crystallite size based on XRD patterns (Figure 1G,H) is approximately 10 and 20 nm for AgNPs and AuNPs, respectively. The SEM images (Figure 1C,D) also show aggregated spherical nanoparticles. Nanoparticle aggregates form due to attractive forces, such as van der Waals forces and electrostatic interactions, as well as through the Oswald ripening process and upon molecule adsorption [46,47]. This phenomenon is reflected in the absorption band shift to 557 nm and 641 nm for AgNPs and AuNPs, respectively (see dotted lines in Figure 1A,B).
The AgNPs and AuNPs, with diameters of 10 and 20 nm, respectively, were selected as sensors. This selection was based on previous research involving other neurotransmitters immobilized on nanoparticles of these sizes [39,43,45,48,49]. This allows us to compare the present results with studies on different neurotransmitters under similar experimental conditions. This is important when sensing different neurotransmitters.
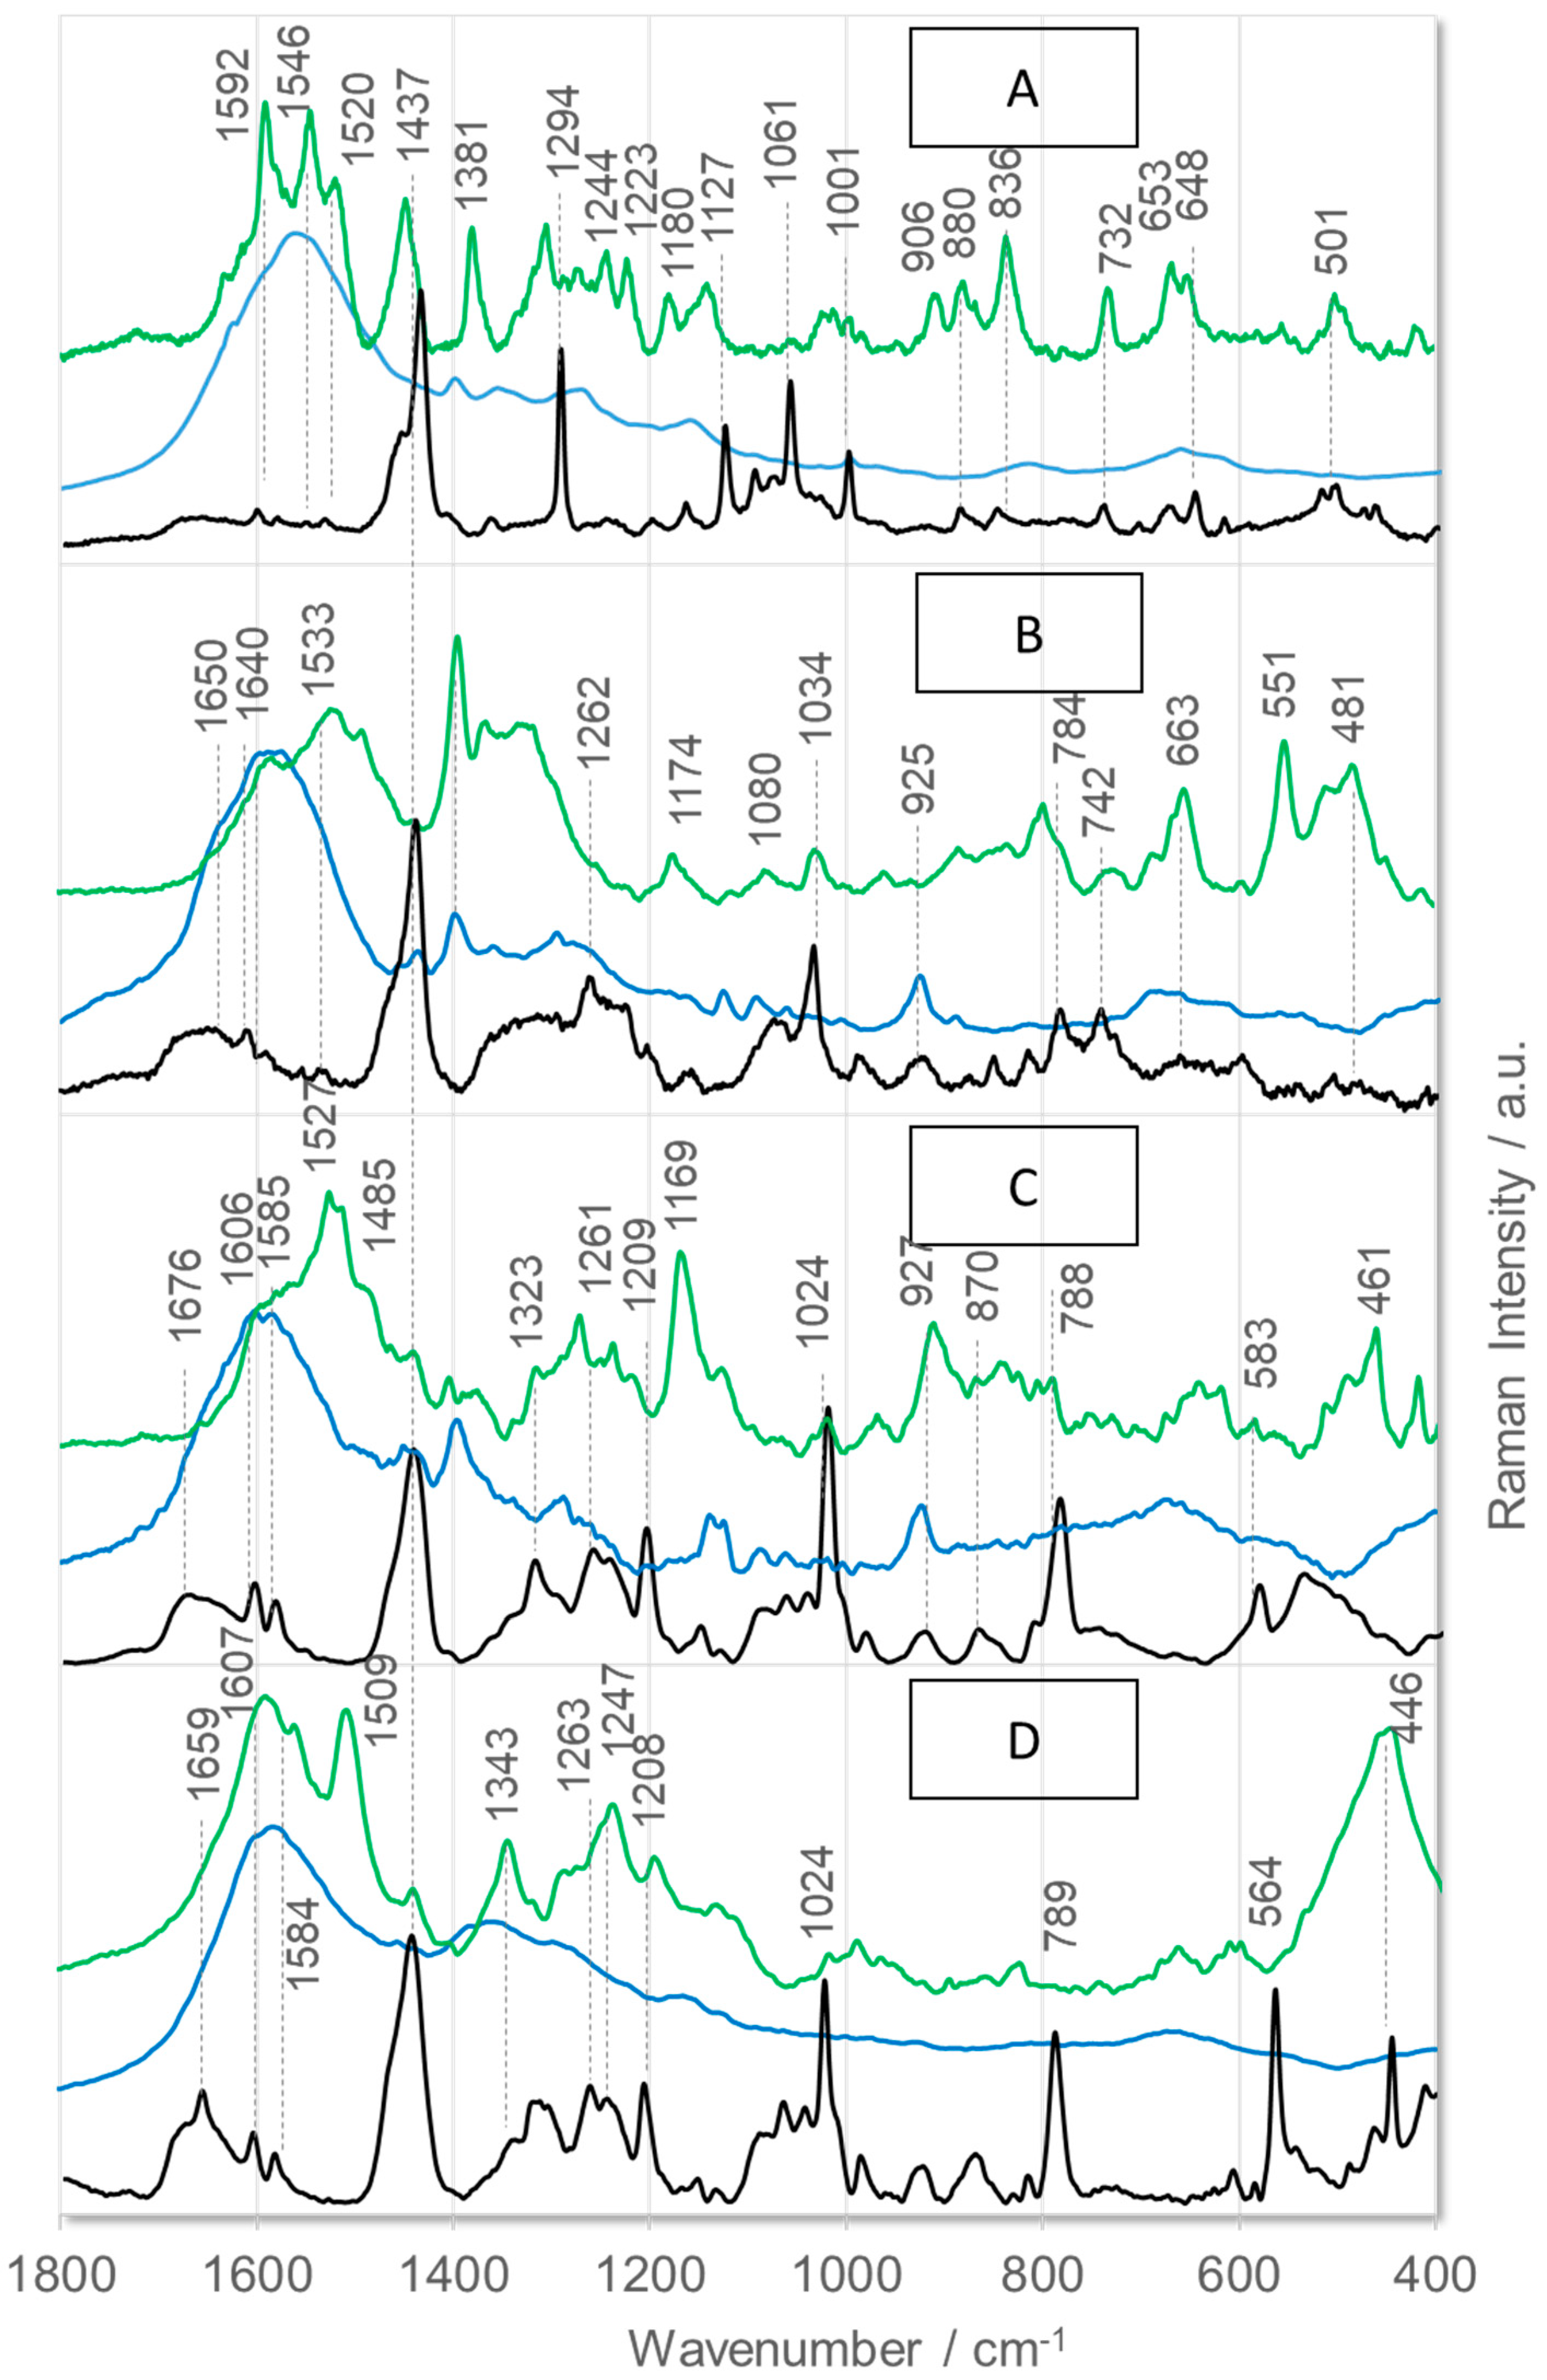
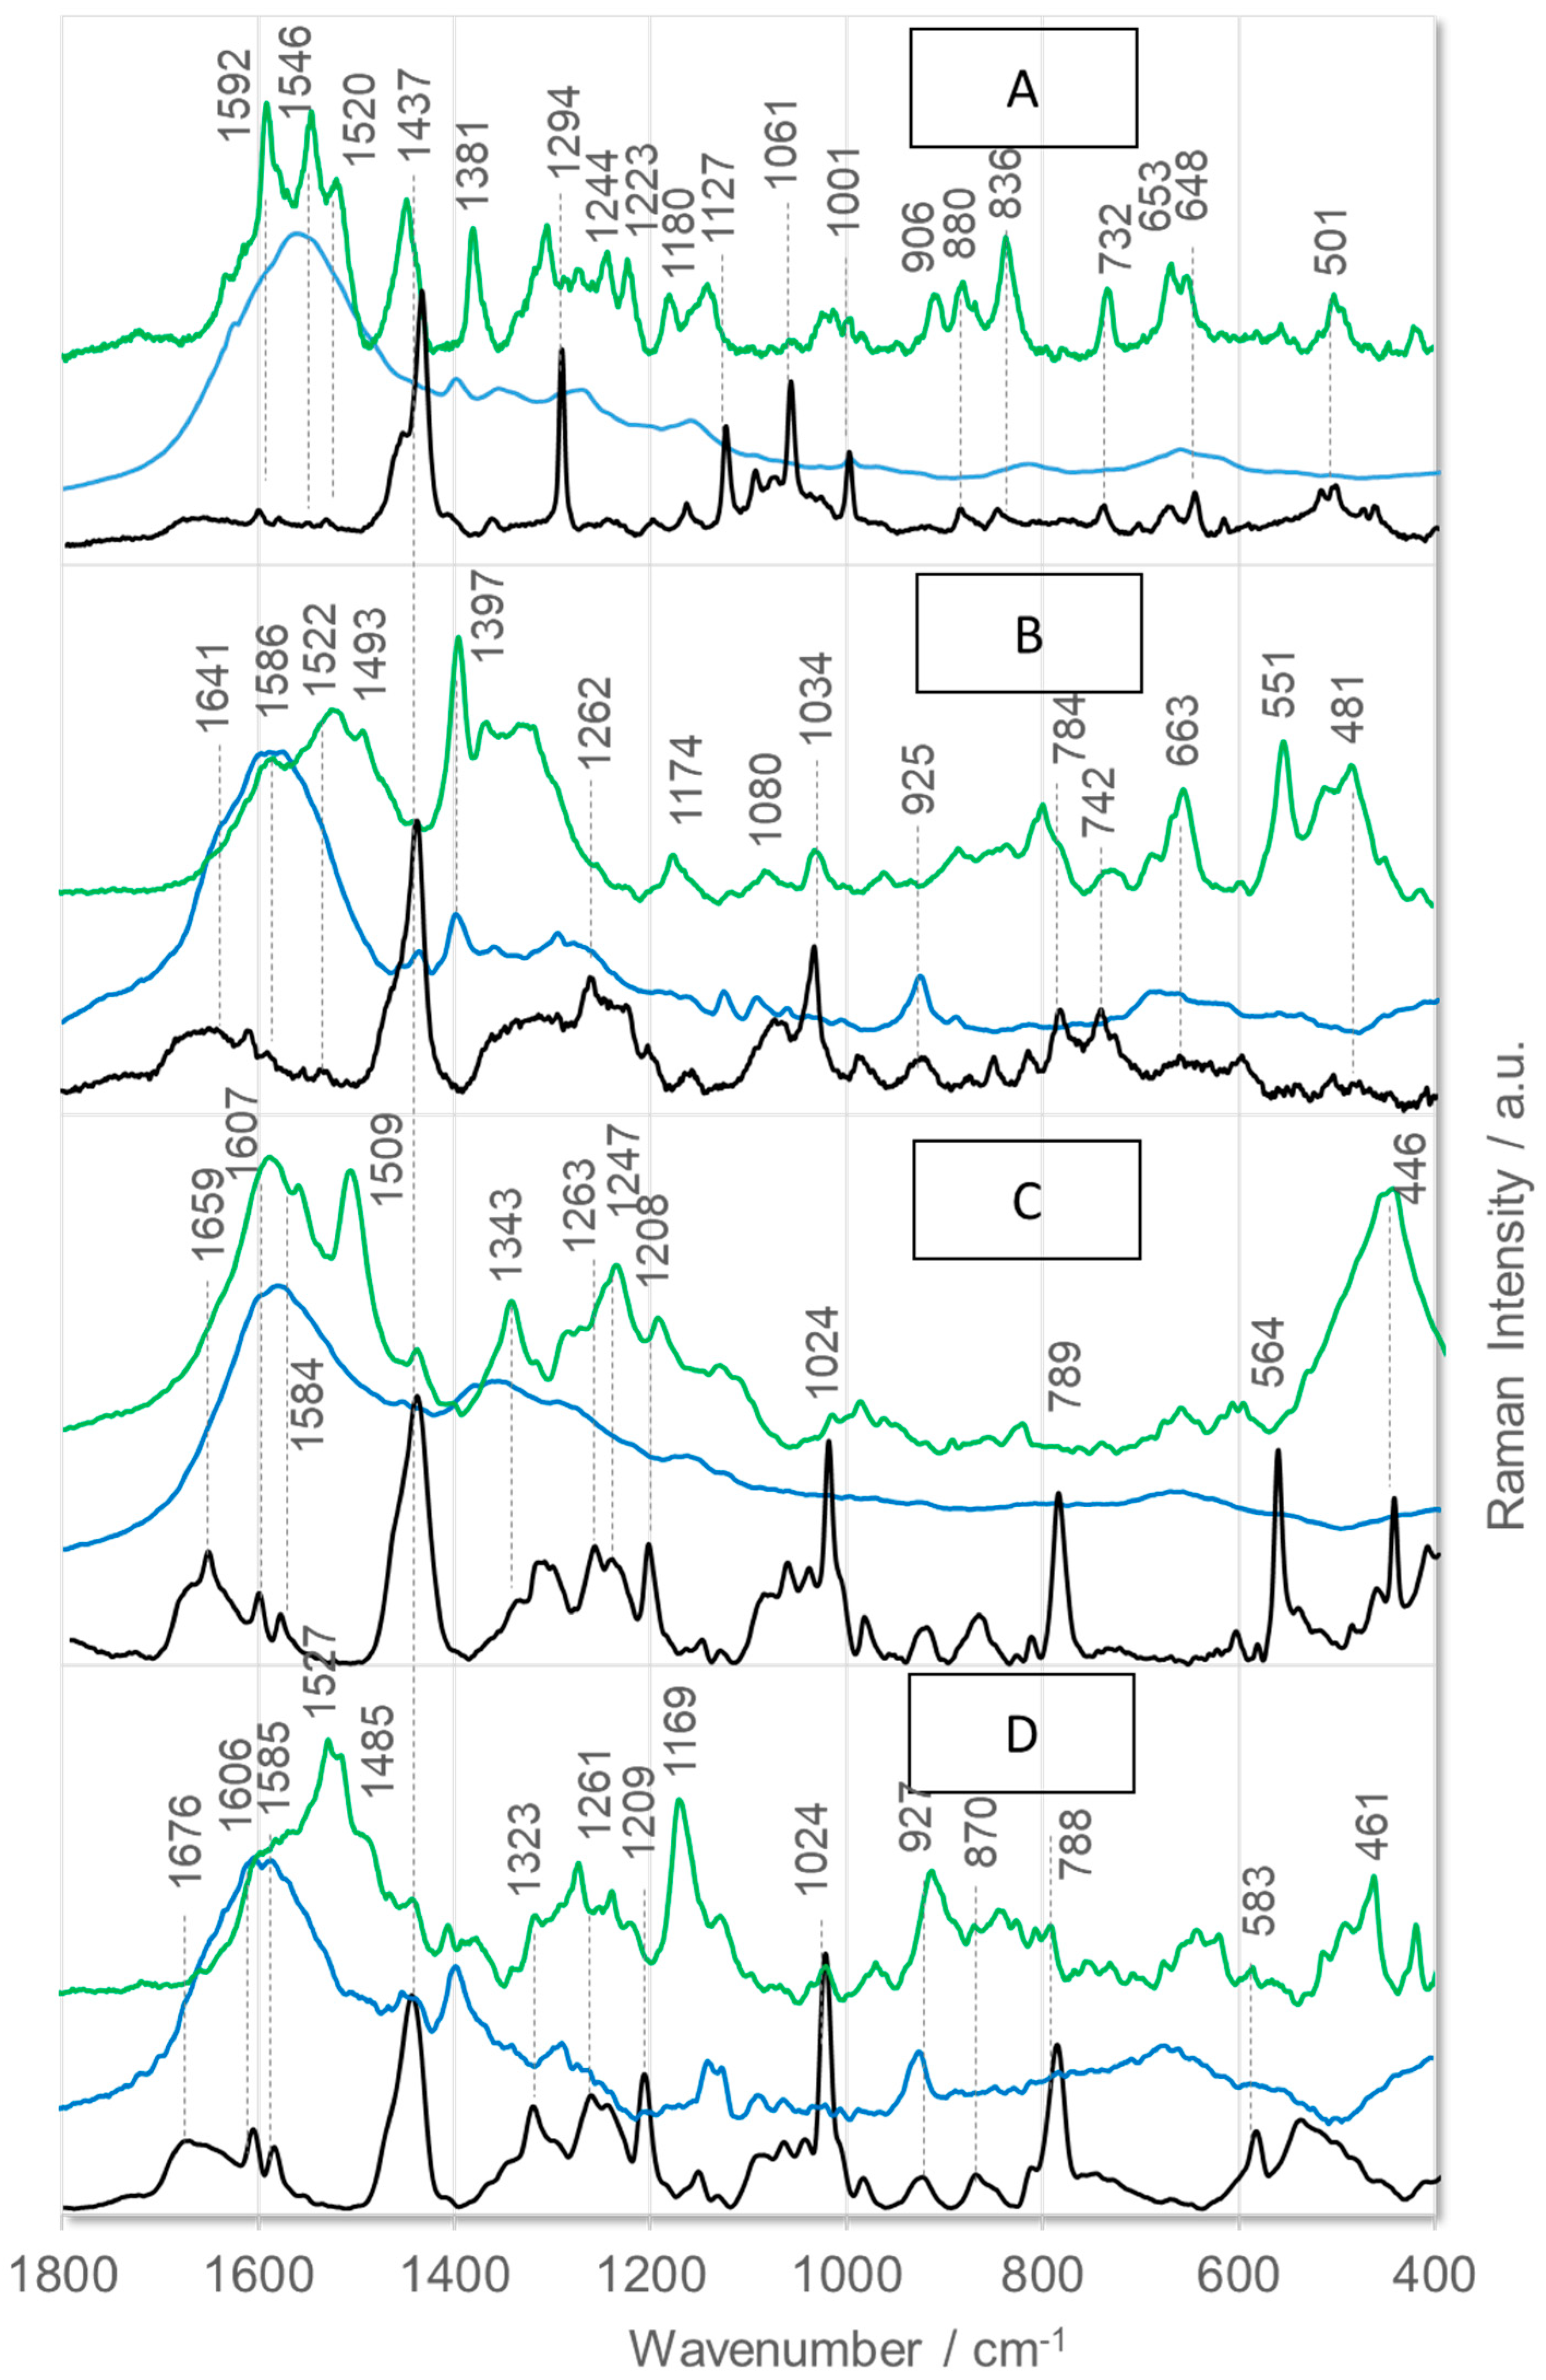
Figure 2 shows the SERS spectra of the four antagonists detected on AgNP (blue lines) and AuNP (green lines) surfaces. To facilitate the accurate interpretation of the SERS results, the corresponding Raman spectra (black lines) are shown for comparison. Figure 3 shows the corresponding SEIRA spectra on AgNPs (blue lines) and AuNPs (green lines), together with the ATR-FTIR spectra (black lines). It is important to note that the vibrational structure of these compounds has not yet been determined. Therefore, Table 2 and Table 3 summarize the proposed assignments of the observed bands in the presented spectra to the vibrations of the corresponding peptide fragments. However, the following discussion will focus exclusively on the bands that effectively recognize/sense these antagonists.
Before analyzing the results of immobilized neurotransmitters on sensing surfaces, four aspects must be considered. The first concerns the primary structure of neurotransmitters and their differences. This is important for describing the molecules’ geometry on metal surfaces because surface-enhanced methods only enhance molecule fragments on or close to the sensor surface. Peptide fragments attach to the sensor surface based on their chemical structure. Second, the bands that appear in the vibrational spectra must be assigned to the corresponding normal modes of the peptide fragments. Third, surface plasmon resonance refers to the oscillation of a metal’s surface charge density. This oscillation can be amplified by electromagnetic radiation at frequencies close to the metal’s surface plasmon frequency. The physics of the processes underlying Raman and infrared absorption spectroscopy determine the selectivity for detecting specific peptide fragments. Specifically, in Raman spectroscopy, the transition probability depends on the polarizability of the molecule, whereas in infrared spectroscopy, it depends on the dipole moment. Therefore, only molecules with a non-zero dipole moment produce an IR spectrum. Polar fragments of molecules meet this condition. Consequently, infrared spectroscopy mainly detects polar fragments, while Raman spectroscopy mainly detects nonpolar fragments.
Fourth, changes in the bandwidth, wavenumber, and intensity between the normal and surface-enhanced spectra (e.g., Raman vs. SERS and ATR-FTIR vs. SEIRA) enable the determination of the geometry of molecule fragments located on or near the sensor surface. However, this is only possible for bands that do not overlap with other bands in the spectrum. In brief, the adsorption mechanism of different benzene ring derivatives on roughened metal surfaces via π-electron systems has been widely investigated [50,51,52,53,54]. Surface selection rules have been most thoroughly described for the electromagnetic enhancement (EM) of molecules of a high symmetry immobilized on a metal surface [52,53,55]. According to these rules, vibrations perpendicular to the surface (which draw their intensities from the Raman polarizability component αzz) are expected to be more enhanced than parallel vibrations [50,51,56]. This means that, for a perpendicular ring orientation, in-plane vibrations should be more enhanced than out-of-plane ones. Therefore, for a flat ring orientation, A2 symmetry vibrations contain a larger polarizability tensor component normal to the surface than B2 modes. The opposite is true for vertical adsorption geometry. Additionally, upon π adsorption, benzene ring bands involving C–C stretching vibrations shift to lower wavenumbers due to the anticipated back-donation of the electron density from the metal surface to the π* antibonding orbitals of the benzene ring [57]. Gao and Weaver reported that the ν12 and ν18a modes of alkylobenzenes shift down by 10–15 cm−1 upon adsorption7. Conversely, the observed downshift of 4–5 cm−1 for the corresponding modes of halogenobenzenes was interpreted as evidence of the absence of a direct interaction between the π-electron system and the metal surface. Furthermore, a significant benzene ring band broadening was reported in the case of the π-adsorption, caused by the interaction between the benzene ring and the metal surface [57].
As the peptide abbreviations indicate, these peptides have different amino acid sequences at positions 5, 7, and 8. Specifically, peptides [D-Arg0,Hyp3,Thi5,D-Phe7,Thi8]BK and [D-Arg0,Hyp3,Thi5,D-Tic7,Oic8]BK contain L-thienylalanine (Thi) at position 5. Thus, the vibrations of this aromatic amino acid’s side chain should be preferentially enhanced in the SERS spectra if it is in proximity to the sensor surface, since aromatic rings have a high affinity for the metal surfaces [58,59,60,61]. Similarly, the vibrations of the phenyl ring should be enhanced in the SERS spectra because this ring is present in the side chains of the amino acids such as D-phenylalanine (D-Phe) and D-1,2,3,4-tetrahydroisoquinoline-3-carboxylic acid (D-Tic) at position 7 in the sequences of peptides [D-Arg0,Hyp3,Thi5,D-Phe7,Thi8]BK and [D-Arg0,Hyp3,Thi5,D-Tic7,Oic8]BK, respectively. The phenyl ring also occurs in the side chains of two other non-natural amino acids: L-/D-2-indanylglycine (L-/D-Igl) and D-pentafluorophenylalanine (D-Phe(5F)). The former occurs at positions 5 and 7 in the [D-Arg0,Hyp3,Igl5,D-Igl7,Oic8]BK sequence. In the sequence of [D-Arg0,Hyp3,Igl5,D-Phe(5F)7,Oic8]BK, D-Igl and D-Phe(5F) are found at positions 5 and 7, respectively. Additionally, amino acids with side chains containing an atom capable of interacting with the metal surface via a free electron pair primarily enhance signals in SERS/SEIRA spectra. These functional groups include arginine (Arg, –N(H)C(=NH)NH2 fragment), L-proline (Pro, >N– fragment), L-hydroxyproline (Hyp, >N– and –OH fragments), L-octahydroindole-2-carboxylic acid (Oic, >N– fragment), D-1,2,3,4-tetrahydroisoquinoline-3-carboxylic acid (Tic, >N– fragment), and L-thienylalanine (Thi, –S– fragment), as well as amide bonds (–C(=O)NH–).
The characteristic modes of these peptide fragments are briefly summarized below:
-
Phe: at 1604 cm−18a], 1584 cm−18b], 1204 cm−17a], 1030 cm−118a], 1002 cm−112], and 619 cm−16b] [62];
-
Phe(5F): at 1662 cm−18a], 1622 cm−18b], 1552/1514 cm−1 [ν(CC)], 1174 cm−1 [ν(CF)], 1020 cm−1 [ν(CF)], 782 cm−1t(CF)], and 655 cm−1t(CCCC)] [63];
-
Thi: at 1409 cm−1 [ν(C=CH) + ν(CC)+ρr(CH)], 1363 cm−1r(CH) + ν(C=C)], 1036 cm−1 [ν(CC) + ρr(CH)], 986 cm−1r(CH2)], 850 and 817 cm−1 [ν(CC) + δ(ring)], and 667 cm−1w(CH)] [45];
-
Arg: 1574 cm−1s(NH2)], 1466–1218 cm−1 [different CH2 group vibrations], 1176 and 1135 cm−1r(NH2)], 1085 and 1068 cm−1 [ν(CN)], 997 and 971 cm−1r(CH2)], 900–850 cm−1 [ν(CC)], 848 cm−1w(NH)], 793 cm−1r(NH)], 746 cm−1r(CH2)], and 524 cm−1t(NH2)] [64];
-
Pro: 1470 cm−1 [δ(CH2) + imide-II], 1438 cm−1 [imide-II + δ(CH2)], 1317 cm−1 [δ(CCαH)], 1286 cm−1r/t(CH2)], 1263, 1237, 1178, and 1102 cm−1 [δ(CH2) and/or δ(NH)], 983 and 950 cm−1 [ν(CC) + ν(CCN)], 850 cm−1r(CβH2], 780 cm−1r(CγH2], 530 cm−1 [δ(CCN)], and 480 cm−1 [pyrrolidine deformations] [65,66];
-
Tetrahydroisoquinoline: 1602, 1582, 1460, 1440, 1220, 1196, 1025, 724, 590, 510, and 440 cm−1 [67];
-
Amide bonds of disordered structures: 1660 m−1 [amide-I], 1544 cm−1 [amide-II], 1240 cm−1 [amide-III], and 644 cm−1 [amide-V] [68].
As mentioned earlier, the blue lines in Figure 2 show the SERS spectra of the four BK antagonists on the AgNP surface. These spectra are characterized by a distinct, broad band centered at approximately 1586 cm−1 with a full width at half maximum (FWHM) of ~140 cm−1. See Table 2 for the exact band wavenumber of each peptide. In this wavenumber range, bands due to vibrations of the amide bond, aromatic ring, carboxyl, and amino groups are expected to be enhanced. Therefore, it can be assumed that the bands resulting from vibrations of these peptide fragments overlap, resulting in a broad, intense band. The statement that these peptide fragments interact with AgNPs is supported by moderately enhanced bands at ~925 cm−1 [ν(CCOO–)], 1123 cm−1 [a-ring ρt(CH2), where “a-” stands for an aliphatic ring], 1397 cm−1s(COO)], 1438 cm−1 [δ(CH2) and imide II], and 1457 cm−1 [δ(CH2) + imide II/Arg ρb(CH2)/a-ring ρs(CH2)] in the spectra of [D-Arg0,Hyp3,Igl5,D-Igl7,Oic8]BK (Figure 2D) and [D-Arg0, Hyp3,Thi5,D-Tic7,Oic8]BK (Figure 2B). In the SERS spectrum of [D-Arg0,Hyp3,Thi5,D-Tic7,Oic8]BK, the 1438 cm−1 SERS signal is more intense than the 1457 cm−1 spectral feature. In contrast, the intensities of these two bands are reversed in the [D- Arg0,Hyp3,Igl5,D-Igl7, Oic8]BK SERS spectrum.
Additionally, the 1139 cm−1 band [ρr(NH2)]—absent in the [D-Arg0,Hyp3,Thi5,D-Tic7,Oic8]BK SERS spectrum—is enhanced in the [D-Arg0,Hyp3,Igl5,D-Igl7,Oic8]BK SERS spectrum on AgNPs. Two other bands in these peptides’ SERS spectra deserve special attention: the ~1270 cm−1 band [a-ring ρt(CH2)] and the ~1296 cm−1 band [a-ring ν(CN) + ρb(CCH) + ρr/t(CH2)/imide II]. The enhancement of these bands suggests that both peptides may interact with the AgNP sensor surface through the deprotonated C-terminal carboxyl group and the imide bond formed by the Oic8 residue. For the [D-Arg0,Hyp3,D-Igl7,Oic8]BK peptide, the –NH2 group of the arginine side chain interacts with the surface, indicating that the arginine side chain is directed toward the AgNPs.
In the SERS spectra of the other two peptides immobilized on AgNPs, the bands attributable to the vibrations of the carboxylate group are only weakly enhanced (see Figure 2, blue traces A and C). Additionally, the νs(COO) mode appears as a medium-intensity band at 1352 cm−1 [aliphatic-ring combination mode] in the [D-Arg0,Hyp3,Igl5,D-Phe(5F)7,Oic8]BK spectrum (Figure 2C). The SERS signal at 1352 cm−1 is also enhanced in the spectrum of [D-Arg0,Hyp3,Thi5,D-Phe7,Thi8]BK on AgNPs (Figure 2A). However, it is less intense and does not overlap with other bands in this wavenumber range. This behavior can be explained by the fact that the C-terminus of these peptides is located at a certain distance from the AgNP surface, with the aliphatic ring facing the surface. This could also indicate that the aliphatic ring of the side chain is on the opposite side of the chain from the carboxyl group. The assignment of the 1352 cm−1 band to the aliphatic ring vibrations is supported by the enhancement of other SERS signals of the aliphatic ring at ~1166 cm−1 [aliphatic ring ρt(CH2)] and ~811 cm−1 [aliphatic ring breathing vibrations]. Additionally, the [D-Arg0,Hyp3,Thi5,D-Phe7,Thi8]BK SERS spectrum on AgNPs shows a weak enhancement of the Phe ν12 mode at 996 cm−1. This band’s intensity is evidently lower than the corresponding Raman band’s intensity, and its wavenumber is shifted by 5 cm−1 to lower wavenumbers. These observations suggest that the phenyl ring is arranged more or less parallel to the AgNP surface [43].
The spectral patterns of peptides immobilized on an AuNP surface differ from those on an AgNP surface. See Figure 2 (green traces) for details. However, there is a certain degree of similarity in the wavenumber range from 1500 to 1600 cm−1. This phenomenon occurs due to the overlap of several modes, including those corresponding to the amide bond, aromatic rings, and amine and carboxylate groups.
This results in the formation of a broad envelope of bands with clear maxima. Unlike AgNPs, more discrepancies are observed in the spectra of the individual peptides on AuNPs. In the SERS spectrum of [D-Arg0,Hyp3,Igl5,D-Phe(5F)7,Oic8]BK on AuNPs (Figure 2C, green trace), the bands at 988, 1195, 1239, 1345, 1442, 1509, 1560, and 1591 cm−1, mainly attributed to the Phe(5F) side chain vibrations, are clearly enhanced. In the SERS spectra of [D-Arg0,Hyp3,Thi5,D-Tic7,Oic8]BK (Figure 2B) and [D-Arg0,Hyp3,Thi5,D-Phe7,Thi8]BK (Figure 2A) on AuNPs, the νs(COO) mode exhibits an intermediate intensity (see Table 2 for the wavenumbers of the bands). However, this band is absent from the SERS spectrum of [D-Arg0,Hyp3,Igl5,D-Igl7,Oic8]BK (Figure 2D, green line). In the [D-Arg0,Hyp3,Thi5,D-Tic7,Oic8]BK spectrum on AuNPs, the νs(COO) band is accompanied by SERS signals at 1583, 1522, 1283, 1174, 959, and 481 cm−1, which correspond to the vibrations of the aliphatic ring of the Tic7 residue. The [D-Arg0,Hyp3,Thi5,D-Phe7,Thi8]BK SERS spectrum also shows bands at 1592, 1546, 1520, 982, 836, and 653 cm−1. The first three bands overlap, resulting in a pronounced envelope of the bands attributable to amide and phenylalanine ring vibrations. The remaining three spectral features are due to thienylalanine ring vibrations. In contrast, the prominent bands at 1564 and 1485 and 1127 and 461 cm−1 in the SERS spectrum of [D-Arg0,Hyp3,Igl5,D-Igl7,Oic8]BK on AuNPs (Figure 2D, green line) correspond to the amide/imide bond and the aliphatic ring vibrations, respectively.
Figure 3 shows the ATR-FTIR and SEIRA spectra of the investigated BK analogs on AgNPs and AuNPs. The analysis of these spectral profiles reveals that the ATR-FTIR and SEIRA spectra of the individual peptides are similar. This is not surprising, as infrared spectroscopy is important for identifying and characterizing primary chemical functional groups (polar groups), unlike Raman spectroscopy. Briefly, the SEIRA spectra of all peptides on AgNPs are dominated by two modes: amide II at 1580 cm−1 and νs(COO) at 1397 cm−1. Table 3 shows the specific wavenumbers for each peptide. The 1580 cm−1 spectral feature is symmetric, with a full width at half maximum (FWHM) of ~65 cm−1 for [D-Arg0,Hyp3,Thi5,D-Phe7,Thi8]BK (Figure 3A, blue line), [D-Arg0,Hyp3,Thi5, D-Tic7,Oic8]BK (Figure 3B), and [D-Arg0,Hyp3,Igl5,D-Phe(5F)7,Oic8]BK (Figure 3C). However, the FWHM is 94 cm−1 for the broadened band of [D-Arg0,Hyp3,Thi5,D-Phe7,Thi8]BK (Figure 3C), which has an asymmetric shape with two shoulders at 1660 cm−1 [amide I] and 1533 cm−1as(COO)]. The broadening of this band is due to the considerable intensity of the SERS signal at 1660 cm−1. This band is also present in the SEIRA spectra of the other three peptides on AgNPs, though it shows only a slight enhancement. The second strong SERS signal is at approximately 1397 cm−1 (FWHM = 51 cm−1) and exhibits two shoulders at approximately 1447 cm−1 [imide II] and ~1368 cm−1 [ρ(CH2)]. Several other weak bands are enhanced at ~1302 cm−1 [ν(CN)], ~1251 cm−1 [amide III], 1078 cm−1 [ν(CN)], 903 cm−1 [ν(CCOO–)], 841 cm−1 [ν(CC) + δ(NH)], 703 cm−1, and 638 cm−1b(COO)/amide V]. However, these bands do not allow the peptides to be distinguished.
The SEIRA spectra of peptides immobilized on the AuNP surface show an intense band in the wavenumber range of 1700–1500 cm−1. The analysis of this band’s shape indicates that it results from the overlap of two bands: one at 1660 cm−1 [amide I] and one at 1647 cm−1as(C=N), δ(NH2)]. In each peptide spectrum, the band at the lower wavenumber is more intense than the band at the higher wavenumber. Additionally, four other bands are enhanced in these spectra: one at ~1545 cm−1 [amide II], one at ~1455 cm−1 [δ(CH2) + imide II], one at ~1251 cm−1 [amide III], and one at ~1068 cm−1 [ν(NC)]). These bands indicate an analogous enhancement in the peptide spectra.

3. Materials and Methods

3.1. Synthesis of Bradykinin Antagonists

[D-Arg0,Hyp3,Thi5,D-Tic7,Oic8]BK, [D-Arg0,Hyp3,Thi5,D-Phe7,Thi8]BK, [D-Arg0,Hyp3, Igl5,D-Phe(5F)7,Oic8]BK, and [D-Arg0,Hyp3,Igl5,D-Igl7,Oic8]BK were synthesized via the solid-phase method using the Fmoc strategy and starting from Fmoc-Wang resin (GL Biochem, Shanghai, 1% DVB, 100–200 mesh) [69]. The resin load for the first protected amino acids was 0.40 mmol/g. The Fmoc protection group was removed using 20% piperidine in DMF. The respective Fmoc-amino acids were activated in situ with a threefold excess using HATU (1 equiv.)/HOAt in a DMF/NMP (1:1 v/v) mixture containing 1% Triton. The coupling reactions were base-catalyzed with NMM. All of the Fmoc-protected amino acids were purchased from NovaBiochem (Bad Soden, Germany). The peptide was cleaved from the resin, and side chain deprotection was performed by treating it with a trifluoroacetic acid (TFA)/water (H2O)/trisopropylsilane (TIS) mixture (95.5:2.5:2.5 v/v/v) for four hours. The total volume of the TFA filtrate was reduced to approximately one millimeter by evaporation in vacuo. The peptide was precipitated with a cold diethyl ether and filtered through a Schott funnel. The peptides were purified by semi-preparative high-performance liquid chromatography (HPLC). HPLC was performed on a Waters (analytical and semi-preparative) chromatograph equipped with a UV detector (λ = 226 nm). Peptide purity was determined using a Discovery HS C18 column (5 μm, 100 Å; 250 × 4.6 mm). The solvent systems were [A] 0.1% aqueous trifluoroacetic acid (TFA) and [B] 80% acetonitrile in 0.1% aqueous TFA (v/v). The peptides were separated using a linear gradient of [B] ranging from 1 to 80% over 30 min at a flow rate of 1 mL/min. Semi-preparative HPLC was performed using a Kromasil C8 column (5 μm, 100 Å; 16 × 250 mm) with a linear gradient of [B] from 13 to 43% at a flow rate of 8 mL/min. Mass spectra of the peptides were recorded using a Bruker BIFLEX III MALDI TOF mass spectrometer (Bruker, Bremen, Germany) with ionization by a 337 nm nitrogen laser.

3.2. Synthesis of Colloidal Silver Nanoparticles (AgNPs)

Silver nitrate (AgNO3) and sodium borohydride (NaBH4) were obtained from Merck Life Science Sp. z o.o. (Poznań, Poland) and used without further purification. Three batches of an aqueous solution of AgNPs were prepared according to the procedure described by Creighton et al. (reduction of AgNO3 by NaBH4) [70]. Briefly, 5 mL of a 1·10−3 M AgNO3 solution was added dropwise to 15 mL of a 2·10−3 M NaBH4 solution. The solution was kept cool over an ice bath at 4 °C while stirring vigorously. All solutions were prepared with deionized water (18 MΩ cm−1). After adding all of the AgNO3, the solution was kept in the ice bath for about one hour. As a result, 10 nm AgNPs were obtained in an aqueous solution.

3.3. Synthesis of Colloidal Gold Nanoparticles (AuNPs)

Three batches of 20 nm AuNPs, containing 0.01% HAuCl4 and stabilized in citrate buffer, were purchased from Merck Life Science Sp. z o.o. (Poznań, Poland). The AuNPs were produced using a modified tannic acid/citrate method.

3.4. Sample Preparation for SERS and SEIRA Measurements

Based on previous studies, the optimal concentrations of colloids and neurotransmitters were determined to be those at which well-enhanced, reproducible spectra were measured.
Aqueous peptide solutions were prepared by dissolving each peptide in deionized water (0.08 μS/cm; 10−4 M concentration). Then, 10 µL of the peptide solution was mixed with 20 µL of the NPs solution and incubated for 15 min prior to measurements. The incubation time was chosen as 15 min because the spectrum could not be measured immediately after mixing the colloid with the sample solution. Spectra measured at incubation times above 15 min corresponded to spectra measured after 15 min of incubation. Thus, a 15 min incubation time was chosen.

3.5. Raman and Surface-Enhanced Raman Spectroscopy (SERS) Measurements

Raman spectra were collected for solid peptides, and SERS spectra were measured for peptides in an aqueous solution.
Both types of spectra were collected using an InVia Raman spectrometer (Renishaw, Wotton-under-Edge, UK), which was equipped with an air-cooled charge-coupled device (CCD) detector and a Leica microscope with a 20× objective. The spectral resolution was set to 4 cm−1. The 785 nm line of a continuous-wave diode laser served as the excitation source. The laser power at the laser output was set to 20 mW.
Three batches of each colloid were examined, with SERS spectra recorded from three different drops of the peptide/nanoparticle mixture for each batch (for a total of nine spectra).
The exposure time for each Raman and SERS measurement was typically 40 s with four accumulations (a series of four spectra, each accumulated for 40 s, for a total of 160 s). The spectra obtained from each series were reproducible with slight differences in the intensities of some bands observed (up to 5%). No spectral changes that could be associated with sample decomposition were observed during the measurements.

3.6. Attenuated Total Reflection Infrared Spectroscopy (ATR-FTIR) and Surface-Enhanced Infrared Spectroscopy (SEIRA) Measurements

ATR-FTIR spectra were collected for solid peptides, and SEIRA spectra were measured for peptides in an aqueous solution.
Three batches of each colloid were examined, and SERS spectra were recorded from three different peptide/nanoparticle mixtures for each batch (for a total of nine spectra). Briefly, the peptide/nanoparticle mixture was loaded onto a diamond ATR adapter and left to dry. Unbound peptide molecules were removed by washing with deionized water. Then, the adapter was allowed to dry. This process was repeated three times.
Spectra were recorded using a Thermo Scientific Nicolet 6700 FTIR spectrometer equipped with a diamond ATR accessory. The measurement conditions were a resolution of 4 cm−1 and 128 scans. The spectra were recorded three times, each with 128 scans. The spectra obtained from the series were reproducible, with slight differences (up to 5%) in the intensities of some bands observed. No spectral changes that could be associated with sample decomposition were observed during the measurements.

3.7. Scanning Electron Microscopy (SEM) Imaging

Ten microliters of an aqueous solution of NPs was deposited onto a silicate plate and dried in a vacuum dryer.
The scanning electron microscope (SEM) images of the AuNPs were obtained using a Versa 3D Dual Beam system (Thermo Fisher Scientific, Waltham, MA, USA) with an energy beam of 10.0 kV.

3.8. Dynamic Light Scattering (DLS) Measurements

The volumetric particle size distribution was determined using dynamic light scattering (DLS) measurements with a Zetasizer Nano ZS analyzer (Malvern Instruments, Worcestershire, UK). The analyzer was equipped with an avalanche photodiode with a quantum efficiency of greater than 50% at 633 nm, and it operated at a temperature of 25 °C. Prior to the measurements, a 0.1 wt% SnO2 nanoparticle suspension was prepared in distilled water. The suspension was then sonicated for 15 min at 20 W in continuous mode using a Branson SFX250 ultrasonic homogenizer (Emerson, Wallingford, CT, USA).

3.9. X-Ray Powder Diffraction (XRD) Pattern Measurements

XRD patterns were obtained using an Aeris diffractometer (PANalytical, Almelo, The Netherlands) with Cu Kα1 radiation (λ = 1.5405980 Å). Measurements were taken over an angular range of 10° to 80° 2θ.

4. Conclusions

One of the major challenges in diagnosing various diseases, including neurological and neurodegenerative disorders of the central nervous system, as well as carcinogenesis, is label-free neurotransmitter detection. Many effective neurotransmitter detection methods have been developed, including magnetic, microdialytic, electrochemical, optical, and spectroscopic techniques. Among these methods, surface-enhanced Raman scattering (SERS) and surface-enhanced infrared spectroscopy (SEIRA) are promising for biosensing and bioimaging due to their unique non-destructive nature and their ability to identify molecular fingerprints.
In this study, these methods were used to detect four potent bradykinin antagonists in an aqueous solution containing AgNPs and AuNPs. Colloids, which were prepared using methods that allow for the control of the particle size and produce a narrow particle size distribution, were chosen as sensors. Colloids were chosen because they can be synthesized quickly, are easy to handle, and are ideal for routine analyses. The focus of peptide sensing should be on detection rather than sensor fabrication.
The results demonstrate that the AgNP and AuNP sensors can detect the peptides under investigation. Studies with SERS and SEIRA have shown that SERS is a more selective method than SEIRA because it is possible to distinguish peptides based on the enhancement of specific bands in SERS spectra. In the case of AgNPs, the bands at ~1397, 1352, 1136, and 996 cm−1 can serve as peptide marker bands—that is, bands that allow for peptide identification. For [D-Arg0,Hyp3, Thi5,D-Phe7,Thi8]BK, the 996 cm−1 band serves as a marker band—it is only enhanced in the SERS spectrum of this peptide on AgNPs. The intense 1397 cm−1 band is diagnostic of [D-Arg0,Hyp3,Thi5,D-Tic7,Oic8]BK, and the 1397 and 1134 cm−1 SERS signals are marker bands for [D-Arg0,Hyp3,Igl5,D-Phe(5F)7,Oic8]BK. The low intensity of the 1395 cm−1 band and the enhancement of the 1352 cm−1 band are two parameters that can be used to distinguish [D-Arg0,Hyp3,Igl5,D-Phe(5F)7,Oic8]BK from other peptides. The modes of the pentafluoro-substituted phenyl ring ([D-Arg0,Hyp3,Igl5,D-Phe(5F)7,Oic8]BK), the amide/imide bond ([D-Arg0,Hyp3,Igl5,D-Igl7, Oic8]BK), the thienylalanine ring and the –COO group ([D-Arg0,Hyp3,Thi5,D-Phe7,Thi8]BK), and the Tic ring and the –COO group ([D-Arg0,Hyp3,Thi5,D-Tic7,Oic8]BK) can be considered marker bands for peptides deposited on the AuNP sensors.

Author Contributions

Conceptualization, methodology, software, validation, formal analysis, investigation, resources, data curation, writing—original draft preparation, writing—review and editing, visualization, supervision, project administration, and funding acquisition, E.P.; methodology and investigation, A.P. All authors have read and agreed to the published version of the manuscript.

Funding

This work was supported by the National Science Center in Poland (Grant No. 2023/49/B/ST4/00077 to. E.P.) and the AGH University (Subsidy No.: 16.16.170.654 to E.P.).

Institutional Review Board Statement

Not applicable.

Data Availability Statement

Data are available upon request (proniewi@agh.edu.pl).

Acknowledgments

The authors would like to thank Dominika Święch for SERS measurements. The authors have reviewed and edited the output and take full responsibility for the content of this publication.

Conflicts of Interest

The authors declare no conflicts of interest.

Abbreviations

The following abbreviations are used in this manuscript:
ATR-FTIRAttenuated total reflection Fourier transform infrared spectroscopy
AuNPsGold nanoparticles
BKBradykinin
FWHMFull width at half maximum
GPCRG-protein-coupled superfamily
HypL-hydroxyproline
Igl2-indanylglycine
OicL-octahydroindole-2-carboxylic acid
Phe(5F)D-pentafluorophenylalanine
SEIRASurface-enhanced infrared spectroscopy
SERSSurface-enhanced Raman scattering
SEMScanning electron microscopy
D-TicD-1,2,3,4-tetrahydroisoquinoline-3-carboxylic acid
ThiL-thienylalanine
TERSTip-enhanced Raman scattering
AgNPsSilver nanoparticles
SCLCSmall cell lung cancer
UV-VisExcitation spectroscopy

References

  1. Global Cancer Burden Growing, Amidst Mounting Need for Services. Available online: https://www.who.int/news/item/01-02-2024-global-cancer-burden-growing--amidst-mounting-need-for-services (accessed on 1 February 2024).
  2. Cancer. Available online: https://www.who.int/news-room/fact-sheets/detail/cancer (accessed on 3 February 2025).
  3. Yang, Y.; Sun, L.; Liu, X.; Liu, W.; Zhang, Z.; Zhou, X.; Zhao, X.; Zheng, R.; Zhang, Y.; Guo, W.; et al. Neurotransmitters: Impressive regulators of tumor progression. Biomed. Pharmacother. 2024, 176, 116844. [Google Scholar] [CrossRef] [PubMed]
  4. Jayachandran, P.; Battaglin, F.; Strelez, C.; Lenz, A.; Algaze, S.; Soni, S.; Lo, J.H.; Yang, Y.; Millstein, J.; Zhang, W.; et al. Breast cancer and neurotransmitters: Emerging insights on mechanisms and therapeutic directions. Oncogene 2023, 42, 627–637. [Google Scholar] [CrossRef]
  5. Xiao, L.; Li, X.; Fang, C.; Yu, Y.; Chen, T. Neurotransmitters: Promising immune modulators in the tumor microenvironment. Front. Immunol. Sec. Cancer Immun. Immunother. 2023, 14, 1118637. [Google Scholar] [CrossRef]
  6. de Visser, K.E.; Joyce, J.A. The evolving tumor microenvironment: From cancer initiation to metastatic outgrowth. Cancer Cell 2023, 41, 374–403. [Google Scholar] [CrossRef] [PubMed]
  7. Yu, S.; Huang, Y.; Hu, Y. Cancer-nervous system crosstalk: From biological mechanism to therapeutic opportunities. Mol. Cancer 2025, 24, 133. [Google Scholar] [CrossRef]
  8. Devi, L.A.; Fricker, L.D. Transmitters and Peptides: Basic Principles. In Neuroscience in the 21st Century; Pfaff, D.W., Ed.; Springer: New York, NY, USA, 2013; pp. 1487–1503. [Google Scholar]
  9. Jensen, R.T.; Moody, T.W. Bombesin-related peptides and neurotensin: Effects on cancer growth/proliferation and cellular signaling in cancer. In Handbook of Biologically Active Peptides; Kastin, A.J., Ed.; Elsevier: Amsterdam, The Netherlands, 2006; pp. 429–434. [Google Scholar]
  10. Ananias, H.J.; van den Heuvel, M.C.; Helfrich, W.; de Jong, I.J. Expression of the Gastrin-Releasing Peptide Receptor, the Prostate Stem Cell Antigen and the Prostate-Specific Membrane Antigen in Lymph Node and Bone Metastases of Prostate Cancer. Prostate 2009, 69, 1101–1108. [Google Scholar] [CrossRef]
  11. Alifano, M.; Souazé, F.; Dupouy, S.; Camilleri-Broet, S.; Younes, M.; Ahmed-Zaid, S.M.; Takahashi, T.; Cancellieri, A.; Damiani, S.; Boaron, M.; et al. Neurotensin Receptor 1 Determines the Outcome of Non–Small Cell Lung Cancer. Clin. Cancer Res. 2010, 16, 4401–4410. [Google Scholar] [CrossRef] [PubMed]
  12. Mattei, J.; Achcar, R.D.; Cano, C.H.; Macedo, B.R.; Meurer, L.; Batlle, B.S.; Groshong, S.D.; Kulczynski, J.M.; Roesler, R.; Dal Lango, L.; et al. Gastrin-releasing peptide receptor expression in lung cancer. Arch. Pathol. Lab. Med. 2014, 138, 98–104. [Google Scholar] [CrossRef]
  13. Reubi, J.C.; Waser, B.; Friess, H.; Buchler, M.; Laissue, J. Neurotensin receptors: A new marker for human ductal pancreatic adenocarcinoma. Gut 1998, 42, 546–550. [Google Scholar] [CrossRef]
  14. Zhang, M.; Chen, T.; Lu, X.; Lan, X.; Chen, Z.; Lu, S. G protein-coupled receptors (GPCRs): Advances in structures, mechanisms and drug discovery. Signal Transduct. Target Ther. 2024, 9, 88. [Google Scholar] [CrossRef]
  15. Bar-Shavit, B.; Maoz, M.; Kancharla, A.; Kumar Nag, J.; Agranovich, D.; Grisaru-Granovsky, S.; Uziely, B. G Protein-Coupled Receptors in Cancer. Int. J. Mol. Sci. 2016, 17, 1320. [Google Scholar] [CrossRef]
  16. Ryder, N.M.; Guha, S.; Hines, O.J.; Reber, H.A.; Rozengurt, E. G protein-coupled receptor signaling in human ductal pancreatic cancer cells: Neurotensin responsiveness and mitogenic stimulation. J. Cell Physiol. 2001, 186, 53–64. [Google Scholar] [CrossRef]
  17. Mankoff, D.A.; Link, J.A.; Linden, H.A.; Sundararajan, L.; Krohn, K.A. Tumor Receptor Imaging. J. Nucl. Med. 2008, 49, 149S–163S. [Google Scholar] [CrossRef] [PubMed]
  18. Okarvi, S.M. Peptide-based radiopharmaceuticals and cytotoxic conjugates: Potential tools against cancer. Cancer Treat. Rev. 2008, 34, 13–26. [Google Scholar] [CrossRef]
  19. Golias, C.; Charalabopoulos, A.; Stagikas, D.; Charalabopoulos, K.; Batistatou, A. The kinin system—Bradykinin: Biological effects and clinical implications. Multiple role of the kinin system—Bradykinin. Hippokratia 2007, 11, 124–128. [Google Scholar]
  20. Stewart, J.M.; Gera, L. Bradykinin and cancer. In Handbook of Biologically Active Peptides; Academic Press: New York, NY, USA, 2006; Volume 63, pp. 443–446. [Google Scholar]
  21. Deepak, K.; Roy, P.K.; Kola, P.; Mukherjee, B.; Mandal, M. An overview of kinin mediated events in cancer progression and therapeutic applications. Biochim. Biophys. Acta-Rev. Cancer 2022, 1877, 188807. [Google Scholar] [CrossRef]
  22. Skidgel, R.A. Histamine, Bradykinin, and Their Antagonists. In Goodman & Gilman’s: The Pharmacological Basis of Therapeutics, 13th ed.; Brunton, L.L., Hilal-Dandan, R., Knollmann, B.C., Eds.; McGraw-Hill Education: Berkshire, UK, 2017. [Google Scholar]
  23. Stewart, J.M. Bradykinin Antagonists as Anti-Cancer Agents. Curr. Pharmac. Design 2003, 9, 2036–2042. [Google Scholar] [CrossRef]
  24. Stewart, J.M.; Gera, L.; Chan, D.C.; York, E.J.; Simkeviciene, V.; Bunn, P.A., Jr.; Taraseviciene-Stewart, L. Combination cancer chemotherapy with one compound: Pluripotent bradykinin antagonists. Peptides 2005, 26, 1288–1291. [Google Scholar] [CrossRef]
  25. Hock, F.J.; Wirth, K.; Albus, U.; Linz, W.; Gerhards, H.J.; Wiemer, G.; Henke, S.; Breipohl, G.; Konig, W.; Knolle, J.; et al. Hoe 140 a new potent and long acting bradykinin-antagonist: In vitro studies. Br. J. Pharmacol. 1991, 102, 769–773. [Google Scholar] [CrossRef] [PubMed]
  26. Griesbacher, T.; Kolbitsch, C.; Tiran, B.; Lembeck, F. Effects of the bradykinin antagonist, icatibant (Hoe 140), on pancreas and liver functions during and after caerulein-induced pancreatitis in rats. Naunyn-Schmiedeberg’s Arch. Pharmacol. 1995, 352, 557–564. [Google Scholar] [CrossRef] [PubMed]
  27. Gras, J. Icatibant for hereditary angioedema. Drugs Today 2009, 45, 855–864. [Google Scholar] [CrossRef] [PubMed]
  28. Introduction to NPC 349 Peptide. Available online: https://ontosight.ai/glossary/term/introduction-to-npc-349-peptide--67a276b2c445bf945af12999 (accessed on 17 August 2025).
  29. Kindgen-Milles, D.; Klement, W. Pain and inflammation evoked in human skin by bradykinin receptor antagonists. Eur. J. Pharmacol. 1992, 218, 183–185. [Google Scholar] [CrossRef] [PubMed]
  30. Lehmberg, J.; Beck, J.; Baethmann, A.; Uhl, E. Influence of the bradykinin B1/B2-receptor-antagonist B 9430 on the cerebral microcirculation and outcome of gerbils from global cerebral ischemia. Acta Neurochir. Suppl. 2000, 76, 39–41. [Google Scholar]
  31. Kiew, L.-V.; Chang, C.-Y.; Huang, S.-Y.; Wang, P.-W.; Heh, C.-H.; Liu, C.-T.; Cheng, C.-H.; Lu, Y.-X.; Chen, Y.-C.; Huang, Y.-X.; et al. Development of flexible electrochemical impedance spectroscopy-basedbiosensing platform for rapid screening of SARS-CoV-2 inhibitors. Biosens Bioelectron. 2021, 183, 113213. [Google Scholar] [CrossRef] [PubMed]
  32. Schnaider, L.; Ghosh, M.; Bychenko, D.; Grigoriants, I.; Ya’ari, S.; Antsel, T.S.; Matalon, S.; Sarig, R.; Brosh, T.; Pilo, R.; et al. Enhanced Nanoassembly-Incorporated Antibacterial Composite Materials. ACS Appl. Mater. Interf. 2019, 11, 21334−21342. [Google Scholar] [CrossRef]
  33. Gera, L.; Stewart, J.M. Novel highly potent bradykinin antagonists containing pentafluorophenylalanine. Pept. Front. Pept. Sci. 2002, 5, 730–732. [Google Scholar]
  34. Kim, M.; Choi, Y.S.; Jeong, D.H. SERS detection of dopamine using metal-chelated Ag nanoshell. RSC Adv. 2024, 14, 14214. [Google Scholar] [CrossRef]
  35. Ciallaa, D.; Polloka, S.; Steinbrücker, C.; Weber, K.; Popp, J. SERS-based detection of biomolecules. Nanophotonics 2014, 3, 383–411. [Google Scholar] [CrossRef]
  36. Lussier, F.; Brulé, T.; Bourque, M.J.; Ducrot, C.; Trudeau, L.E.; Masson, J.F. Dynamic SERS nanosensor for neurotransmitter sensing near neurons. Faraday Disc. 2017, 205, 387–407. [Google Scholar] [CrossRef]
  37. Fleger, Y.; Rosenbluh, M. Surface Plasmons and Surface Enhanced Raman Spectra of Aggregated and Alloyed Gold-Silver Nanoparticles. Int. J. Optics 2009, 2009, 475941. [Google Scholar] [CrossRef]
  38. Wang, H.-L.; You, E.-M.; Panneerselvam, R.; Ding, S.-Y.; Tian, Z.-Q. Advances of surface-enhanced Raman and IR spectroscopies: From nano/microstructures to macro-optical design. Light Sci. Appl. 2021, 10, 161. [Google Scholar] [CrossRef]
  39. Święch, D.; Ozaki, Y.; Kim, Y.; Proniewicz, E. Surface- and tip-enhanced Raman scattering of bradykinin onto the colloidal suspended Ag surface. Phys. Chem. Chem. Phys. 2015, 17, 17140–17149. [Google Scholar] [CrossRef]
  40. Proniewicz, E.; Ignatjev, I.; Niaura, G.; Sobolewski, D.; Prahl, A.; Proniewicz, L.M. Role of Phe-D5 isotopically labeled analogues of bradykinin on elucidation of its adsorption mode on Ag, Au, and Cu electrodes. Surface enhanced Raman spectroscopy studies. J. Raman Spectrosc. 2013, 44, 1096–1104. [Google Scholar] [CrossRef]
  41. Proniewicz, E.; Skołuba, D.; Ignatjev, I.; Niaura, G.; Sobolewski, D.; Prahl, A.; Proniewicz, L.M. Influence of applied potential on bradykinin adsorption onto Ag, Au, and Cu electrodes. J. Raman Spectrosc. 2013, 44, 655–664. [Google Scholar] [CrossRef]
  42. Proniewicz, E.; Skołuba, D.; Kudelski, A.; Sobolewski, D.; Kim, Y.; Prahl, A.; Proniewicz, L.M. B2 Bradykinin Receptor Antagonists: Adsorption Mechanism onto Electrochemically Roughened Ag Substrate. J. Raman Spectrosc. 2012, 44, 205–211. [Google Scholar] [CrossRef]
  43. Sobolewski, D.; Proniewicz, E.; Skołuba, D.; Prahl, A.; Ozaki, Y.; Kim, Y.; Proniewicz, L.M. Characterization of Adsorption Mode of New B2 Bradykinin Receptor Antagonists onto Colloidal Ag Substrate. J. Raman Spectrosc. 2012, 44, 212–218. [Google Scholar] [CrossRef]
  44. Święch, D.; Tanabe, I.; Vantasin, S.; Sobolewski, D.; Ozaki, Y.; Prahl, A.; Maćkowski, S.; Proniewicz, E. Tip-enhanced Raman spectroscopy of bradykinin and its B2 receptor antagonists onto colloidal suspended Ag nanowires. Phys. Chem. Chem. Phys. 2015, 17, 22882–22892. [Google Scholar] [CrossRef] [PubMed]
  45. Proniewicz, E.; Burnat, G.; Domin, H.; Iłowska, E.; Roman, A.; Prahl, A. Spectroscopic characterization and in vitro studies of biological activity of bradykinin derivatives. Sci. Rep. 2022, 12, 19015. [Google Scholar] [CrossRef]
  46. Baalousha, M. Aggregation and disaggregation of iron oxide nanoparticles: Influence of particle concentration, pH and natural organic matter. Sci. Total Environ. 2009, 407, 2093–2101. [Google Scholar] [CrossRef] [PubMed]
  47. Behrens, M.A.; Franze’n, A.; Carlert, S.; Skantze, U.; Lindfors, L.; Olsson, U. On the Ostwald ripening of crystalline and amorphous nanoparticles. Soft Matt. 2025, 21, 2349. [Google Scholar] [CrossRef] [PubMed]
  48. Podstawka, E.; Proniewicz, L.M. The orientation of BN-related peptides adsorbed at a SERS-active silver nanoparticles: Comparison with a silver electrode surface. J. Phys. Chem. B 2009, 113, 4978–4985. [Google Scholar] [CrossRef]
  49. Proniewicz, E.; Ozaki, Y.; Kim, Y.; Proniewicz, L.M. Adsorption Mode of Neurotensin Family Peptides Adsorbed onto a Colloidal Silver Surface: SERS Studies. J. Raman Spectrosc. 2013, 44, 355–361. [Google Scholar] [CrossRef]
  50. Moskovits, M.; DiLella, D.P.; Maynard, K.J. Surface Raman spectroscopy of a number of cyclic aromatic molecules adsorbed on silver: Selection rules and molecular reorientation. Langmuir 1988, 4, 67–76. [Google Scholar] [CrossRef]
  51. Gao, X.; Davies, J.P.; Weaver, M.J. Test of surface selection rules for surface-enhanced Raman scattering: The orientation of adsorbed benzene and monosubstituted benzenes on gold. J. Phys. Chem. 1990, 94, 6858–6864. [Google Scholar] [CrossRef]
  52. Pemberton, J.E.; Bryant, M.A.; Sobocinski, R.L.; Joa, S.L. A simple method for determination of orientation of adsorbed organics of low symmetry using surface-enhanced Raman scattering. J. Phys. Chem. 1992, 96, 3776–3782. [Google Scholar] [CrossRef]
  53. Carron, K.T.; Hurley, L.G. Axial and azimuthal angle determination with surface-enhanced Raman spectroscopy: Thiophenol on copper, silver, and gold metal surfaces. J. Phys. Chem. 1991, 95, 9979–9984. [Google Scholar] [CrossRef]
  54. Moskovits, M.; Suh, J.S. Surface selection rules for surface-enhanced Raman spectroscopy: Calculations and application to the surface-enhanced Raman spectrum of phthalazine on silver. J. Phys. Chem. 1984, 88, 5526–5530. [Google Scholar] [CrossRef]
  55. Moskovits, M.; Suh, J.S. The geometry of several molecular ions adsorbed on the surface of colloidal silver. J. Phys. Chem. 1984, 88, 1293–1298. [Google Scholar] [CrossRef]
  56. Moskvits, M. Surface-Enhanced Spectroscopy. Rev. Mod. Phys. 1985, 57, 783–826. [Google Scholar] [CrossRef]
  57. Gao, X.; Weaver, M.J. Surface-enhanced Raman spectroscopy as a probe of adsorbate-surface bonding: Benzene and monosubstituted benzenes adsorbed at gold electrodes. J. Phys. Chem. 1985, 89, 5040–5046. [Google Scholar] [CrossRef]
  58. Podstawka, E. Effect of amino acids modifications on non-adsorbed and adsorbed on electrochemically roughened silver surface molecular structure of bombesin 6-14 fragments. J. Raman Spectrosc. 2008, 39, 1290–1305. [Google Scholar] [CrossRef]
  59. Domin, H.; Piergies, N.; Święch, D.; Pięta, E.; Kim, Y.; Proniewicz, E. SERS characterization of neuropeptide Y and its C-terminal fragments onto colloidal gold nanoparticles surface. Coll. Surf. B 2017, 149, 80–88. [Google Scholar] [CrossRef]
  60. Podstawka, E.; Sikorska, E.; Proniewicz, L.M.; Lammek, B. Raman and Surface-enhanced Raman spectroscopy investigation of vasopressin analogues containing 1-aminocyclohexane-1-carboxylic acid residue. Biopolymers 2006, 83, 193–203. [Google Scholar] [CrossRef] [PubMed]
  61. Ignatjev, I.; Proniewicz, E.; Proniewicz, L.M.; Niaura, G. Effect of Potential on Temperature-Dependent SERS Spectra of Neuromedin B on Cu Electrode. Phys. Chem. Chem. Phys. 2013, 15, 807–815. [Google Scholar] [CrossRef]
  62. Podstawka, E.; Kudelski, A.; Proniewicz, L.M. Adsorption mechanism of physiologically active L-phenylalanine phosphonodipeptide analogues: Comparison of colloidal silver and macroscopic silver substrates. Surf. Sci. 2007, 601, 4971–4983. [Google Scholar] [CrossRef]
  63. Rao, P.V.R.; Srishailam, K.; Ravindranath, L.; Reddy, B.V.; Rao, G.R. Structural and vibrational properties of pentabromophenol and pentafluorophenol: A spectroscopic investigation using density functional theory. J. Mol. Struct. 2019, 1180, 665–675. [Google Scholar] [CrossRef]
  64. Aliaga, A.E.; Garrido, C.; Leyton, P.; Diaz, G.; Gomez-Jeria, J.S.; Aguayo, T.; Clavijo, E.; Campos Vallette, M.M.; Sanchez-Cortes, S. SERS and theoretical studies of arginine. Spectrochim. Acta A 2010, 76, 458–463. [Google Scholar] [CrossRef]
  65. Cárcamo, J.J.; Aliaga, A.E.; Clavijo, E.; Garrido, C.; Gómez-Jeria, J.S.; Campos-Vallette, M.M. Proline and hydroxyproline deposited on silver nanoparticles. A Raman, SERS and theoretical studies. J. Raman Spectrosc. 2012, 43, 750–755. [Google Scholar] [CrossRef]
  66. Podstawka, E.; Ozaki, Y.; Proniewicz, L.M. Part I: Surface enhanced Raman spectroscopy investigation of amino acids and their homodipeptides adsorbed on colloidal silver. Appl. Spectrosc. 2004, 58, 570–580. [Google Scholar] [CrossRef]
  67. Chemical Book, 1,2,3,4-TETRAHYDROISOQ UINOLINE(91-21-4) Raman. Available online: https://www.chemicalbook.com/SpectrumEN_91-21-4_Raman.htm (accessed on 17 August 2025).
  68. Podstawka, E.; Ozaki, Y.; Proniewicz, L.M. Structures and bonding on colloidal silver surface of the various length carboxyl terminal fragments of bombesin. Langmuir 2008, 24, 10807–10816. [Google Scholar] [CrossRef] [PubMed]
  69. Podstawka, E.; Borszowska, R.; Grabowska, M.; Drąg, M.; Kafarski, P.; Proniewicz, L.M. Investigation of Molecular Structure and Adsorption Mechanism of Phosphonodipeptides by infrared, Raman, and surface enhanced Raman spectroscopy. Surf. Sci. 2005, 599, 207–220. [Google Scholar] [CrossRef]
  70. Wang, S.S. p-Alkoxybenzyl Alcohol Resin and p-Alkoxybenzyloxycarbonylhydrazide Resin for Solid Phase Synthesis of Protected Peptide Fragments. J. Am. Chem. Soc. 1973, 95, 1328–1333. [Google Scholar] [CrossRef] [PubMed]
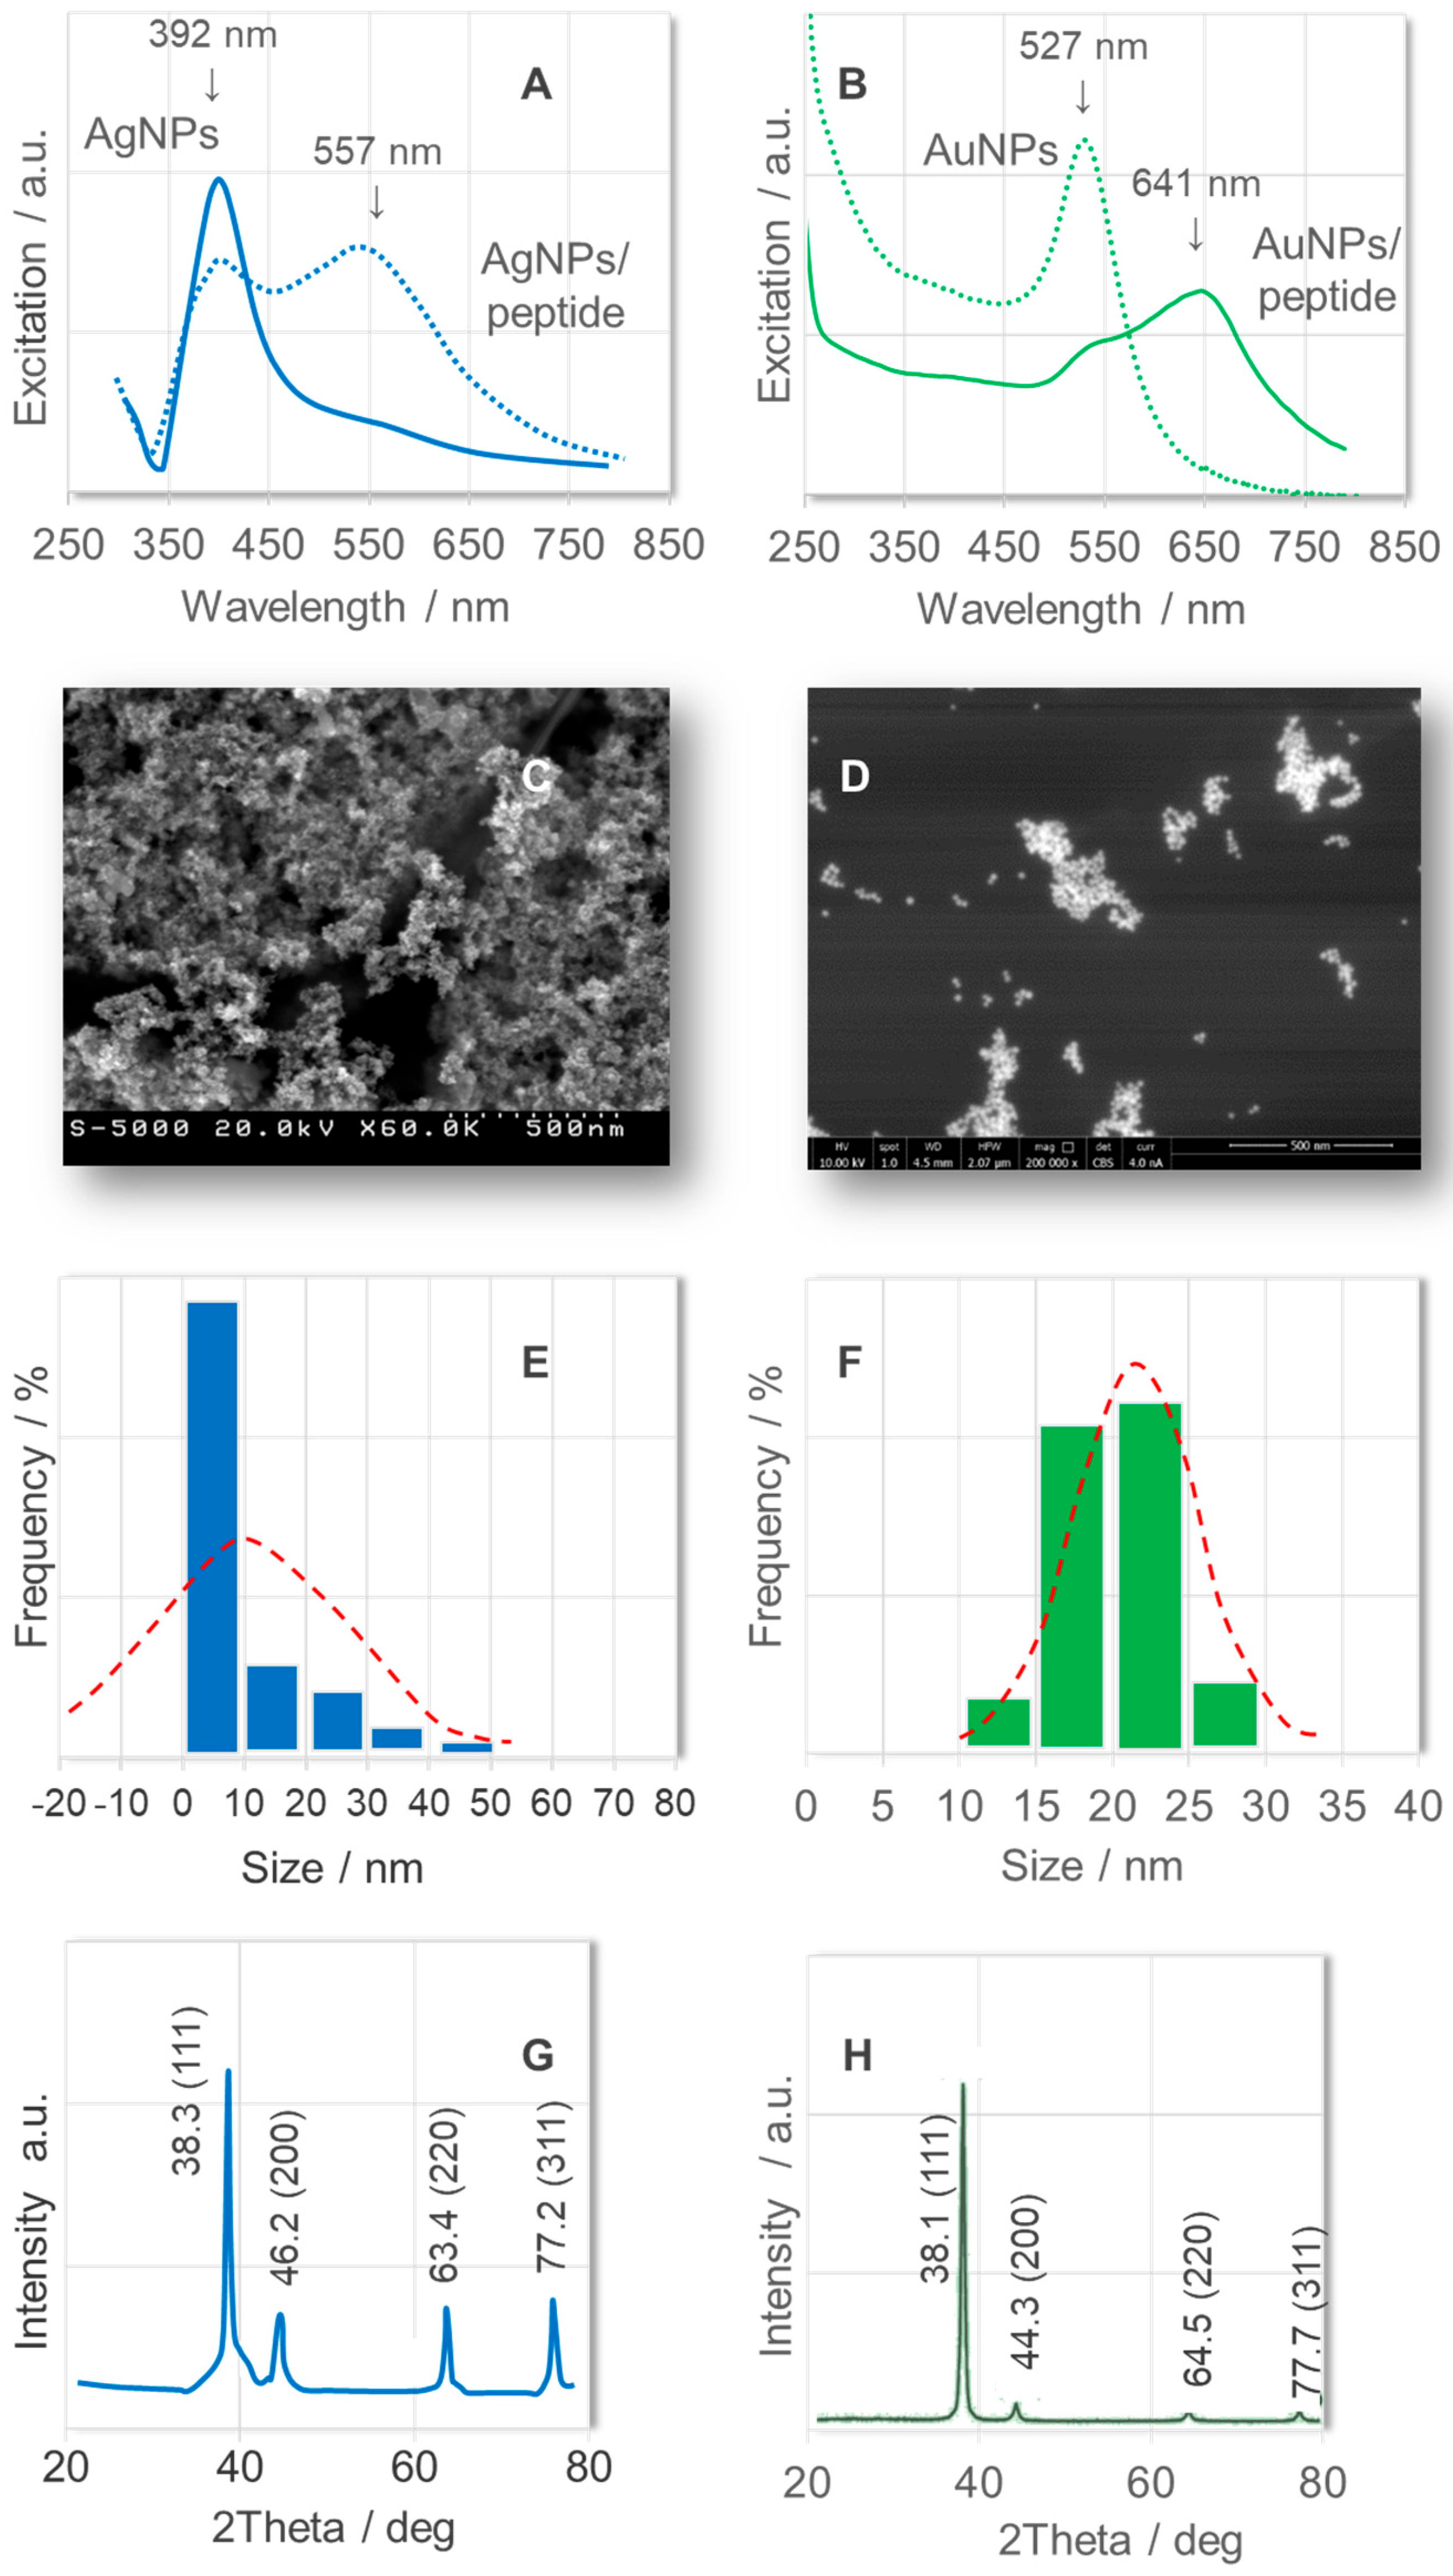
Figure 1. Excitation (UV—Vis) spectra of (A)—the aqueous Ag sol (nanoparticles with a diameter of ~10 nm; solid line) and the peptide/AgNPs (dotted lines) and (B)—the aqueous Au sol (nanoparticles with a diameter of ~20 nm; solid line) and the peptide/AuNPs (dotted lines). Insets: (C)—SEM image of AgNPs (10.0 kV, ×200,000, scale 500 nm); (D)—SEM image of AuNPs (10.0 kV, ×200,000, scale 500 nm), (E)—DLS analysis of AgNPs; (F)—DLS analysis of AuNPs; (G)—XRD pattern of AgNPs; and (H)—XRD pattern of AuNPs.
Ijms 26 08089 g001
Figure 2. Raman (black) and SERS spectra of (A)—[D—Arg0,Hyp3,Thi5,D—Phe7,Thi8]BK, (B)—[D—Arg0,Hyp3,Thi5,D—Tic7,Oic8]BK, (C)—[D—Arg0,Hyp3,Igl5,D-Phe(5F)7,Oic8]BK, and (D)—[D—Arg0,Hyp3,Igl5,D—Igl7,Oic8]BK immobilized on AgNPs (blue line) and AuNPs (green line).
Ijms 26 08089 g002
Figure 3. ATR—FTIR (black) and SEIRA spectra of (A)—[D—Arg0,Hyp3,Thi5,D—Phe7,Thi8]BK, (B)—[D—Arg0,Hyp3,Thi5,D—Tic7,Oic8]BK, (C)—[D—Arg0,Hyp3,Igl5,D—Phe(5F)7,Oic8]BK, and (D)—[D—Arg0,Hyp3,Igl5,D—Igl7,Oic8]BK immobilized on AgNPs (blue line) and AuNPs (green line).
Ijms 26 08089 g003
Table 1. Primary structure of highly selective bradykinin B2 receptor antagonists.
PeptidePeptide Sequence
0123456789
Native BKArgProProGlyPheSerProPheArg
[D-Arg0,Hyp3,Thi5,D-Phe7,Thi8]BKD-ArgArgProHypGlyThiSerD-PheThiArg
[D-Arg0,Hyp3,Thi5,D-Tic7,Oic8]BKD-ArgArgProHypGlyThiSerD-TicOicArg
[D-Arg0,Hyp3,Igl5,D-Phe(5F)7,Oic8]BKD-ArgArgProHypGlyL-IglSerD-Phe(5F)OicArg
[D-Arg0,Hyp3,Igl5,D-Igl7,Oic8]BKD-ArgArgProHypGlyL-IglSerD-IglOicArg
Hyp
L-hydroxyproline
Ijms 26 08089 i001
Thi
L-thienylalanine
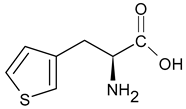
Ijms 26 08089 i002
D-Tic
D-1,2,3,4-tetrahydroisoquinoline-3-carboxylic acid
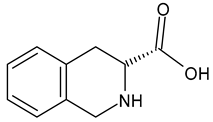
Ijms 26 08089 i003
Igl
2-indanylglycine
Ijms 26 08089 i004
Oic
L-octahydroindole-2-carboxylic acid
Ijms 26 08089 i005
Table 2. Proposed assignment of observed bands in Raman and SERS spectra.
AssignmentWavenumber/cm−1
[D-Arg0,Hyp3, Thi5, D-Phe7,Thi8]BK[D-Arg0,Hyp3,Thi5, D-Tic7,Oic8]BK[D-Arg0,Hyp3,Igl5,D-Phe(5F)7,Oic8]BK[D-Arg0,Hyp3,Igl5, D-Igl7,Oic8]BK
RamanSERS
Ag
SERS
Au
RamanSERS
Ag
SERS
Au
RamanSERS
Ag
SERS
Au
RamanSERS
Ag
SERS Au
Phe(F5) [ν8a] 1682
Amide I/Arg νas(C=N)166015651546166315861522165915851591167615861564
Phenyl ring [ν8a]1603 15921610 15831607 15601606 1598
Phenyl ring [ν8a]1584 1590 1584 1585
νas(COO)1534 15201533 1522 1509 1527
δ(CH2) + Imide II/Arg ρasb(CH2)/a-ring ρs(CH2)14581456144914611457149014641455 146814561485
δ(CH2) and Imide II1437 14381438 1445 1442144614371444
νs(COO) 1381 13971393 13971404
Arg ρb(CH2)/Thi δ(CH) + ν(C=C) and a-ring combination 13661352 134313521364134313521343134313521367
a-ring ν(CN), δ(CCαH) 13051322 13221315 1323
a-ring [ν(CN) + ρb(CCH) + ρr/t(CH2)]/Imide II129412841276 1296 12961294 1290
Thi ρr(CH)/a-ring ρt(CH2) 1262 12831263 1261 1272
Amide III1248 12441246 1247 12391248 1237
Phenyl ring [ν7a]1201 12231201 1208 11981209 1215
Arg ρr(NH2)/a-ring ρt(CH2)1167116611801158 117411541166 115311391169
a-ring ρt(CH2)1127 1123 11231134 11231127
ν(CN)1097 1096108710801088 10881087
Arg ν(CC) + ν(NC)/a-ring ν(CC)1061 1074 1066 1066
Igl ν(CC) + ν(NC) 1045 1044
Thi ν(CC) + ρr(CH)/Arg guanidino group/δ(a-ring) + ρt(CH2)/Phe [ν18a] 10131034 10341024 10241024 1020
Phe [ν12] 1001 996
Igl 1011 1011
ρr(CH2) 982990 959987 988987 991
Arg ν(CC)/a-ring ρr(CH) /ρw(CH2) + γ(ring)/[ν(CCOO–)], 906925925 924 928925912
Thi δ(ring) + ν(CS)/a-ring ν(CCC) 888 880 883870 870
Thi δ(ring) + ν(CC)/Arg ν(CC)/a-ring (ρr(CβH2)850 836851 833 824
Thi δ(ring) + ν(CC)/a-ring breath 811 817811 817 829
a-ring (ρr(CγH2) 784789 788
Thi δ(ring) + ν(CS)/a-ring ρr(CH2) + ρb(CNH)741 732742 742
Thi ring ρw(CH)673673653662674663 675664 673666
ρb(COO)/Amide V649 648599653648607 585 606
Arg ρt(NH2)/a-ring δ(CCN)/Phe(F5)505 501506 551564 542
γ(ring)465 481445 446 461
Abbreviations: ν—stretching, δ—deformation, ρr—rocking, ρw—wagging, ρb—bending, ρt—twisting, ρs—scissoring, γ—torsional, s—symmetric, as—asymmetric vibrations, Arg—L-arginine, Phe—phenyl ring, and Thi—thienyalalanine.
Table 3. Proposed assignment of observed bands in ATR-FTIR and SEIRA spectra.
AssignmentWavenumber/cm−1
[D-Arg0,Hyp3,Thi5,D-Phe7,Thi8]BK[D-Arg0,Hyp3,Thi5,D-Tic7,Oic8]BK[D-Arg0,Hyp3,Igl5,D-Phe(5F)7,Oic8]BK[D-Arg0,Hyp3,Igl5,D-Igl7,Oic8]BK
ATR-FTIRSEIRA
Ag
SEIRA
Au
ATR-FTIRSEIRA
Ag
SEIRA
Au
ATR-FTIRSEIRA
Ag
SEIRA
Au
ATR-FTIRSEIRA
Ag
SEIRA Au
ν(C=O)1729 1729 17501728 17501724 1735
Amide I [ν(C=O)]/Arg νas(C=N), δ(NH2)164716601660
1640
163216651631163816641658
1626
164816531659
1620
νas(COO) 1580 1579 1580 1572
Amide II [ν(NC) + ρipb(NH)]1537153315331545
1530
1548
1533
1545 1551154815481555
Imide II/Arg ρas b(CH2) 1470 1467 14561470 14571471 1465
a-ring ρs(CH2)14561433145714471447 14501450 1452 1452
νs(COO) 1397 13961396 13981396 1393
ρ(CH2) 1368 13391367 13391365 1364
Amide III125112511251125112511252125112611251125112591251
ρr(CH2), ν(CC) 1202 11971196 11971203
ν(CN)106810781050106810741067106810781058106810781080
ρr(CH2) 976 977 956
Thi δ(ring) + ν(CC)/Arg ν(CC), δ(NH)/a-ring ν(CC)842841 843 842840 842842
δ(NH)788 757 788 789
Skeletal719 709 718 721
Amide651638 638 684639 679637
Abbreviations: ν—stretching, δ—deformation, ρr—rocking, ρw—wagging, ρb—bending, ρt—twisting, ρs—scissoring, γ—torsional, s—symmetric, as—asymmetric vibrations, Arg—L-arginine, Phe—phenyl ring, and Thi—thienyalalanine.
Disclaimer/Publisher’s Note: The statements, opinions and data contained in all publications are solely those of the individual author(s) and contributor(s) and not of MDPI and/or the editor(s). MDPI and/or the editor(s) disclaim responsibility for any injury to people or property resulting from any ideas, methods, instructions or products referred to in the content.