Article

Genome-Wide Identification of GmARF9b/GmARF2a Negatively Regulate Root Growth in Soybean

Root Biology Center, College of Resources and Environment, Fujian Agriculture and Forestry University, Fuzhou 350002, China
*
Authors to whom correspondence should be addressed.
Int. J. Mol. Sci. 2025, 26(10), 4547; https://doi.org/10.3390/ijms26104547
Submission received: 12 April 2025 / Revised: 4 May 2025 / Accepted: 6 May 2025 / Published: 9 May 2025
(This article belongs to the Special Issue Molecular Biology of Soybean)

Abstract

:
Auxin is the most important phytohormone, regulating root growth and development in plants. ARFs function as central regulators in auxin signaling in model plants, and the functions of ARF activators have been widely investigated, while the functions of ARF repressors remain elusive. In this study, we investigated the family of GmARFs in soybean through a genome-wide expression pattern and functional study of roots highly expressing ARFs. In total, we identified 59 GmARF members in the soybean genome. GmARFs harbor canonical B3 DNA-binding (B3), ARF (Aux rep), and PB1 functional protein domains. We identified two potential repressor genes, GmARF9b (Glyma.03G070500) and GmARF2a (Glyma.05G200800), which are specifically or highly expressed in the roots. Histochemical staining suggested that both genes are primarily expressed in the stele, root tips, and lateral root primordia. Subcellular localization analysis showed they were mainly localized in the nucleus. Overexpression of GmARF9b and GmARF2a significantly inhibited root growth using a transgenic hairy root assay. Root section analysis further suggested that GmARF9b and GmARF2a negatively regulated cortical cell layers and the longitudinal cell length of roots, thereby modulating root growth. Overall, this study has preliminarily identified two GmARFs that inhibit root growth in soybean. This discovery has deepened our understanding of the functions of ARFs in root development and has provided guidance for breeding crop roots with improved nutrient use efficiency.

1. Introductions

It is known that auxin is the most essential phytohormone, regulating root growth and development, including vascular tissue differentiation, root primordium formation, cell division, and differentiation [1,2]. Auxin regulates plant growth and development through specific signaling transduction, among which the intracellular Aux/IAA-TIR1-ARF pathway is critical for auxin signaling transduction. This pathway consists of three components, Aux/IAAs, auxin response factors (ARFs), and auxin receptors (transport inhibitor resistant 1/auxin signaling F-box, TIR1/AFB). When the exogenous auxin concentration is low, protein domain I of Aux/IAA interacts with the ARF PB1 domain, which inhibits the expression of downstream genes by ARFs. When the auxin concentration is high, the TIR1/AFB receptor interacts with Aux/IAAs, leading to ubiquitination of the Aux/IAAs protein and thus protein degradation through the 26S proteasome pathway. Thereby, it releases ARF transcription factors to induce the expression of auxin response genes [3]. Hence, ARFs are the key transcription factors in the auxin signaling pathway.
To date, numerous ARF (auxin response factor) genes have been identified across diverse plant species [4]. There are 22 ARFs, 25 ARFs, 59 ARFs, 22 AFRs, 25 ARFs, 23 ARFs, 25 ARFs, 19 ARFs, and 36 ARFs that have been identified in Arabidopsis thaliana, Brassica oleracea var. capitata Linnaeus, Glycine max (L.) Merr., Oryza sativa, Triticum aestivum, Sorghum bicolor, Vitis vinifera L., and Zea mays [4,5,6,7,8]. Systematic analyses of ARF gene families across diverse plant species have enabled comprehensive functional characterization of ARF transcription factors in model organisms. Current research has demonstrated that auxin response factor (ARF) proteins typically consist of three evolutionarily conserved domains, the DNA-binding domain (DBD), the middle region (MR), and the protein C-terminal domain (CTD) [5]. The DNA-binding domain (DBD) of ARFs is B3 type DBD, which is the key domain responsible for DNA binding [9]. The middle region (MR) is a key non-conserved domain that determines the activation domain (AD) or repression domain (RD) of ARF. The C-terminal domain (CTD) shares similar amino acid sequences with the PB1 domain (motifs III/IV) of Aux/IAA proteins, and these two domains interact through these homologous regions to form a transcriptional complex [5].
Further functional studies reveal that ARF gene family members in diverse plant species finely regulate root development through the synergistic action of conserved structural domains and species-specific mechanisms. For instance, the Arabidopsis activator AtARF5 maintains root apical meristems, the formation of lateral root primordia, and the lateral organ formation in the shoot apical meristem by regulating the expression of AtPIN1, AtPIN3, and AtPIN7 [10,11,12]. AtARF6 and AtARF8 negatively regulate adventitious root (AR) formation, wherein overexpression of AtARF8 leads to a reduction in free auxin content, which inhibits lateral root formation [5,13]. AtARF7 and AtARF19 are key genes redundantly regulating lateral root formation [14,15]. The rice transcriptional activator OsARF1 can directly bind to the auxin response element (AuxRE) in the promoter of OsCRL1, activating the transcription of this gene in the initiation zones of adventitious roots (ARs) and lateral roots (LRs), thereby regulating root growth [16]. The maize transcriptional activator ZmARF4 positively regulates the initiation and growth of lateral roots [17]. Taken together, ARF gene families of various crops are the key components that regulate root growth and development. However, most previous studies have predominantly focused on transcriptional activators, with limited attention to transcriptional suppressors and ARF genes in soybean.
In this study, we mainly focus on analyzing natural selection and the gene expression patterns of the ARF family in soybean to identify potential transcription repressors of GmARFs with specifically expressed in roots and further investigate the functions of the transcription repressor of GmARFs on root growth and development in soybean. Our study provides new insight into the functions of ARFs through understanding their underlying molecular mechanisms. It will also provide a theoretical basis for further research on the mining and utilization of superior allelic variant genes.

2. Results

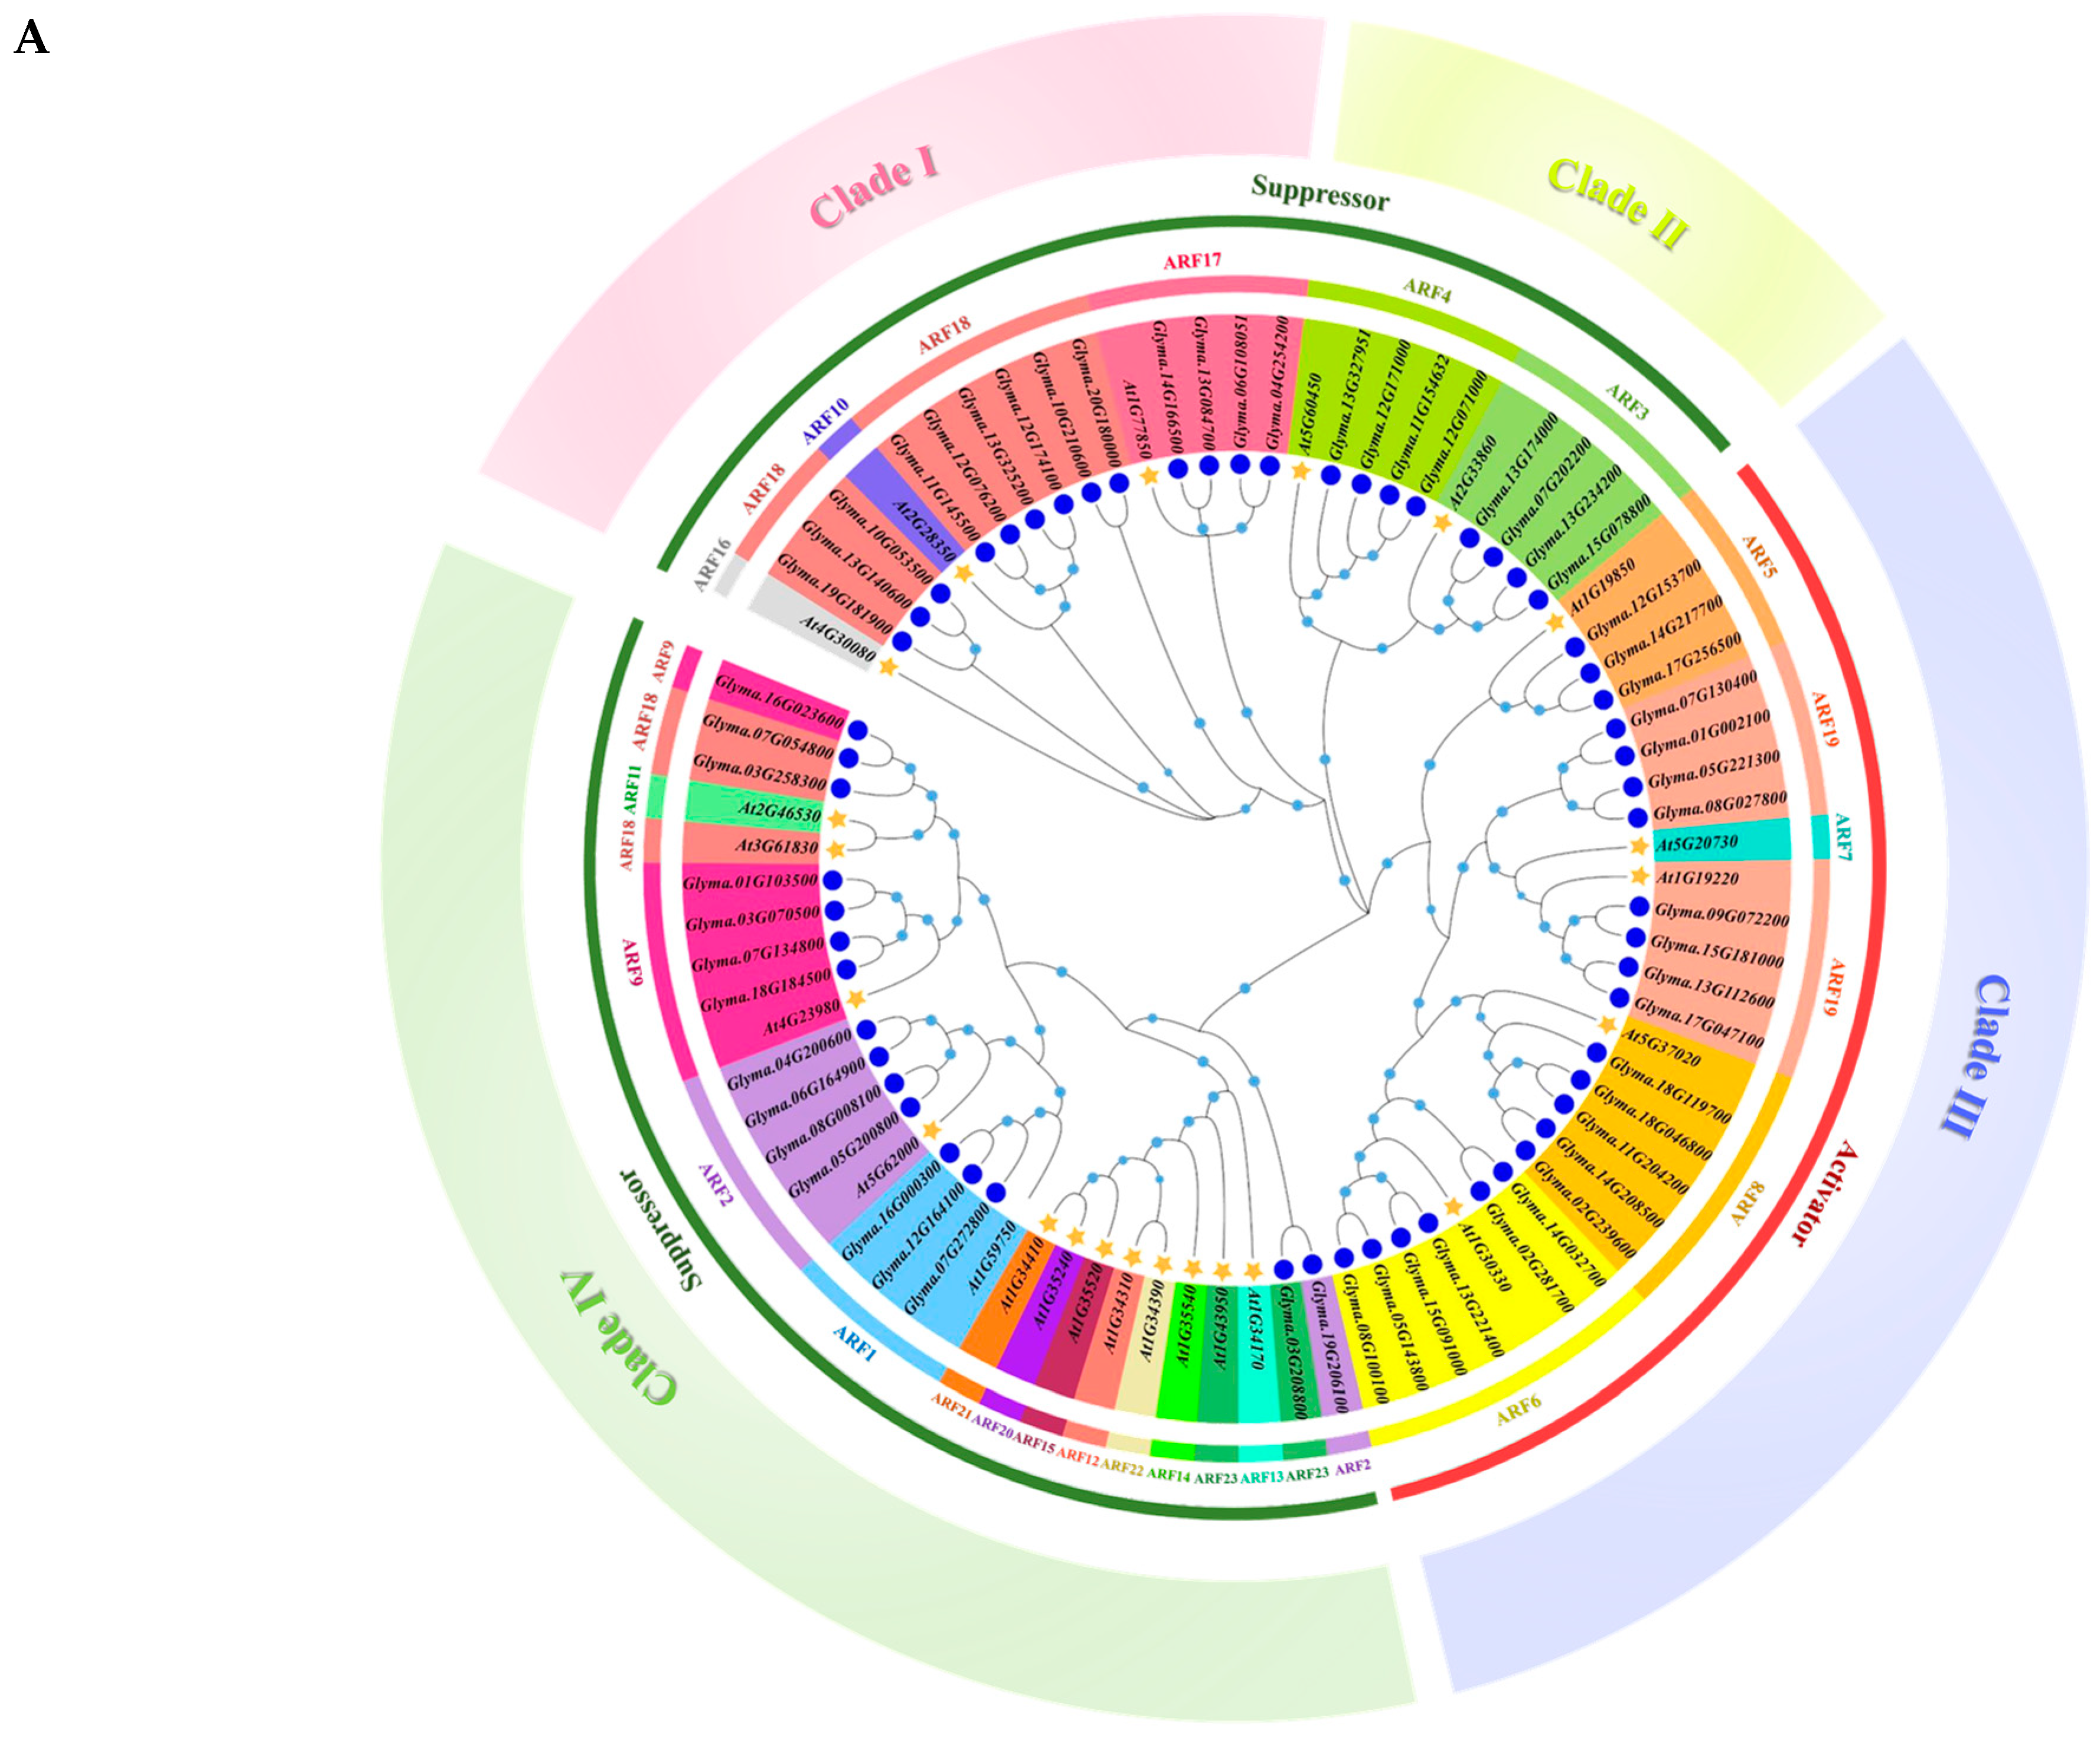
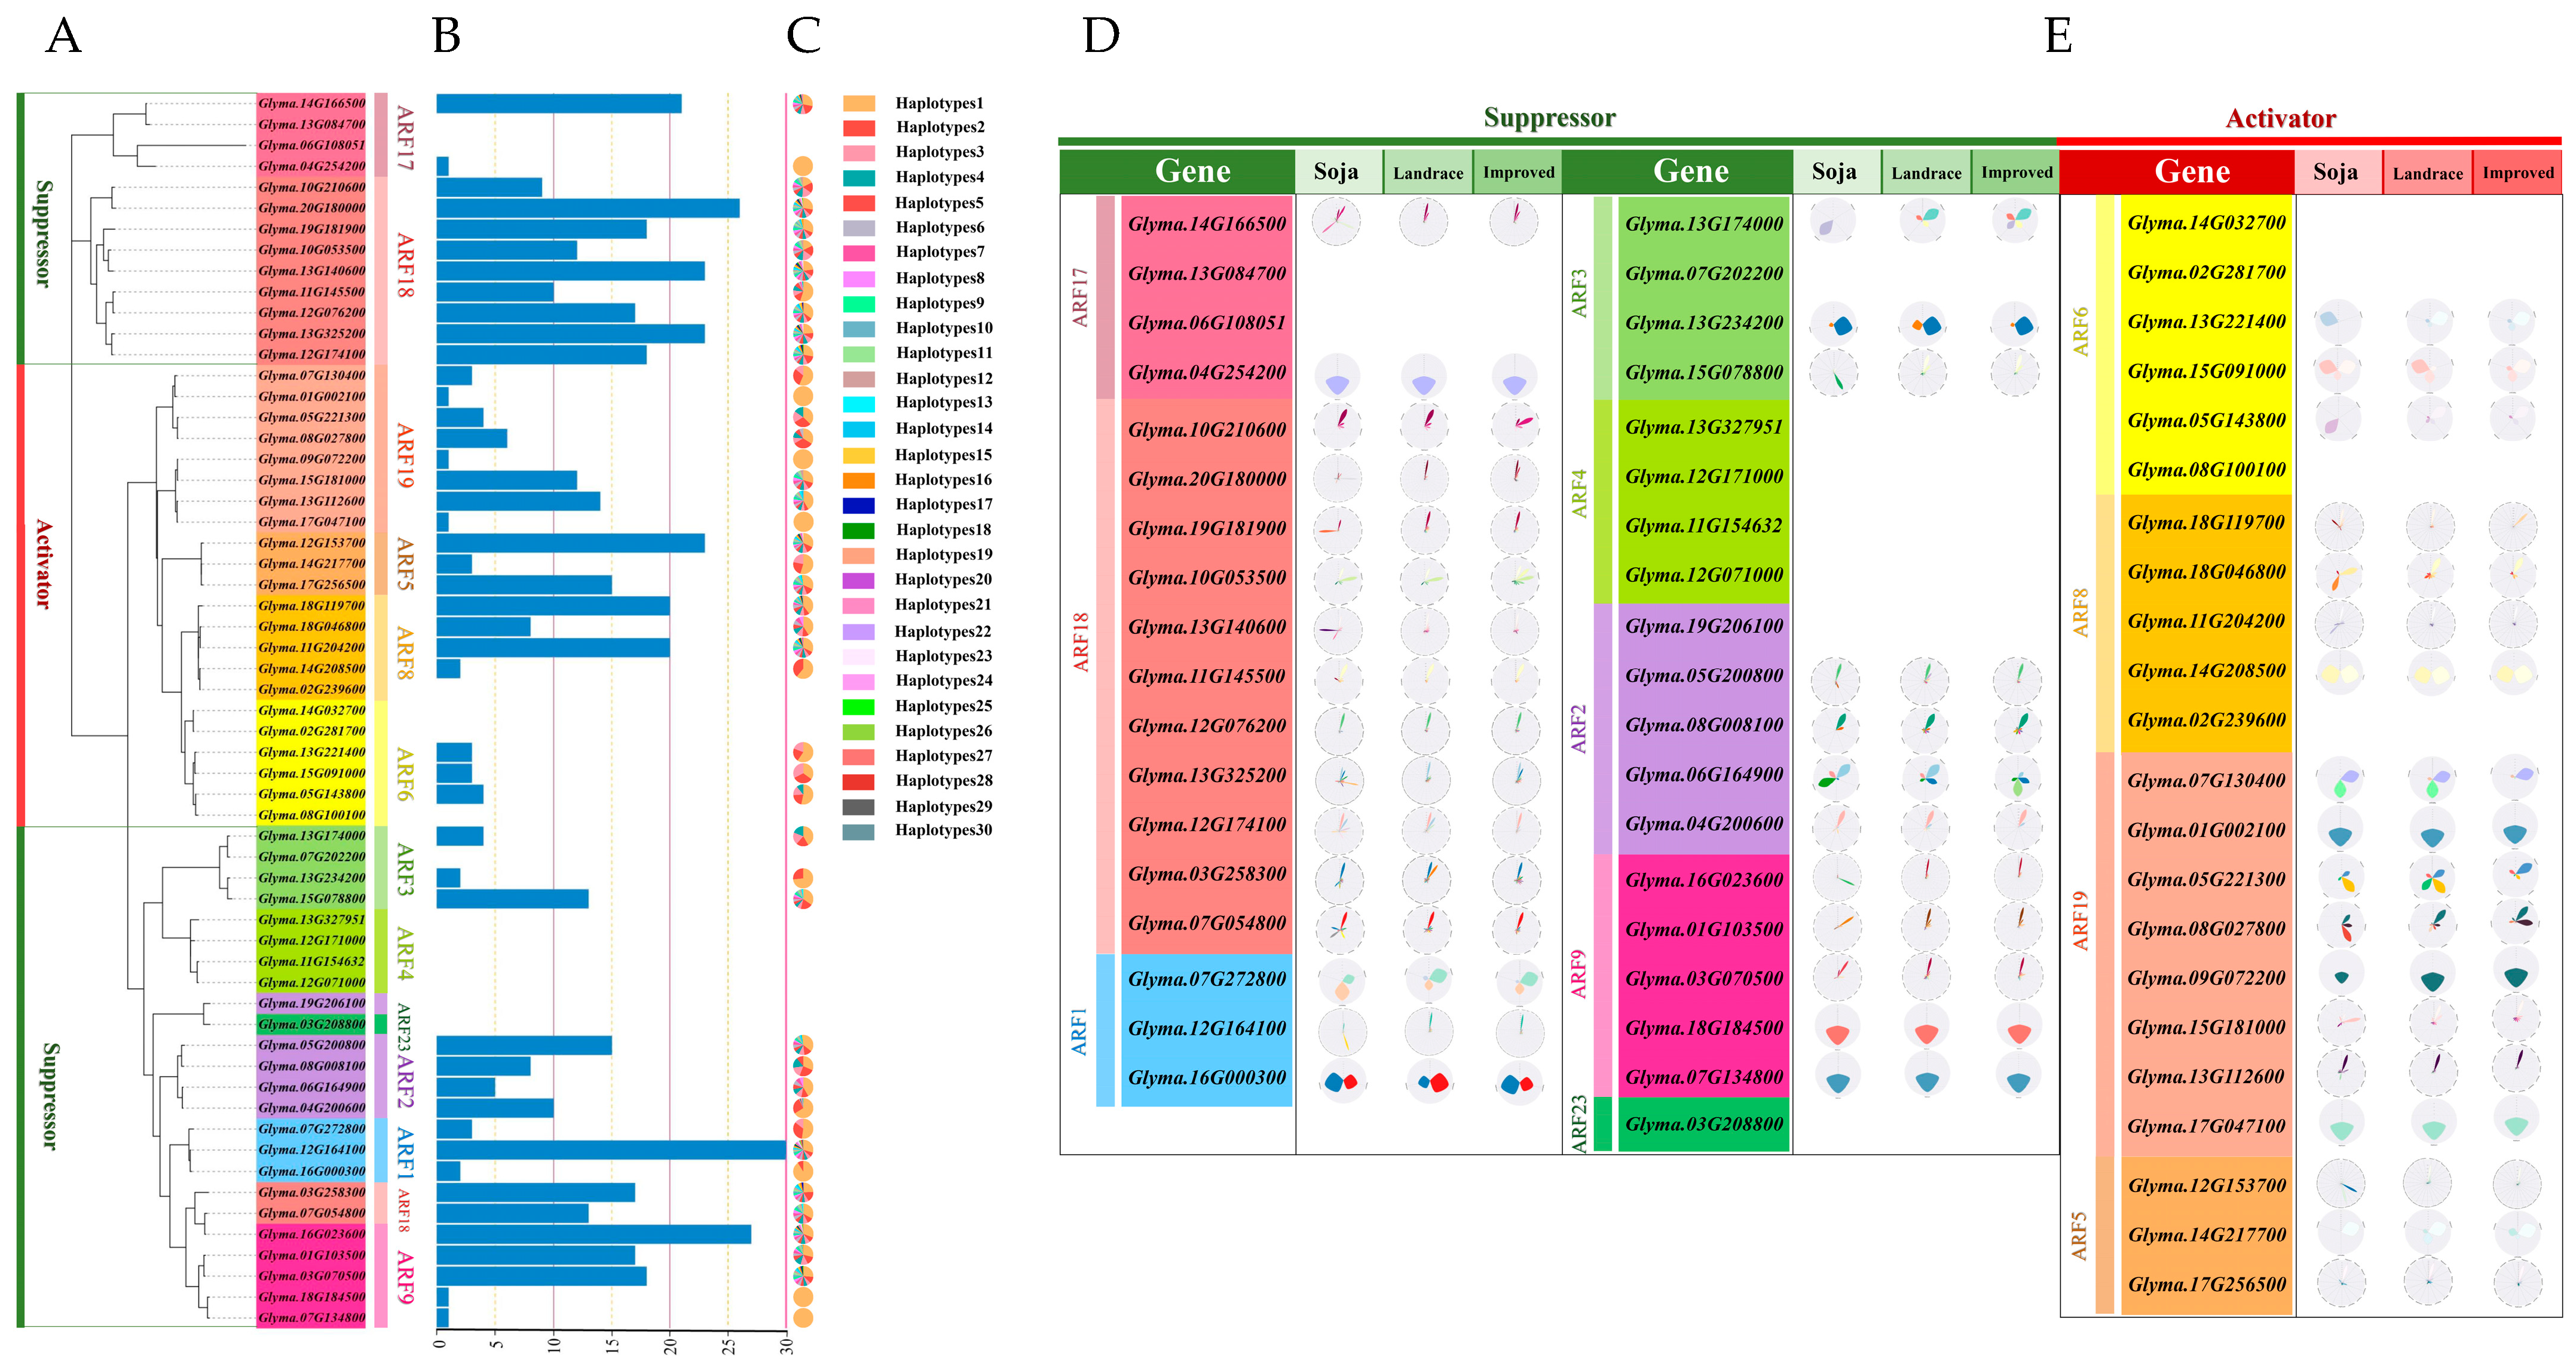
2.1. Phylogenetic, Classification, and Gene Haplotype Analysis of GmARFs

To investigate the phylogenetic tree of GmARFs and determine the evolutionary relationship among each family member of GmARFs in soybean, the amino acid sequences of 23 AtARFs from Arabidopsis thaliana and 59 GmARF members from soybean (Glycine max) were analyzed. As shown in Figure 1, 23 Arabidopsis AtARFs and 59 soybean GmARF members were divided into two major groups. Among these, subclasses I, II, and III belong to group one, and subclass IV belongs to group two. Subclass I includes ARF10, ARF16, ARF17, and ARF18 subfamilies, with 3 members from Arabidopsis thaliana and 13 members from soybean. Subclass II includes the ARF3 and ARF4 subfamilies, with two members from Arabidopsis thaliana and eight members from soybean. Subclass III includes the ARF5, ARF6, ARF7, ARF8, and ARF19 subfamilies, with 5 members from Arabidopsis thaliana and 22 members from soybean. Subclass IV contains the ARF1, ARF2, ARF9, ARF11, ARF12, ARF13, ARF14, ARF15, ARF20, ARF21, ARF22, and ARF23 subfamilies, with a total of 13 members from Arabidopsis thaliana and 16 members from soybean. Previous studies have shown that Arabidopsis AtARFs can be divided into two types according to their functions: A-ARFs (activators), which include AtARF5, AtARF6, AtARF7, AtARF8, and AtARF19; and B-ARFs (repressors), which include AtARF1, AtARF2, AtARF3, AtARF4, AtARF9, AtARF17, AtARF18, and AtARF23. Therefore, subclasses I, II, and IV can be categorized as potential repressors, while subclass III can be categorized as activators.
Subclass and subfamily analyses showed that there are no soybean family members in the ARF10 and ARF16 subfamilies in Subclass I and no soybean family members in the ARF7 subfamily (Figure 1A). The ARF7 and ARF19 subfamilies were highly homologous, and the ARF6, ARF8, and ARF19 subfamilies belonged to the same large paraclade, sharing similar evolutionary processes and having close genetic relationships (Figure 1A). The evolutionary processes of each family member are complex. Additionally, there were no soybean family members In the ARF11, ARF21, ARF20, ARF15, ARF12, ARF22, ARF14, and ARF13 subfamilies. The ARF21, ARF20, ARF15, ARF12, ARF22, ARF14, ARF13, and ARF23 subfamilies belong to a major paralogue branch with a highly homologous relationship within members (Figure 1A). ARF11 and ARF18, as well as ARF2 and ARF23, constitute two pairs of subfamilies that exhibit highly homologous relationships within the same paralogue lineage.
Based on the differences in chromosome length, genome complexity, and genetic stability observed between the tetraploid soybean and the diploid Arabidopsis thaliana, the potential evolutionary relationship between ARFs (auxin response factors) from soybean and their homologous genes in Arabidopsis thaliana was further explored. Chromosomal distribution and collinearity analyses were conducted using Circos, MCScanX, and Tbtools. A total of 59 GmARF genes from soybean were located on 20 chromosomes (Figure 1B,C). More than 20% of these GmARF genes form a cluster on chromosome 13 (8, 13.56%) and chromosome 12 (6, 10.17%), while the remaining 76% of GmARF genes were distributed in other chromosomes, with each containing 1–4 GmARF genes. Among them, activator GmARF genes were found on all chromosomes except chr3, chr4, chr6, chr10, chr12, chr16, chr19, and chr20, and most of these genes were located at the ends of chromosomes. Forty percent of the repressor GmARF genes were distributed on chromosomes 7 (4, 10%), 12 (6, 15%), and 13 (6, 15%), while the rest of the genes were distributed on the other chromosomes.
Collinearity analysis revealed that there were 78 pairs of collinear genes within the GmARF gene family in soybean, encompassing 75 pairs belonging to the same subfamily and 3 pairs belonging to different subfamilies (Figure 1B). Among the members of the GmARF2, GmARF3, and GmARF17 subfamilies, there were six pairs of collinear genes. Specifically, there were 1, 5, 2, and 24 pairs of collinear genes within the GmARF1, GmARF4, GmARF9, and GmARF18 subfamilies, respectively. The activator subfamilies exhibit a certain degree of conservation among their gene members, as evidenced by the presence of 1, 3, 6, and 12 collinear gene pairs within the GmARF5, GmARF6, GmARF8, and GmARF19 subfamilies, respectively (Figure 1B). These results suggest that genes within each subfamily might have similar functions and might participate in comparable regulatory networks. On the other hand, the repressor GmARF23 shows collinearity with Glyma.19G206100 from the repressor GmARF2 subfamily; similarly, Glyma.03G258300 and Glyma.07G054800 from the repressor GmARF18 subfamily exhibit collinear relationships with Glyma.16G023600 from the repressor GmARF9 subfamily. These findings indicate that, despite not belonging to the same subfamily, the aforementioned genes have the same conserved domains during evolution and may possess similar functions, indicating gene family expansion events of GmARF18, GmARF2, and GmARF9. Additionally, Glyma.07G272800 from the repressor GmARF1, Glyma.13G140600 from the repressor GmARF18, Glyma.12G153700 from the activator GmARF5, and Glyma.18G119700 from the activator GmARF8 do not show collinear relationships with other genes, suggesting that these genes might evolve in different ways.
Collinearity analysis between soybean and Arabidopsis revealed 41 collinear gene pairs between GmARFs and AtARFs (Figure 1D). Based on the evolutionary tree, these gene pairs can be divided into two major categories: evolutionary gene families and non-homologous gene families. Within the homologous gene families, there are 26 collinear gene pairs, including four, four, three, three, and two pairs in the repressor ARF2, ARF3, ARF4, ARF17, and ARF18 homologous gene families, respectively, and one, two, three, and four pairs in the activator ARF5, ARF6, ARF8, and ARF19 homologous gene families, respectively. This indicates that members of homologous gene families have a similar arrangement pattern on their chromosomes, suggesting close genetic relationships or shared evolutionary histories. In contrast, there are 15 collinear gene pairs in the non-homologous gene families, suggesting a shift in the chromosomal locations after gene duplication.

2.2. Analysis of the Association Between GmARF Gene Haplotypes and Natural Selection

Family and collinearity analyses indicate that the kinship among members of different subfamilies is relatively distinctive. To investigate the natural variation in the amino acid sequence of GmARFs, further haplotype analysis of the family genes was conducted (Figure 2). The results showed that the number of haplotypes for repressors GmARF2/3/4/23 and activators GmARF6/19 was lower than other GmARFs, with minimal haplotype differences among gene members within the subfamily (Figure 2B,C). The haplotype variation amplitudes are high within the families of the repressors GmARF1/9/17/18 and activators GmARF5/18.
The GmARFs have undergone natural or artificial selection, because of the genetic variations during the transition from wild to cultivar, exhibiting a reduction in the number of alleles and reduced sequencing diversity. To further explore the genetic changes during the domestication of GmARFs, genetic structure maps were analyzed (Figure 2D,E). Specifically, the repressor subfamilies GmARF1/2/3/17 and the activator subfamily GmARF6 were selected during domestication. Furthermore, more than 60% of the members within each subfamily of repressors GmARF9/18 and activators GmARF5/8/19 possess two to five haplotypes that have undergone significant selection.

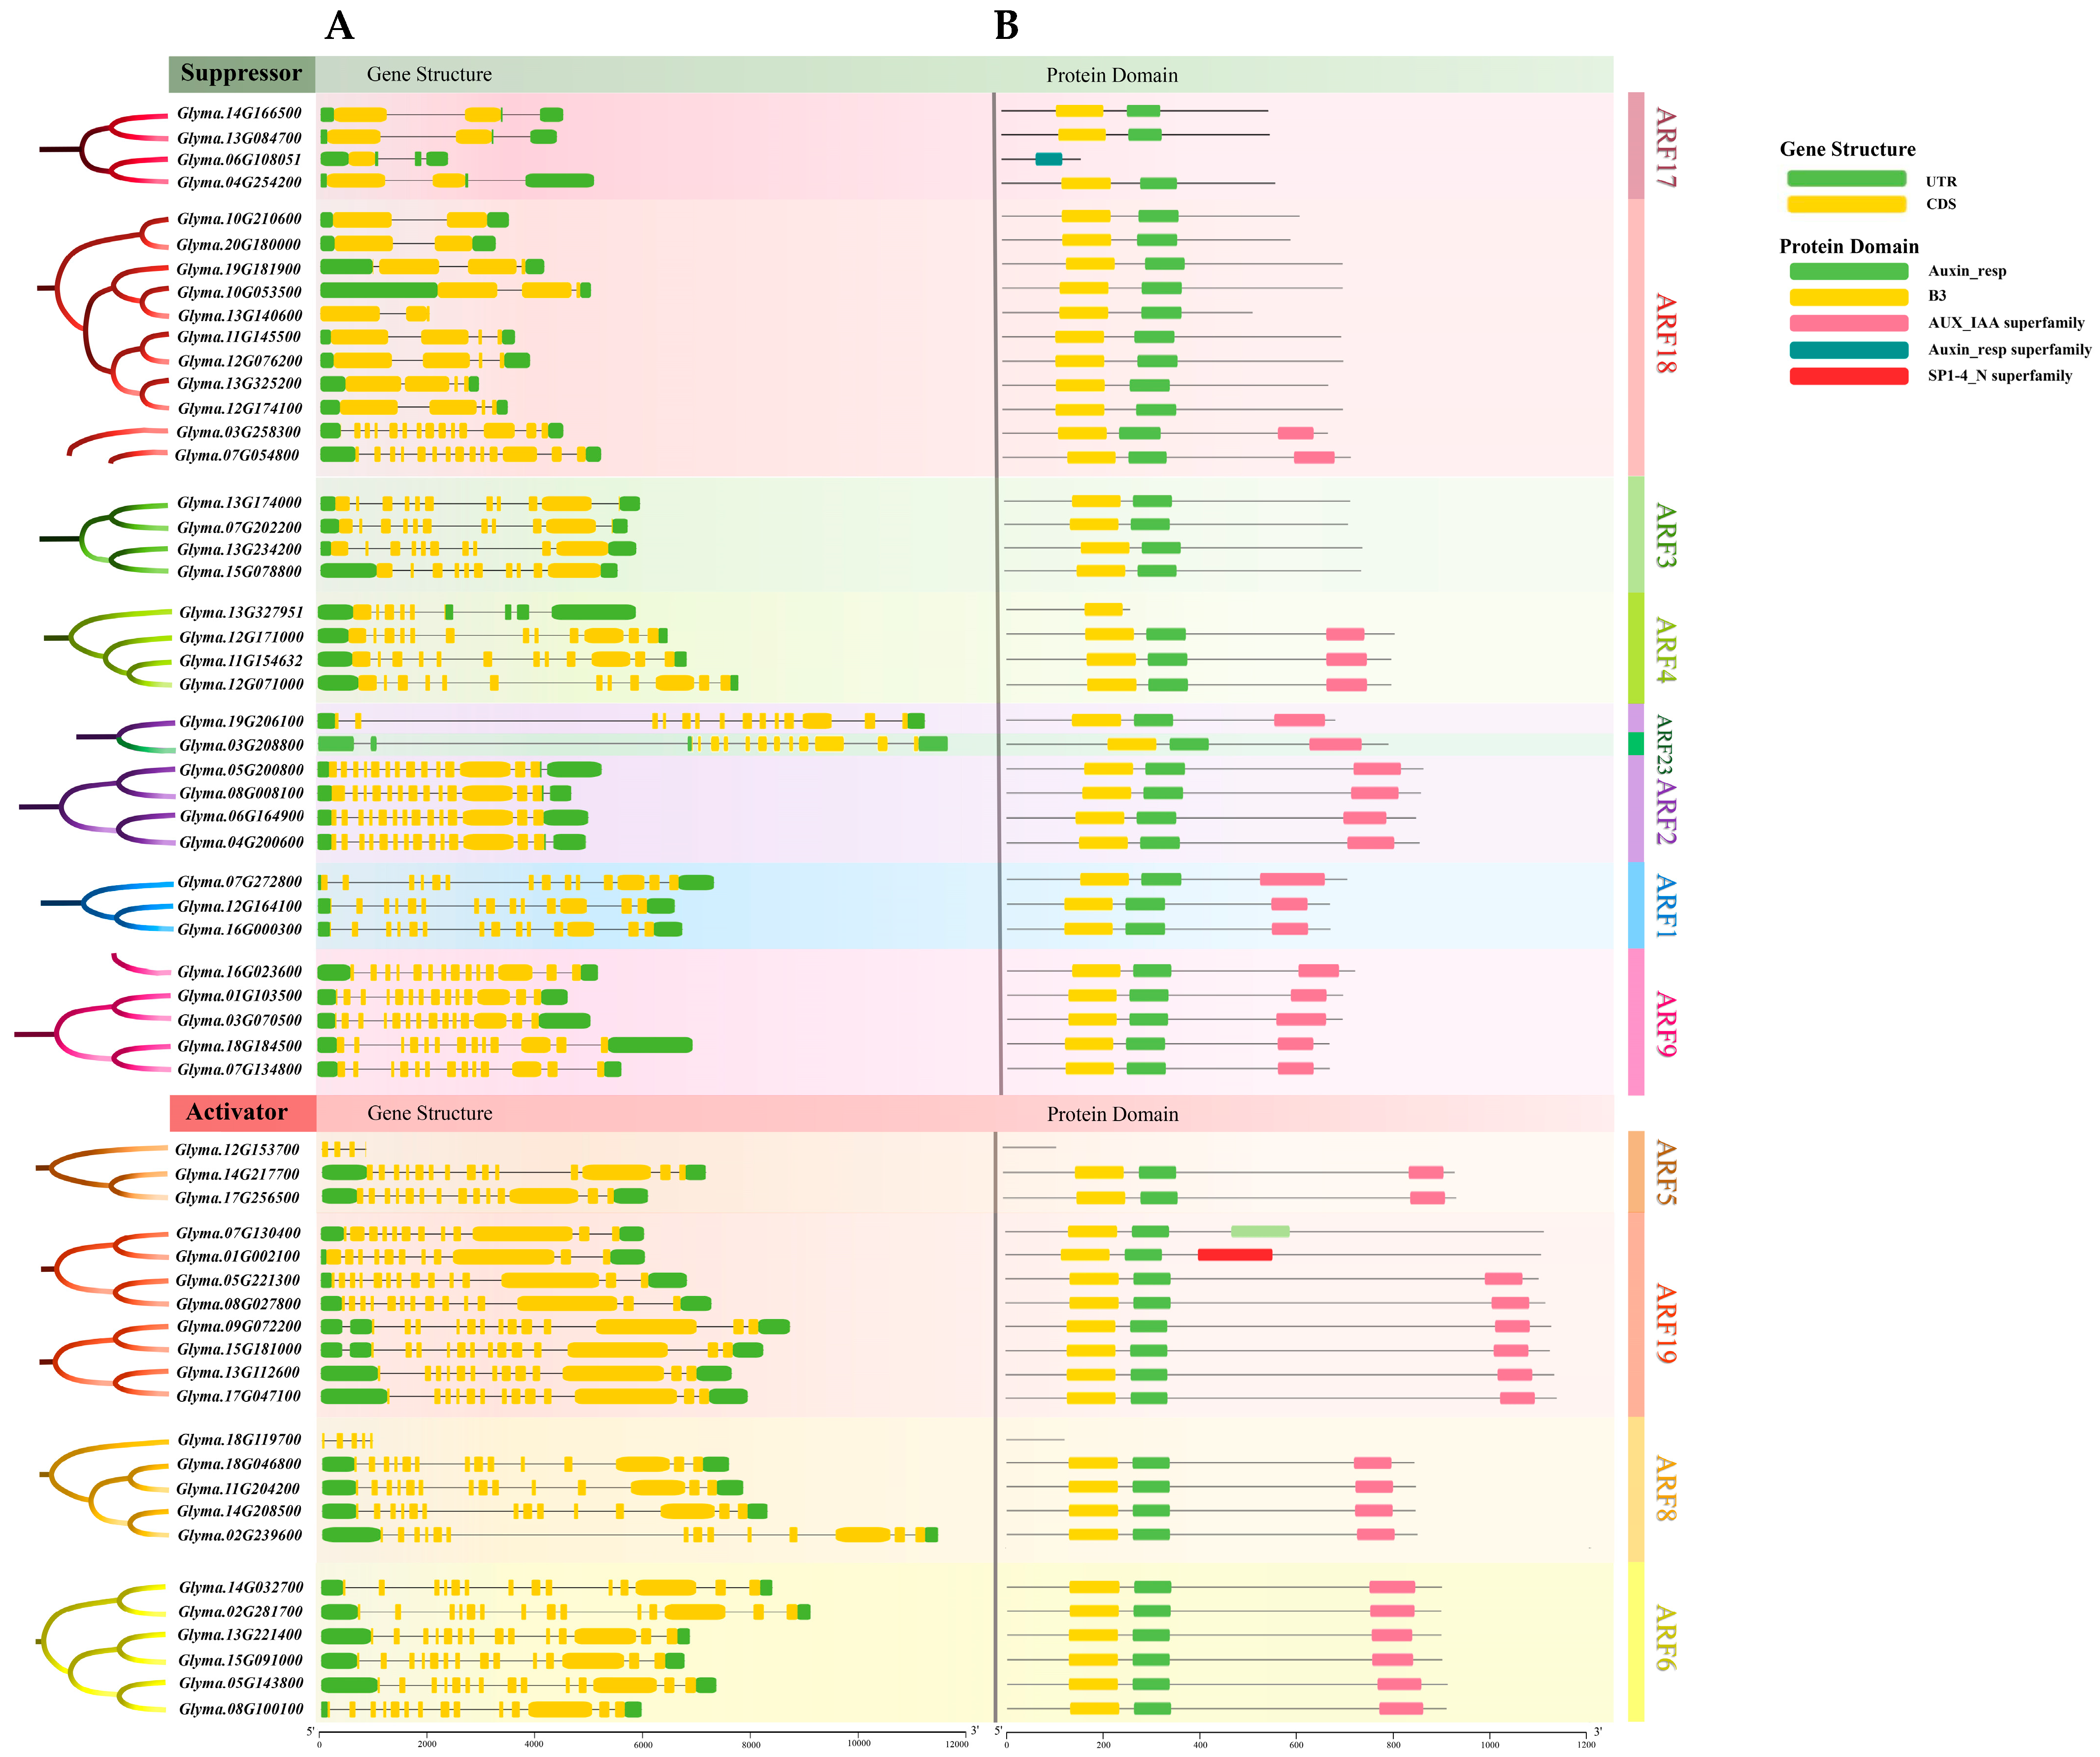
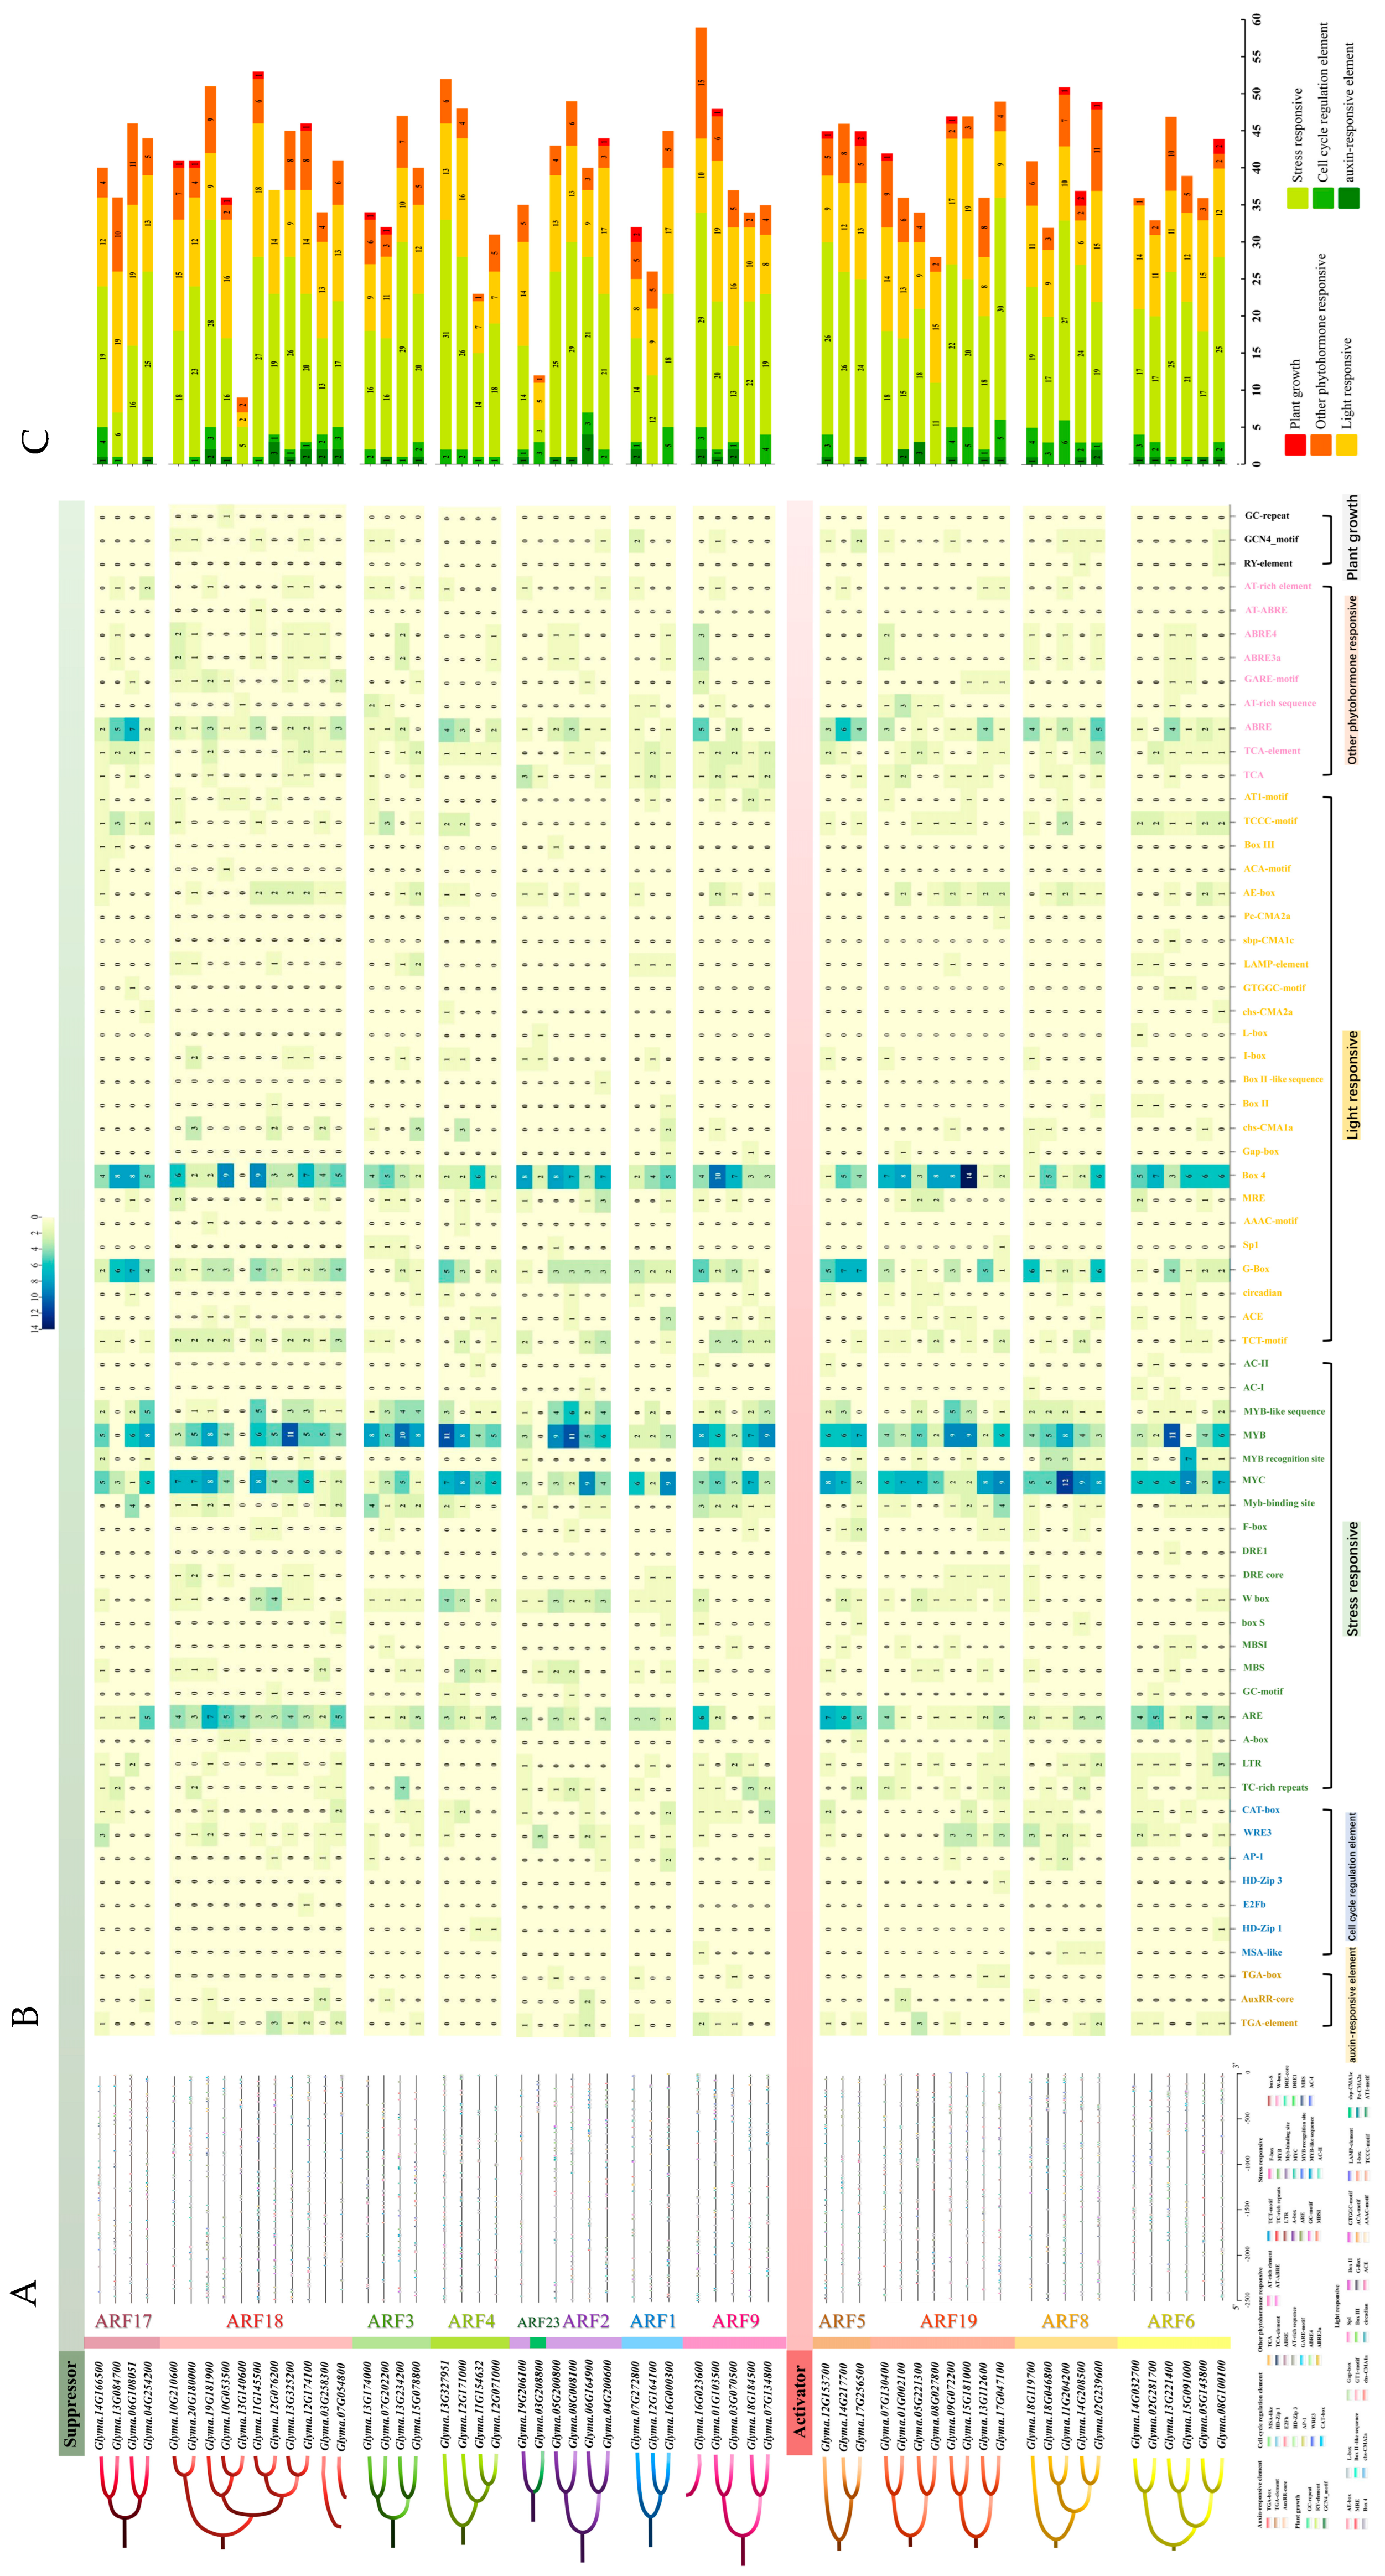
2.3. Gene Structure and Cis-Regulatory Element Analysis of GmARF Members

To delve deeper into the evolutionary history of the GmARF family genes, TBtools was utilized to visualize the intron–exon structures and protein architectures of the coding sequences (Figure 3A). The results showed that the gene structures among different subfamilies vary greatly, yet the structures within each subfamily member were relatively conserved (Figure 3A). The repressor genes GmARF17 and GmARF18 have two–three exons and one–two introns, respectively. In contrast, the repressor genes GmARF1/2/3/4/9/23 harbor more complex gene structures, with 10–15 exons and 9–14 introns. The activator genes GmARF5/6/8/19 have 13–14 exons and 12–13 introns (Figure 3A).
Analysis of the conserved domains in GmARFs revealed that most of the 59 family members contained B3 and AUX_IAA domains (Figure 3B). Among them, the repressor genes GmARF1/2/4/9/23 and the activator genes GmARF5/6/8/19 had an AUX_IAA superfamily domain at the C′ terminus of their protein sequences, indicating that these subfamilies can directly interact with auxin/indole-3-acetic acid (Aux/IAA)-related proteins. In contrast, the repressor genes GmARF3/17/18 lacked a conserved domain at the C′ terminus of their protein, suggesting that these subfamilies have some degree of functional specialization and may require specific interactions with other proteins.

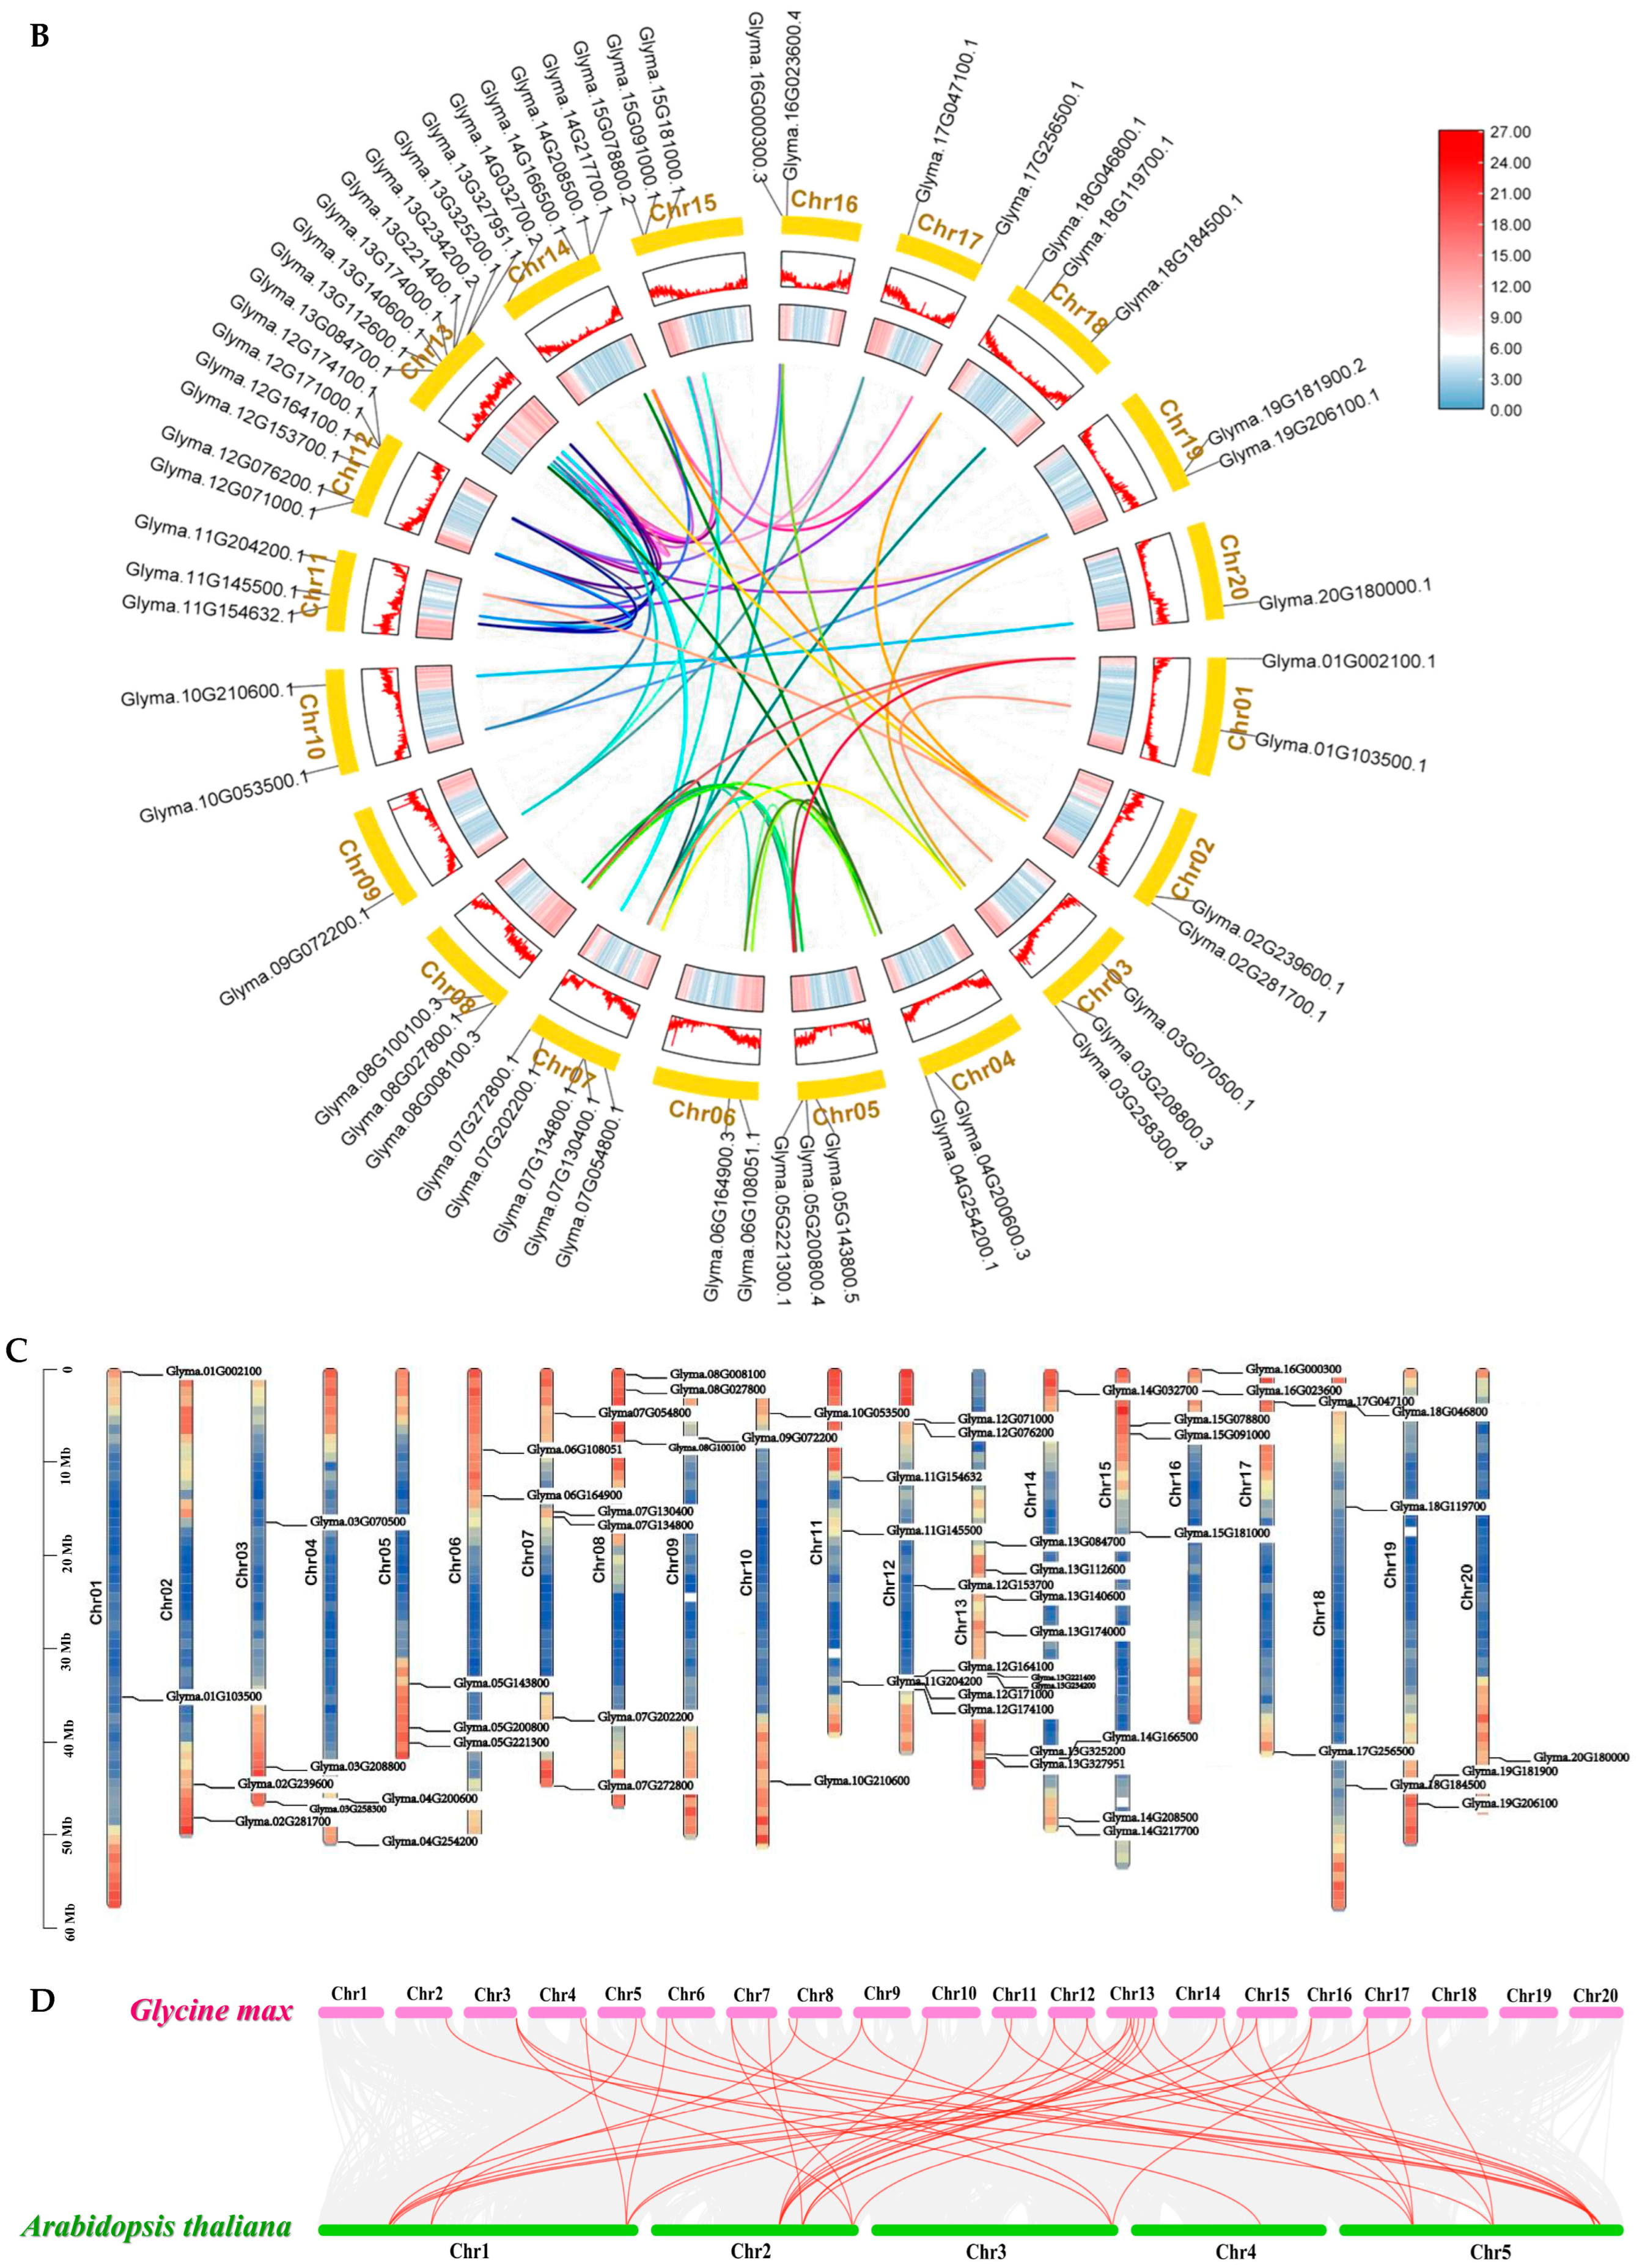
2.4. Whole-Genome Characterization of GmARF Genes in Soybean

To further investigate the physicochemical properties of the GmARF protein family, the amino acid sequences of this gene family were predicted using Expasy (https://web.expasy.org/protparam/, accessed on 20 November 2024) and NCBI (https://www.ncbi.nlm.nih.gov/, accessed on 20 November 2024). Overall, the physicochemical indices of most member proteins within each subfamily were similar. Notably, repressor-type GmARF subfamilies displayed significantly shorter amino acid sequences than activator-type GmARF subfamilies (Table 1). Conversely, the repressor subfamilies had higher isoelectric points.
Subfamily analysis shows that repressor-type GmARFs (GmARF2/4/23) and activator-type GmARFs (GmARF5/6/8/19) exhibit significantly longer amino acid sequences, higher molecular weights, and elevated instability indices, aliphatic indices (A.I.), and grand average hydropathicity (GRAVY) scores. Among them, repressors GmARF2 (Glyma.19G206100) and GmARF4 (Glyma.13G327951), as well as the activators GmARF5 (Glyma.12G153700) and GmARF8 (Glyma.18G119700), have amino acid lengths ranging from 109 to 677 and molecular weights between 12050.98 and 75645.75 Daltons. The repressors GmARF1/3/9/17/18 have amino acid lengths ranging from 551 (Glyma.13G084700) to 739 (Glyma.13G234200), molecular weights between 18067.4 and 80922.02 Daltons, and instability indices between 48.05 (Glyma.04G254200) and 60.82 (Glyma.12G164100). The A.I. values range from 63.36 (Glyma.13G084700) to 76.46 (Glyma.18G184500). Subcellular localization predictions showed that most members are primarily located in the nucleus, suggesting that their potential transcriptional regulatory roles are likely mediated via nuclear functions. GmARF17 is predicted to be primarily located in chloroplasts.

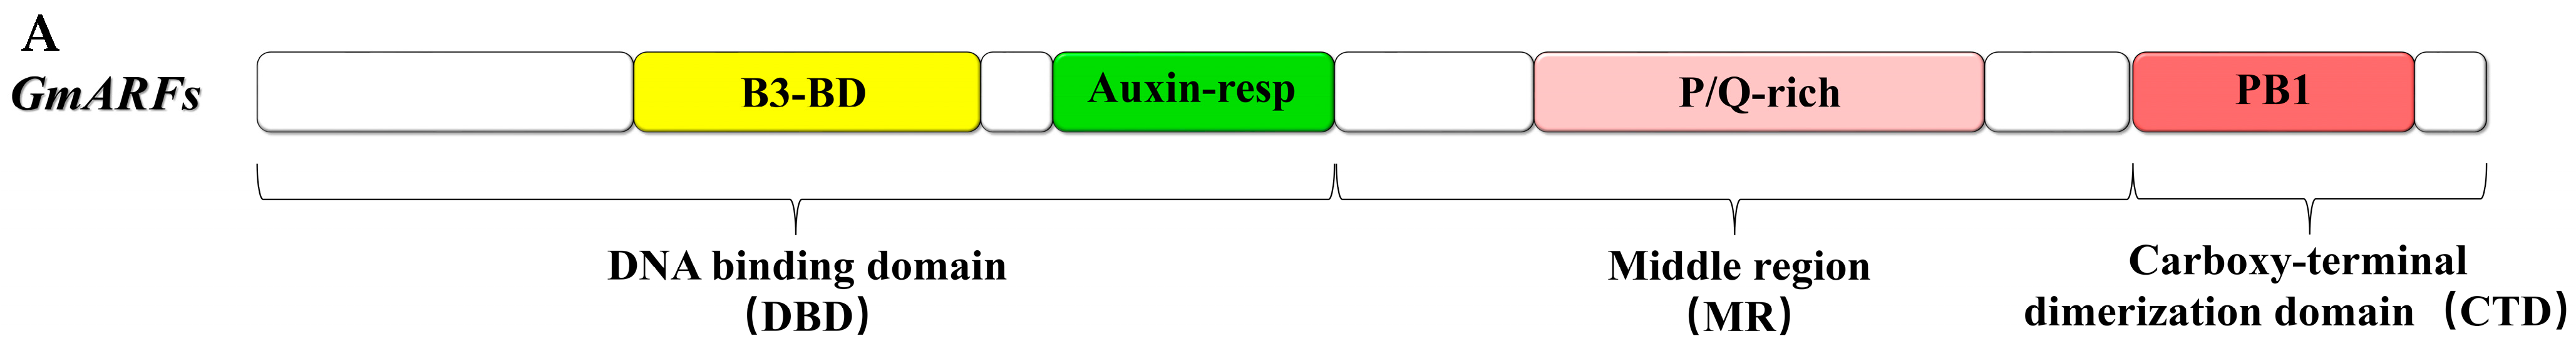
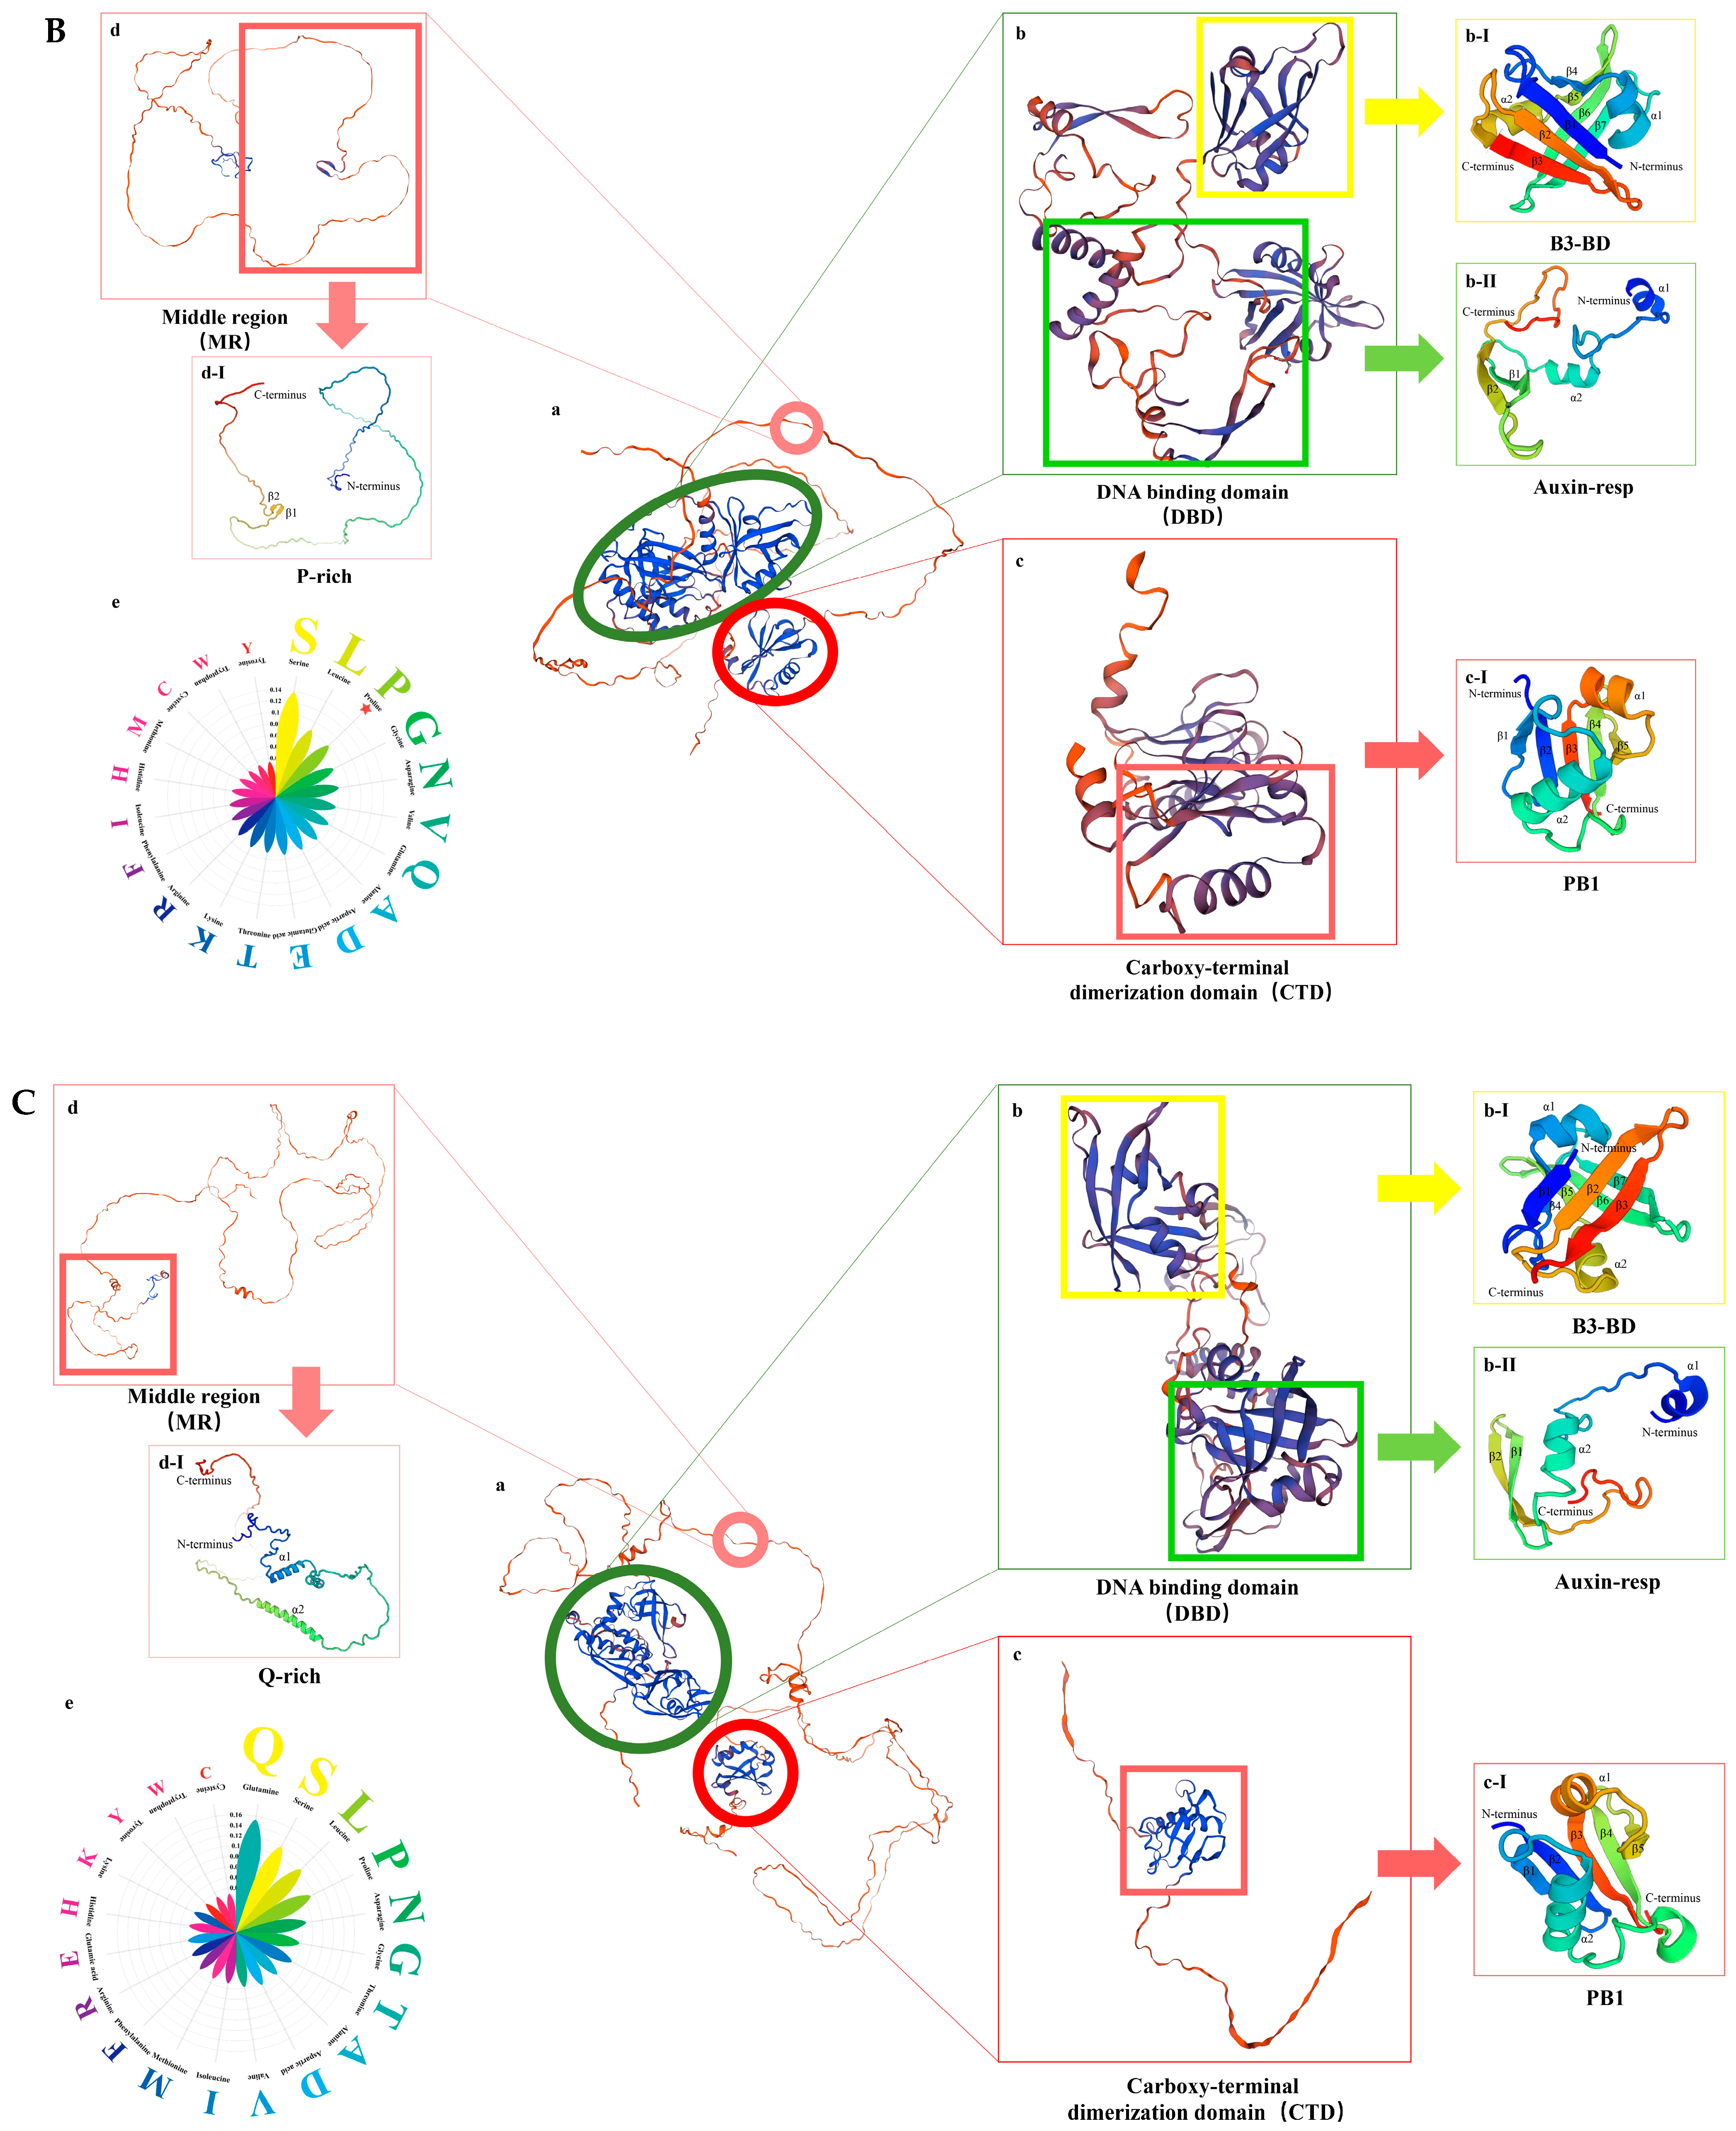
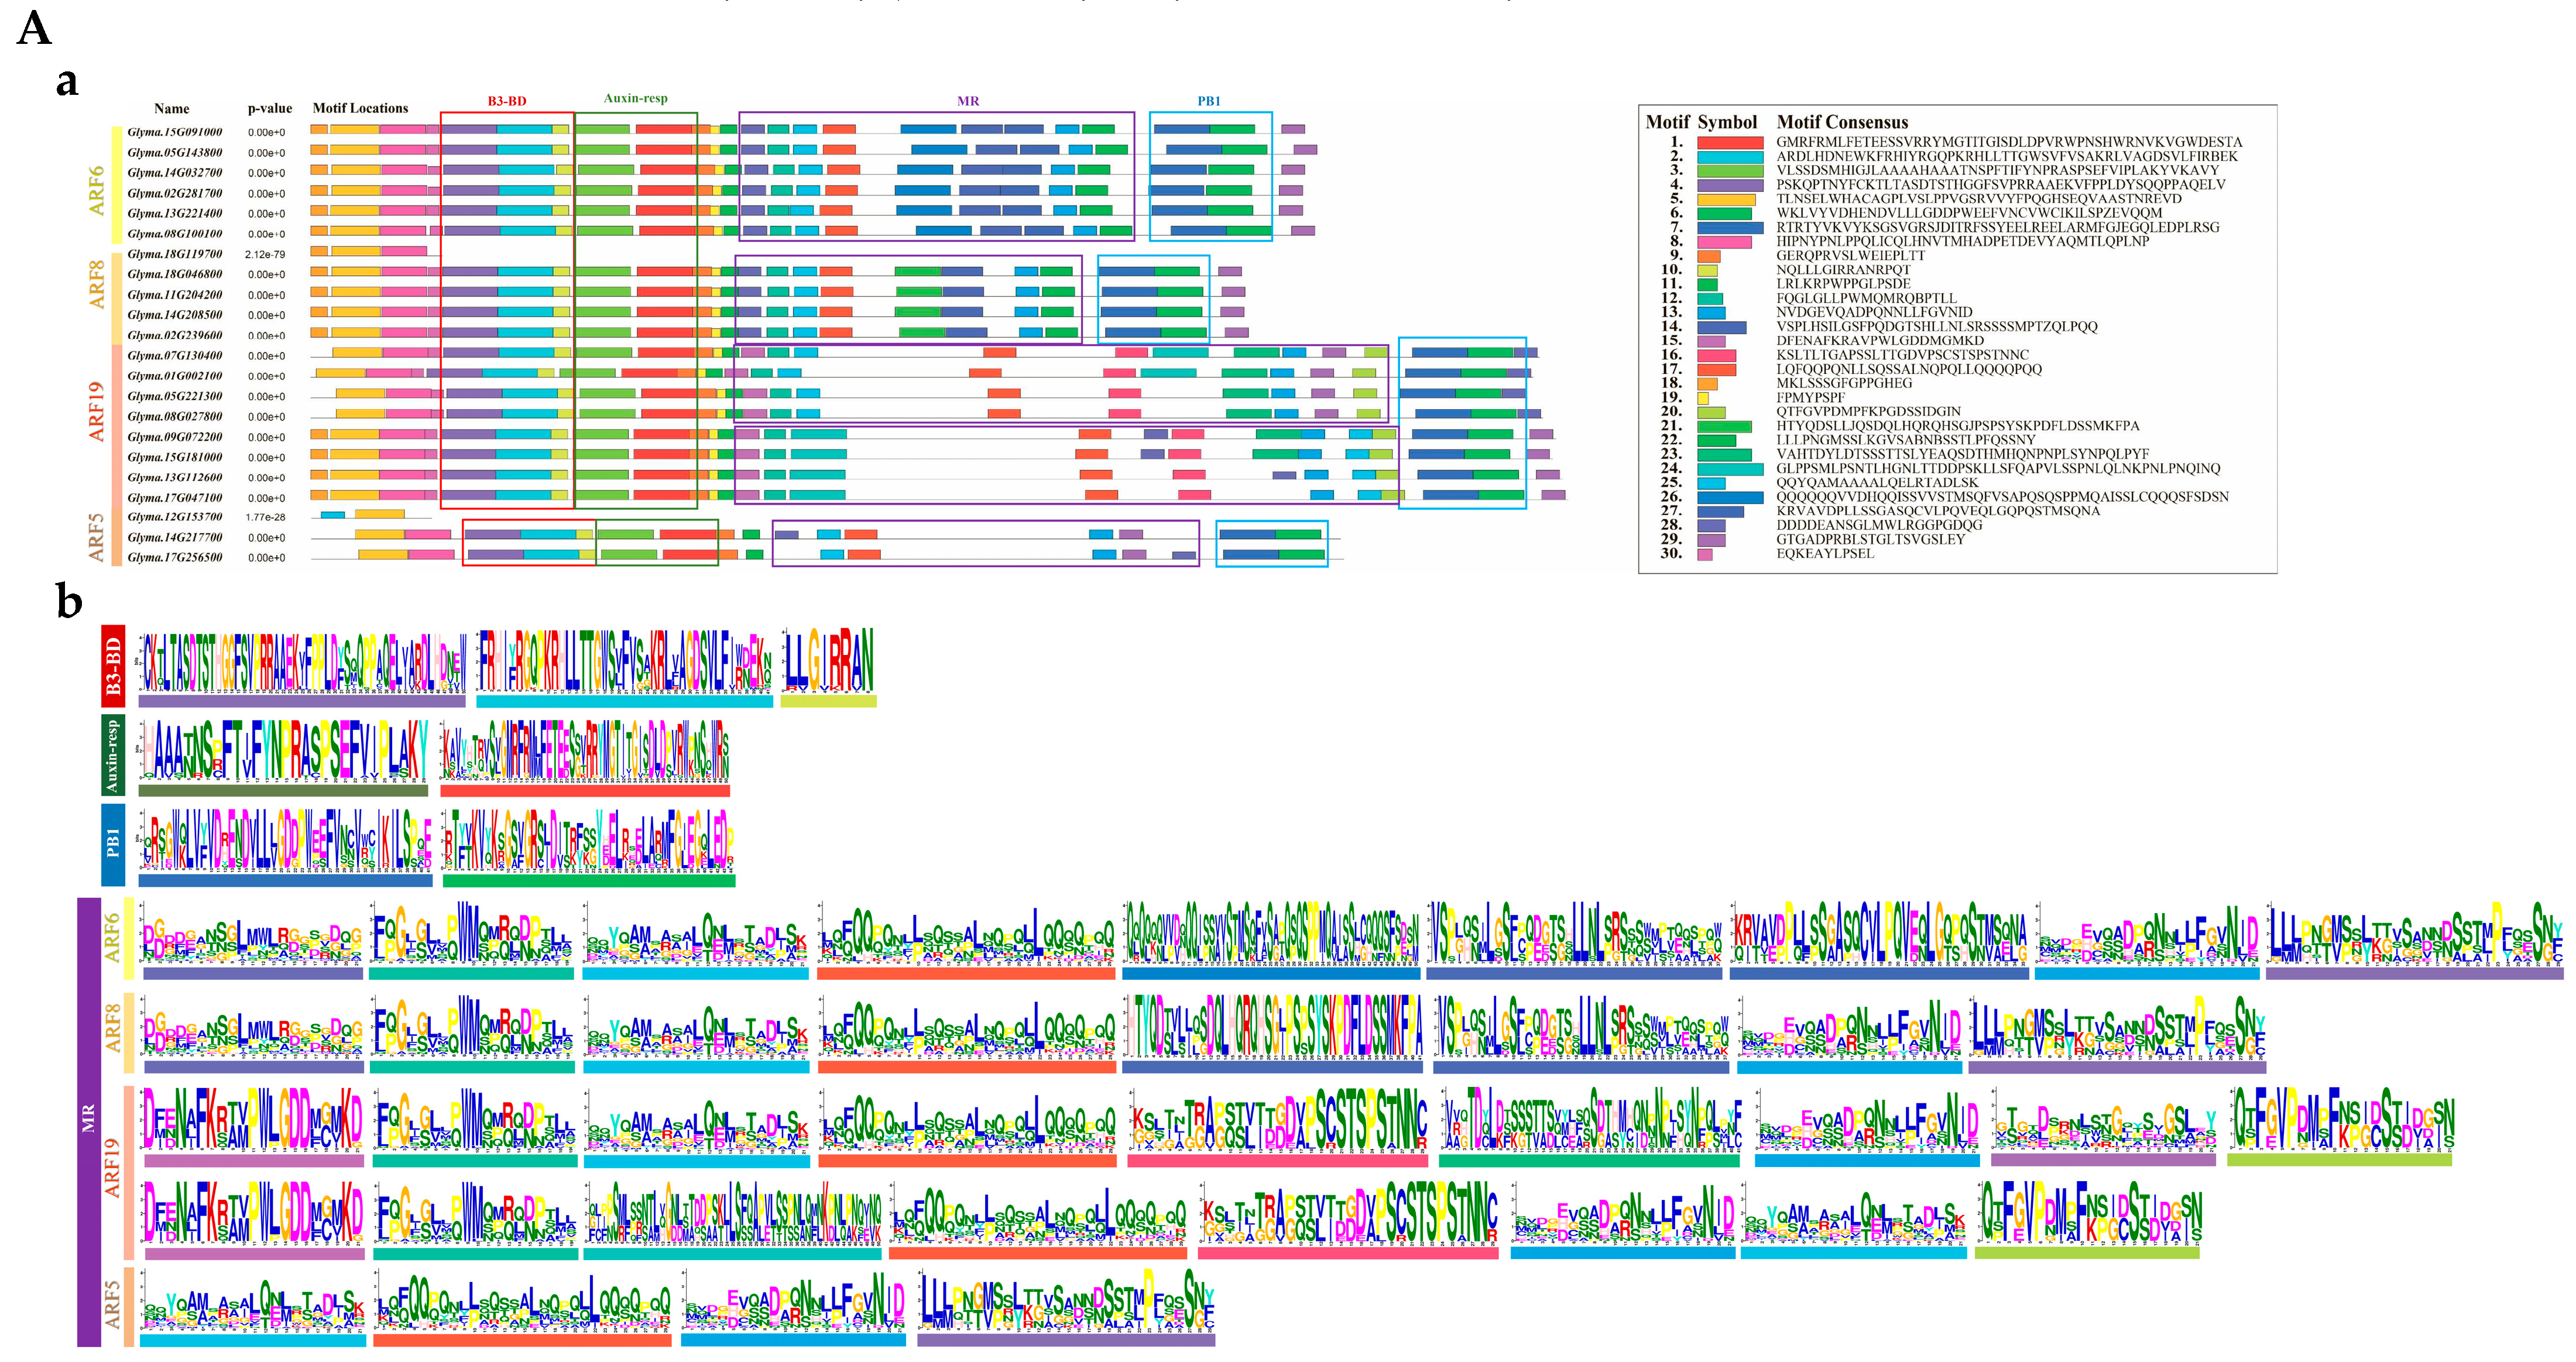
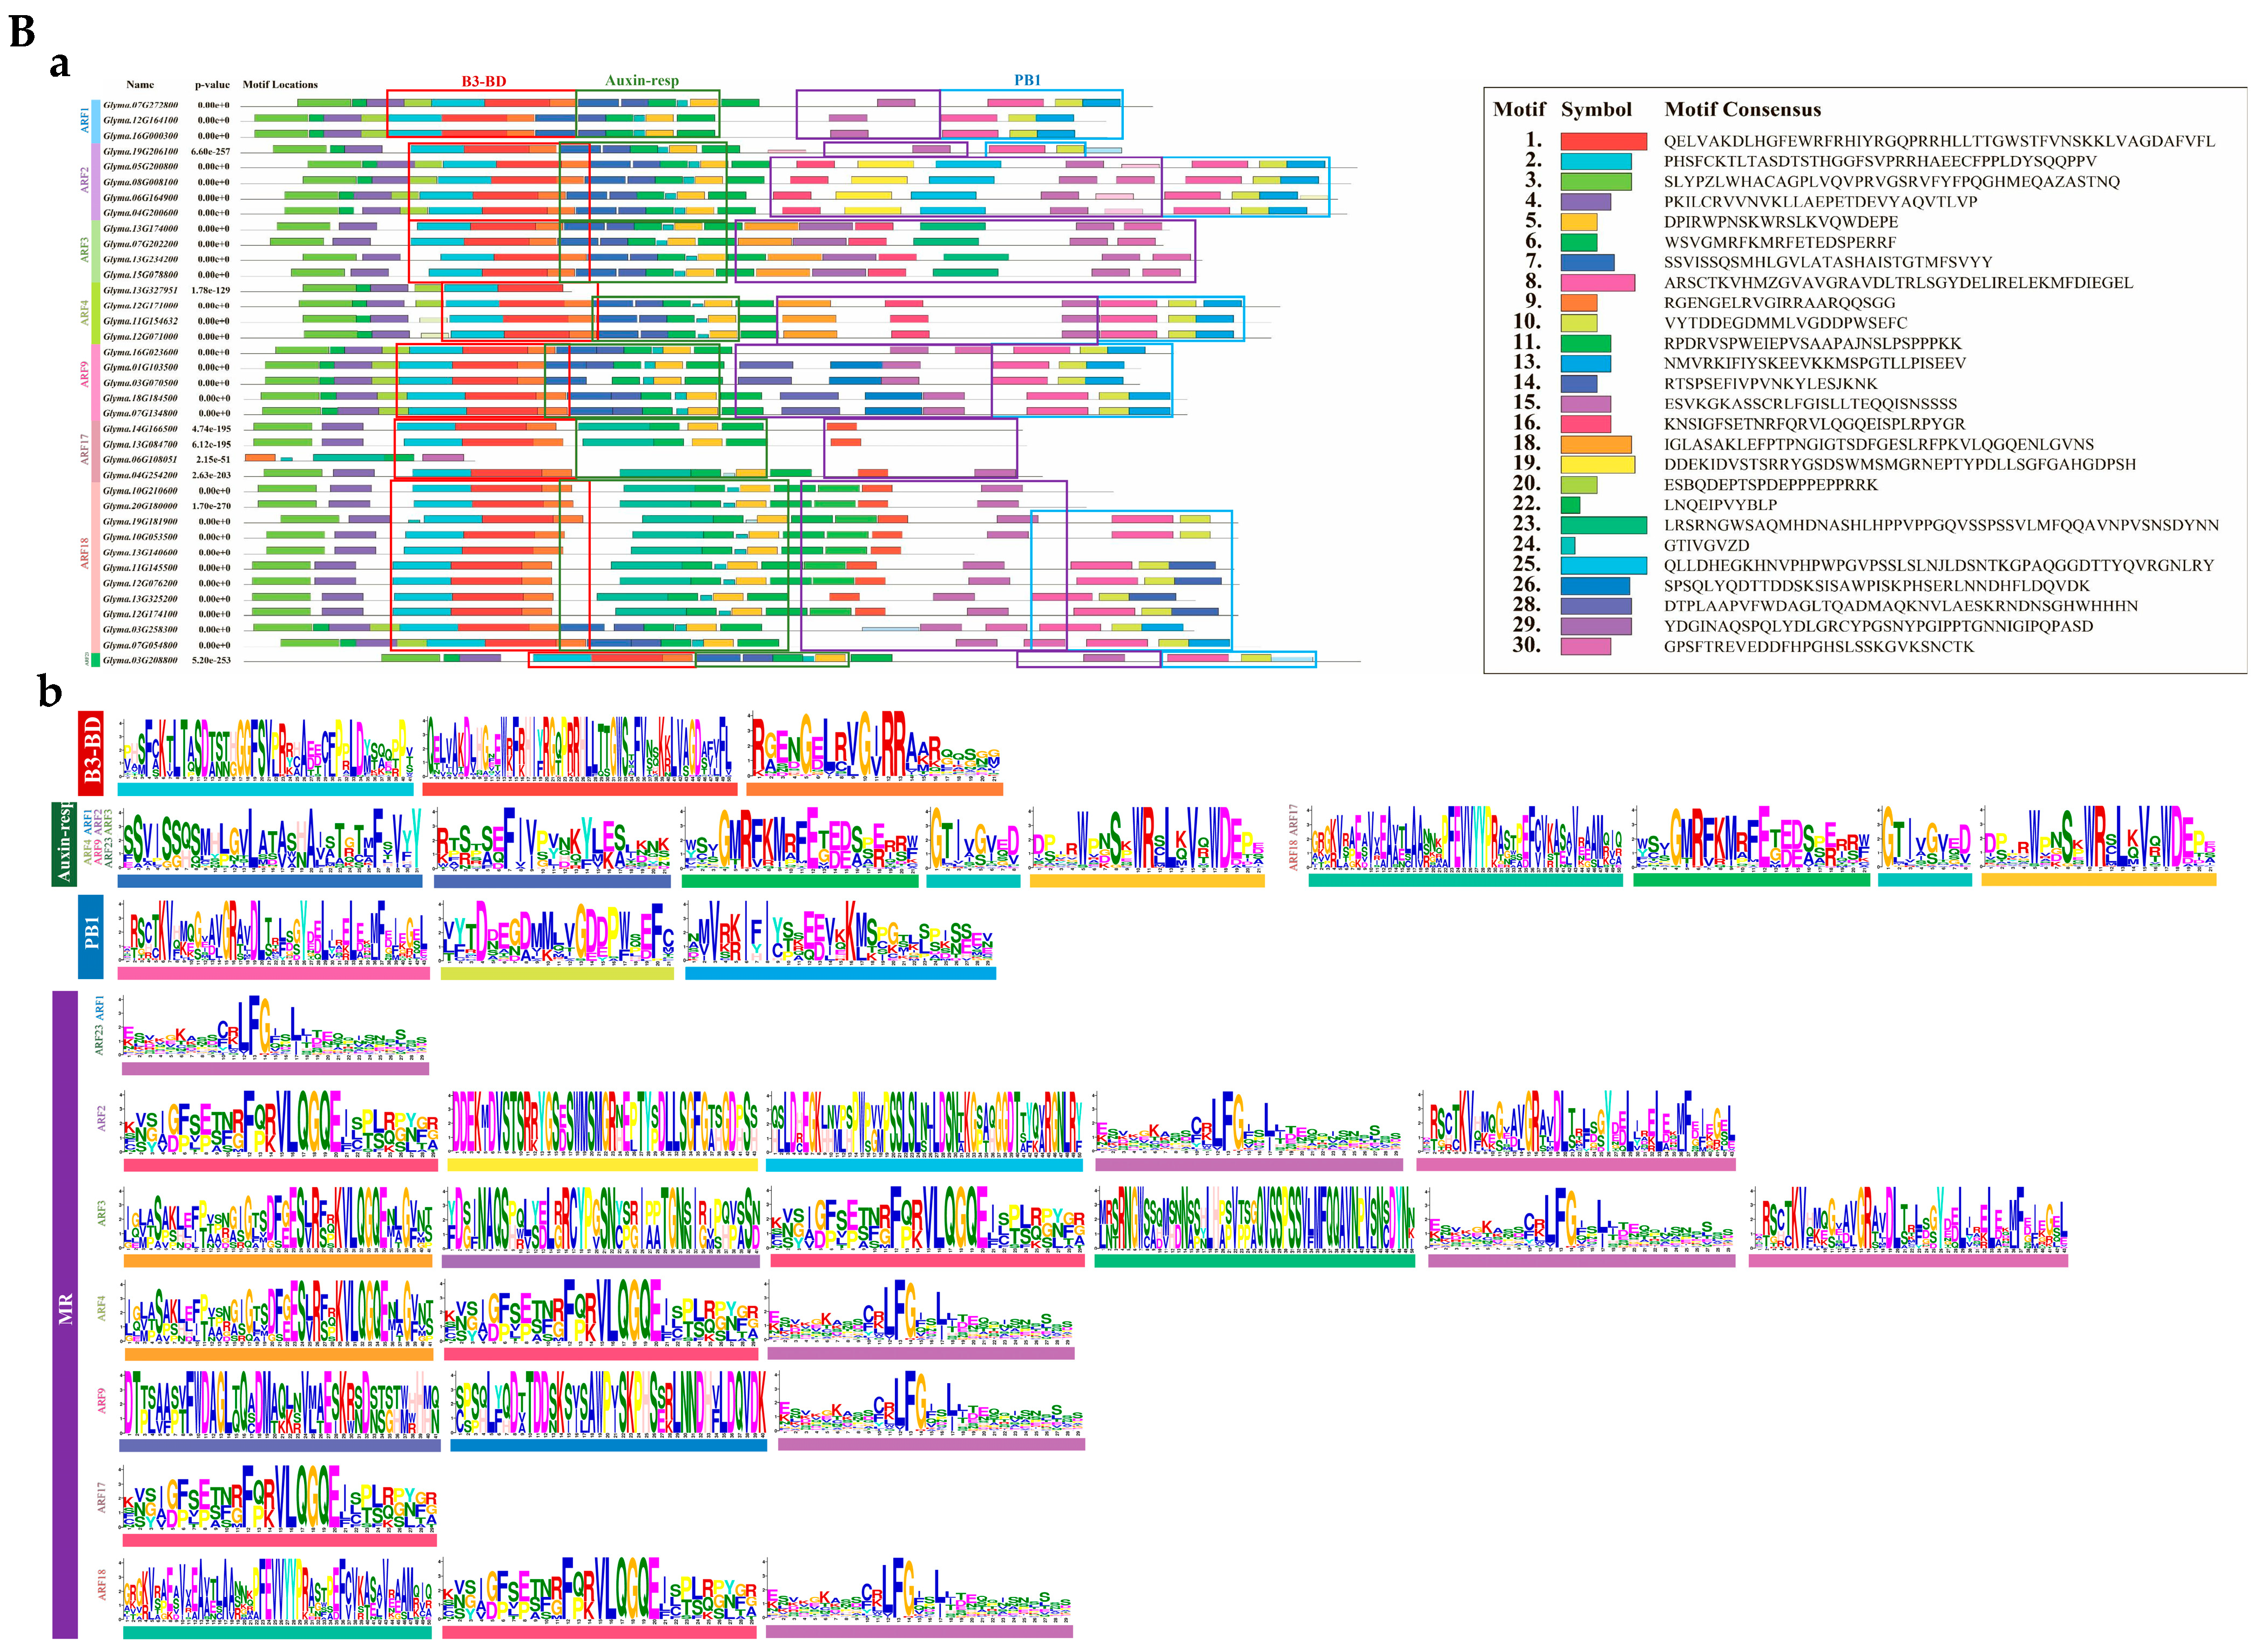
2.5. Conserved Motifs and Protein Structural Analysis of GmARF Genes

ARFs (auxin response factors) are the key transcription factors in the auxin signaling pathway. They usually contain three domains, as illustrated in Figure 4A: the DNA-binding domain (DBD), the middle region (MR), and the C-terminal domain (CTD) [1]. To investigate the protein structure of GmARFs, SWISS-MODEL online software (https://swissmodel.expasy.org/, accessed on 23 November 2024) was used for protein structure predictions. The protein structures were categorized into repressor (Figure 4B) and activator (Figure 4C) types. Both repressor and activator protein structures share identical B3, Auxin-resp, and PB1 domains but exhibit significant differences in the MR domain. Specifically, the B3 domain consists of a β-barrel formed by seven parallel β-sheets and two α-helices (Figure 4B(b-I),C(b-I)). The Auxin-resp domain is composed of two α-helices at the N′-terminus connected to two β-strands at the C′-terminus (Figure 4B(b-II),C(b-II)). The PB1 domain is made up of five β-strands and two α-helices (Figure 4B(c-I),C(c-I)). The MR domain is divided into two distinct structural types. The repressor is mostly composed of two β-strands (Figure 4B(d-I)), with a high proportion of serine (Serine), leucine (Leucine), and proline (Proline) amino acids (Figure 4B-e). In contrast, the activator core proteins primarily consist of two α-helices (Figure 4C(d-I), with a higher proportion of serine (Serine), leucine (Leucine), and glutamine (Glutamine) amino acids (Figure 4C-e).
To further explore the biological functions of the GmARF family genes, motif analysis was conducted on these members. The results showed that the motifs within the B3 domain, Auxin-resp domain, and PB1 domain were largely identical between repressor and activator members (Figure 5A-a,B-a). For activator subfamily members, the number of motifs in the MR domain ranged from 4 to 9, with a total of 14 distinct motifs identified. The small variation in motif types among subfamilies suggested high functional conservation and close evolutionary relatedness (Figure 5A-b). In contrast, repressor subfamily members exhibited greater diversity, with the motif number in the MR domain ranging from 1 to 6 and a total of 12 distinct motifs.
A comparison of the MR domain between subfamilies (Figure 5A-b,B-b) revealed that all activator members contained 13 and 17 motifs. In contrast, GmARF19 exhibited two distinct types of motifs, indicating a higher degree of divergence within the family and potential functional differences. GmARF5 had a relatively limited number of motif types in this structure. The repressor subfamily was relatively more complex. Most members contained 15 and 16 motifs. Among them, GmARF1, GmARF17, and GmARF23 each had only one type of motif. However, GmARF4, GmARF9, and GmARF18 each had three different types of motifs. Notably, GmARF2 and GmARF3 exhibited a high variety of motif types.

2.6. Cis-Regulatory Element Analysis of GmARF Genes

To investigate the expression pattern and potential upstream regulators of GmARF transcription factors, the promoter regions with 2000bp upstream of the start codon of GmARF genes were analyzed and predicted using PlantCARE (Supplementary Table S1). A total of 65 cis-regulatory elements were identified and categorized into six groups: light-responsive elements (24, 36%), auxin-responsive elements (3, 5%), response elements for other plant hormones (9, 14%), stress-responsive elements (19, 29%), regulatory elements involved in plant growth and development (3, 5%), and regulatory elements for cell cycle changes (7, 11%) (Figure 6A). Among them, light-responsive elements accounted for a relatively high proportion, followed by response elements for other plant hormones and stress-responsive elements. Regulatory elements involved in plant growth and development, auxin-responsive elements, and regulatory elements for cell cycle changes were less abundant. This suggests that this gene family not only responds to changes in light but also might participate in multiple plant hormone regulatory mechanisms, reflecting the diversity of their functionalities.
Further in-depth analysis showed that MYB elements (317), MYC elements (302), Box4 elements (283), ARE elements (155), G-box elements (147), and ABRE elements (115) constitute a significant proportion within the promoters of this gene family (Figure 6B). Among them, MYB elements, MYC elements, and ARE elements are stress-responsive elements. Box4 elements and G-box elements are light-responsive elements. ABRE elements are responsive to other plant hormones. These findings indicate that this gene family might be involved in regulating abiotic stress mechanisms while also playing crucial roles in regulating photosynthesis, growth, and development and adapting to different light conditions. The auxin-responsive elements, including TCA-element (34), AuxRR-core (10), and TGA-box (5), account for a relatively small proportion, suggesting that most genes in this family might not be transcriptionally regulated by auxin directly.
Quantification analysis of cis-elements in the promoter GmARF gene family (Figure 6C) indicates that the number of stress-responsive elements (ranging from 5 to 31) is the highest, followed by the light-responsive elements (ranging from 7 to 19). There are fewer elements responsive to plant hormones (ranging from 1 to 15) and regulatory elements controlling cell cycle changes (ranging from 1 to 6). Regulatory elements controlling plant growth and development are the lowest (ranging from 1 to 4). These findings suggest that the GmARF genes could be directly regulated by various abiotic stresses and light and its participation in auxin signaling through interacting with other proteins.
Subfamily analysis revealed that activator subfamilies possess a higher number of cis-acting elements compared to repressors, with the quantity of various elements being more stable in activators than in repressors. Stress-responsive and light-responsive elements constitute a large proportion in the gene family sequences of repressors GmARF2/3/4/9/18/23 and activators GmARF5/6/8/19, followed by stress-responsive elements and elements responsive to other plant hormones (Figure 6B). Among them, the number of auxin-responsive elements in the gene family sequences of repressors GmARF2/9/18 and activators GmARF6/8/19 ranges from 1 to 10, while the remaining subfamilies lack auxin-responsive elements. The repressor genes GmARF18 (Glyma.13G325200), GmARF3 (Glyma.13G234200), GmARF4 (Glyma.13G327951), and GmARF2 (Glyma.08G008100), as well as the activator gene GmARF6 (Glyma.13G221400), have more MYB elements than other elements (Figure 6B). The repressor genes GmARF2 (Glyma.06G164900) and GmARF1 (Glyma.16G000300) and the activator genes GmARF6 (Glyma.15G091000), GmARF8 (Glyma.11G204200, Glyma.14G208500), and GmARF19 (Glyma.17G047100) have more MYC elements than other elements. The repressor genes GmARF18 (Glyma.10G053500, Glyma.11G145500) and GmARF9 (Glyma.01G103500), as well as the activator gene GmARF19 (Glyma.15G181000), have more Box4 elements than other elements in their promoter regions. The repressor genes GmARF17 (Glyma.13G084700, Glyma.06G108051) and GmARF9 (Glyma.16G023600), as well as the activator genes GmARF5 (Glyma.14G217700) and GmARF8 (Glyma.02G239600), have more ABRE elements than other elements in their promoters. This suggests that certain types of elements are clustered in specific genes, implying that these types of regulatory elements may be evolutionarily conserved.

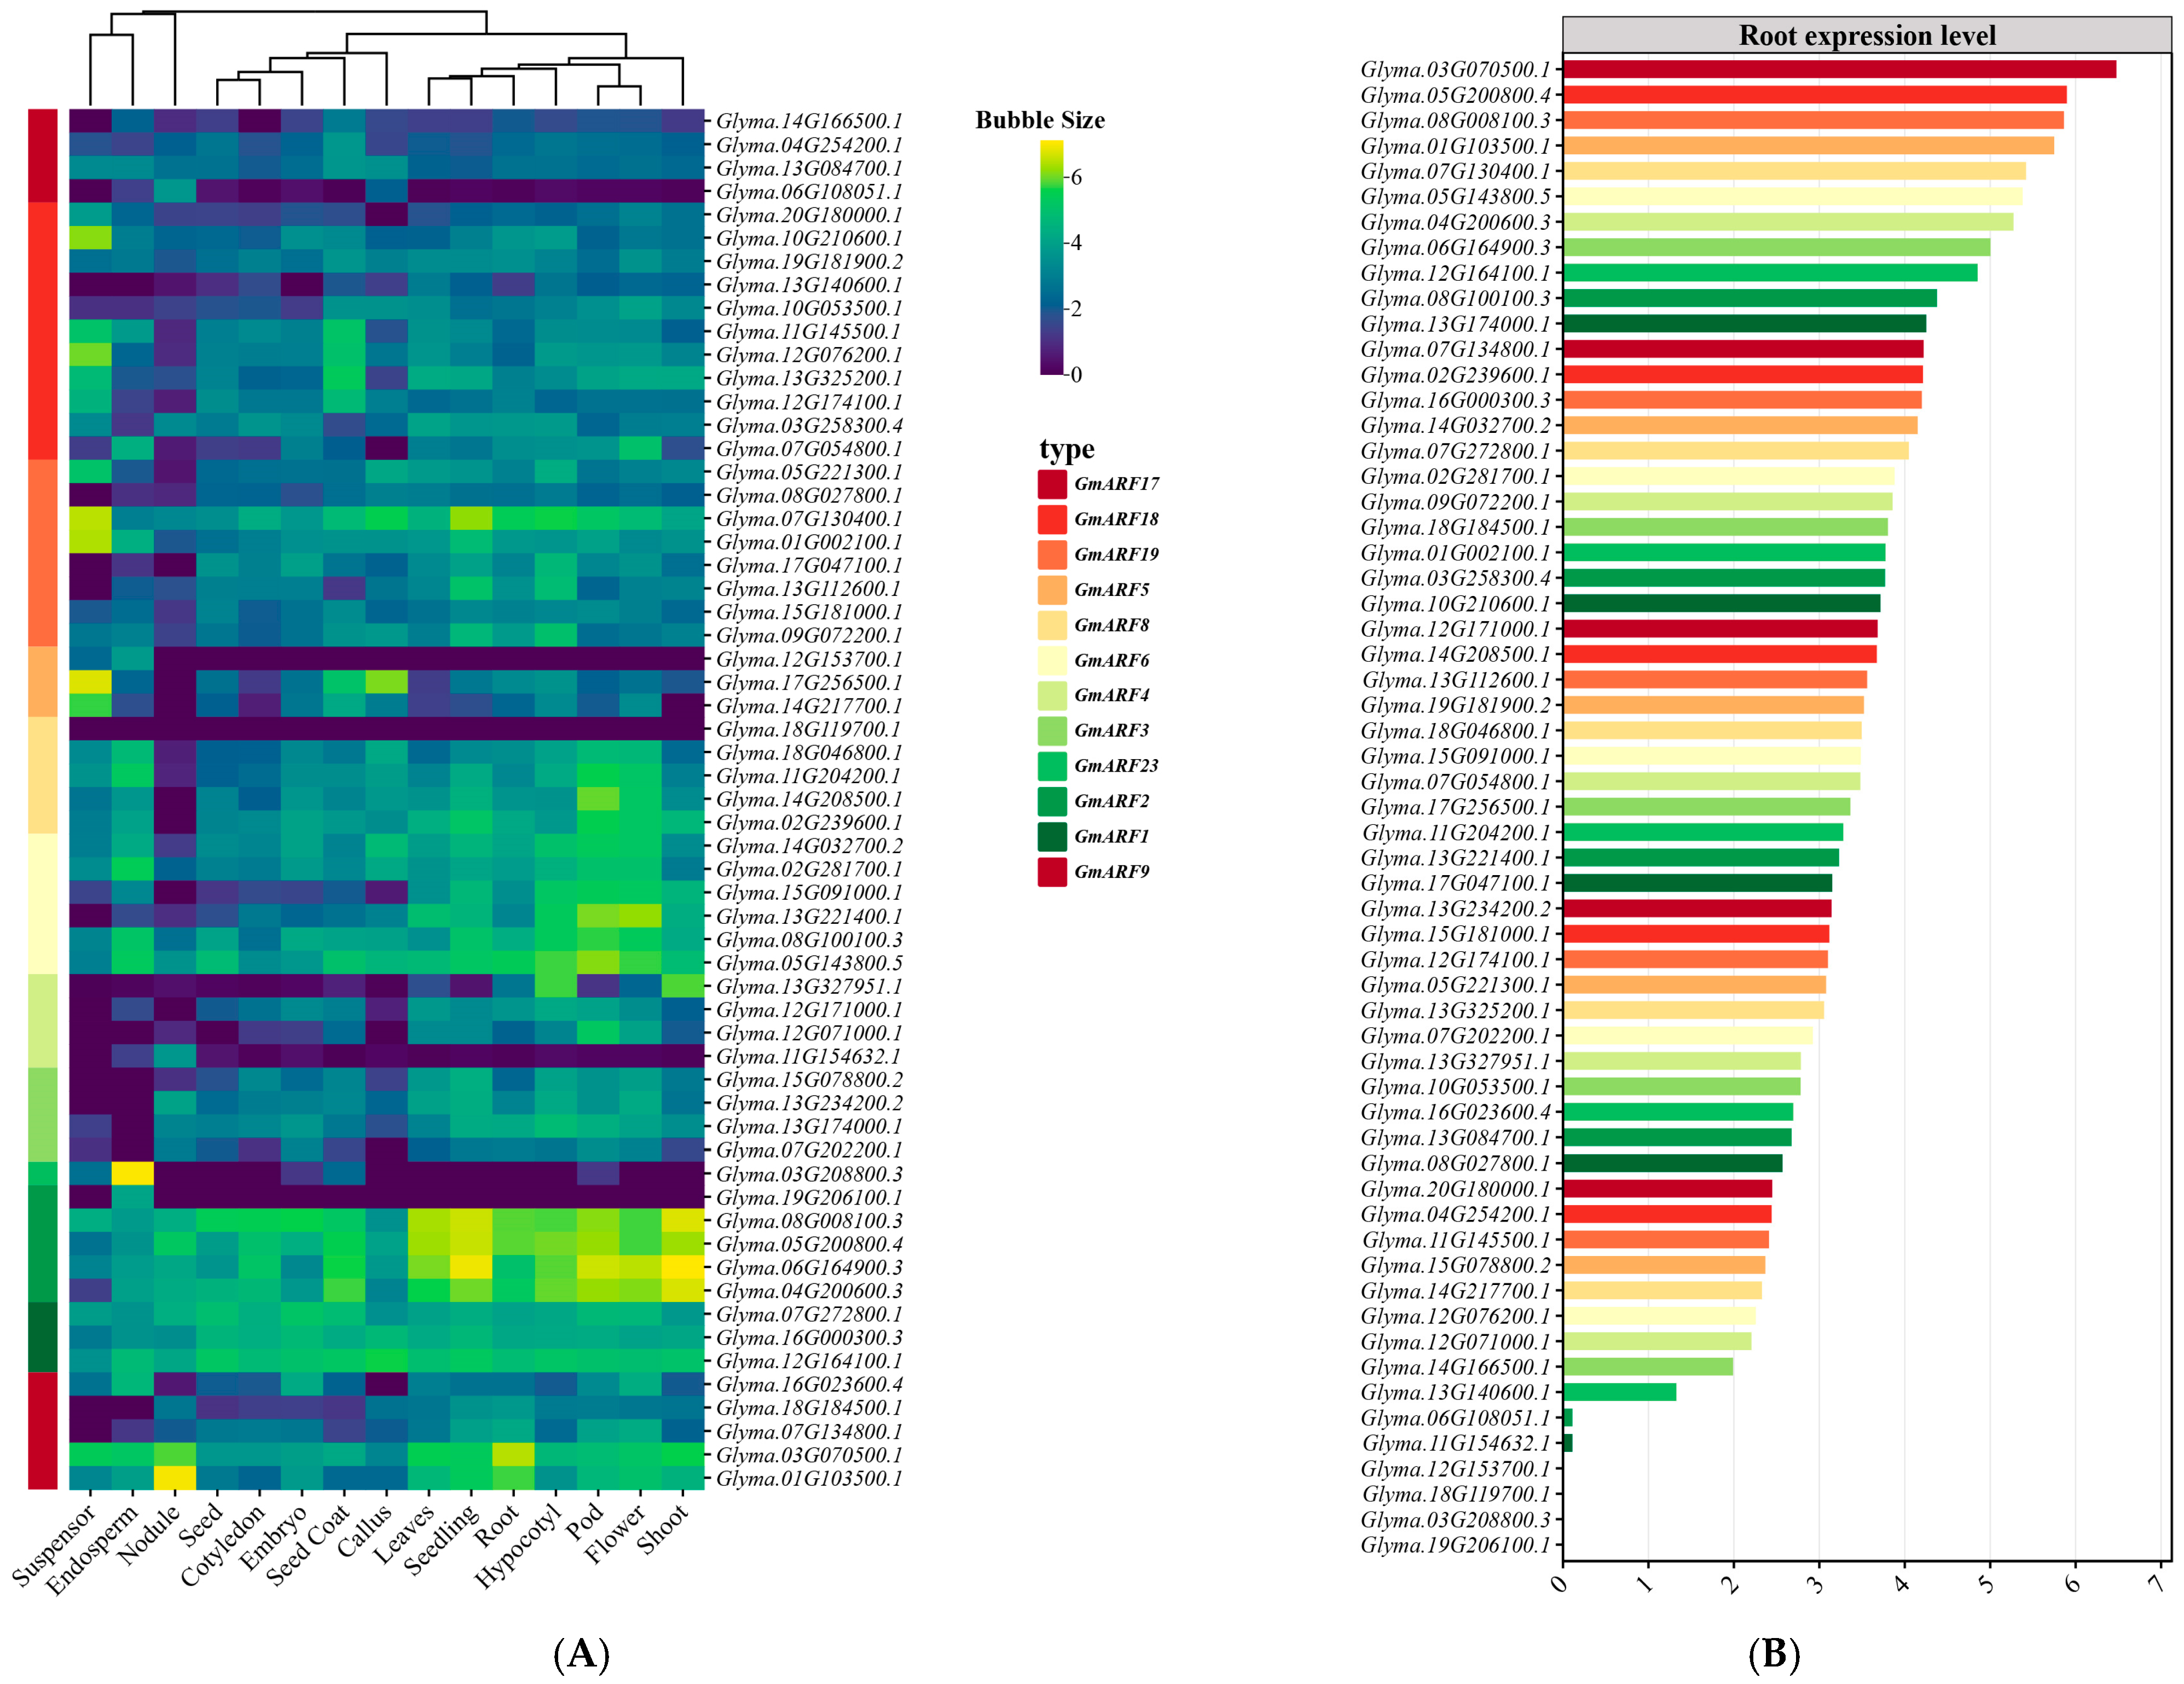
2.7. Expression Analysis of GmARF Genes

An investigation into the tissue expression patterns of auxin response factor gene family members (GmARFs) in soybean (Glycine max) was conducted by utilizing the Phytozome database (http://www.phytozome.net/, accessed on 23 November 2024) and soybean expression atlas data (https://venanciogroup.uenf.br/cgi-bin/gmax_atlas/index.cgi, accessed on 23 November 2024). As illustrated in Figure 7A, results showed that most GmARF members are expressed in various tissues of the soybean plant. The activator subfamilies GmARF6, GmARF8, and GmARF19 exhibited higher expression levels in aerial organs compared to underground organs, with the highest expression in flowers and pods, followed by hypocotyls. Notably, most subfamily members showed low expression in root nodules. Conversely, the repressor subfamilies GmARF3, GmARF4, GmARF5, GmARF17, and GmARF18 showed higher expression in underground parts than in aerial organs. Among these, some members of the GmARF3, GmARF4, and GmARF17 subfamilies were highly expressed in the nodules. The GmARF1, GmARF2, and GmARF9 subfamilies exhibited high expression levels across all organs compared to the other subfamilies (Figure 7B). Specifically, the GmARF1 and GmARF2 subfamilies showed higher expression in aerial organs than in underground organs, with the highest expression in stems, flowers, and pods, followed by roots. In contrast, most members of the GmARF9 subfamily were preferentially expressed in roots. Integrative analysis of root-specific expression profiling (Figure 7B) identified two genes, Glyma.05G200800 (GmARF2 subfamily) and Glyma.03G070500 (GmARF9 subfamily), with root-enriched expression patterns. Both genes exhibited 1–2-fold higher expression in roots compared to other organs and ranked among the top two most abundant of 59 GmARF genes in root tissues. Notably, Glyma.05G200800 (GmARF2) and Glyma.03G070500 (GmARF9) act as transcriptional repressors, whereas previous research has primarily focused on ARF activators, with scarce reports on ARF repressors. These two genes were thus prioritized as primary targets for further mechanistic studies.

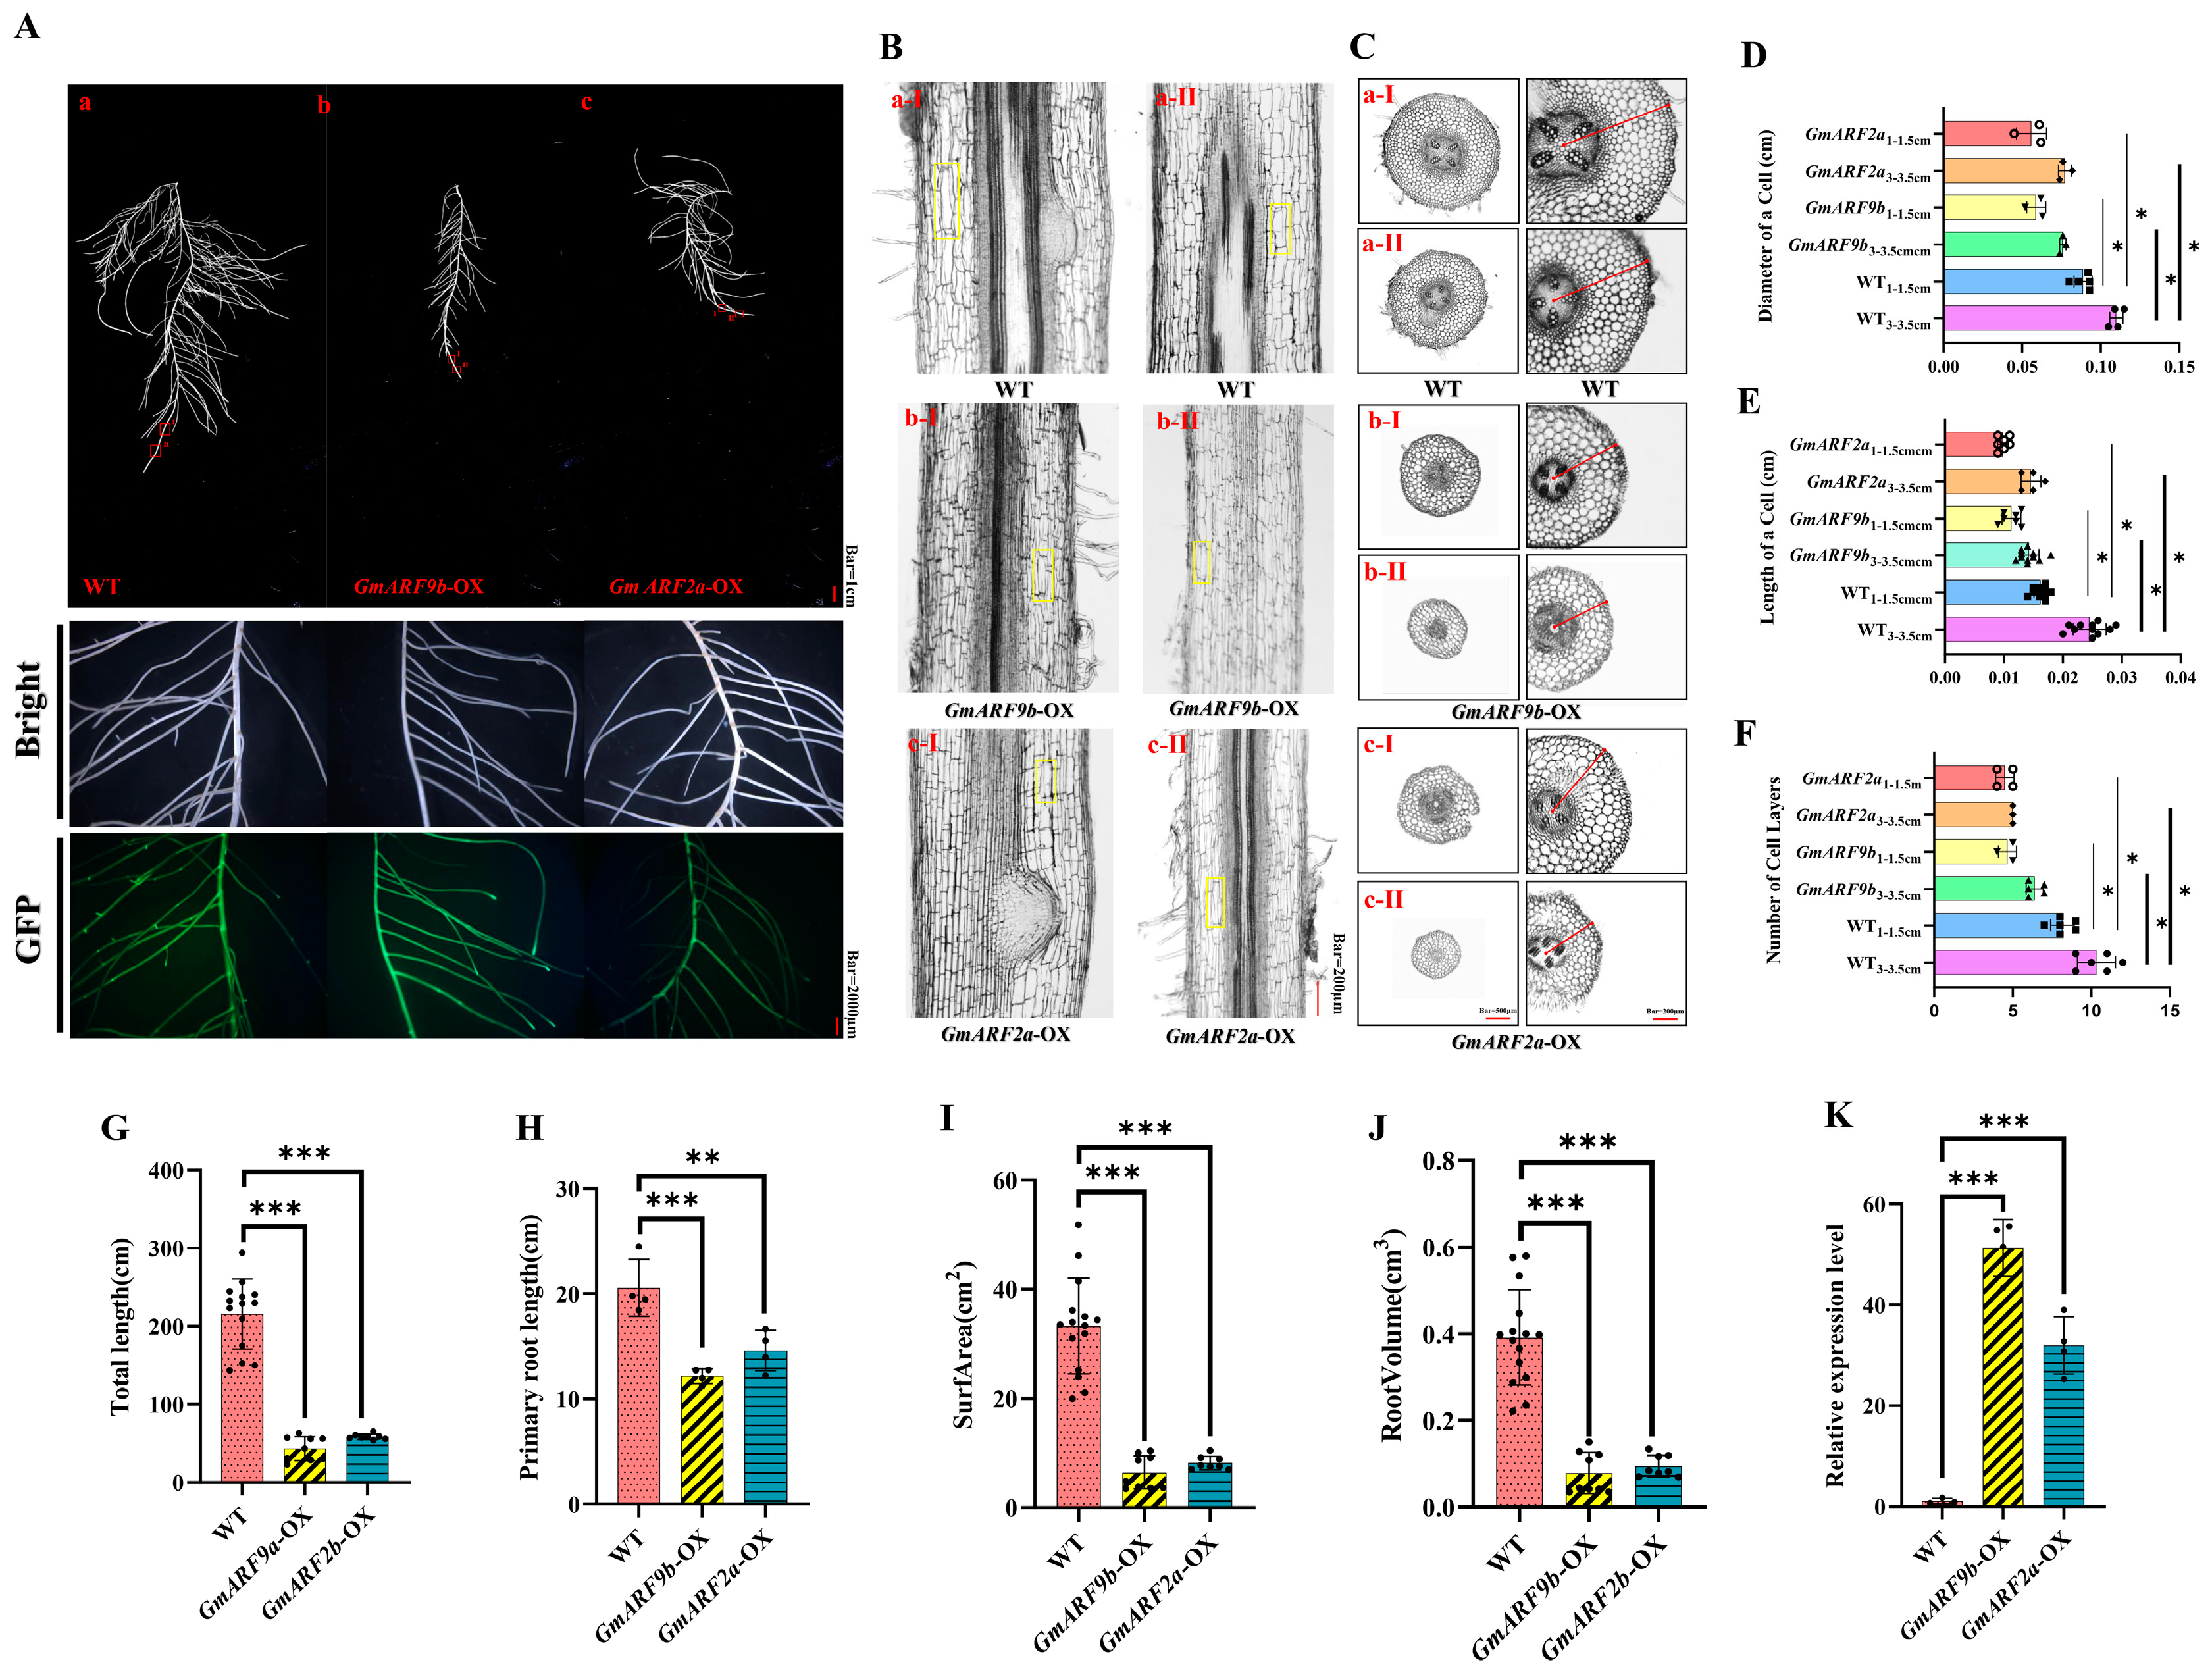
2.8. Functional Study of GmARF9b (Glyma.03G070500) and GmARF2a (Glyma.05G200800) in Soybean

A transient assay of tobacco leaves was used to determine the subcellular localization of GmARF9b (Glyma.03G070500) and GmARF2a (Glyma.05G200800) (Figure 8). As shown in the figure, 35S-GmARF9b/GmARF2a-GFP was mainly localized in the nucleus, which was indicated by the DAPI staining. While the control 35S/RFP was localized both in the nucleus and the cytoplasm. These results suggest that both GmARF9b and GmARF2a are mostly localized in the nucleus.
To determine the tissue expression pattern of GmARF9b and GmARF2a, promoters (with 2000 bp upstream of the ATG initiation codon) were cloned and fused upstream of the reporter gene GUS, respectively, and the results of transgenic hairy roots after GUS staining showed that GmARF9b and GmARF2a were predominantly expressed in the stele, root tips, and lateral root primordia (Figure 9B,E). This suggests that GmARF9b and GmARF2a might play crucial roles during root development stages and may be involved in regulating root growth and development (Figure 9C,F).
To further investigate the roles of GmARF9b and GmARF2a in regulating soybean root growth and development, overexpression of GmARF9b and GmARF2a driven by 35S was constructed and transformed into the hairy roots of soybean. Positive transgenic hairy roots were identified by a GFP marker using fluorescence microscope at the GFP channel (Figure 10A). Results showed that the hairy roots overexpressing GmARF9b and GmARF2a exhibited significant decreases in total root length by 72.84–79.92%, decreases in primary root length by 40.63–69.05%, 75.21–80.53% decreases in root surface area, and 75.67–79.82% decreases in root volume compared with wild-type hairy roots (Figure 10G–J). Furthermore, the root section in the 3–3.5 cm of root segment showed that the cell diameter, cell length, and cell layer number were significantly lower in the OE transgenic hairy roots by 42.24–44.73%, 68.12–71.97%, and 61.46–106.67% compared with the control hairy roots (Figure 10D–F). Similar results were also observed in the 1–1.5 cm root segment with a cell diameter, cell length, and cell layer number significantly reduced by 50.51–58.57%, 43.99–64.86%, and 75–81.48%, respectively. Furthermore, the natural variations in GmARF9b and GmARF2a were analyzed, and the haplotypes of both genes under selection were identified (Supplementary Figures S1 and S2; Supplementary Table S2). Taken together, these findings suggest that GmARF9b and GmARF2a negatively regulate soybean root growth and development, with impacts on root cell division and elongation.

3. Discussion

3.1. Phylogenetic Analysis, Classification, and Gene Haplotype of GmARF Genes

ARF is a key factor in auxin signaling transduction in plants, and this family plays a crucial role in plant growth and development. Initially, 51 members of the soybean ARF gene family were identified [18]. In this study, we conducted BLAST (ElasticBLAST 1.4.0) analysis in the new version of the soybean genome [19]. Our results suggest that there are 59 ARF gene members in the soybean genome (Figure 1A). Previous studies classified GmARF family members into five subclasses and three major branches [18]. In this study, using the updated GmARF protein members and amino acid sequences, our results suggested that GmARF family members could be divided into four subclasses and two major branches. Our results showed two branches were divided according to their potential functions, one branch belonging to the repressor subfamily and the other belonging to the activator subfamily (Figure 1A). Therefore, our phylogenetic tree analysis was more corelative with the potential protein functions. On the other hand, among the 59 soybean members, subfamilies ARF10, ARF16, ARF7, ARF11, ARF12, ARF13, ARF14, ARF15, ARF20, ARF21, and ARF22 in Arabidopsis thaliana are absent in soybean (Figure 1A) [20]. This phenomenon may be attributed to a significant subfamily preference in the distribution of the GmARF gene family, where soybeans in subclass II may be more inclined to retain or evolve specific subfamily genes. The missing subfamilies may have been lost due to natural selection, genetic drift, or other evolutionary events during soybean evolution [21].
The gene distribution pattern across different chromosomes reveals that 13.72% of GmARF family members are clustered on chromosome 13 (chr13). This finding is consistent with the results of a previous study [18]. In addition, two new identified ARFs located in chromosome 12 were found through comparison with a previous study (Figure 1C). This discrepancy may be attributed to the more complete genome assembly of gene family members, leading to an increase in the number of genes on different chromosomes [17]. Such duplications are common evolutionary mechanisms that can expand gene families and potentially contribute to functional diversification within the family.

3.2. Dynamic Evolution of GmARF Gene Haplotypes Under Natural Selection in Soybean

Natural selection analysis is a crucial approach to understanding how genes are selected during evolution and how they influence plant phenotypes and adaptability. Previous studies have performed natural selection analysis on GmARF members [21]. In this study, we used the soybean database to perform haplotype analysis on the GmARF family [17]. Our findings revealed that no haplotype was observed in the repressor GmARF4/23 subfamily members. This suggests that these family members may be under strong selective pressure, resulting in a low rate of genetic variation [22]. Additionally, among the repressor GmARF17 members, only Glyma.14G166500 was subject to natural selection, while other members either lacked different haplotypes or were less impacted by natural selection. This could be due to the specific gene function and genetic variation in Glyma.14G166500. In contrast, other members may have redundant functions or genetic variations that are not conducive to the evolutionary environment [17].

3.3. Divergence of Conserved Motifs in GmARF Protein Domains

To facilitate subsequent research on gene function, comparative classification, and protein interaction mechanisms, this study analyzed gene protein structures and motifs based on functional classification (Figure 3). The results indicate that the repressor Auxin-resp domain is divided into two categories of motifs, and the motifs within the MR (middle region) domain exhibit relatively greater length and diversity compared to activators [20]. This significant difference may arise from the distinct selective pressures faced by gene members during evolution, leading to higher motif diversity in the repressor MR domain and relative uniformity in the activator MR domain [20]. Additionally, this suggests that repressors may recognize and bind to a variety of different proteins or DNA sequences, implying a more complex genetic molecular network.

3.4. Biological Function Analysis of GmARF9b (Glyma.03G070500) and GmARF2a (Glyma.05G200800) in Glycine Max

Based on expression level analysis, the genes GmARF9b (Glyma.03G070500) and GmARF2a (Glyma.05G200800) were identified as highly expressed in roots. To further elucidate the potential functions of these two genes, this study employed transgenic hairy roots for the functional study of GmARF9b (Glyma.03G070500) and GmARF2a (Glyma.05G200800). Transgenic hairy roots overexpressing GmARF9b and GmARF2a significantly inhibit root growth and development, with reduced root fresh weight, total root length, root volume, and surface area in OE lines (Figure 8). This demonstrates that GmARF9b (Glyma.03G070500) and GmARF2a (Glyma.05G200800) negatively regulate root growth and development. Subsequent cellular comparisons of the OE (GmARF9b-OE and GmARF2a-OE) transgenic hairy roots with WT (EV) hairy roots revealed that the overall cell area and length in the overexpression lines were significantly lower than those in the WT (Figure 10D,E), indicating that these genes negatively affect the cell elongation and the cell division and proliferation, thus repressing root growth and development. Given the relatively high proportion of cell cycle-related cis-acting elements in the promoters of these two GmARF genes (Figure 6B,C), further experiments are needed to uncover the underlying molecular mechanisms.
On the other hand, GmARF as a pivotal transcription factor in auxin signal transduction influences root growth and development through the regulation of downstream genes. Notably, GmARF9b and GmARF2a are identified as repressors within the ARF gene family, yet their molecular mechanisms remain unreported. However, based on previous studies, when auxin levels rise, Aux/IAA proteins undergo degradation, releasing ARFs. The accumulation of repressor-type ARFs is subsequently enhanced, leading to strengthened repression of downstream LBD genes. This results in reduced LBD protein accumulation, thereby inhibiting the elongation and development of both primary and lateral roots [23]. Given that auxin accumulates in the root tip, the increased IAA content therein activates the transcription of repressor-type ARFs. These ARFs bind to the promoters of downstream genes such as RSL to modulate their expression. The RSL protein, in turn, directly transcriptionally activates LRH, forming an LRH-RSL complex that suppresses root hair growth [24].
Additionally, previous studies on ARFs have primarily focused on model plants, particularly activators. For example, both forward and reverse genetic studies in Arabidopsis thaliana have confirmed that the activators AtARF7 and AtARF19 are key genes regulating lateral root formation, with phenotypic assays demonstrating functional redundancy between these two genes [14,15]. Furthermore, the activator AtARF5 interacts with the promoters of AtPIN1, AtPIN3, and AtPIN7 to regulate root meristem development, lateral root primordium formation, and lateral organ formation in the shoot apical meristem [10,11]. Therefore, the identification in this study of genes from soybean repressors that regulate root growth and development lays a theoretical foundation for future research on GmARF genes.
Taken together, in this study, we conducted a comprehensive investigation of the ARF gene family in soybean and functionally characterized ARFs that are highly expressed in roots. We identified two ARFs that negatively regulate root growth and development through modulating the cell elongation and cell division and proliferation in the roots. This study unveils the genetic mechanisms of the ARF gene family in the growth and development of soybean roots, providing new insights into deciphering the complex regulatory network of plant root development. However, the functions of GmARF9b and GmARF2a have not been linked to their natural variations, which still need further elite natural variations identification. Furthermore, these findings offer theoretical support and candidate genes for cultivating new soybean lines through molecular breeding approaches.

4. Materials and Methods

4.1. Phylogenetic Tree Analysis of the ARF Gene Family

Protein sequences of 23 AtARFs from Arabidopsis thaliana were downloaded from the TAIR10 database (http://www.arabidopsis.org accessed on 23 November 2024) [25]. Additionally, protein sequences of 59 GmARFs from Glycine max were obtained from the Phytozome13 database (https://phytozome-next.jgi.doe.gov/ accessed on 23 November 2024) [26]. The MUSCLE algorithm in the align function of MEGA5.2 software [27] was utilized to align the amino acid sequences of ARFs. The results of alignments were then subjected to phylogenetic analysis using the neighbor-joining (NJ) method in MEGA5.2 software, with the bootstrap method selected for branch length testing and a bootstrap value set at 1000 to generate the phylogenetic tree. Further visualization of the phylogenetic tree was carried out using the online tool iTOL (https://itol.embl.de/login.cgi?logout=1 accessed on 26 November 2024) [28].

4.2. Chromosome Distribution and Gene Duplication Analysis of ARFs

To investigate the chromosomal locations of ARFs, positional information for ARFs was extracted from the genomic annotation files of soybean (Glycine max) and Arabidopsis thaliana. Circos (circos-0.69-9) software was employed to map the positions of GmARFs onto their respective chromosomes [29]. To analyze gene duplication events, the Multicollinearity Scanning Toolkit (MCScanX) was utilized with default parameters [30]. The results obtained from MCScanX were visualized using the TBtools (TBtools-ll v2.210) [31]. To construct the synteny between ARFs of soybean and Arabidopsis, the Graphics function in TBtools was leveraged for dual-genome synteny analysis [31]. This analysis ultimately yielded the syntenic relationships between the ARFs of the two species.

4.3. Haplotype Analysis of GmARF Gene Family

Haplotype analysis was conducted using SoyFGBv2.0 (https://sfgb.rmbreeding.cn/analysis/haplotype accessed on 26 November 2024) [31]. This database encompasses 2214 soybean core germplasm resources from four major soybean production and distribution regions: Asia, America, Europe, and Africa. Among these, there are 1993 cultivated varieties, 218 annual wild species, and 2 perennial wild species (G. tomentella) along with one G. tabacina [32].

4.4. Gene Structure and Protein Conserved Domain Prediction of GmARFs

Protein and gene sequences for 59 GmARFs from Glycine max were downloaded from the Phytozome database (https://phytozome-next.jgi.doe.gov/ accessed on 23 November 2024) [33]. TBtools was utilized to read the whole-genome annotation files, allowing the extraction of positions and sequences for exons, introns, promoters, terminators, and other elements. With this information, the Visualize Gene Structure function in TBtools was employed to further analyze and visualize the gene structures and features of the GmARF gene family. Additionally, the GXF Sequences Extract plugin in TBtools was used to predict conserved domains within the protein sequences of the GmARFs, and the results were visualized accordingly.

4.5. Whole-Genome Characterization Analysis of the GmARF Gene Family in Soybean

Based on the amino acid sequences of ARFs, the whole-genome characteristics data for the GmARF genes were collected using the BLAST function available at NCBI (https://blast.ncbi.nlm.nih.gov/Blast.cgi accessed on 20 November 2024) [34]. Additionally, subcellular localization predictions for the genes in the GmARF family were performed using WoLF PSORT (https://www.genscript.com/tools/wolf-psort accessed on 26 November 2024) [35].

4.6. Protein Structure Prediction and Motif Analysis of the GmARFs Gene Family in Soybean

The InterPro database (https://www.ebi.ac.uk/interpro/ accessed on 23 November 2024) was used to integrate protein domains and functional sites of the GmARF gene family [33]. Based on this information, the conserved protein domains were visualized. Additionally, SWISS-MODEL (https://swissmodel.expasy.org/interactive accessed on 23 November 2024) was employed to predict the protein structures by aligning amino acid sequences with similar known structures, and the quality of the predictions was evaluated using metrics such as GMQE, QMEAND, and Co global [36]. The final output was a visualized 3D structure, accompanied by data integration based on the proportion of amino acids.
Furthermore, the online software MEME (http://meme-suite.org/tools/meme accessed on 27 November 2024) was utilized by inputting the amino acid sequences of the proteins [37]. The number of motifs prediction was set to 30, with lengths ranging from 10 to 50 amino acids. The resulting motif sequences were integrated based on information such as the position and score of each motif.

4.7. Cis-Regulatory Element Analysis of the GmARF Gene Family in Soybean

The nucleic acid sequences 2000 bp upstream of the start codon for each member of the GmARF gene family were extracted and analyzed using TBtools. These sequences were then analyzed for cis-regulatory elements within the promoter regions using the PlantCARE online tool (https://bioinformatics.psb.ugent.be/webtools/plantcare/html/ accessed on 27 November 2024) [38]. The results of prediction were visualized using the Simple BioSequence Viewer (TBtools-ll v2.210) in TBtools. Based on the functional classification of the cis-regulatory elements, the number and proportion of each element were calculated and integrated.

4.8. Analysis of Gene Expression Patterns of the GmARF Family in Soybean

The expression pattern of GmARF gene family across different soybean organs were analyzed using the Soybean Expression Atlas (https://venanciogroup.uenf.br/cgi-bin/gmax_atlas/index.cgi accessed on 23 November 2024) online software [39].

4.9. Acquisition of Transgenic Hairy Roots Overexpressing GmARF9b (Glyma.03G070500) and GmARF2a (Glyma.05G200800) in Soybean

Primers were designed based on the ORF sequences of GmARF9b (Glyma.03G070500) and GmARF2a (Glyma.05G200800). Using KOD One (Vazyme, Nanjing, China) high-fidelity enzyme, fragments were amplified separately from a cDNA library (Supplementary Table S3). The fragments were then cloned into the pFGC5941-35S-intron-(GFP-Bar marker) overexpression vector using the Clon Express II One Step Cloning Kit with homologous recombination enzyme (Vazyme, Nanjing, China), utilizing the restriction sites Asc I (New England Biolabs, Ipswich, MA, USA) and BamH I (New England Biolabs, Ipswich, MA, USA). The constructs were transformed into Agrobacterium rhizogenes K599 (Weidi Biotechnology, Shanghai, China).
The specific procedure was as follows [40]: Soybean seedlings were germinated for 6 days and then removed from vermiculite and washed. A diagonal cut was made 1–1.5 cm below the hypocotyl, and an appropriate amount of Agrobacterium cells was applied to the cut surface. The seedlings were then carefully placed on sterile water-soaked filter paper with the cut surface facing up, covered with plastic wrap to maintain moisture, and cultured in the dark for 4–5 days. Once the cut surface swelled and callus was induced, the seedlings were transferred to vermiculite and continued to be cultured for about a week. When the hairy roots grew to 1–2 cm, positive roots were screened by fluorescence observation and could be transferred to corresponding full-nutrient hydroponic cultures for further treatment.

4.10. Tissue Localization Analysis of GmARF9b (Glyma.03G070500) and GmARF2a (Glyma.05G200800) in Soybean

Soybean hairy roots were collected and placed in 50 mL centrifuge tubes. GUS staining solution was added to the tubes, composed of 50 mM sodium phosphate buffer (pH 7.0), 0.1% (v/v) Triton X-100 (Sigma-Aldrich, St. Louis, MO, USA), 0.1 mM K3Fe(CN)6, 0.1 mM K4[Fe(CN)6]•3H2O, 1 mg/mL X-Gluc, and 1% (v/v) dimethylformamide [41]. The samples were completely submerged in the GUS staining solution and incubated at 37 °C for 12 h. Subsequently, the samples were eluted with 95% ethanol and observed under an optical microscope (Axio Zoom; Zeiss, Oberkochen, Germany) to visualize the GUS-stained tissues.

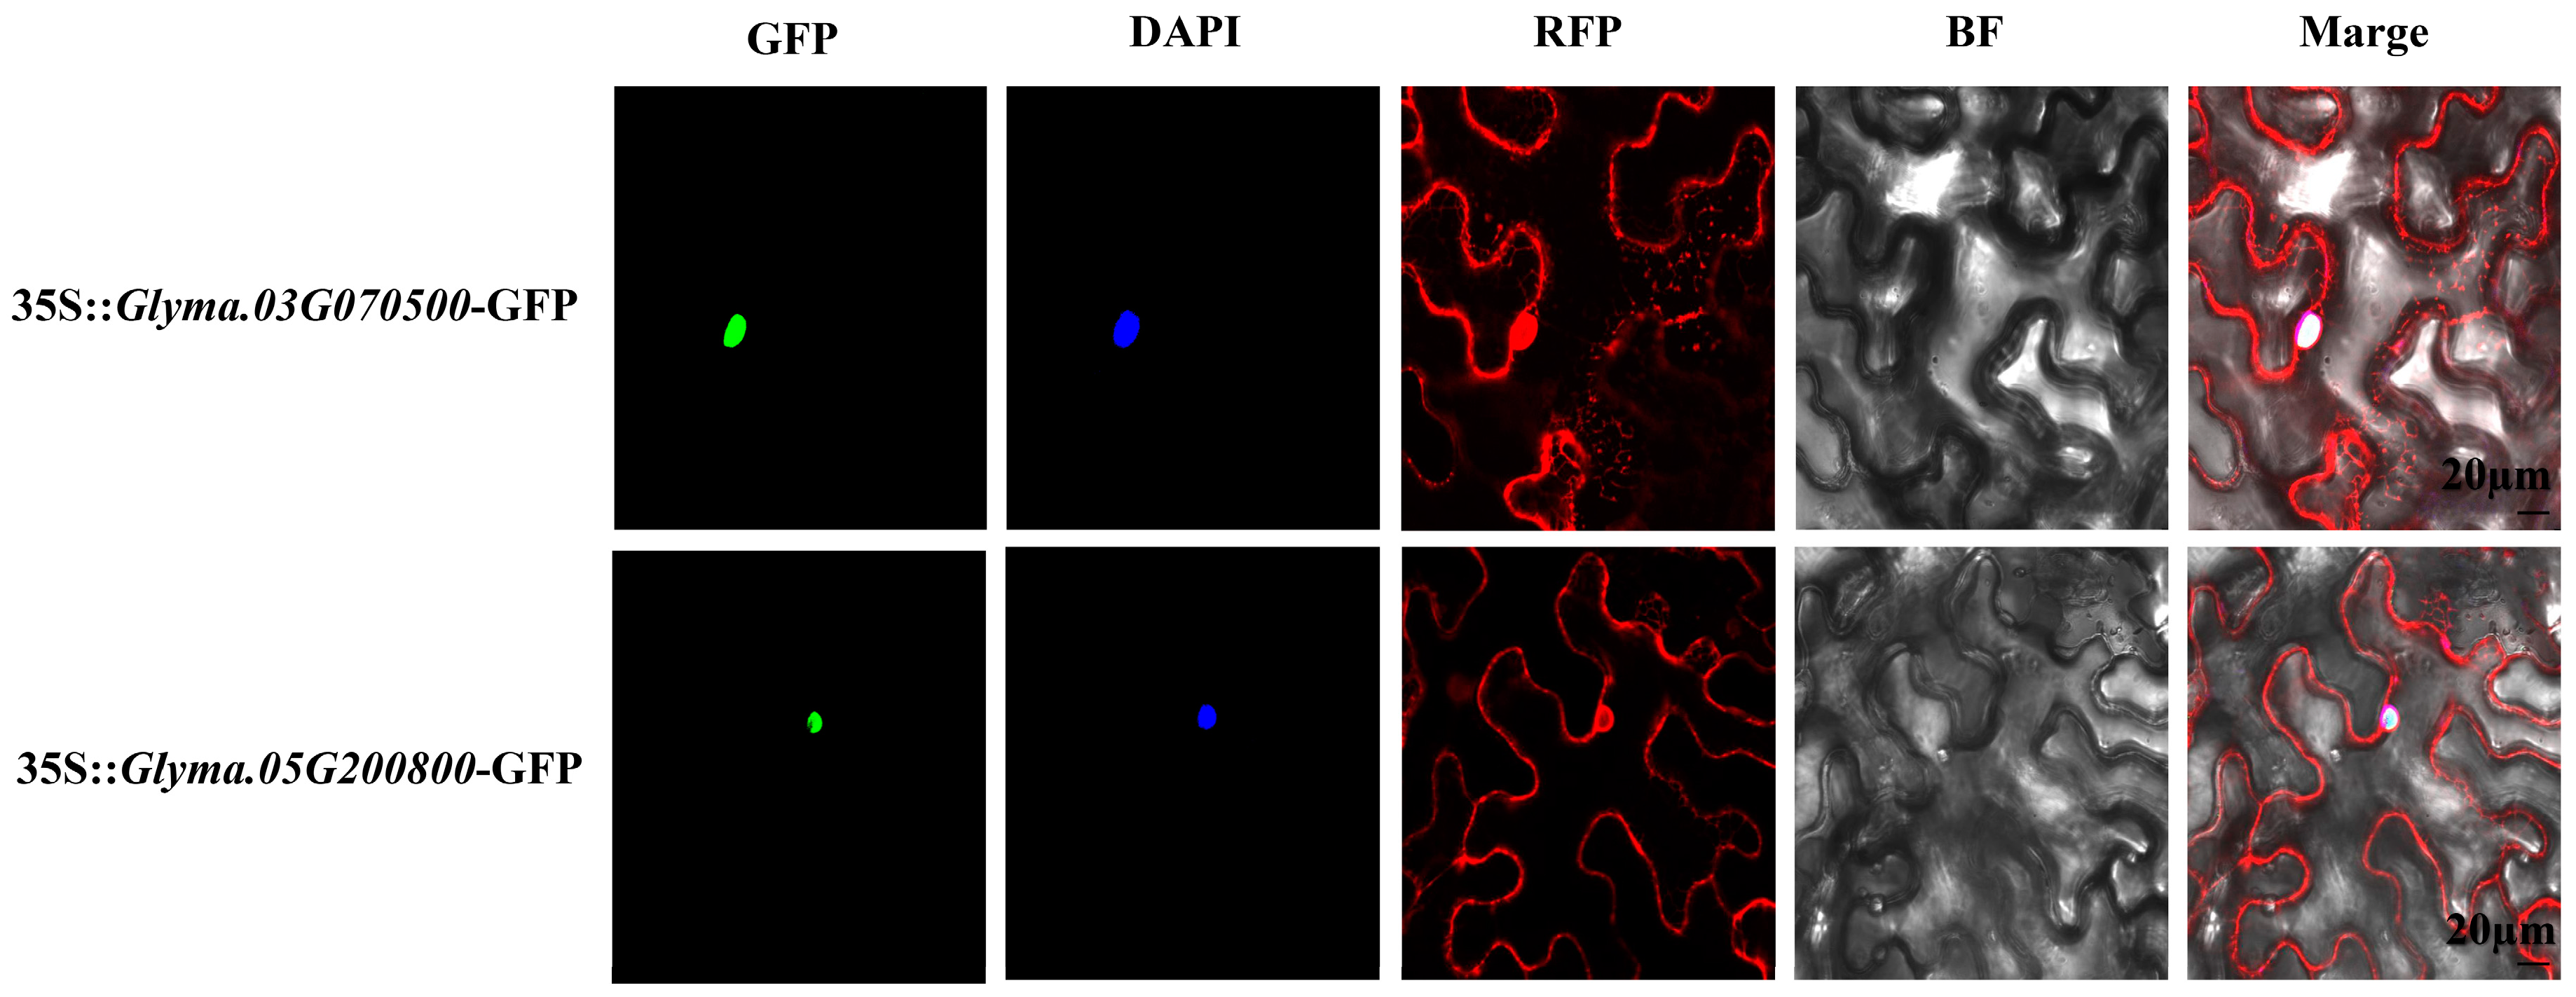
4.11. Subcellular Localization of GmARF9b (Glyma.03G070500) and GmARF2a (Glyma.05G200800) in Soybean

Specific primers containing restriction enzyme sites were designed based on the ORF sequences of GmARF9b (Glyma.03G070500) and GmARF2a (Glyma.05G200800). The CDS regions of GmARF9b and GmARF2a were amplified using their respective ORF sequences as templates, and Asc I (New England Biolabs, Ipswich, MA, USA) enzyme digestion was performed (Supplementary Table S3). These fragments were then cloned into the p5941-35S-GmARF9b/GmARF2a-GFP subcellular localization expression vectors. The plasmids with correct sequencing results were transformed into Agrobacterium EHA105 (Weidi Biotechnology, Shanghai, China). After PCR detection, positive strains were selected and activated at 28 °C with shaking at 250 rpm for 2 days in a 1:1000 ratio. The cultures were centrifuged at 7000× g rpm for 8 min, and the supernatant was discarded. The OD600 of the resuspended cells in infiltration buffer (containing 10 mmol/L MgCl2, 10 mmol/L MES, and 200 µmol/L AS) was adjusted to 0.8–1.2 for use as the infiltration suspension. The infiltration of tobacco leaves was performed according to a previously described study [42]. After co-culturing for two days, the tobacco leaves were observed using a laser scanning confocal microscope for imaging.

Supplementary Materials

The following supporting information can be downloaded at: https://www.mdpi.com/article/10.3390/ijms26104547/s1.

Author Contributions

Y.Z. and H.L. designed the research. D.L. and T.M. conducted the entire experiment. D.L. collected the data for the article. Y.Z. and D.L. analyzed and interpreted the data and experimental results. D.L. and Y.Z. wrote the article. H.L. and Y.Z. supervised, arranged, and managed the process of article writing as well as the experimental progress. All authors have read and agreed to the published version of the manuscript.

Funding

This research was funded by the National Key Research and Development Program of China (grant number 2021YFF1000500).

Institutional Review Board Statement

Not applicable.

Informed Consent Statement

Not applicable.

Data Availability Statement

This study is an original research paper. All data used in this study are included in the main text and Supplementary Material of this paper. For any further questions, please contact the corresponding author of this article.

Conflicts of Interest

The authors declare no conflicts of interest.

References

  1. Tian, H.Y.; De, S.I.; Ding, Z.J. Shaping a root system: Regulating lateral versus primary root growth. Trends Plant Sci. 2014, 19, 426–431. [Google Scholar] [CrossRef] [PubMed]
  2. Eva, B.; Agnieszka, B. Lateral root organogenesis—From cell to organ. Curr. Opin. Plant Biol. 2010, 13, 677–683. [Google Scholar]
  3. Mohammad, S.; Rammyani, B.; Mark, E. SCFTIR1/AFB-based auxin perception: Mechanism and role in plant growth and development. Plant Cell 2015, 27, 9–19. [Google Scholar]
  4. Wang, J.W.; Wang, L.J.; Mao, Y.B.; Cai, W.J.; Xue, H.W.; Chen, X.Y. Control of root cap formation by microRNA-targeted auxin response factors in Arabidopsis. Plant Cell 2005, 17, 2204–2216. [Google Scholar] [CrossRef]
  5. Wang, S.; Bai, Y.; Shen, C.; Wu, Y.; Zhang, S.; Jiang, D.; Guilfoyle, T.J.; Chen, M.; Qi, Y. Auxin-related gene families in abiotic stress response in Sorghum bicolor. Funct. Integr. Genom. 2010, 10, 533–546. [Google Scholar] [CrossRef] [PubMed]
  6. Wang, Y.; Nie, L.; Ma, J.; Zhou, B.; Han, X.; Cheng, J.; Lu, X.; Fan, Z.; Li, Y.; Cao, Y. Transcriptomic variations and network hubs controlling seed size and weight during maize seed development. Front. Plant Sci. 2022, 13, 828923. [Google Scholar] [CrossRef]
  7. Qiao, L.; Zhang, W.; Li, X.; Zhang, L.; Zhang, X.; Li, X.; Guo, H.; Ren, Y.; Zheng, J.; Chang, Z. Characterization and expression patterns of auxin response factors in wheat. Front. Plant Sci. 2018, 9, 1395. [Google Scholar] [CrossRef]
  8. Tiwari, S.B.; Hagen, G.; Guilfoyle, T.J. The roles of auxin response factor domains in auxin-responsive transcription. Plant Cell 2003, 15, 533–543. [Google Scholar] [CrossRef]
  9. Guilfoyle, T.J.; Hagen, G. Auxin response factors: Recent advances in auxin biology. J. Plant Growth Regul. 2001, 10, 281–291. [Google Scholar] [CrossRef]
  10. Krogan, N.T.; Marcos, D.; Weiner, A.I.; Berleth, T. The auxin response factor MONOPTEROS controls meristem function and organogenesis in both the shoot and root through the direct regulation of PIN genes. New Phytol. 2016, 212, 42–50. [Google Scholar] [CrossRef]
  11. Hardtke, C.S. Root development—Branching into novel spheres. Curr. Opin. Plant Biol. 2006, 9, 66–71. [Google Scholar] [CrossRef] [PubMed]
  12. Schlereth, A.; Möller, B.; Liu, W.; Kientz, M.; Flipse, J.; Rademacher, E.H.; Schmid, M.; Jürgens, G.; Weijers, D. MONOPTEROS controls embryonic root initiation by regulating a mobile transcription factor. Nature 2010, 464, 913–916. [Google Scholar] [CrossRef] [PubMed]
  13. Tian, C.E.; Muto, H.; Higuchi, K.; Matamura, T.; Tatematsu, K.; Koshiba, T.; Yamamoto, K.T. Disruption and overexpression of auxin response factor 8 gene of Arabidopsis affect hypocotyl elongation and root growth habit, indicating its possible involvement in auxin homeostasis in light condition. Plant J. 2004, 40, 333–343. [Google Scholar] [CrossRef] [PubMed]
  14. Wilmoth, J.C.; Wang, S.; Tiwari, S.B.; Joshi, A.D.; Hagen, G.; Guilfoyle, T.J.; Alonso, J.M.; Ecker, J.R.; Reed, J.W. NPH4/ARF7 and ARF19 promote leaf expansion and auxin-induced lateral root formation. Plant J. 2005, 43, 118–130. [Google Scholar] [CrossRef]
  15. Lee, H.W.; Kim, N.Y.; Lee, D.J.; Kim, J. LBD18/ASL20 regulates lateral root formation in combination with LBD16/ASL18 downstream of ARF7 and ARF19 in Arabidopsis. Plant Physiol. 2009, 151, 1377–1389. [Google Scholar] [CrossRef]
  16. Yong, H.L.; Sha, Q.H.; Yan, H.Q. Advances in structure and function of auxin response factor in plants. J. Integr. Plant Biol. 2023, 16, 617–632. [Google Scholar]
  17. Li, W.C.; Kai, Y.; Chun, H.C.; Bo, Z.; Ya, N.H.; Wan, Q.W.; Pu, Z.; Kai, L.W.; Bin, H.W.; Ying, X.; et al. Chromosome-level reference genome and resequencing of 322 accessions reveal evolution, genomic imprint and key agronomic traits in adzuki bean. Plant Biotechnol. J. 2024, 22, 2173–2185. [Google Scholar]
  18. Shahid, A.; Wan, P.W.; Zhao, H.Z.; Li, N.X.; Roeland, B.; Naeem, K. Identification and confirmation of novel genetic loci and domestication gene GmGA20ox1 regulating primary root length in soybean seedling stage. Ind. Crops Prod. 2024, 30, 118814. [Google Scholar]
  19. Shobha, S.; Stacy, C.; Elena, S.; Dakshesh, D.; Larry, C.; Ilene, K.M.; Conrad, L.S. The NCBI BioCollections Database. Database 2018, 1, bay006. [Google Scholar]
  20. Samantha, K.P.; Alex, S.H.; David, A.K.; Katherine, H.S.; Natalie, M.C.; Hong, W.J.; Ryan, E.; Soeun, H.; Eric, T.; Ildoo, H.; et al. Nucleo-cytoplasmic Partitioning of ARF Proteins Controls Auxin Responses in Arabidopsis thaliana. Mol. Cell 2019, 76, 177–190. [Google Scholar]
  21. Liu, X.; Zhang, H.; Zhao, Y.; Feng, Z.; Li, Q.; Yang, H.Q.; Luan, S.; Li, J.; He, Z.H. Auxin controls seed dormancy through stimulation of abscisic acid signaling by inducing ARF-mediated ABI3 activation in Arabidopsis. Proc. Natl. Acad. Sci. USA 2013, 110, 15485–15490. [Google Scholar] [CrossRef] [PubMed]
  22. Grey, M.; Thanvi, S.; Pablo, C.B.; Claude, B.; Mariele, L.; Moises, E.A.; Marie, K.; Julia, H.; Manuela, N.; Daniel, K.; et al. Mutation bias reflects natural selection in Arabidopsis thaliana. Nature 2022, 602, 101–105. [Google Scholar]
  23. Yoko, O.; Hidehiro, F.; Makoto, O.; Athanasios, T.; Masao, T. ARF7 and ARF19 regulate lateral root formation via direct activation of LBD/ASL genes in Arabidopsis. Plant Cell 2007, 19, 118–130. [Google Scholar]
  24. Meng, Q.C.; Chen, X.; Tao, W.; Li, H.Z.; Yu, X.W.; Gui, X.L.; Jing, Y.Y.; Ji, M.X.; Rong, L.; Zhi, Y.W.; et al. An LRH-RSL4 feedback regulatory loop controls the determinate growth of root hairs in Arabidopsis. Curr. Biol. 2024, 22, 313–326. [Google Scholar]
  25. Philippe, L.; Tanya, Z.B.; Donghui, L.; David, S.; Christopher, W.; Rajkumar, S.; Robert, M.; Kate, D.; Debbie, L.A.; Margarita, G.H.; et al. The Arabidopsis Information Resource (TAIR): Improved gene annotation and new tools. Nucleic Acids Res. 2012, 40, 1202–1210. [Google Scholar]
  26. David, M.G.; Sheng, Q.S.; Russell, H.; Rochak, N.; Richard, D.H.; Joni, F.; Therese, M.; William, D.; Uffe, H.; Nicholas, P.; et al. Phytozome: A comparative platform for green plant genomics. Nucleic Acids Res. 2012, 40, 1178–1186. [Google Scholar]
  27. Koichiro, T.; Daniel, P.; Nicholas, P.; Glen, S.; Masatoshi, N.; Sudhir, K. MEGA5: Molecular evolutionary genetics analysis using maximum likelihood, evolutionary distance, and maximum Parsimony methods. Mol. Biol. Evol. 2011, 28, 2731–2739. [Google Scholar]
  28. Ivica, L.; Peer, B. Interactive Tree Of Life (iTOL) v5: An online tool for phylogenetic tree display and annotation. Nucleic Acids Res. 2021, 49, 293–296. [Google Scholar]
  29. Martin, K.; Jacqueline, S.; Inanç, B.; Joseph, C.; Randy, G.; Doug, H.; Steven, J.J.; Marco, A.M. Circos: An information aesthetic for comparative genomics. Genome Res. 2009, 19, 1639–1645. [Google Scholar]
  30. Yu, Q.W.; Hai, B.T.; Jeremy, D.D.B.; Xu, T.; Jing, Q.L.; Xi, Y.W.; Tae-ho, L.; Hui, Z.J.; Barry, M.; Hui, G.; et al. MCScanX: A toolkit for detection and evolutionary analysis of gene synteny and collinearity. Nucleic Acids Res. 2012, 40, 49. [Google Scholar]
  31. Cheng, J.C.; Hao, C.; Yi, Z.; Hannah, R.; Thomas, H.R.; Margaret, H.F.; Ye, H.H.; Rui, X. TBtools: An Integrative Toolkit Developed for Interactive Analyses of Big Biological Data. Mol. Plant 2020, 8, 1194–1202. [Google Scholar] [CrossRef] [PubMed]
  32. Tian, Q.Z.; Ying, H.L.; Yan, F.L.; Sheng, R.Z.; Tian, L.G.; Chun, C.W.; Fan, Z.; Muhiuddin, F.; Lina, Z.; Xiang, Y.W.; et al. A general model for “germplasm-omics” data sharing and mining: A case study of SoyFGB v2.0. Sci. Bull. 2022, 15, 1716–1719. [Google Scholar]
  33. Robert, D.F.; Teresa, K.A.; Patricia, C.B.; Alex, B.; Peer, B.; Alan, J.B.; Hsin, Y.C.; Zsuzsanna, D.; Sara, E.G.; Matthew, F.; et al. InterPro in 2017-beyond protein family and domain annotations. Nucleic Acids Res. 2017, 45, 190–199. [Google Scholar]
  34. Scott, F. The NCBI Taxonomy database. Nucleic Acids Res. 2012, 8, 136–143. [Google Scholar]
  35. Paul, H.; Keun-Joon, P.; Takeshi, O.; Naoya, F.; Hajime, H.; Adams-Collier, C.J.; Kenta, N. WoLF PSORT: Protein localization predictor. Nucleic Acids Res. 2007, 35, 585–587. [Google Scholar]
  36. Andrew, W.; Martino, B.; Stefan, B.; Gabriel, S.; Gerardo, T.; Rafal, G.; Florian, T.H.; Tjaart, A.P.B.; Christine, R.; Lorenza, B.; et al. SWISS-MODEL: Homology modelling of protein structures and complexes. Nucleic Acids Res. 2018, 46, 296–303. [Google Scholar]
  37. Timothy, L.B.; James, J.; Charles, E.G.; William, S.N. The MEME Suite. Nucleic Acids Res. 2015, 43, 39–49. [Google Scholar]
  38. Magali, L.; Patrice, D.; Gert, T.; Kathleen, M.; Yves, M.; Yves, V.P.; Pierre, R.; Stephane, R. PlantCARE, a database of plant cis-acting regulatory elements and a portal to tools for in silico analysis of promoter sequences. Nucleic Acids Res. 2002, 30, 325–327. [Google Scholar]
  39. Fabricio, A.; Francisnei, P.S.; Thiago, M.V. The Soybean Expression Atlas v2: A comprehensive database of over 5000 RNA-seq samples. Plant J. 2023, 116, 1041–1051. [Google Scholar]
  40. Xiao, Z.; Jia, X.C.; Wen, T.L.; Hui, W.Z.; Ying, H.; Xin, X.L.; Hong, L. Molecular module GmPTF1a/b-GmNPLa regulates rhizobia infection and nodule formation in soybean. New Phytol. 2024, 241, 1813–1828. [Google Scholar]
  41. Han, Y.X.; Yan, J.L.; Ke, F.Z.; Ming, J.L.; Si, Y.F.; Ying, Z.T.; Tong, F.Q.; Xin, X.L.; Yong, J.Z.; Hong, L. miR169c-NFYA-C-ENOD40 modulates nitrogen inhibitory effects in soybean nodulation. New Phytol. 2021, 229, 3377–3392. [Google Scholar]
  42. Varaud, E.; Brioudes, F.; Szécsi, J.; Leroux, J.; Brown, S.; Perrot Rechenmann, C.; Bendahmane, M. AUXIN RESPONSE FACTOR 8 regulates Arabidopsis petal growth by interacting with the bHLH transcription factor BIGPETALp. Plant Cell 2011, 23, 973–983. [Google Scholar] [CrossRef] [PubMed]
Figure 1. Phylogenetic tree and synteny analysis of ARF genes. (A) Phylogenetic tree of ARF proteins from Glycine max (Gm) and Arabidopsis thaliana (At). Yellow stars and blue circles indicate Arabidopsis and soybean, respectively. The light blue circle placed on the tree indicates the bootstrap value (display range: 0.51–1.00). The colored segments in the inner circle represent distinct subfamilies, while those in the outer circle denote different phylogenetic clades. (B) Distribution and collinearity of GmARF genes in soybean genome. Gray lines indicate synteny blocks in soybean genome, while lines of various colors indicate segmental duplicated ARF gene pairs in soybean. (C) Synteny analysis between soybean GmARF genes and Arabidopsis AtARF genes. Gray lines in the background indicate collinear blocks between soybean and Arabidopsis genomes, while red lines highlight the systematic gene pairs of GmARFs between soybean and Arabidopsis genomes. (D) The distribution of ARF genes on chromosomes. The chromosome number is indicated to the left of each chromosome.
Ijms 26 04547 g001aIjms 26 04547 g001b
Figure 2. The phylogenetic relationship and haplotype analysis of GmARFs from Glycine max (Gm). (A) Phylogenetic tree of ARF proteins from Glycine max (Gm). Color blocks in different hues represent distinct subfamilies. (B) The phylogenetic tree of 59 GmARFs. (C) Haplotype analysis for GmARF genes and distribution of haplotype variations across each gene. The bar chart represents the number of haplotypes for each GmARF gene, and the pie chart illustrates the distribution of each haplotype. (D) Evolutionary distribution of suppressor GmARFs. Color blocks in different hues represent distinct subfamilies. (E) Evolutionary distribution of activator GmARFs. Petals of different colors represent different haplotypes. Color blocks in different hues represent distinct subfamilies.
Ijms 26 04547 g002
Figure 3. The gene structures of GmARFs. (A) The gene structures of the GmARFs include coding sequences (CDS) and untranslated regions (UTRs). (B) Distribution of protein domain of GmARF proteins.
Ijms 26 04547 g003
Figure 4. The structural analysis of GmARF proteins. (A) The distribution of conserved domains in GmARF proteins. (B) Three-dimensional structural diagrams of repressor protein. Each distinct colored block represents a unique protein domain. (C) Three-dimensional structural diagrams of activator protein Each distinct colored block represents a unique protein domain. (B-a) Construction of the overall 3D structural diagram using conserved amino acids from various repressor proteins; (B-b) 3D structural diagram of the DNA-binding domain: (B-b-I) B3 domain; (B-b-II) auxin-response domain; (B-c) 3D structural diagram of the carboxy-terminal dimerization domain binding region: (B-c-I) PB1 domain; (B-d) 3D structural diagram of the middle region binding domain: (B-d-I) structural diagram of core amino acids; (B-e) amino acid composition percentage diagram. (C-a) Construction of the overall 3D structural diagram using conserved amino acids from various activator proteins; (C-b) 3D structural diagram of the DNA-binding domain: (C-b-I) B3 domain; (C-b-II) auxin-response domain; (C-c) 3D structural diagram of the carboxy-terminal dimerization domain binding region: (C-c-I) PB1 domain; (C-d) 3D structural diagram of the middle region binding domain: (C-d-I) structural diagram of core amino acids; (C-e) amino acid composition percentage diagram.
Ijms 26 04547 g004aIjms 26 04547 g004b
Figure 5. Analysis of amino acid motifs in the activator and repressor of GmARFs. (A) Structural diagram of activator GmARF motif; (B) structural diagram of repressor GmARF motif; (A-a) distribution map of activator GmARF motif. Each distinct colored block within a gene represents a unique motif. The red-bordered frame denotes the B3-BD domain, the green-bordered frame indicates the Auxin-responsive domain, the purple-bordered frame corresponds to the MR domain, and the blue-bordered frame marks the PB1 domain; (B-a) distribution map of repressor GmARF motif. Each distinct colored block within a gene represents a unique motif. The red-bordered frame denotes the B3-BD domain, the green-bordered frame indicates the Auxin-responsive domain, the purple-bordered frame corresponds to the MR domain, and the blue-bordered frame marks the PB1 domain; (A-b) amino acid information of activator GmARF motif. Each distinct colored block within a gene represents a unique motif; (B-b) amino acid information of repressor GmARFs. Each distinct colored block within a gene represents a unique motif.
Ijms 26 04547 g005aIjms 26 04547 g005b
Figure 6. Analysis of cis-elements in the promoter of GmARFs. (A) Analysis of cis-elements in the promoter region of GmARF genes. (B) Heatmap of the number of cis-elements; the different colors represent the number of cis-elements in each category. (C) The sum of cis-elements in categories shown as a histogram.
Ijms 26 04547 g006
Figure 7. Expression analysis of GmARF families. (A) Heatmap depicting the expression patterns of GmARFs across various tissues. (B) Comparative analysis of GmARF expression levels in the roots of soybean.
Ijms 26 04547 g007
Figure 8. The subcellular localization of GmARF9b/GmARF2a in tobacco leaves. Red fluorescence corresponds to RFP (Red Fluorescent Protein) signals and RFP represents the RFP channel image. Blue fluorescence marks DAPI (4′,6-Diamidino-2-Phenylindole) nuclear staining and DAPI represents the DAPI channel image. Green fluorescence indicates GFP (Green Fluorescent Protein) signals and GFP represents the GFP channel image. BF (bright field) is the field-of-view image, and the scale bar is 20 µm.
Ijms 26 04547 g008
Figure 9. Tissue localization analysis of GmARF9b/GmARF2a in soybean hairy roots. (A) Tissue localization map of GmARF9b. The red-boxed areas in the figure correspond to subpanels a–e; (B-a) base of the primary root. The red-boxed areas in the figure correspond to subpanels IIII; (B-a-I,II) detailed view of the primary root base; (B-a-III) detailed view of first-order lateral root at the primary root base; (B-a-IV) detailed view of the first-order lateral root tip; (B-b) connection between the primary root and lateral roots. The red-boxed areas in the figure correspond to subpanels IIII; (B-b-I,II) detailed view of the primary root; (B-b-III) detailed view of the lateral root at the primary root; (B-b-IV) detailed view of the lateral root tip; (B-c) lateral root. The red-boxed areas in the figure correspond to subpanels I–III; (B-c-I,II) detailed view of the lateral root; (B-c-III) detailed view of second-order lateral root; (B-d) lateral root primordium. The red-boxed areas in the figure correspond to subpanels IIII; (B-d-I,II) detailed view of the lateral root primordium; (B-d-III) detailed view of second-order lateral root; (B-d-IV) detailed view of the lateral root tip; (B-e) tip of the primary root; (B-f-I) longitudinal sections of root cells from panel B-d; (B-f-II) transverse sections of root cells from panel B-d; (C-I,II,III,IV,V,VI,VII,VIII) formation process of GmARF9b lateral root primordium. (D) Tissue localization map of GmARF2a. The red-boxed areas in the figure correspond to subpanels a–e; (E-a) base of the primary root. The red-boxed areas in the figure correspond to subpanels IIII; (E-a-I,II) detailed view of the primary root base; (E-a-III) detailed view of first-order lateral root at the primary root base; (E-a-IV) detailed view of the first-order lateral root tip; (E-b) connection between the primary root and lateral roots. The red-boxed areas in the figure correspond to subpanels IIII; (E-b-I,II) detailed view of the primary root; (E-b-III) detailed view of the lateral root at the primary root; (E-b-IV) detailed view of the lateral root tip; (E-c) lateral root. The red-boxed areas in the figure correspond to subpanels I–III; (E-c-I,II) detailed view of the lateral root; (E-c-III) detailed view of second-order lateral root; (E-d) lateral root primordium. The red-boxed areas in the figure correspond to subpanels IIII; (E-d-I,II) detailed view of the lateral root primordium; (E-d-III) detailed view of second-order lateral root; (E-d-IV) detailed view of the lateral root tip; (E-e) tip of the primary root; (E-f-I) longitudinal sections of root cells from panel E-d; (E-f-II) transverse sections of root cells from panel E-d; (F-I,II,III,IV,V,VI,VII,VIII) formation process of GmARF2a lateral root primordium.
Ijms 26 04547 g009
Figure 10. Effects of overexpression of GmARF9b/GmARF2a on root growth and development of soybean. (A) Phenotype images of GmARF9b/GmARF2a compared with control (CK) roots. (A-a) WT (EV); (A-b) GmARF9b-OX; (A-c) GmARF2a-OX. (B) Comparative longitudinal section views of cells. The yellow-boxed regions in the figure represent individual longitudinally sectioned cells. (B-a-I) Longitudinal sections of cells were obtained from the WT material at a distance of 1.0–1.5 cm from the root apex; (B-a-II) longitudinal sections of cells were obtained from the WT material at a distance of 3.0–3.5 cm from the root apex; (B-b-I) longitudinal sections of cells were prepared from the GmARF9b-OX material at a distance of 1.0–1.5 cm from the root apex; (B-b-II) longitudinal sections of cells were prepared from the GmARF9b-OX material at a distance of 3.0–3.5 cm from the root apex; (B-c-I) longitudinal sections of cells were prepared from the GmARF2a-OX material at a distance of 1.0–1.5 cm from the root apex; (B-c-II) longitudinal sections of cells were prepared from the GmARF2a-OX material at a distance of 3.0–3.5 cm from the root apex. (C) Comparative transverse section views of cells; (C-a-I) transverse sections of cells were obtained from the WT material at a distance of 1.0–1.5 cm from the root apex; (C-a-II) transverse sections of cells were obtained from the WT material at a distance of 3.0–3.5 cm from the root apex; (C-b-I) transverse sections of cells were prepared from the GmARF9b-OX material at a distance of 1.0–1.5 cm from the root apex; (C-b-II) transverse sections of cells were prepared from the GmARF9b-OX material at a distance of 3.0–3.5 cm from the root apex; (C-c-I) transverse sections of cells were prepared from the GmARF2a-OX material at a distance of 1.0–1.5 cm from the root apex; (C-c-II) transverse sections of cells were prepared from the GmARF2a-OX material at a distance of 3.0–3.5 cm from the root apex. (D) Cell diameter. (E) Cell length. (F) Number of cell layers. (G) Total root length. (H) Root volume. (I) Root surface area. (J) Primary root length. (K) Comparison of GFP expression levels. The asterisks “*”, “**”, and “***” indicate significance at the 5% (p < 0.05) level, while “ns” indicates no significant difference.
Ijms 26 04547 g010
Table 1. Collection of gene sequences and protein information for members of the soybean family.
ClassificationGene NameGene LociChromosomeGene PositionSize (aa)MW (Da)PIInstability IndexA.I.GRAVYPredicted LocationArabidopsis Orthologues
StartEndGene NameGene Loci
SuppressorGmARF1Glyma.07G272800chr0744,814,49944,821,84170178,043.975.8358.9375.48−0.475NucleusAtARF1AtlG59750
Glyma.12G164100chr1233,328,00633,334,62266574,273.525.7560.8267.98−0.523Nucleus
Glyma.16G000300chr1625,16631,97866674,250.405.6258.7270.36−0.494Nucleus
GmARF2Glyma.05G200800chr0538,470,75838,476,41485894,845.136.3552.1367.02−0.638NucleusAtARF2At5G62000
Glyma.08G008100chr08643,657649,22485395,522.616.5053.9871.98−0.577Nucleus
Glyma.06G164900chr0613,626,69013,632,15484393,667.206.1959.4063.49−0.654Nucleus
Glyma.04G200600chr0446,137,85946,143,35585094,721.436.3556.0164.93−0.661Nucleus
Glyma.19G206100chr1946,694,88846,706,15167775,645.757.1157.2073.87−0.489Nucleus
GmARF3Glyma.13G174000chr1328,226,44928,232,50371478,286.476.6754.8770.31−0.400NucleusAtARF3At2G33860
Glyma.07G202200chr0737,447,17437,452,87670977,934.526.6752.8373.27−0.358Nucleus
Glyma.13G234200chr1333,897,47433,903,87173980,750.896.1855.8275.20−0.315Nucleus
Glyma.15G078800chr156,035,9006,041,75673680,922.026.1054.5175.50−0.309Plasmodesmata
GmARF4Glyma.13G327951chr1341,634,39241,640,30625428,301.655.2354.8866.81−0.498NucleusAtARF4At5G60450
Glyma.12G171000chr1234,108,20634,114,86479988,732.316.4955.7170.53−0.438Nucleus
Glyma.11G154632chr1111,580,78811,587,78779288,149.475.9853.3574.91−0.433Nucleus
Glyma.12G071000chr125,182,5365,190,63179287,731.726.0053.1873.83−0.428Nucleus
GmARF9Glyma.18G184500chr1844,742,37244,749,32466474,553.015.8951.7976.46−0.472NucleusAtARF9At4G23980
Glyma.07G134800chr0715,844,23215,849,86566474,516.945.9951.9974.23−0.501Nucleus
Glyma.03G070500chr0316,448,58816,454,40069176,860.436.0246.8768.67−0.537Nucleus
Glyma.01G103500chr0135,187,77035,192,40769276961.626.0246.6770.36−0.504Nucleus
Glyma.16G023600chr162,242,8182,248,08471779,581.756.1453.3472.73−0.474Nucleus
GmARF17Glyma.14G166500chr1442,041,63842,046,15054860,511.916.3653.0363.70−0.389ChloroplastAtARF17At1G77850
Glyma.13G084700chr1318,614,25418,618,64755160,677.925.7852.4663.36−0.386Chloroplast
Glyma.06G108051chr068,647,2768,649,64516218,067.406.8551.2971.48−0.478Cytoplasm
Glyma.04G254200chr0450,908,67450,913,75956261,209.955.5348.0571.46−0.265Chloroplast
GmARF18Glyma.19G181900chr1944,488,21144,492,38770077,788.518.3050.3871.20−0.378NucleusAtARF18At3G61830
Glyma.13G140600chr1324,398,04524,400,07751457,052.258.9345.4574.94−0.344Nucleus
Glyma.10G053500chr104,804,4934,809,52870077,266.447.2646.4273.39−0.389Nucleus
Glyma.11G145500chr1117,400,51517,404,14469776,555.967.8543.9074.42−0.324Nucleus
Glyma.12G076200chr125,836,5585,840,46170177,188.678.2443.0373.59−0.348Nucleus
Glyma.13G325200chr1341,405,93941,408,91367073,760.457.6148.9275.99−0.331Nucleus
Glyma.12G174100chr1234,605,35934,608,86070076,824.937.6048.6175.07−0.361Nucleus
Glyma.10G210600chr1044,358,94244,362,45161267,127.697.2145.4867.70−0.397Nucleus
Glyma.20G180000chr2041,744,45141,747,71559365,246.966.7046.0470.20−0.336Nucleus
Glyma.03G258300chr0346,452,00846,456,77166974,921.726.6559.8469.46−0.516Nucleus
Glyma.07G054800chr074,782,6254,787,84971679,530.356.0752.6570.80−0.528Nucleus
GmARF23Glyma.03G208800chr0342,723,03742,743,48778688,027.818.3851.7886.07−0.235PlasmodesmataAtARF23AtlG43950
ActivatorGmARF6Glyma.14G032700chr142,368,5632,377,33089899,065.456.1366.7975.04−0.414NucleusAtARF6At1G30330
Glyma.02G281700chr0248,225,43748,235,38989698,952.516.0467.8675.31−0.410Nucleus
Glyma.13G221400chr1332,864,28032,871,32689699,837.226.2860.4571.91−0.497Nucleus
Glyma.15G091000chr156,970,3786,977,27389899,689.896.2257.0273.82−0.476Nucleus
Glyma.05G143800chr0533,795,53033,802,884909100,674.796.1366.6870.87−0.483Nucleus
Glyma.08G100100chr087,676,6637,683,563907100,662.056.1764.7272.21−0.483Nucleus
GmARF8Glyma.18G119700chr1814,818,23914,819,38111913,215.884.9959.2682.69−0.364CytoplasmAtARF8At5G37020
Glyma.18G046800chr184,068,5824,076,13584193,247.825.9357.9876.05−0.441Nucleus
Glyma.11G204200chr113,3637,70933,645,52484493,600.095.9358.7375.89−0.461Nucleus
Glyma.14G208500chr1448,263,88948,272,15484393,795.446.0160.6374.12−0.473Nucleus
Glyma.02G239600chr0244,642,95844,654,51684794,202.816.0661.6773.55−0.495Nucleus
GmARF19Glyma.07G130400chr0715,309,92615,315,9461110122,978.036.3063.7975.15−0.578NucleusAtARF19At1G19220
Glyma.01G002100chr01294,373300,4221104121,957.836.5163.3876.10−0.561Nucleus
Glyma.05G221300chr0540,123,00040,129,8711099120,828.596.0161.5280.35−0.455Nucleus
Glyma.08G027800chr082,218,6152,225,9001113122,551.225.8663.0477.85−0.503Nucleus
Glyma.09G072200chr097,436,3927,445,0951125125,840.876.0267.6467.01−0.698Nucleus
Glyma.15G181000chr1517,521,99717,530,2091122125,284.276.1967.0967.9−0.686Nucleus
Glyma.13G112600chr1321,613,42521,621,0471131126,747.126.0865.2873.47−0.673Nucleus
Glyma.17G047100chr173,563,8913,571,8111136127,058.286.0567.2372.90−0.683Nucleus
GmARF5Glyma.12G153700chr1223,224,44523,225,261109120,50.987.8646.0183.21−0.184CytoplasmAtARF5At1G19850
Glyma.14G217700chr1449,093,82449,100,973930103,499.155.6253.2378.17−0.407Nucleus
Glyma.17G256500chr1741,134,62241,140,694933103,492.165.4851.5077.19−0.384Nucleus
Disclaimer/Publisher’s Note: The statements, opinions and data contained in all publications are solely those of the individual author(s) and contributor(s) and not of MDPI and/or the editor(s). MDPI and/or the editor(s) disclaim responsibility for any injury to people or property resulting from any ideas, methods, instructions or products referred to in the content.

