_Kim.png)
Modulation of Albumin Esterase Activity by Warfarin and Diazepam

 , , ,
, , ,
Abstract
1. Introduction
2. Results
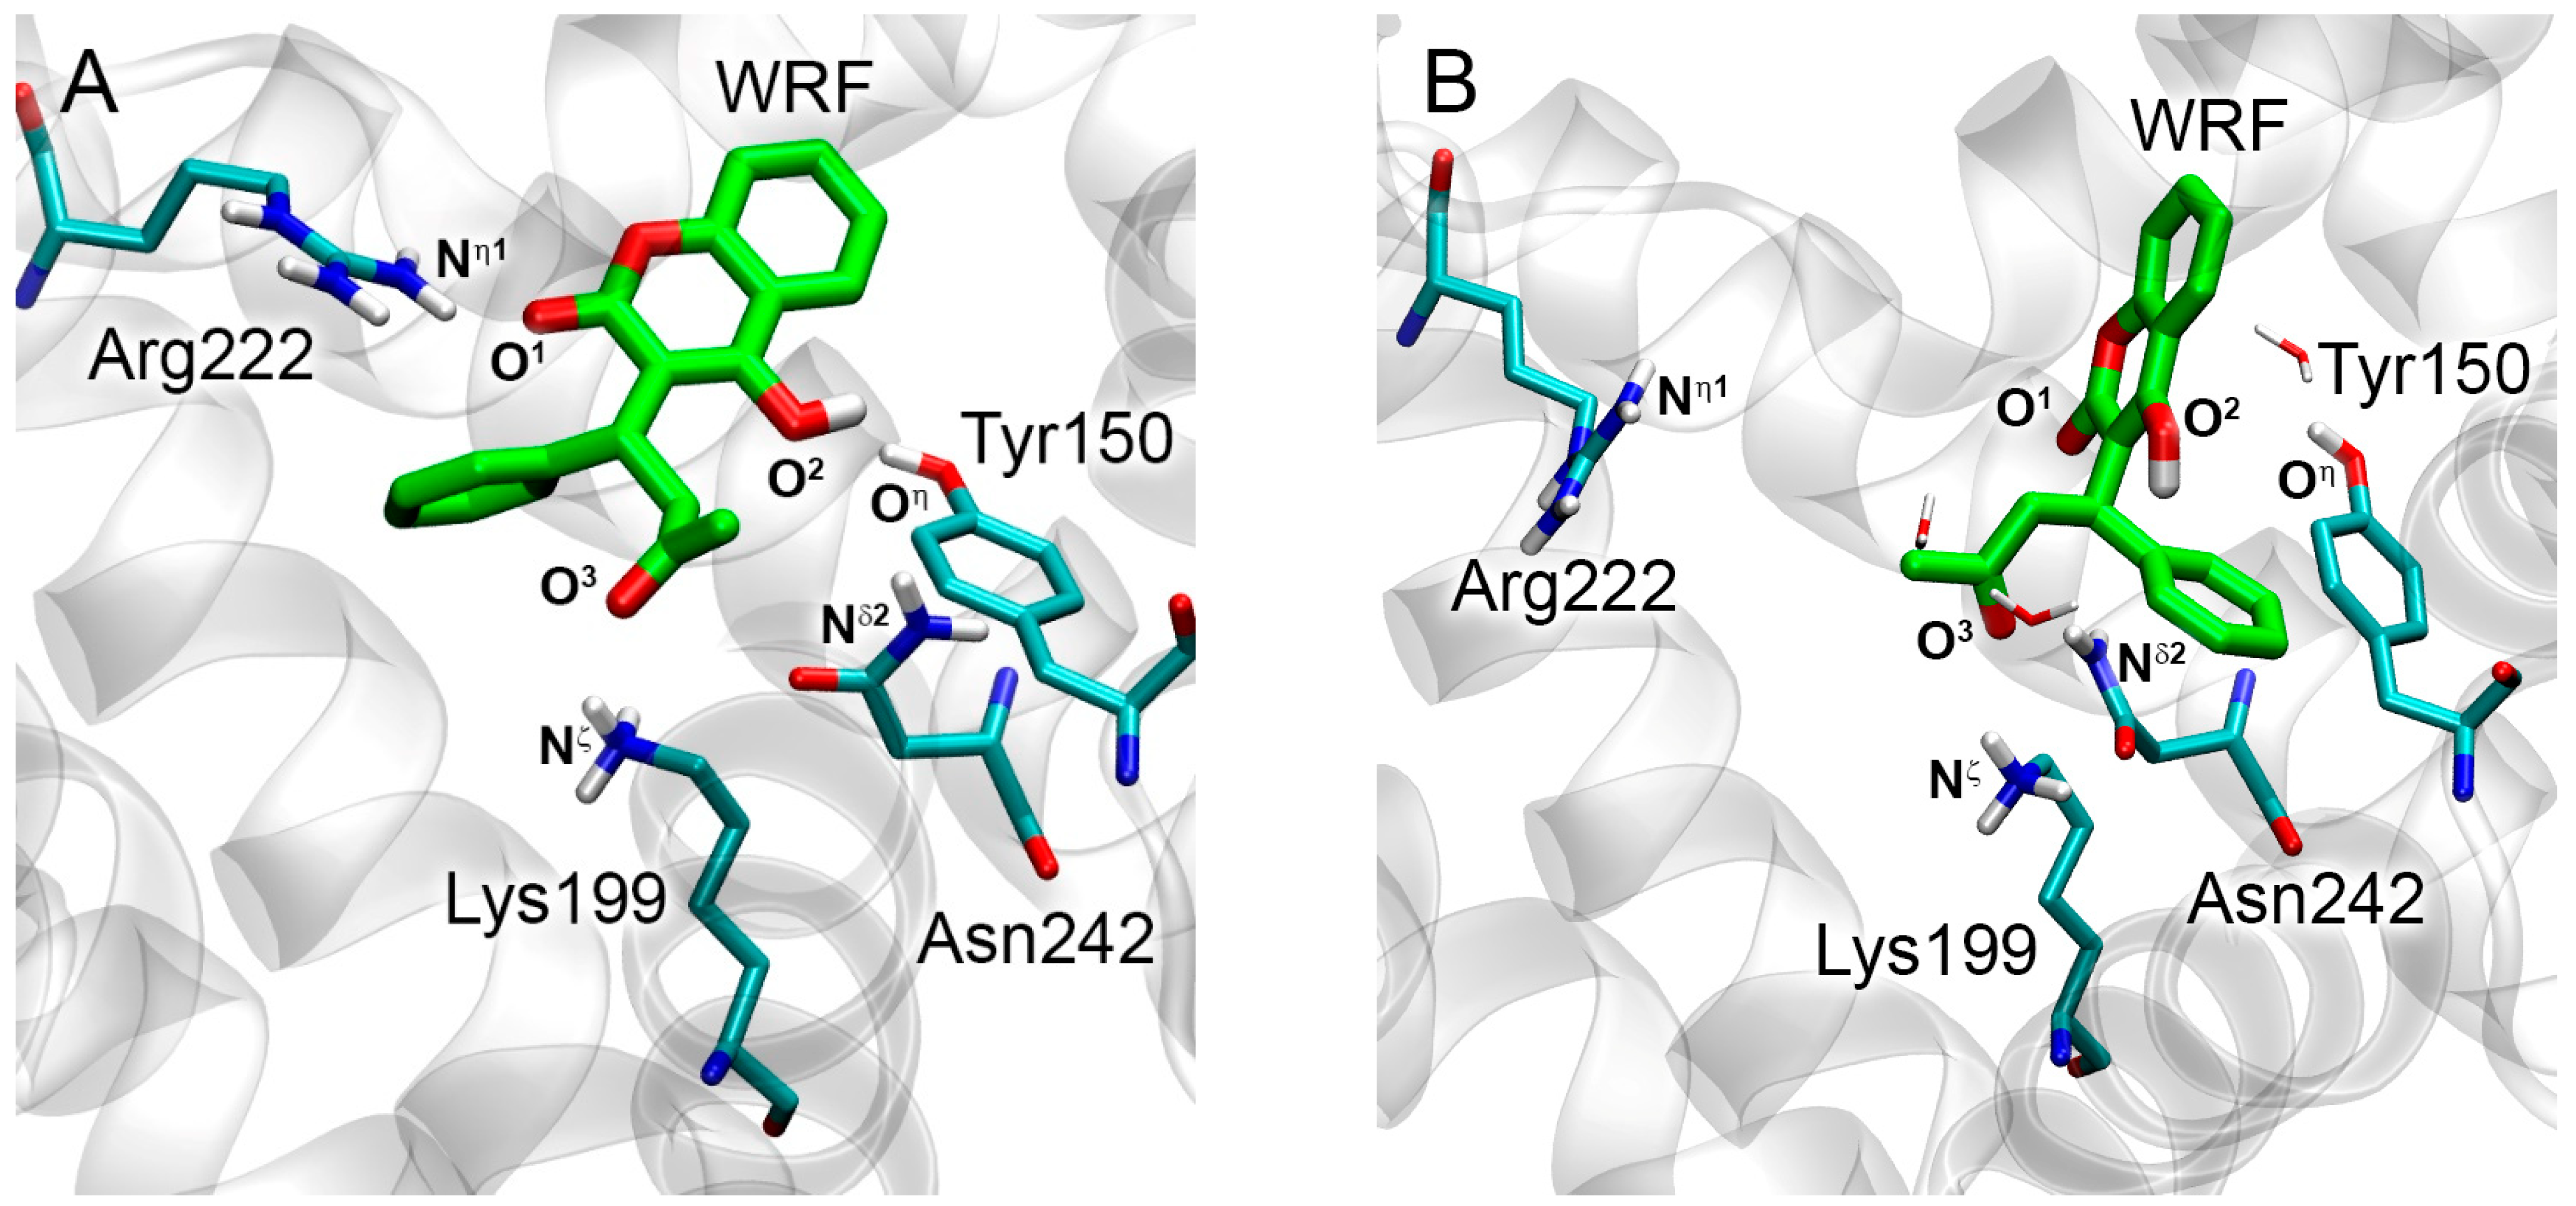
2.1. Interaction of WRF and DIA with Human Serum Albumin: Validation of Molecular Modeling Methods
2.2. Interaction of WRF and DIA with Bovine Serum Albumin
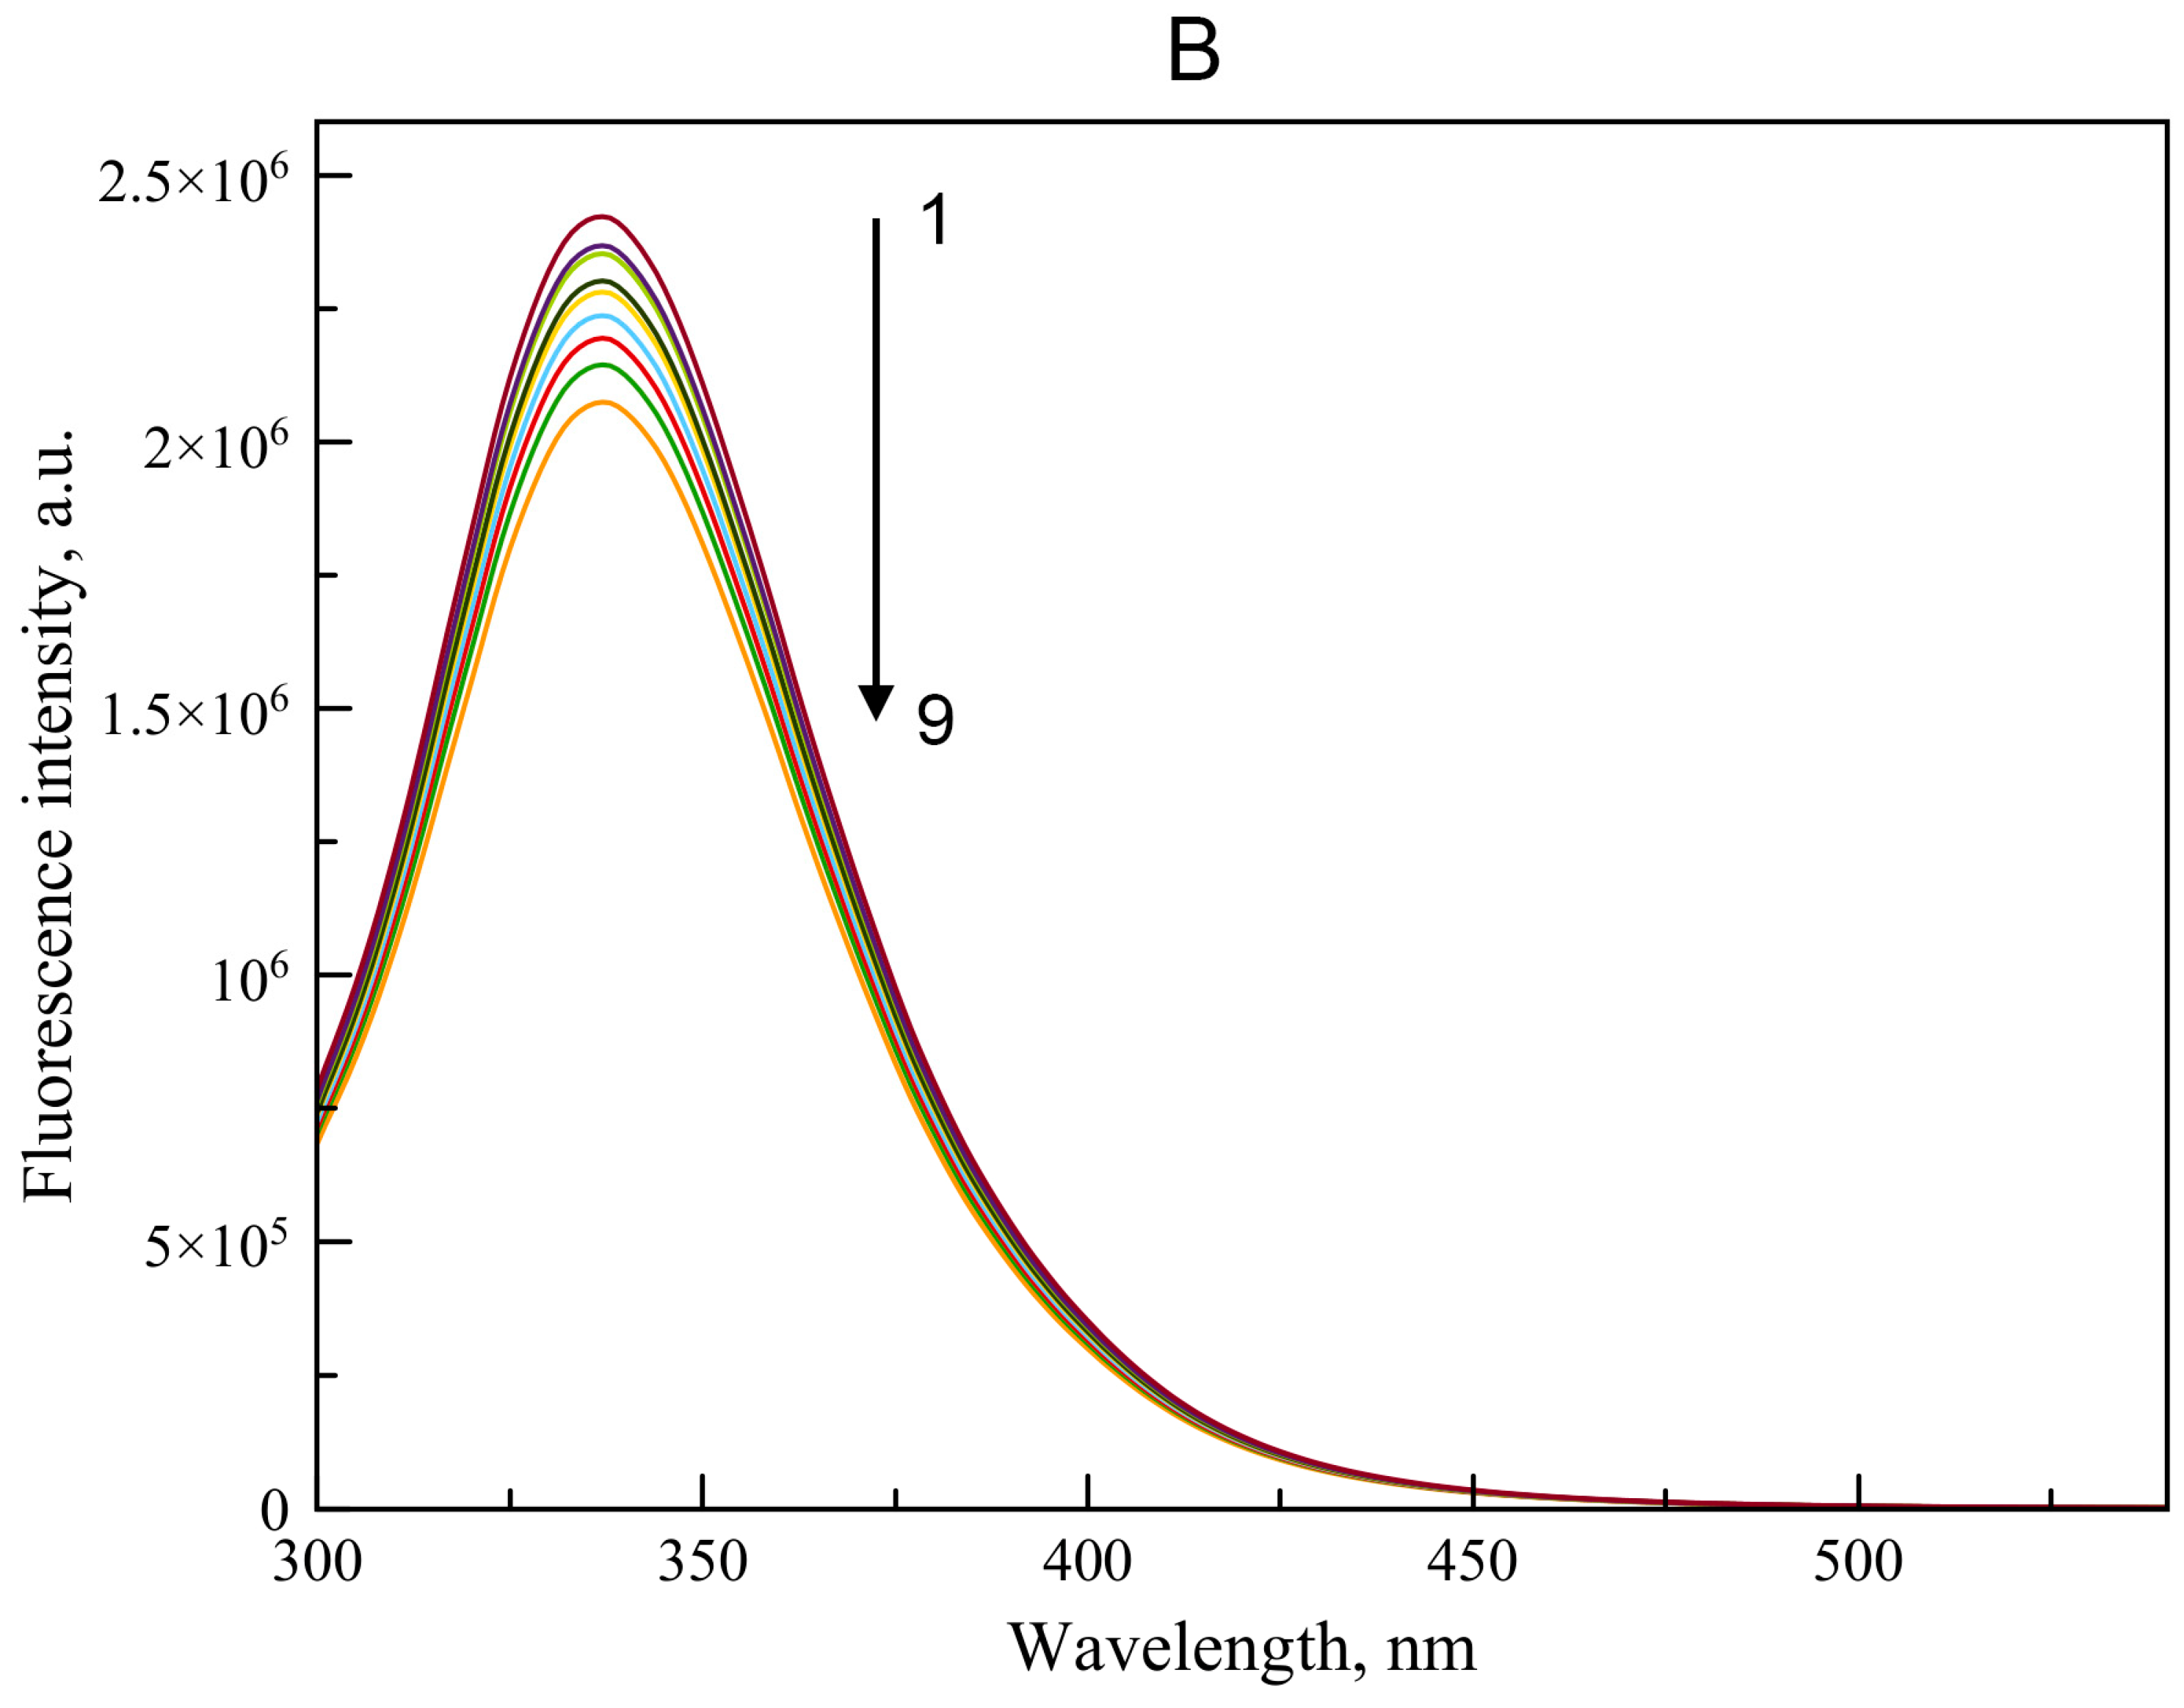
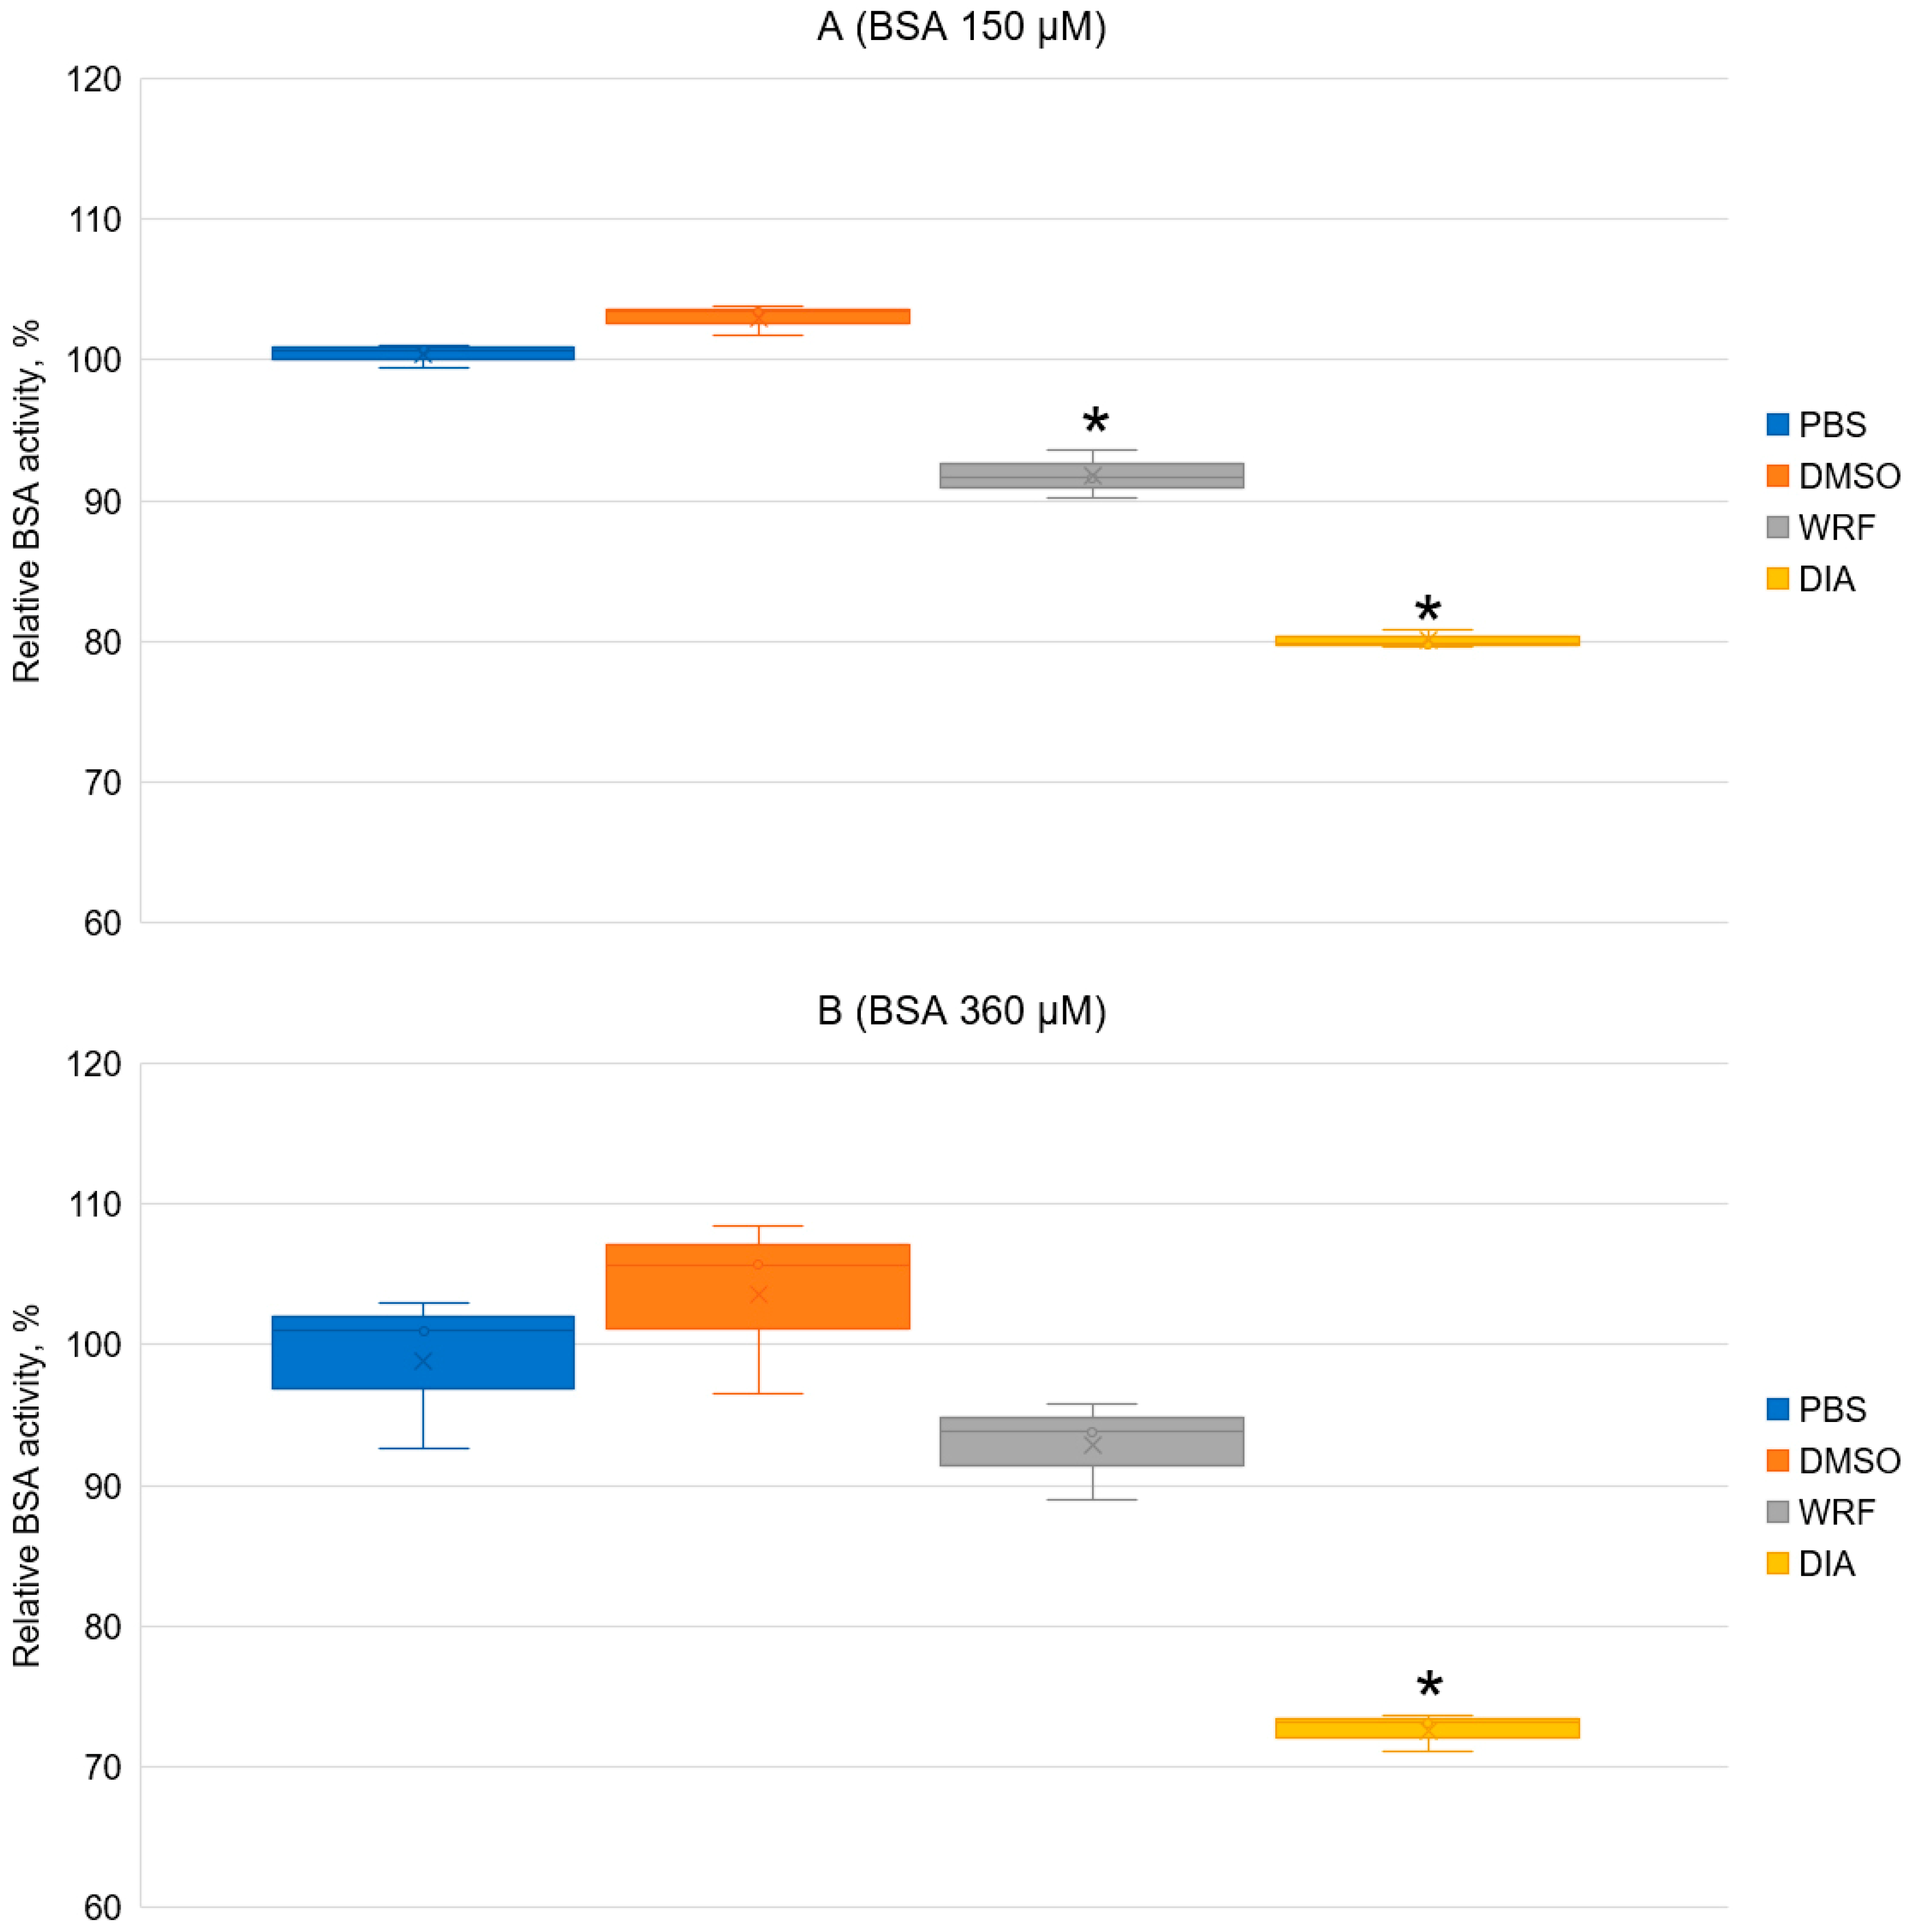
2.2.1. Interaction of WRF and DIA with BSA According to Spectrofluorimetry
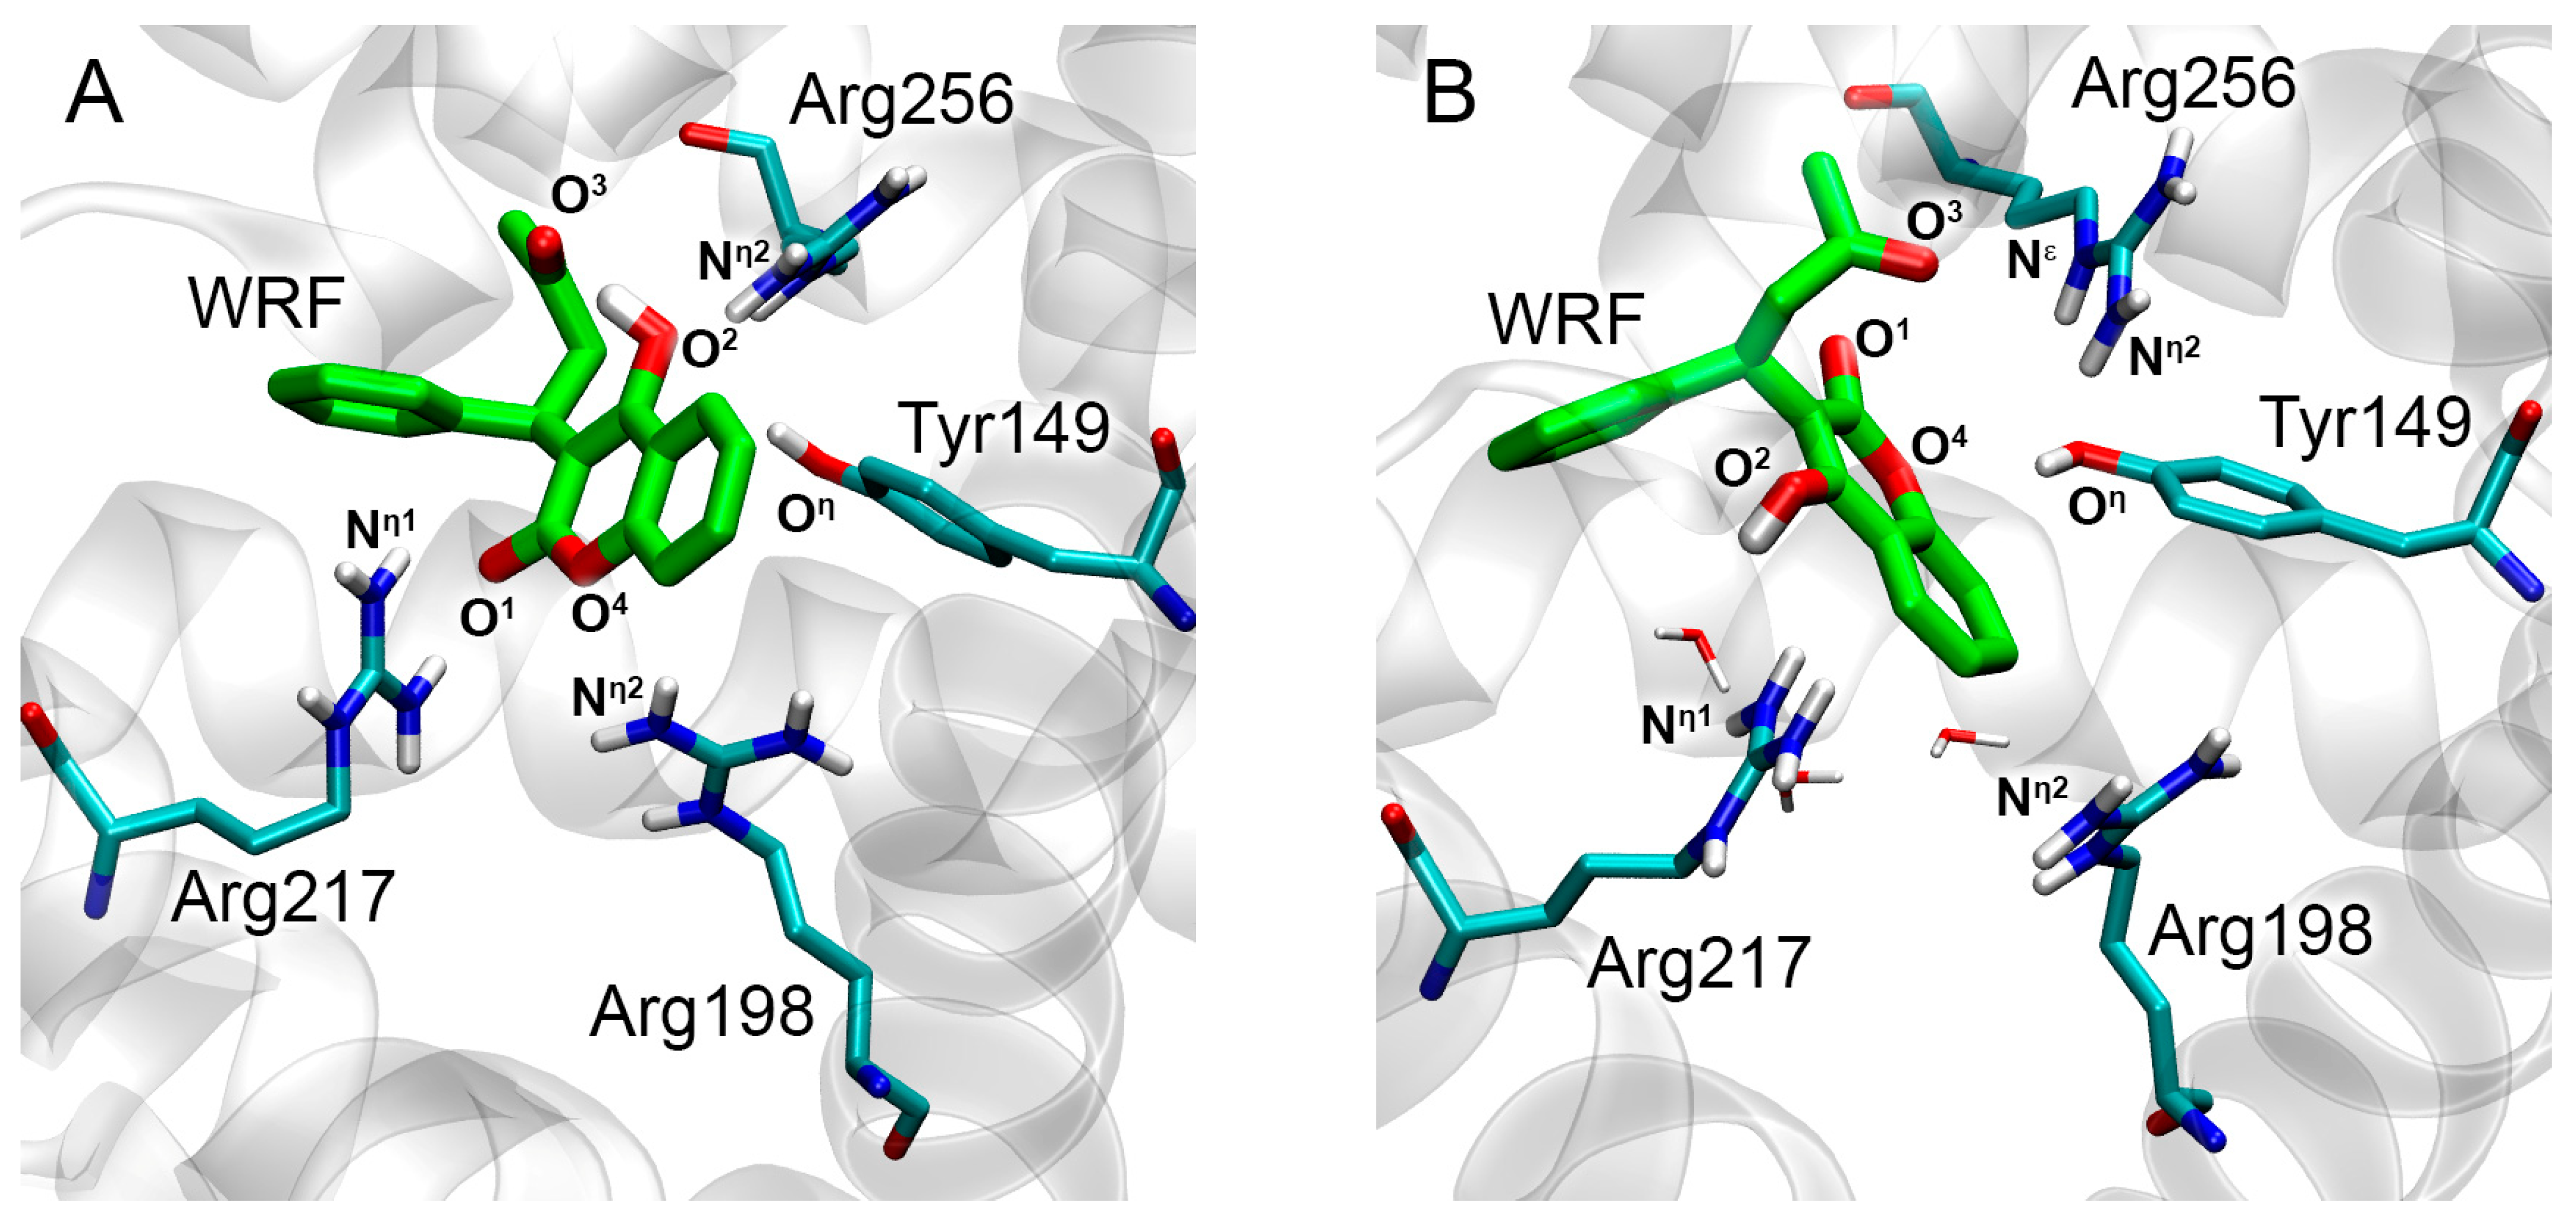
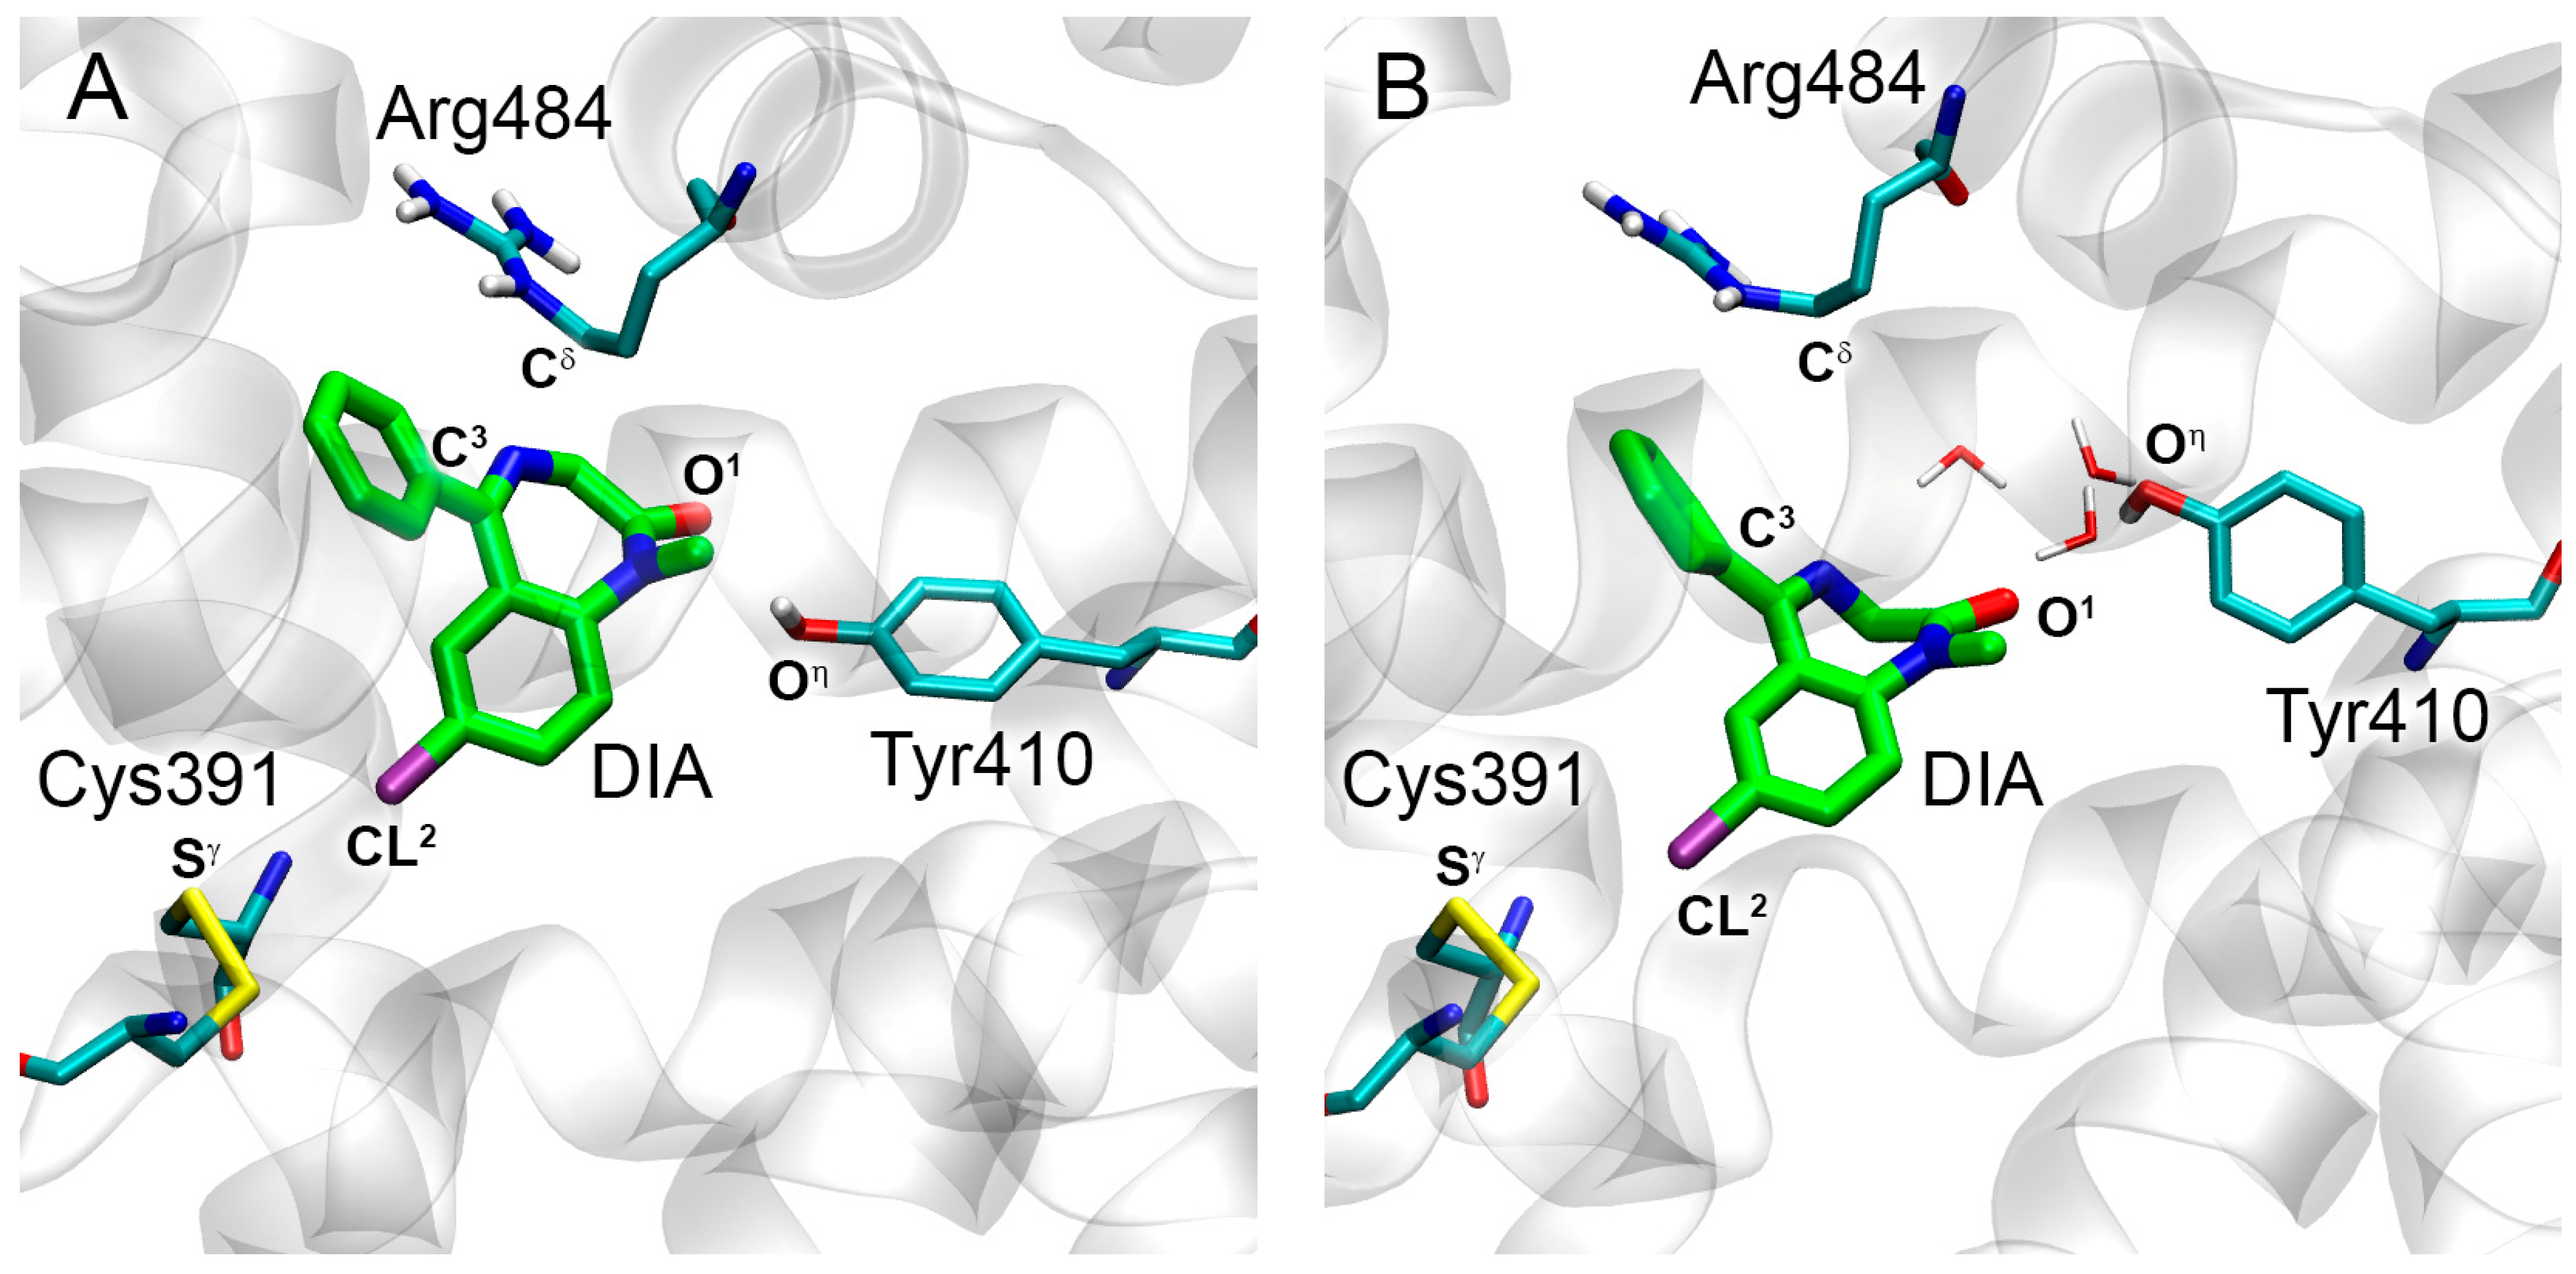
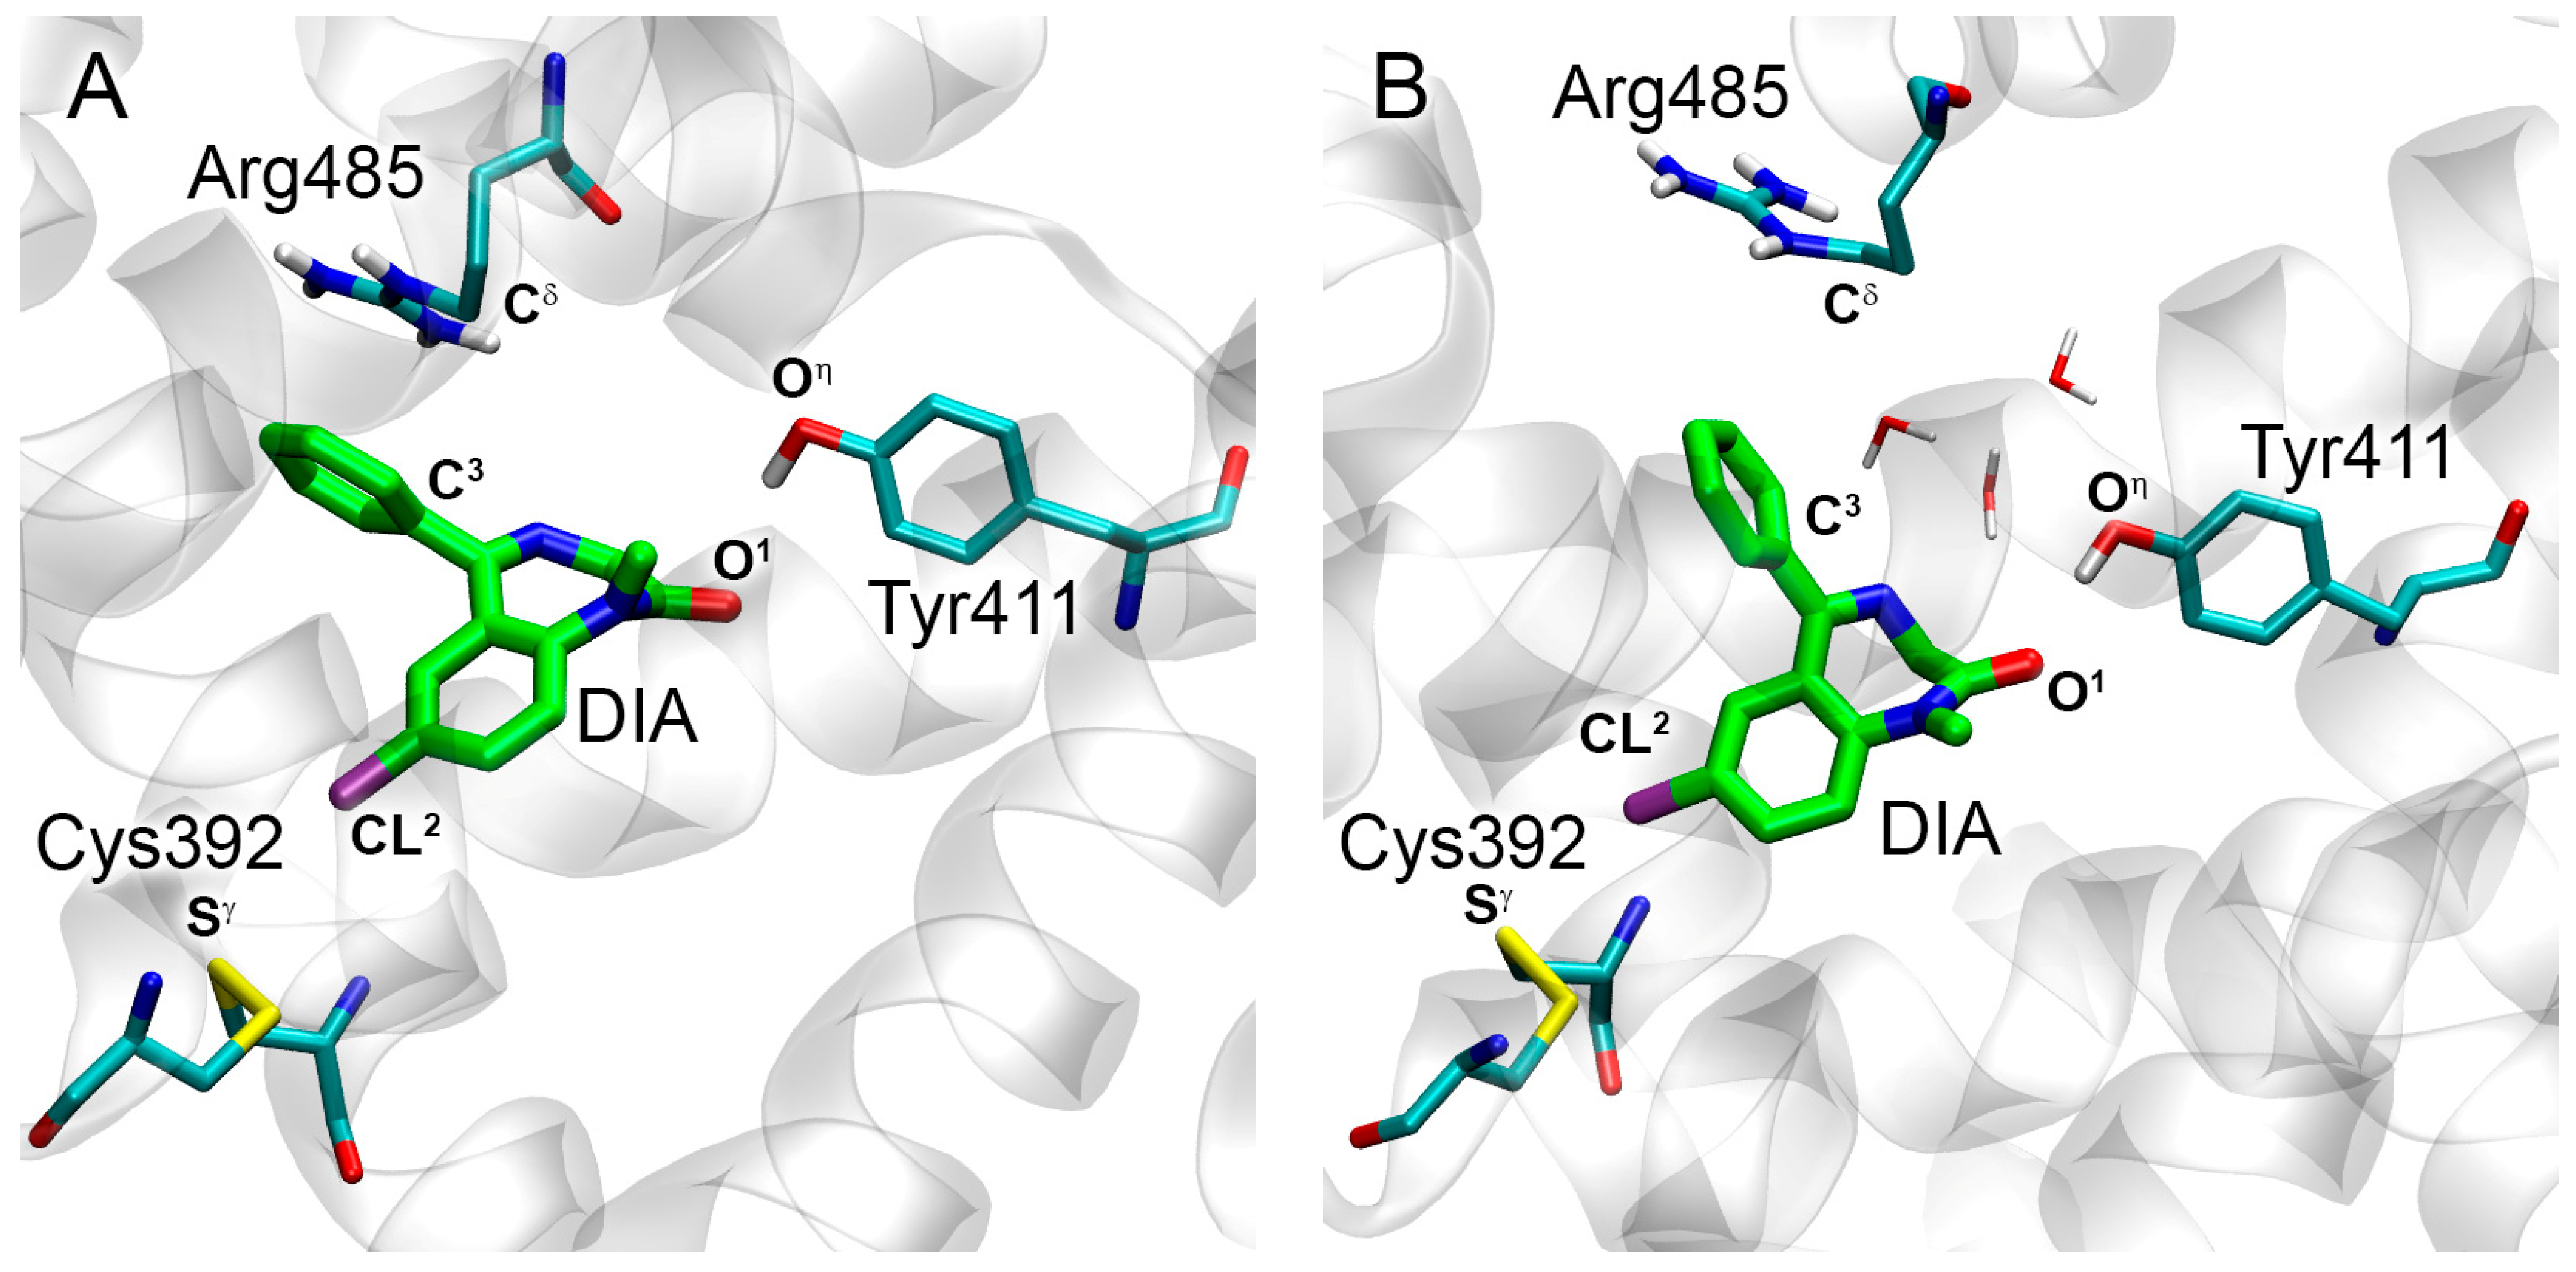
2.2.2. Interaction of WRF and DIA with BSA According to Molecular Modeling
2.3. Interaction of WRF and DIA with Rat Serum Albumin
2.3.1. Building the Three-Dimensional Model of RSA
2.3.2. Interaction of WRF and DIA with RSA According to Molecular Modeling
2.4. Effect of WRF and DIA on Albumin Esterase Activity Towards NPA According to NMR Spectroscopy
2.5. Effect of WRF and DIA on Albumin Esterase Activity Towards NPA According to Spectrophotometry
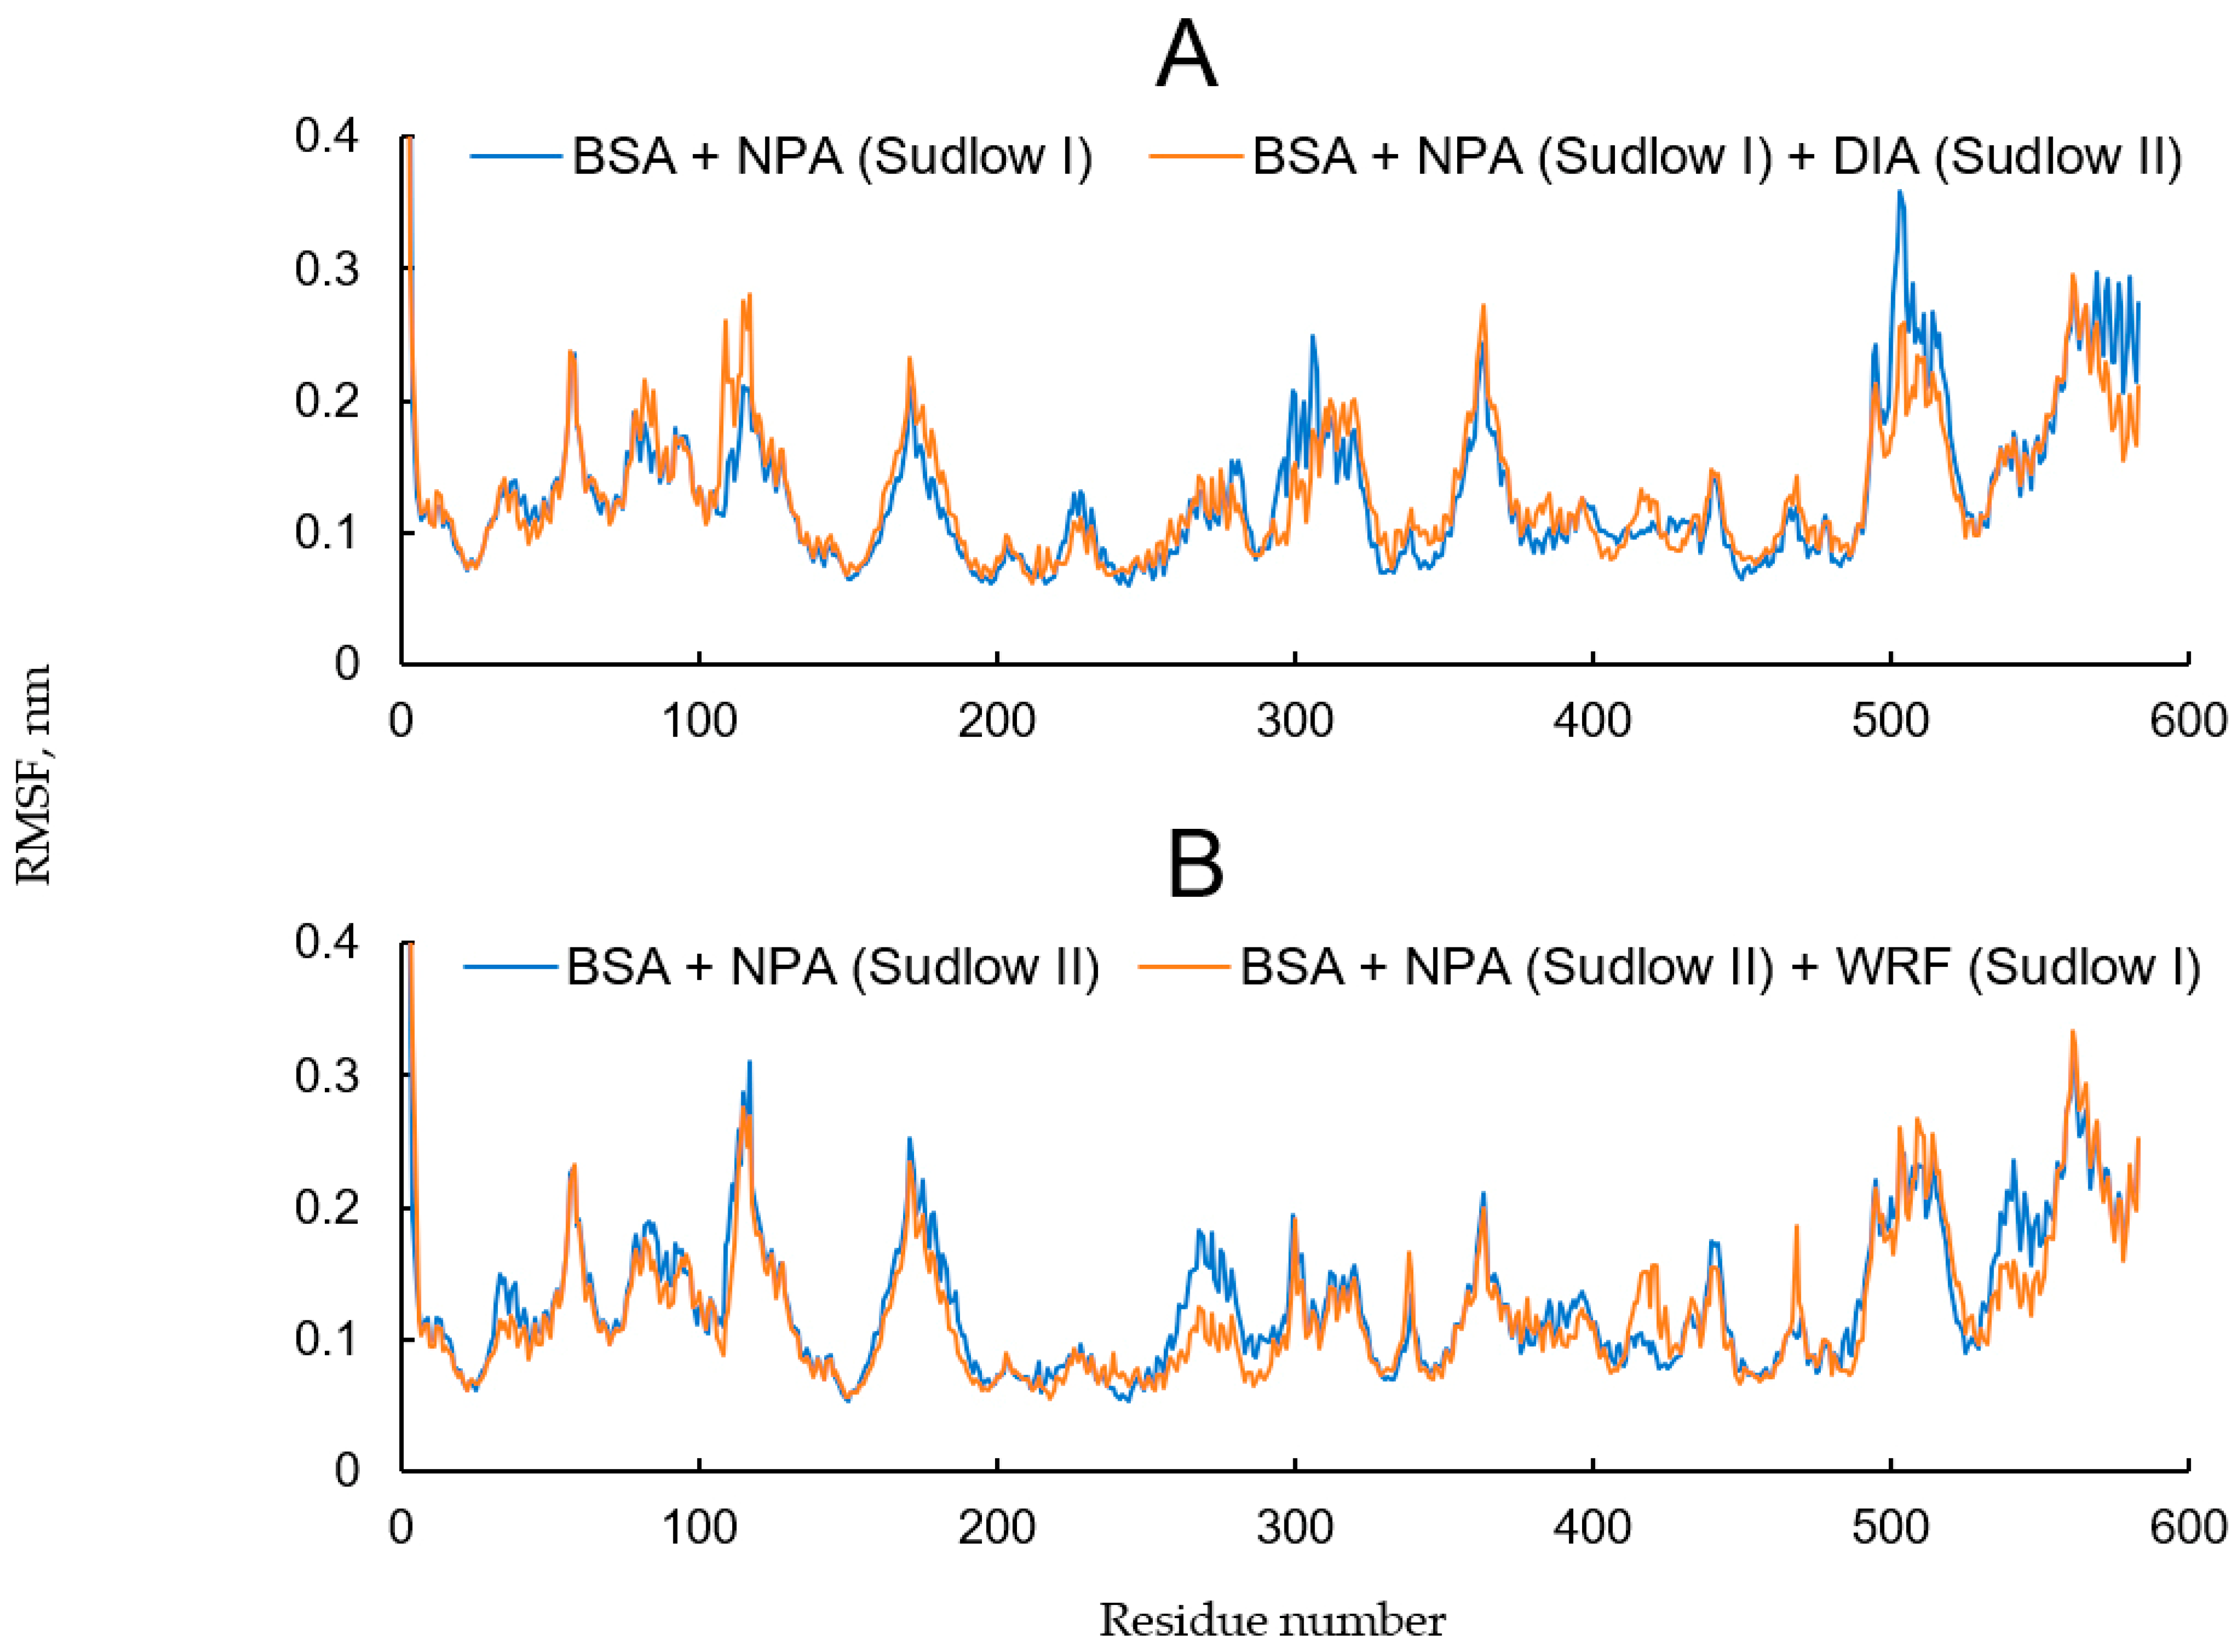
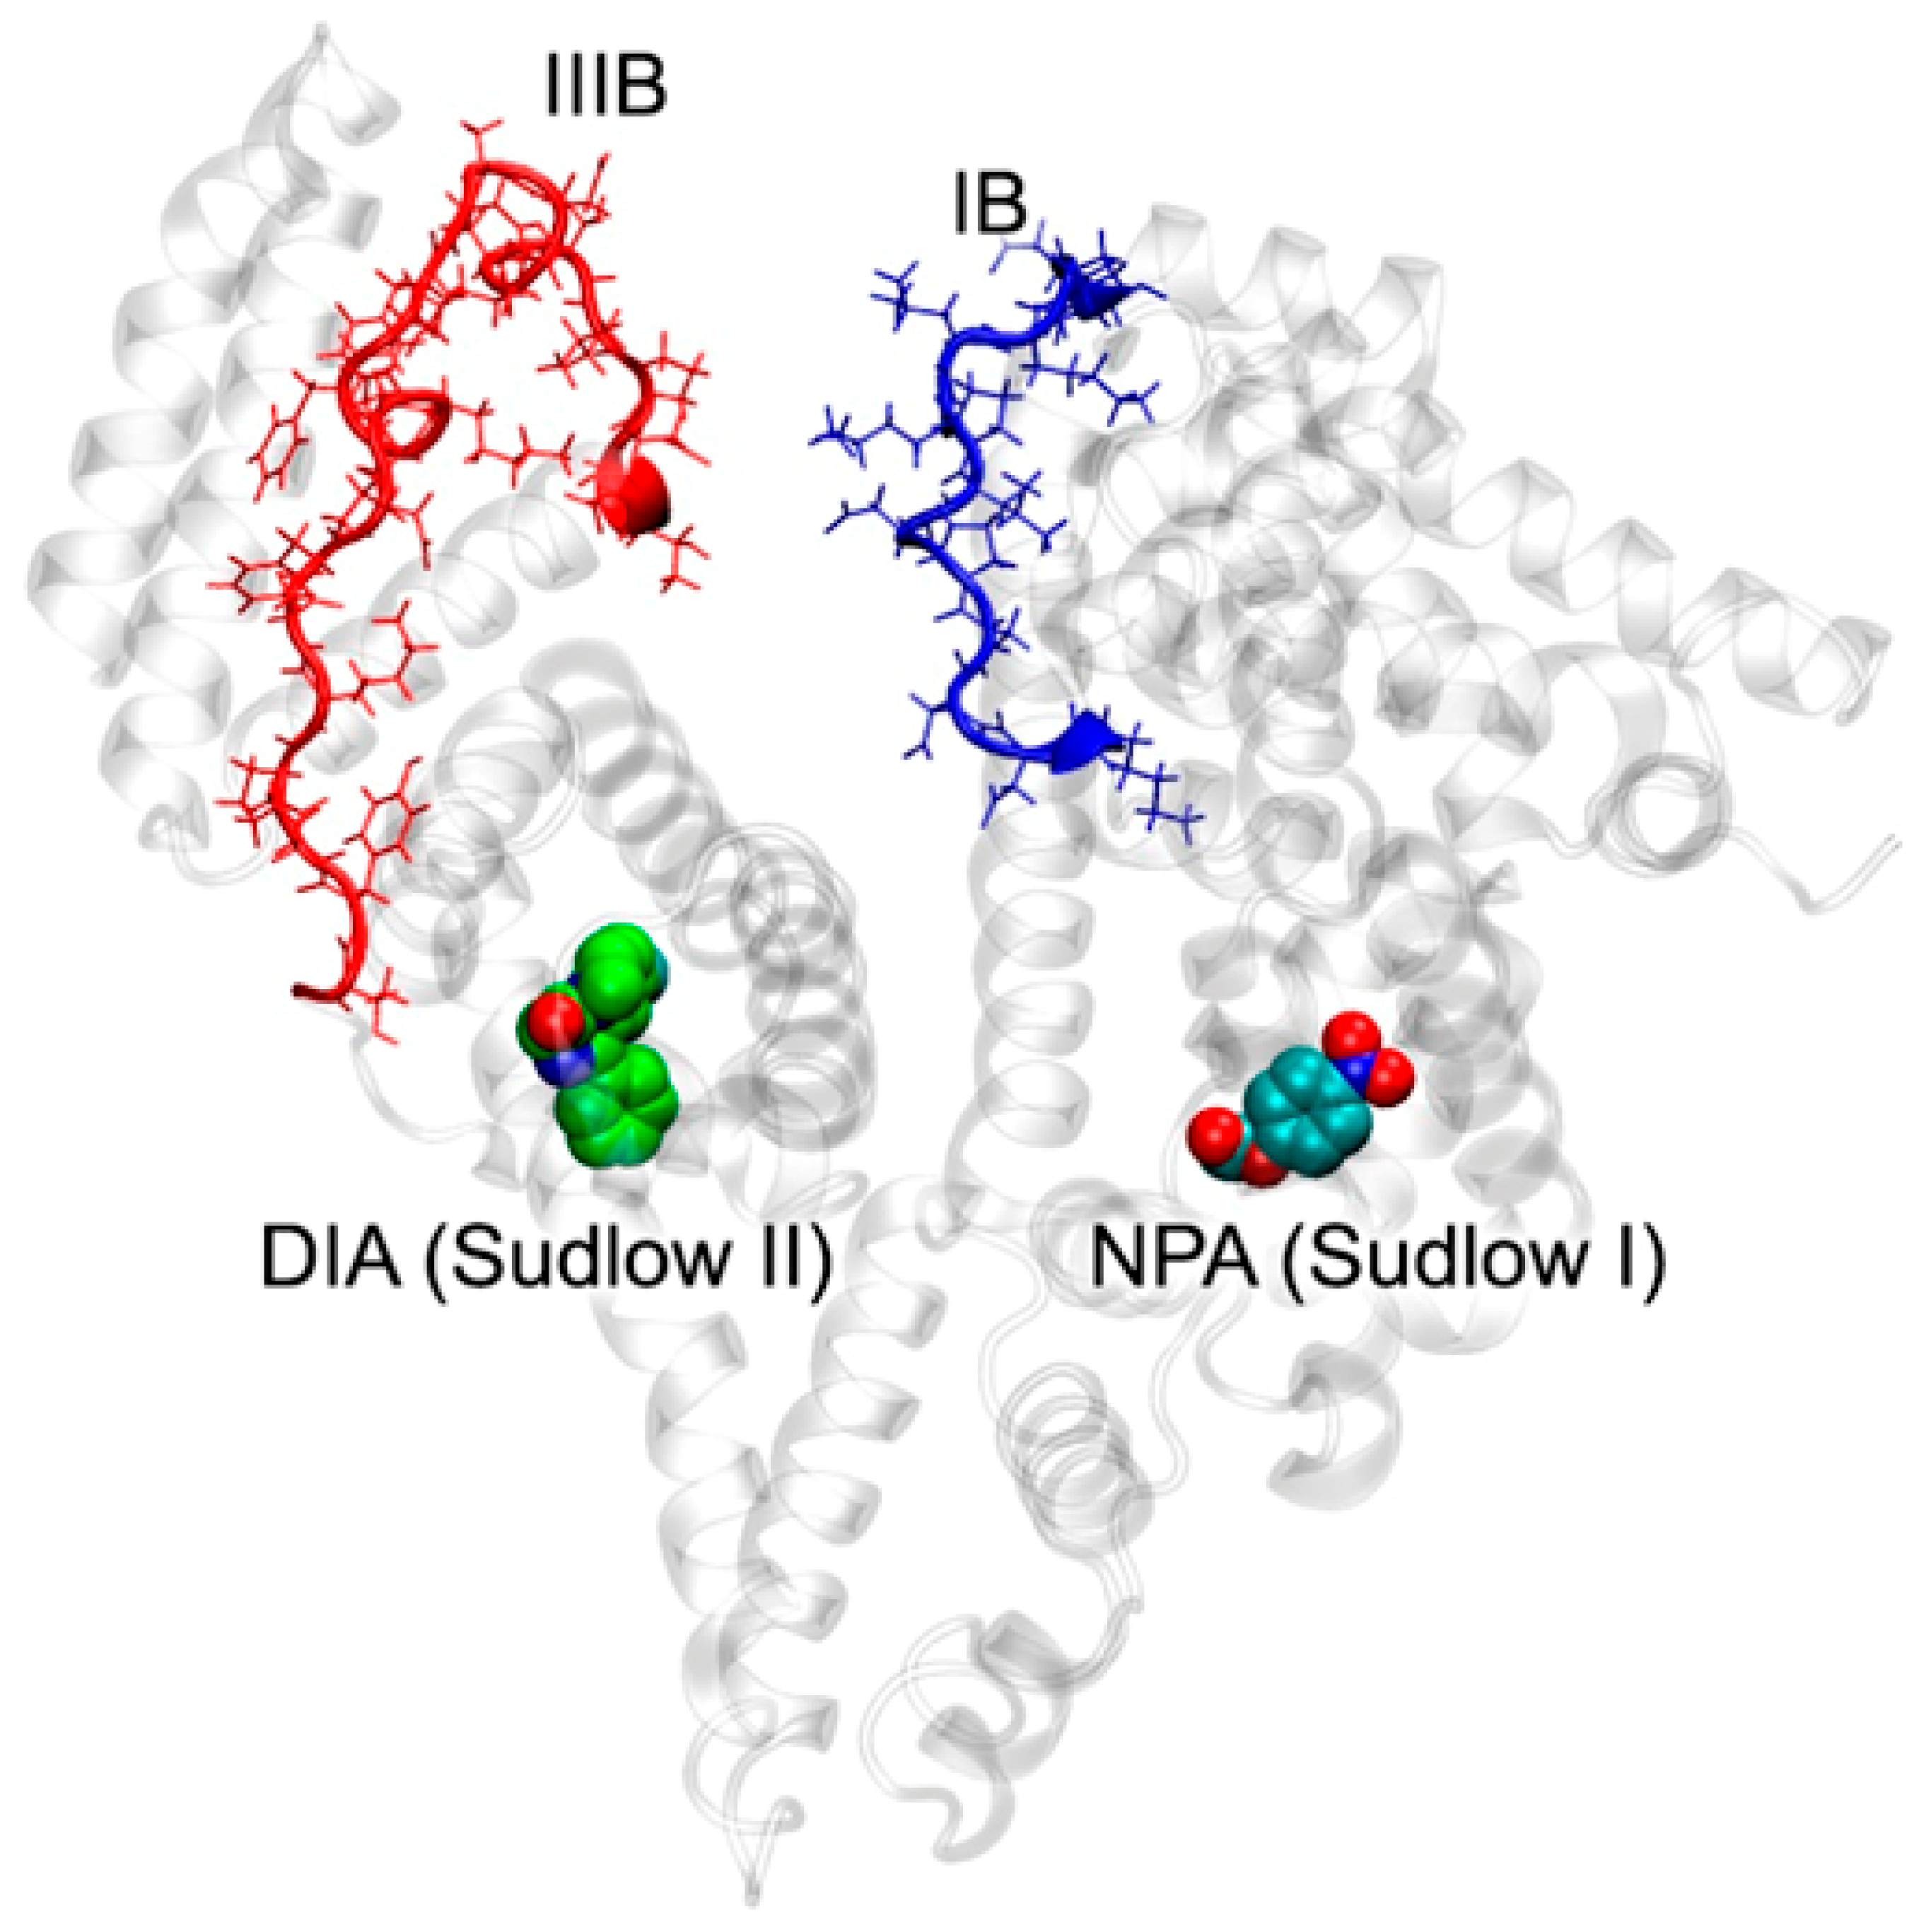
2.6. Effect of WRF and DIA on Albumin Esterase Activity Towards NPA According to Molecular Modeling
- -
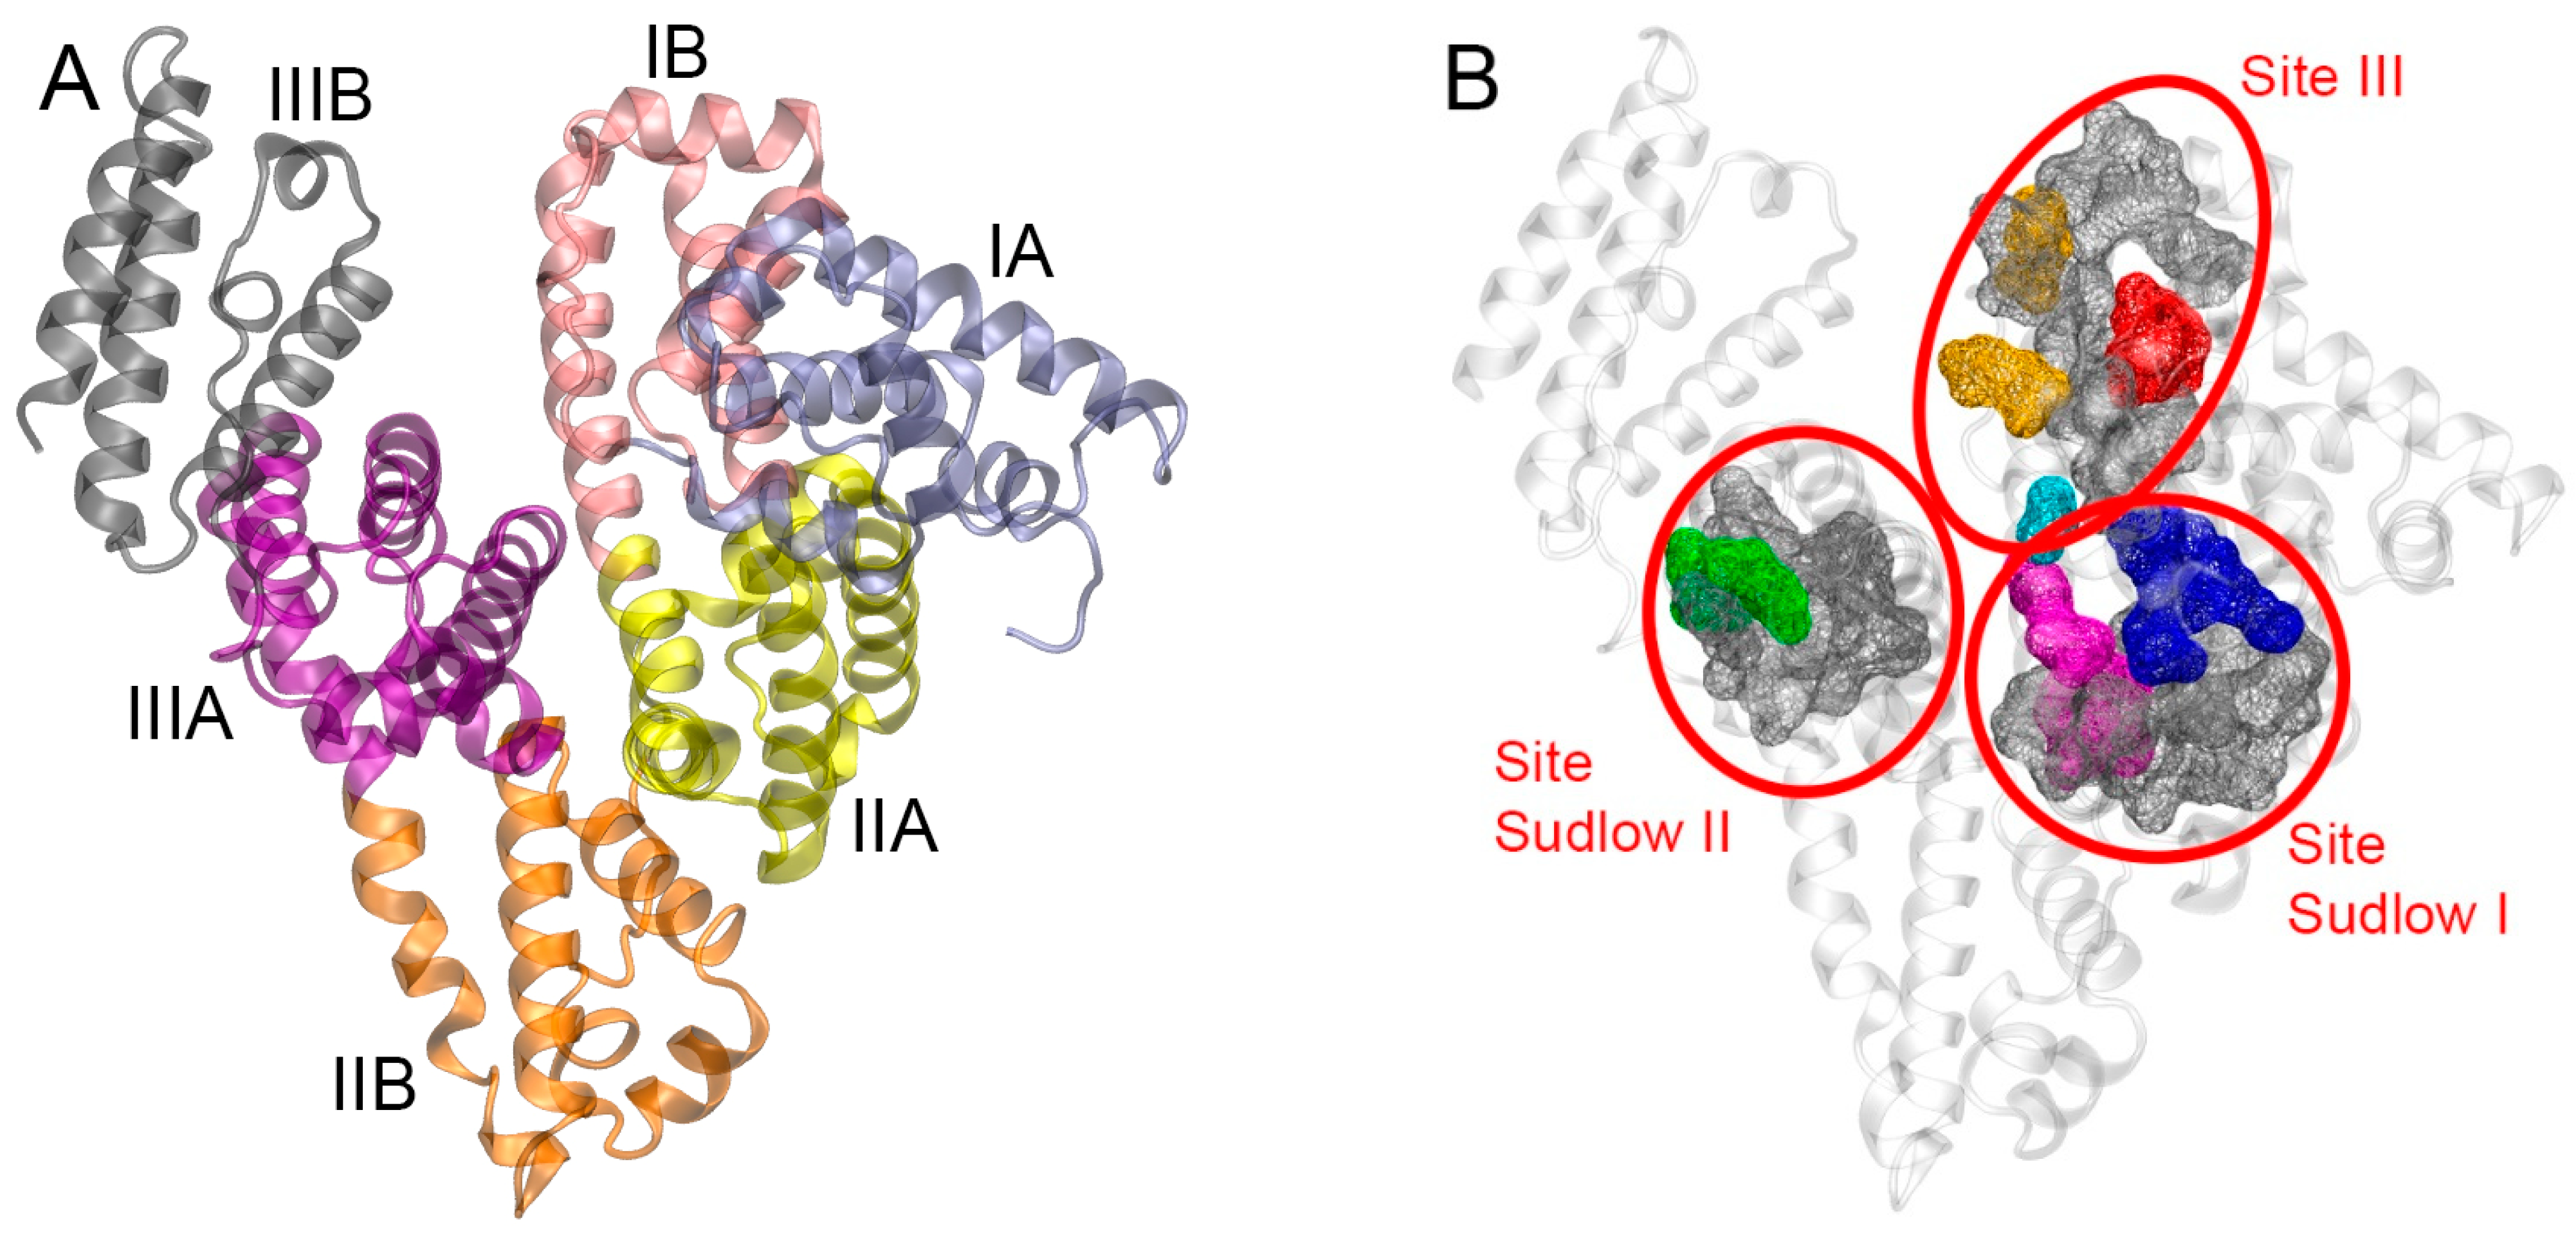
- Inhibitors are absent, NPA is bound in site Sudlow I (Figure S3A);
- -
- DIA is bound in site Sudlow II, NPA is bound in site Sudlow I (Figure S3B);
- -
- Inhibitors are absent, NPA is bound in site Sudlow II (Figure S3C);
- -
- WRF is bound in site Sudlow I, NPA is bound in site Sudlow II (Figure S3D).
3. Discussion
4. Methods
4.1. Chemicals
4.2. Spectrofluorometry
4.3. NMR Spectroscopy
4.4. Spectrophotometry
4.5. Molecular Modeling
4.5.1. Three-Dimensional Models Preparation
4.5.2. Molecular Docking
4.5.3. Molecular Dynamics
5. Conclusions
Supplementary Materials
Author Contributions
Funding
Institutional Review Board Statement
Informed Consent Statement
Data Availability Statement
Acknowledgments
Conflicts of Interest
Abbreviations
| 1H NMR | proton nuclear magnetic resonance |
| BChE | butyrylcholinesterase |
| BSA | bovine serum albumin |
| CES | carboxylesterase |
| DIA | diazepam |
| distC-O | the distance between the carboxyl carbon of NPA and the hydroxyl oxygen of catalytic tyrosine of albumin |
| DMSO | dimethyl sulfoxide |
| DMSO d6 | deuterated dimethyl sulfoxide |
| DOPE | discrete optimized protein energy |
| DSS | sodium trimethylsilylpropanesulfonate |
| HSA | human serum albumin |
| Irel | relative integral intensity |
| Irel0 | relative integral intensity of the range 1.86–1.81 ppm of the spectrum of pure BSA (for control measurements) and the spectrum of the BSA-inhibitor mixture without substrate (for measurements with WRF or DIA) |
| MD | molecular dynamics |
| NPA | p-nitrophenyl acetate |
| OPs | organophosphates |
| PBS | phosphate buffered-saline |
| PDB | protein data bank |
| PMFP | pinacolyl methylphosphonofluoridate |
| POX | paraoxon |
| RSA | rat serum albumin |
| WRF | warfarin |
References
- Belinskaia, D.A.; Voronina, P.A.; Shmurak, V.I.; Jenkins, R.O.; Goncharov, N.V. Serum Albumin in Health and Disease: Esterase, Antioxidant, Transporting and Signaling Properties. Int. J. Mol. Sci. 2021, 22, 10318. [Google Scholar] [CrossRef] [PubMed]
- Merlot, A.M.; Kalinowski, D.S.; Richardson, D.R. Unraveling the mysteries of serum albumin-more than just a serum protein. Front. Physiol. 2014, 5, 299. [Google Scholar] [CrossRef] [PubMed]
- He, X.M.; Carter, D.C. Atomic structure and chemistry of human serum albumin. Nature 1992, 358, 209–215. [Google Scholar] [CrossRef] [PubMed]
- Fasano, M.; Curry, S.; Terreno, E.; Galliano, M.; Fanali, G.; Narciso, P.; Notari, S.; Ascenzi, P. The extraordinary ligand binding properties of human serum albumin. IUBMB Life 2005, 57, 787–796. [Google Scholar] [CrossRef]
- Ghuman, J.; Zunszain, P.A.; Petitpas, I.; Bhattacharya, A.A.; Otagiri, M.; Curry, S. Structural basis of the drug-binding specificity of human serum albumin. J. Mol. Biol. 2005, 353, 38–52. [Google Scholar] [CrossRef]
- Zsila, F. Subdomain IB is the third major drug binding region of human serum albumin: Toward the three-sites model. Mol. Pharm. 2013, 10, 1668–1682. [Google Scholar] [CrossRef] [PubMed]
- Goncharov, N.V.; Belinskaya, D.A.; Razygraev, A.V.; Ukolov, A.I. On the enzymatic activity of albumin. Russ. J. Bioorgan. Chem. 2015, 41, 113–124. [Google Scholar] [CrossRef]
- Lockridge, O.; Xue, W.; Gaydess, A.; Grigoryan, H.; Ding, S.J.; Schopfer, L.M.; Hinrichs, S.H.; Masson, P. Pseudo-esterase activity of human albumin: Slow turnover on tyrosine 411 and stable acetylation of 82 residues including 59 lysines. J. Biol. Chem. 2008, 283, 22582–22590. [Google Scholar] [CrossRef]
- Belinskaia, D.A.; Goncharov, N.V. Theoretical and practical aspects of albumin esterase activity. Russ. J. Bioorg. Chem. 2020, 46, 287–298. [Google Scholar] [CrossRef]
- Tildon, J.T.; Ogilvie, J.W. The esterase activity of bovine mercaptalbumin. The reaction of the protein with p-nitrophenyl acetate. J. Biol. Chem. 1972, 247, 1265–1271. [Google Scholar] [CrossRef]
- Sogorb, M.A.; Vilanova, E. Enzymes involved in the detoxification of organophosphorus, carbamate and pyrethroid insecticides through hydrolysis. Toxicol. Lett. 2002, 128, 215–228. [Google Scholar] [CrossRef] [PubMed]
- Sogorb, M.A.; García-Argüelles, S.; Carrera, V.; Vilanova, E. Serum albumin is as efficient as paraxonase in the detoxication of paraoxon at toxicologically relevant concentrations. Chem. Res. Toxicol. 2008, 21, 1524–1529. [Google Scholar] [CrossRef] [PubMed]
- Sogorb, M.A.; Vilanova, E. Serum albumins and detoxication of anti-cholinesterase agents. Chem. Biol. Interact. 2010, 187, 325–329. [Google Scholar] [CrossRef] [PubMed]
- Belinskaia, D.A.; Voronina, P.A.; Vovk, M.A.; Shmurak, V.I.; Batalova, A.A.; Jenkins, R.O.; Goncharov, N.V. Esterase Activity of Serum Albumin Studied by 1H NMR Spectroscopy and Molecular Modelling. Int. J. Mol. Sci. 2021, 22, 10593. [Google Scholar] [CrossRef] [PubMed]
- Shoemaker, S.C.; Ando, N. X-rays in the Cryo-Electron Microscopy Era: Structural Biology’s Dynamic Future. Biochemistry 2018, 57, 277–285. [Google Scholar] [CrossRef]
- Yip, K.M.; Fischer, N.; Paknia, E.; Chari, A.; Stark, H. Atomic-resolution protein structure determination by cryo-EM. Nature 2020, 587, 157–161. [Google Scholar] [CrossRef]
- Zimmermann, M.O.; Lange, A.; Wilcken, R.; Cieslik, M.B.; Exner, T.E.; Joerger, A.C.; Koch, P.; Boeckler, F.M. Halogen-enriched fragment libraries as chemical probes for harnessing halogen bonding in fragment-based lead discovery. Future Med. Chem. 2014, 6, 617–639. [Google Scholar] [CrossRef]
- Parisini, E.; Metrangolo, P.; Pilati, T.; Resnati, G.; Terraneo, G. Halogen bonding in halocarbon-protein complexes: A structural survey. Chem. Soc. Rev. 2011, 40, 2267–2278. [Google Scholar] [CrossRef]
- Antoni, G.; Casagli, M.C.; Bigio, M.; Borri, G.; Neri, P. Different interactions of human and bovine serum albumin with Cibacron Blue and Blue Dextran. Ital. J. Biochem. 1982, 31, 100–106. [Google Scholar]
- Fonda, M.L.; Trauss, C.; Guempel, U.M. The binding of pyridoxal 5’-phosphate to human serum albumin. Arch. Biochem. Biophys. 1991, 288, 79–86. [Google Scholar] [CrossRef]
- Kohita, H.; Matsushita, Y.; Moriguchi, I. Binding of carprofen to human and bovine serum albumins. Chem. Pharm. Bull. 1994, 42, 937–940. [Google Scholar] [CrossRef] [PubMed]
- Silva, D.; Cortez, C.M.; Cunha-Bastos, J.; Louro, S.R. Methyl parathion interaction with human and bovine serum albumin. Toxicol. Lett. 2004, 147, 53–61. [Google Scholar] [CrossRef] [PubMed]
- Mohammadi, F.; Bordbar, A.K.; Divsalar, A.; Mohammadi, K.; Saboury, A.A. Analysis of binding interaction of curcumin and diacetylcurcumin with human and bovine serum albumin using fluorescence and circular dichroism spectroscopy. Protein J. 2009, 28, 189–196. [Google Scholar] [CrossRef]
- Manivel, P.; Marimuthu, P.; Ilanchelian, M. Deciphering the binding site and mechanism of new methylene blue with serum albumins: A multispectroscopic and computational investigation. Spectrochim. Acta A Mol. Biomol. Spectrosc. 2023, 300, 122900. [Google Scholar] [CrossRef]
- Bujacz, A. Structures of bovine, equine and leporine serum albumin. Acta Crystallogr. D Biol. Crystallogr. 2012, 68 Pt 10, 1278–1289. [Google Scholar] [CrossRef]
- Sekula, B.; Zielinski, K.; Bujacz, A. Crystallographic studies of the complexes of bovine and equine serum albumin with 3,5-diiodosalicylic acid. Int. J. Biol. Macromol. 2013, 60, 316–324. [Google Scholar] [CrossRef]
- Bujacz, A.; Zielinski, K.; Sekula, B. Structural studies of bovine, equine, and leporine serum albumin complexes with naproxen. Proteins 2014, 82, 2199–2208. [Google Scholar] [CrossRef] [PubMed]
- Castagna, R.; Donini, S.; Colnago, P.; Serafini, A.; Parisini, E.; Bertarelli, C. Biohybrid Electrospun Membrane for the Filtration of Ketoprofen Drug from Water. ACS Omega 2019, 4, 13270–13278. [Google Scholar] [CrossRef]
- Kragh-Hansen, U. Molecular aspects of ligand binding to serum albumin. Pharmacol. Rev. 1981, 33, 17–53. [Google Scholar]
- Goncharov, N.V.; Belinskaia, D.A.; Shmurak, V.I. Probing of albumin esterase activity modulators as components of therapy for acute organophosphate poisoning. AIP Conf. Proc. 2022, 2390, 030026. [Google Scholar] [CrossRef]
- Li, Q.; Yang, W.Y.; Qu, L.L.; Qi, H.Y.; Huang, Y.; Zhang, Z. Interaction of Warfarin with Human Serum Albumin and Effect of Ferulic Acid on the Binding. J. Spectrosc. 2014, 2014, 8345501. [Google Scholar] [CrossRef]
- Lou, Y.Y.; Zhou, K.L.; Pan, D.Q.; Shen, J.L.; Shi, J.H. Spectroscopic and molecular docking approaches for investigating conformation and binding characteristics of clonazepam with bovine serum albumin (BSA). J. Photochem. Photobiol. B. 2017, 167, 158–167. [Google Scholar] [CrossRef] [PubMed]
- Poór, M.; Li, Y.; Matisz, G.; Kiss, L.; Kunsági-Máté, S.; Kőszegi, T. Quantitation of species differences in albumin–ligand interactions for bovine, human and rat serum albumins using fluorescence spectroscopy: A test case with some Sudlow’s site I ligands. J. Lumin. 2014, 145, 767–773. [Google Scholar] [CrossRef]
- Bar-Or, D.; Bar-Or, R.; Rael, L.T.; Gardner, D.K.; Slone, D.S.; Craun, M.L. Heterogeneity and oxidation status of commercial human albumin preparations in clinical use. Crit. Care Med. 2005, 33, 1638–1641. [Google Scholar] [CrossRef]
- Takahashi, T.; Terada, T.; Arikawa, H.; Kizaki, K.; Terawaki, H.; Imai, H.; Itoh, Y.; Era, S. Quantitation of Oxidative Modifications of Commercial Human Albumin for Clinical Use. Biol. Pharm. Bull. 2016, 39, 401–408. [Google Scholar] [CrossRef]
- Nakae, H.; Tomida, K.; Kikuya, Y.; Okuyama, M.; Igarashi, T. Comparison of quality of human serum albumin preparations in two pharmaceutical products. Acute Med. Surg. 2017, 4, 251–254. [Google Scholar] [CrossRef] [PubMed]
- Nagumo, K.; Tanaka, M.; Chuang, V.T.; Setoyama, H.; Watanabe, H.; Yamada, N.; Kubota, K.; Tanaka, M.; Matsushita, K.; Yoshida, A.; et al. Cys34-cysteinylated human serum albumin is a sensitive plasma marker in oxidative stress-related chronic diseases. PLoS ONE 2014, 9, e85216. [Google Scholar] [CrossRef]
- Smith, J.R.; Bolton, E.R.; Dwinell, M.R. The Rat: A Model Used in Biomedical Research. Methods Mol. Biol. 2019, 2018, 1–41. [Google Scholar] [CrossRef]
- Goncharov, N.V.; Terpilowski, M.A.; Shmurak, V.I.; Belinskaia, D.A.; Avdonin, P.V. The Rat (Rattus norvegicus) as a Model Object for Acute Organophosphate Poisoning. 1. Biochemical Aspects. J. Evol. Biochem. Physiol. 2019, 55, 112–123. [Google Scholar] [CrossRef]
- Goncharov, N.V.; Terpilowski, M.A.; Kudryavtsev, I.V.; Serebryakova, M.K.; Belinskaia, D.A.; Sobolev, V.E.; Shmurak, V.I.; Korf, E.A.; Avdonin, P.V. The Rat (Rattus norvegicus) as a Model Object for Acute Organophosphate Poisoning. 2. A System Analysis of the Efficacy of Green Tea Extract in Preventing Delayed Effects of Poisoning. J. Evol. Biochem. Physiol. 2019, 55, 208–221. [Google Scholar] [CrossRef]
- Mukherjee, P.; Roy, S.; Ghosh, D.; Nandi, S.K. Role of animal models in biomedical research: A review. Lab. Anim. Res. 2022, 38, 18. [Google Scholar] [CrossRef] [PubMed]
- Han, X.; Snow, T.A.; Kemper, R.A.; Jepson, G.W. Binding of perfluorooctanoic acid to rat and human plasma proteins. Chem. Res. Toxicol. 2003, 16, 775–781. [Google Scholar] [CrossRef] [PubMed]
- Goncharov, N.V.; Terpilovskii, M.A.; Belinskaya, D.A.; Shmurak, V.I.; Avdonin, P.V. Comparative analysis of esterase and paraoxonase activities of different serum albumin species. J. Evol. Biochem. Physiol. 2017, 53, 271–281. [Google Scholar] [CrossRef]
- Aubry, A.F.; Markoglou, N.; McGann, A. Comparison of drug binding interactions on human, rat and rabbit serum albumin using high-performance displacement chromatography. Comp. Biochem. Physiol. C Pharmacol. Toxicol. Endocrinol. 1995, 112, 257–266. [Google Scholar] [CrossRef]
- Frandsen, P.C.; Brodersen, R. Bilirubin/rat serum albumin interaction. Acta Chem. Scand. B 1986, 40, 55–59. [Google Scholar] [CrossRef]
- Vyas, V.K.; Ukawala, R.D.; Ghate, M.; Chintha, C. Homology Modeling: A Fast Tool for Drug Discovery: Current Perspectives. Indian J. Pharm. Sci. 2012, 74, 1–17. [Google Scholar] [CrossRef]
- Taborskaya, K.I.; Belinskaya, D.A.; Goncharov, N.V.; Avdonin, P.V. Building a three-dimensional model of rat albumin molecule by homology modeling. J. Evol. Biochem. Physiol. 2017, 53, 384–393. [Google Scholar] [CrossRef]
- Webb, B.; Sali, A. Comparative Protein Structure Modeling Using MODELLER. Curr. Protoc. Bioinformatics 2016, 54, 5.6.1–5.6.37. [Google Scholar] [CrossRef]
- Sali, A.; Blundell, T.L. Comparative protein modelling by satisfaction of spatial restraints. J. Mol. Biol. 1993, 234, 779–815. [Google Scholar] [CrossRef]
- Shen, M.Y.; Sali, A. Statistical potential for assessment and prediction of protein structures. Protein Sci. 2006, 15, 2507–2524. [Google Scholar] [CrossRef]
- Williams, C.J.; Headd, J.J.; Moriarty, N.W.; Prisant, M.G.; Videau, L.L.; Deis, L.N.; Verma, V.; Keedy, D.A.; Hintze, B.J.; Chen, V.B.; et al. MolProbity: More and better reference data for improved all-atom structure validation. Protein Sci. 2018, 27, 293–315. [Google Scholar] [CrossRef] [PubMed]
- Varadi, M.; Bertoni, D.; Magana, P.; Paramval, U.; Pidruchna, I.; Radhakrishnan, M.; Tsenkov, M.; Nair, S.; Mirdita, M.; Yeo, J.; et al. AlphaFold Protein Structure Database in 2024: Providing structure coverage for over 214 million protein sequences. Nucleic Acids Res. 2024, 52, D368–D375. [Google Scholar] [CrossRef] [PubMed]
- Schrödinger, L.; DeLano, W. PyMOL. Volume 2020. 2023. Available online: http://www.pymol.org/pymol (accessed on 8 October 2024).
- Belinskaia, D.A.; Voronina, P.A.; Popova, P.I.; Voitenko, N.G.; Shmurak, V.I.; Vovk, M.A.; Baranova, T.I.; Batalova, A.A.; Korf, E.A.; Avdonin, P.V.; et al. Albumin Is a Component of the Esterase Status of Human Blood Plasma. Int. J. Mol. Sci. 2023, 24, 10383. [Google Scholar] [CrossRef]
- Ellis, R.J.; Minton, A.P. Cell biology: Join the crowd. Nature 2003, 425, 27–28. [Google Scholar] [CrossRef]
- Kuznetsova, I.M.; Turoverov, K.K.; Uversky, V.N. What macromolecular crowding can do to a protein. Int. J. Mol. Sci. 2014, 15, 23090–23140. [Google Scholar] [CrossRef] [PubMed]
- Hirai, M.; Ajito, S.; Sugiyama, M.; Iwase, H.; Takata, S.; Shimizu, N.; Igarashi, N.; Martel, A.; Porcar, L. Macromolecular crowding effect on protein structure and hydration clarified by using X-ray and neutron scattering. Phys. B Condens. Matter 2018, 551, 212–217. [Google Scholar] [CrossRef]
- Antifeeva, Y.A.; Povarova, O.I.; Rodina, N.P.; Sulatsky, M.I.; Karasev, M.M.; Kuznetsova, I.M.; Turoverov, K.K. Effect of molecular crowding on prothymosin alfa structure. Tsitologiya 2018, 60, 856–859. (In Russian) [Google Scholar] [CrossRef]
- Chebotareva, N.A. Effect of molecular crowding on the enzymes of glycogenolysis. Biochemistry 2007, 72, 1478–1490. [Google Scholar] [CrossRef]
- Pozdnyakova, I.; Wittung-Stafshede, P. Non-linear effects of macromolecular crowding on enzymatic activity of multi-copper oxidase. Biochim. Biophys. Acta 2010, 1804, 740–744. [Google Scholar] [CrossRef]
- Hou, S.; Trochimczyk, P.; Sun, L.; Wisniewska, A.; Kalwarczyk, T.; Zhang, X.; Wielgus-Kutrowska, B.; Bzowska, A.; Holyst, R. How can macromolecular crowding inhibit biological reactions? The enhanced formation of DNA nanoparticles. Sci. Rep. 2016, 6, 22033. [Google Scholar] [CrossRef]
- Lamy, H.; Bullier-Marchandin, E.; Pointel, C.; Echalard, A.; Ladam, G.D.; Lutzweiler, G. Kinetic Study of the Esterase-like Activity of Albumin following Condensation by Macromolecular Crowding. Biomacromolecules 2024, 25, 2803–2813. [Google Scholar] [CrossRef] [PubMed]
- Zainal Abidin, M.H.; Abd Halim, K.B.; Huyop, F.; Tengku Abdul Hamid, T.H.; Abdul Wahab, R.; Abdul Hamid, A.A. The mechanistic role of active site residues in non-stereo haloacid dehalogenase E (DehE). J. Mol. Graph. Model. 2019, 90, 219–225. [Google Scholar] [CrossRef] [PubMed]
- Brown, N.A.; Müller, W.E. Binding of coumarin anticoagulants to human and bovine serum albumin. Circular dichroism studies. Pharmacology 1978, 17, 233–238. [Google Scholar] [CrossRef]
- Ràfols, C.; Amézqueta, S.; Fuguet, E.; Bosch, E. Molecular interactions between warfarin and human (HSA) or bovine (BSA) serum albumin evaluated by isothermal titration calorimetry (ITC), fluorescence spectrometry (FS) and frontal analysis capillary electrophoresis (FA/CE). J. Pharm. Biomed. Anal. 2018, 150, 452–459. [Google Scholar] [CrossRef]
- Pistolozzi, M.; Bertucci, C. Species-dependent stereoselective drug binding to albumin: A circular dichroism study. Chirality 2008, 20, 552–558. [Google Scholar] [CrossRef]
- Loun, B.; Hage, D.S. Chiral separation mechanisms in protein-based HPLC columns. 1. Thermodynamic studies of (R)- and (S)-warfarin binding to immobilized human serum albumin. Anal. Chem. 1994, 66, 3814–3822. [Google Scholar] [CrossRef] [PubMed]
- Petitpas, I.; Bhattacharya, A.A.; Twine, S.; East, M.; Curry, S. Crystal structure analysis of warfarin binding to human serum albumin: Anatomy of drug site I. J. Biol. Chem. 2001, 276, 22804–22809. [Google Scholar] [CrossRef] [PubMed]
- Paar, M.; Fengler, V.H.; Rosenberg, D.J.; Krebs, A.; Stauber, R.E.; Oettl, K.; Hammel, M. Albumin in patients with liver disease shows an altered conformation. Commun. Biol. 2021, 4, 731. [Google Scholar] [CrossRef] [PubMed]
- Fujiwara, S.; Amisaki, T. Molecular dynamics study of conformational changes in human serum albumin by binding of fatty acids. Proteins 2006, 64, 730–739. [Google Scholar] [CrossRef]
- Ketrat, S.; Japrung, D.; Pongprayoon, P. Exploring how structural and dynamic properties of bovine and canine serum albumins differ from human serum albumin. J. Mol. Graph. Model. 2020, 98, 107601. [Google Scholar] [CrossRef]
- Eaton, J.D.; Williamson, M.P. Multi-site binding of epigallocatechin gallate to human serum albumin measured by NMR and isothermal titration calorimetry. Biosci Rep. 2017, 37, BSR20170209. [Google Scholar] [CrossRef] [PubMed]
- Goncharov, N.V.; Belinskaia, M.A.; Shmurak, V.I.; Terpilowski, M.A.; Jenkins, R.O.; Avdonin, P.V. Serum Albumin Binding and Esterase Activity: Mechanistic Interactions with Organophosphates. Molecules 2017, 22, 1201. [Google Scholar] [CrossRef] [PubMed]
- Belinskaia, D.A.; Koryagina, N.L.; Goncharov, N.V.; Savelieva, E.I. Structure-Dependent Mechanism of Organophosphate Release from Albumin and Butyrylcholinesterase Adducts When Exposed to Fluoride Ion: A Comprehensive In Silico Study. Int. J. Mol. Sci. 2023, 24, 14819. [Google Scholar] [CrossRef] [PubMed]
- Belinskaia, D.A.; Taborskaya, K.I.; Avdonin, P.V.; Goncharov, N.V. Modulation of the albumin–paraoxon interaction sites by fatty acids: Analysis by the molecular modeling methods. Russ. J. Bioorgan. Chem. 2017, 43, 359–367. [Google Scholar] [CrossRef]
- Belinskaia, D.A.; Terpilovskii, M.A.; Batalova, A.A.; Goncharov, N.V. Effect of Cys34 oxidation state of albumin on its interaction with paraoxon according to molecular modeling data. Russ. J. Bioorgan. Chem. 2019, 45, 535–544. [Google Scholar] [CrossRef]
- Belinskaia, D.A.; Batalova, A.A.; Goncharov, N.V. The Effect of Resveratrol on Binding and Esterase Activity of Human and Rat Albumin. J. Evol. Biochem. Physiol. 2019, 55, 174–183. [Google Scholar] [CrossRef]
- Belinskaia, D.A.; Batalova, A.A.; Goncharov, N.V. Effect of Bovine Serum Albumin Redox Status on Its Interaction with Paraoxon as Determined by Molecular Modeling. J. Evol. Biochem. Physiol. 2020, 56, 434–438. [Google Scholar] [CrossRef]
- Zunszain, P.A.; Ghuman, J.; Komatsu, T.; Tsuchida, E.; Curry, S. Crystal structural analysis of human serum albumin complexed with hemin and fatty acid. BMC Struct. Biol. 2003, 3, 6. [Google Scholar] [CrossRef]
- Aguilar, J.A.; Nilsson, M.; Bodenhausen, G.; Morris, G.A. Spin echo NMR spectra without J modulation. Chem. Commun. 2012, 48, 811–813. [Google Scholar] [CrossRef]
- Berman, H.M.; Westbrook, J.; Feng, Z.; Gilliland, G.; Bhat, T.N.; Weissig, H.; Shindyalov, I.N.; Bourne, P.E. The Protein Data Bank. Nucleic Acids Res. 2000, 28, 235–242. [Google Scholar] [CrossRef]
- Humphrey, W.; Dalke, A.; Schulten, K. VMD: Visual molecular dynamics. J. Mol. Graph. 1996, 14, 33–38. [Google Scholar] [CrossRef] [PubMed]
- Hanwell, M.D.; Curtis, D.E.; Lonie, D.C.; Vandermeersch, T.; Zurek, E.; Hutchison, G.R. Avogadro: An advanced semantic chemical editor, visualization, and analysis platform. J. Cheminform. 2012, 4, 17. [Google Scholar] [CrossRef] [PubMed]
- Eberhardt, J.; Santos-Martins, D.; Tillack, A.F.; Forli, S. AutoDock Vina 1.2.0: New Docking Methods, Expanded Force Field, and Python Bindings. J. Chem. Inf. Model. 2021, 61, 3891–3898. [Google Scholar] [CrossRef]
- Abraham, M.J.; Murtola, T.; Schulz, R.; Páll, S.; Smith, J.C.; Hess, B.; Lindahl, E. GROMACS: High performance molecular simulations through multi-level parallelism from laptops to supercomputers. SoftwareX 2015, 1–2, 19–25. [Google Scholar] [CrossRef]
- Foloppe, N.; MacKerell, A.D., Jr. All-atom empirical force field for nucleic acids: I. Parameter optimization based on small molecule and condensed phase macromolecular target data. J. Comput. Chem. 2000, 21, 86–104. [Google Scholar] [CrossRef]
- Kim, S.; Lee, J.; Jo, S.; Brooks, C.L., 3rd; Lee, H.S.; Im, W. CHARMM-GUI ligand reader and modeler for CHARMM force field generation of small molecules. J. Comput. Chem. 2017, 38, 1879–1886. [Google Scholar] [CrossRef]
- Jorgensen, W.L. Quantum and statistical mechanical studies of liquids. 10. Transferable intermolecular potential functions for water, alcohols, and ethers. Application to liquid water. J. Am. Chem. Soc. 1981, 103, 335–340. [Google Scholar] [CrossRef]
- Bussi, G.; Zykova-Timan, T.; Parrinello, M. Isothermal-isobaric molecular dynamics using stochastic velocity rescaling. J. Chem. Phys. 2009, 130, 074101. [Google Scholar] [CrossRef]
- Parrinello, M.; Rahman, A. Crystal Structure and Pair Potentials: A Molecular-Dynamics Study. Phys. Rev. Lett. 1980, 45, 1196–1199. [Google Scholar] [CrossRef]
- Darden, T.; York, D.; Pedersen, L. Particle mesh Ewald: An N⋅log(N) method for Ewald sums in large systems. J. Chem. Phys. 1993, 3, 10089–10092. [Google Scholar] [CrossRef]
- Hess, B.; Bekker, H.; Berendsen, H.J.C.; Fraaije, J.G.E.M. LINCS: A linear constraint solver for molecular simulations. J. Comp. Chem. 1997, 18, 1463–1473. [Google Scholar] [CrossRef]


| X-Ray | Docking | Average Distance for MD Trajectory | Final Distance After 50 ns of MD Simulation | Lifetime of Direct Interaction, % of the Simulation | |
|---|---|---|---|---|---|
| WRF in site Sudlow I | |||||
| RMSD X-ray/docked | 0.85 | ||||
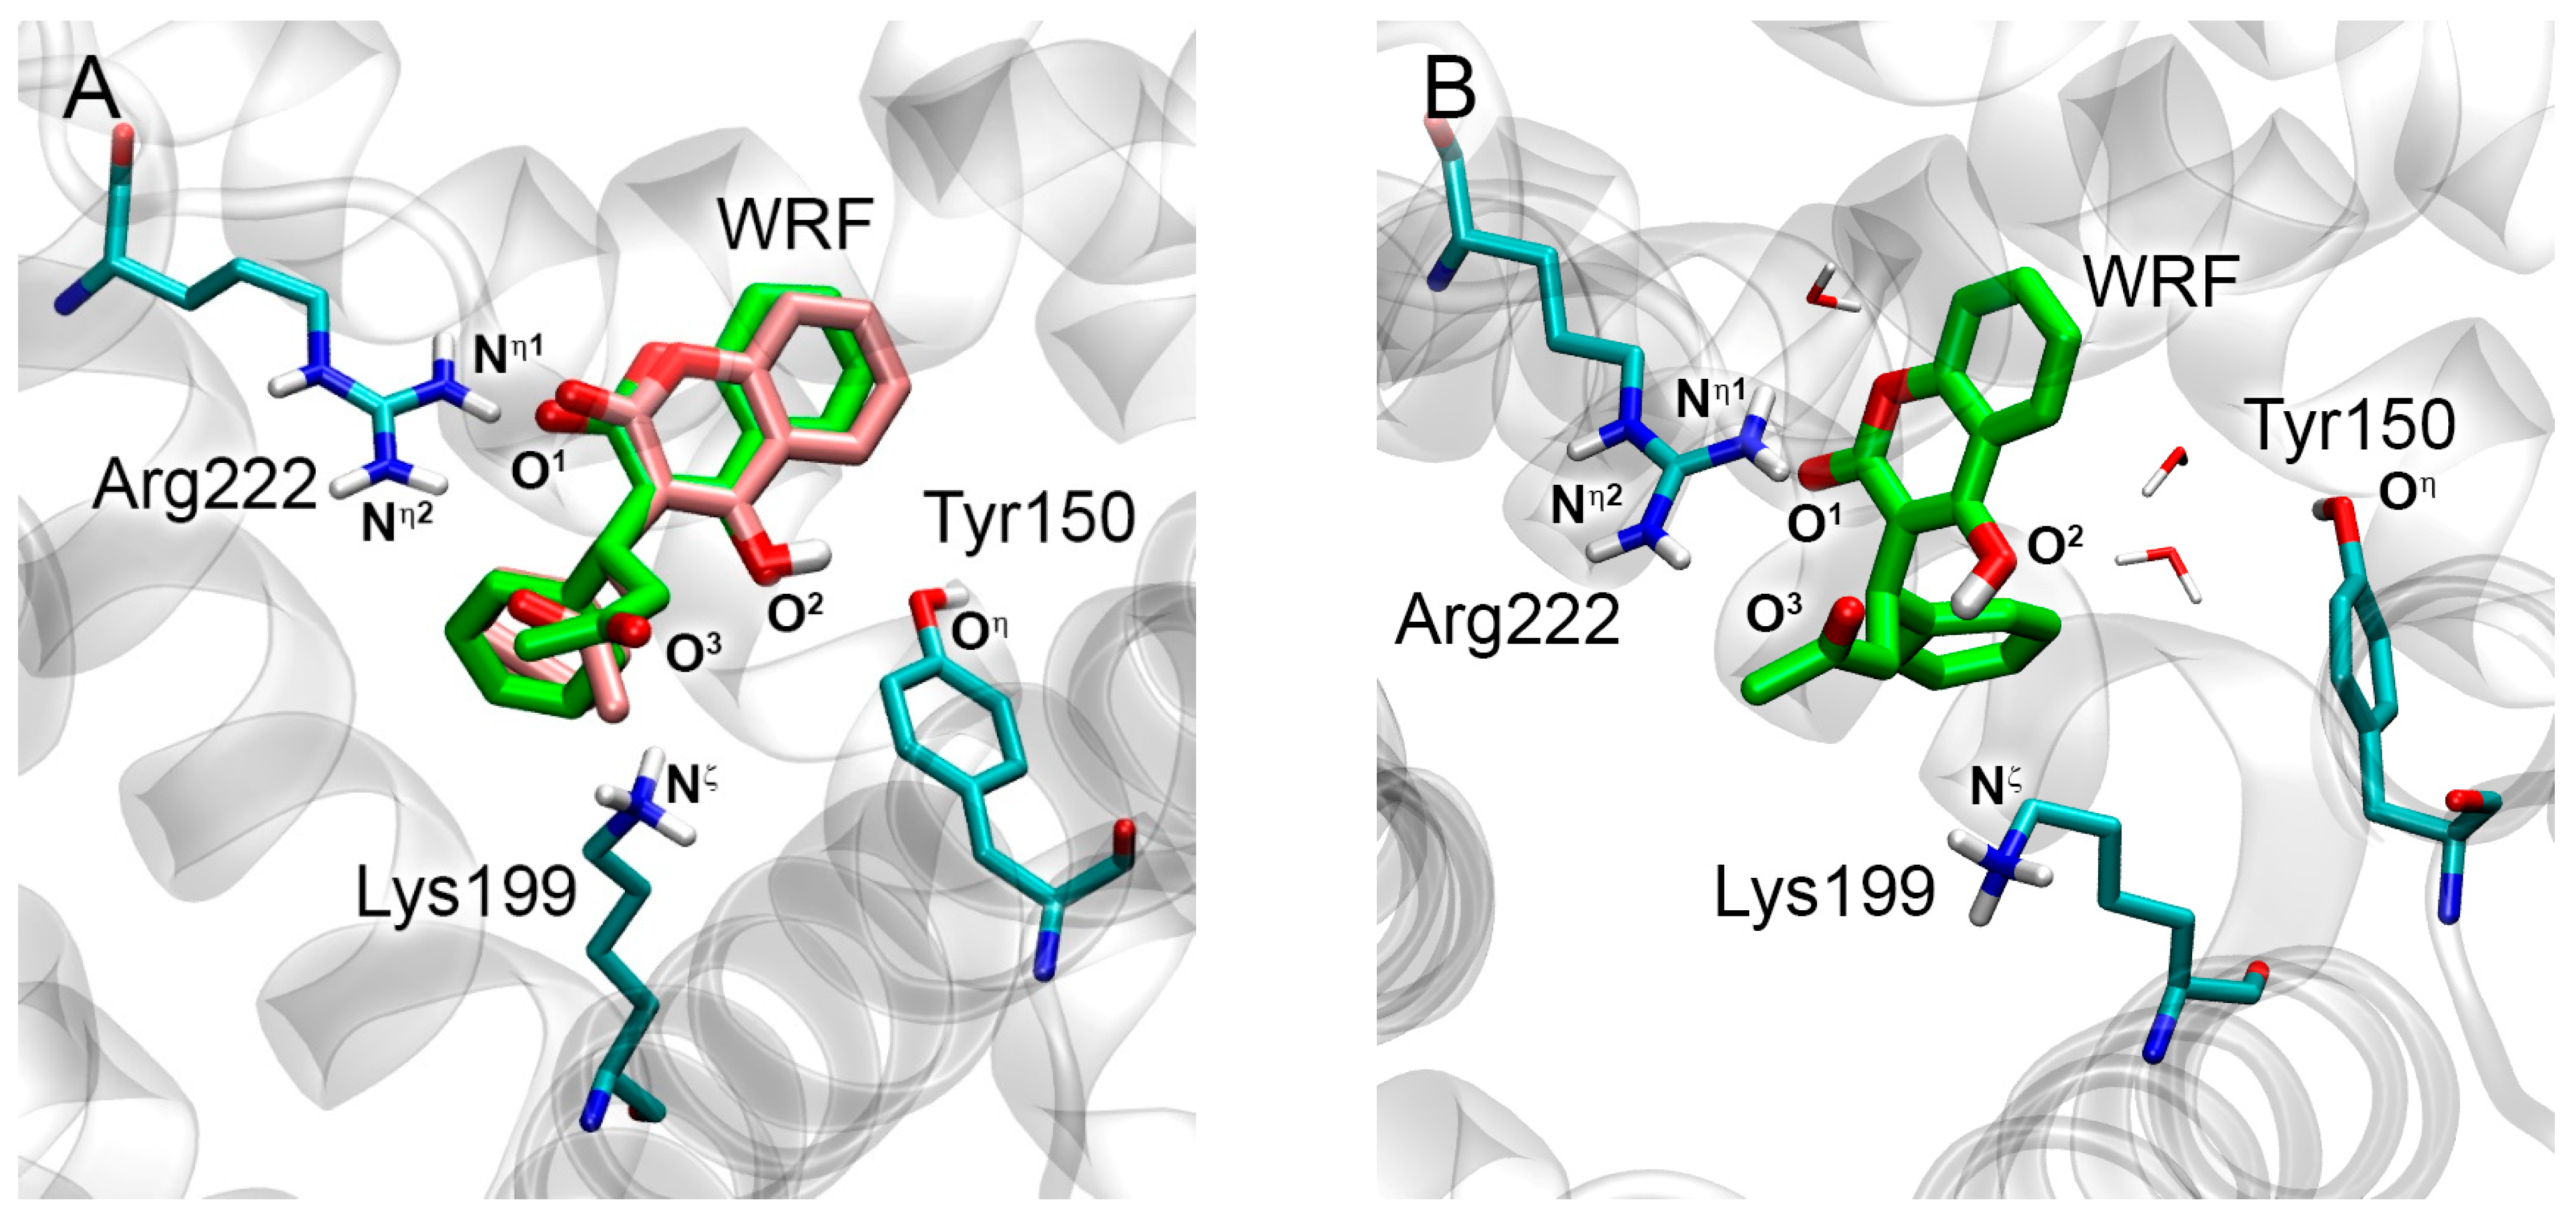
| O1(WRF)-Nη1(Arg222) | 3.1 | 3.0 | 4.0 | 4.4 | 56% |
| O2(WRF)-Oη(Tyr150) | 3.0 | 3.5 | 6.6 | 6.4 | 1% |
| O3(WRF)-Nη2(Arg222) | 3.4 | 6.1 | 5.5 | 3.9 | 20% |
| O3(WRF)-Nζ(Lys199) | 4.1 | 3.2 | 4.1 | 5.9 | 70% |
| DIA in site Sudlow II | |||||
| RMSD X-ray/docked | 0.79 | ||||
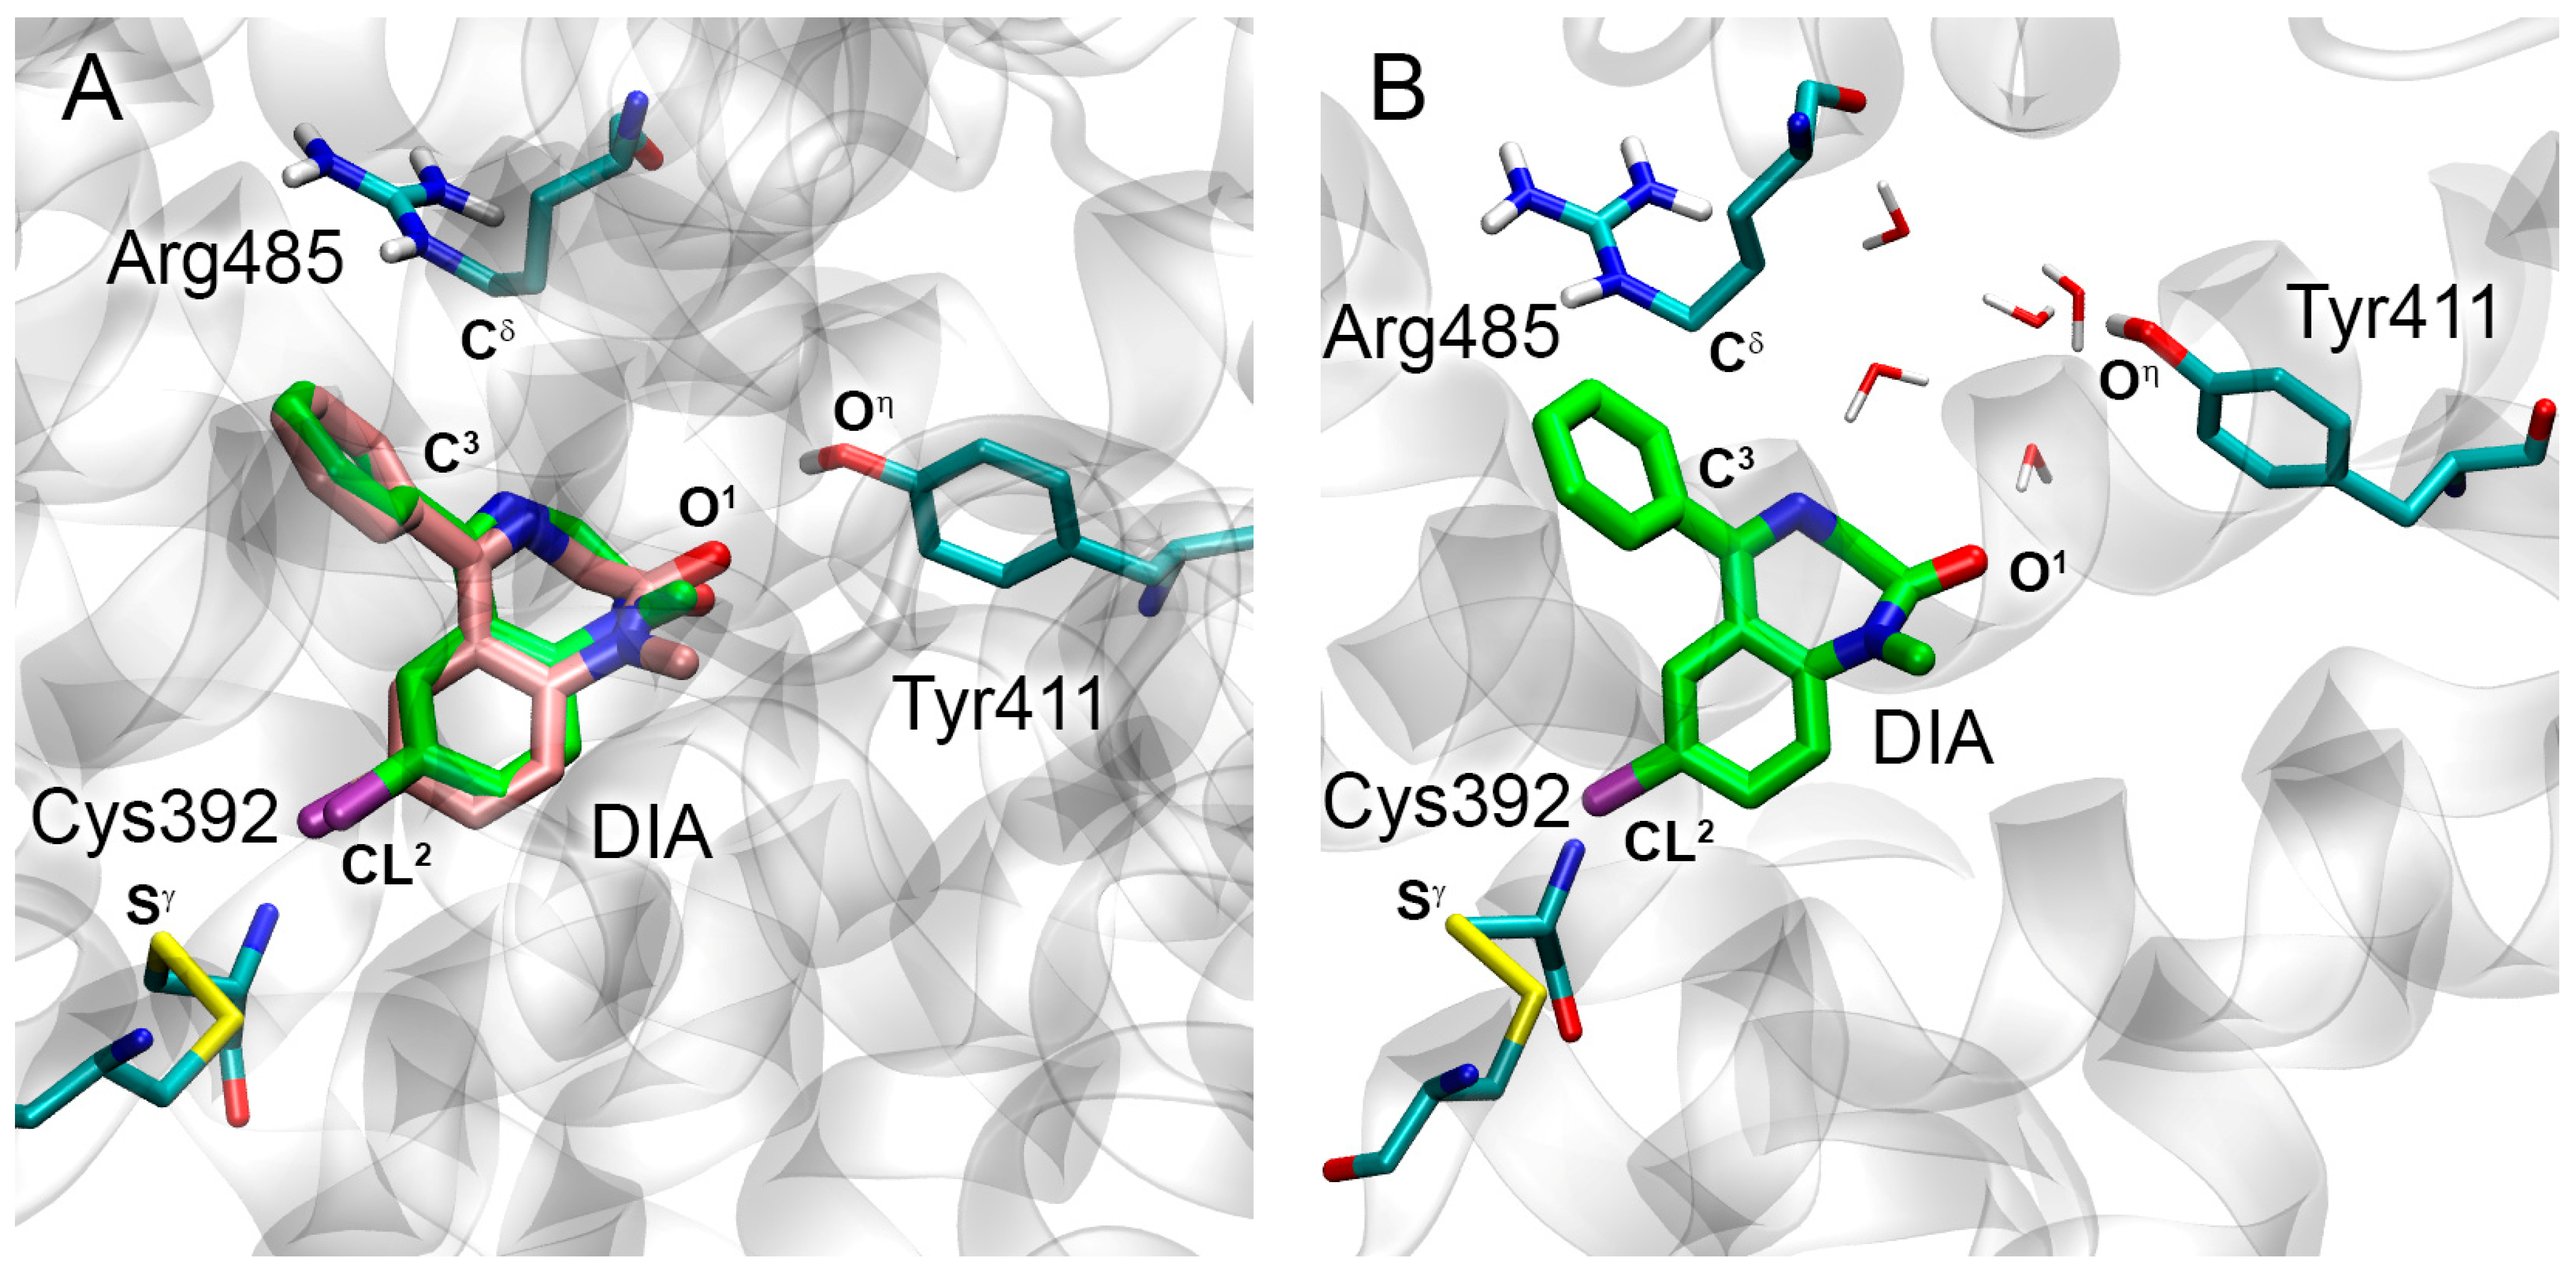
| O1(DIA)-Oη(Tyr411) | 3.1 | 4.7 | 5.0 | 6.2 | 22% |
| CL2(DIA)-Sγ(Cys392) | 3.5 | 4.1 | 4.3 | 4.1 | 70% |
| C3(DIA)-Cδ(Arg485) | 4.3 | 4.3 | 4.5 | 4.5 | 98% |
| Docking | Average Value for MD Trajectory | Final Value After 50 ns of MD Simulation | Lifetime of Direct Interaction, % of the Simulation | |
|---|---|---|---|---|
| WRF in site Sudlow I | ||||
| O1(WRF)-Nη1(Arg217) | 2.9 | 9.4 | 11.1 | 0.2% |
| O2(WRF)-Nη2(Arg256) | 2.4 | 7.3 | 7.9 | 0.2% |
| O4(WRF)-Nη2(Arg198) | 3.1 | 6.8 | 6.3 | 3% |
| O3(WRF)-Nε(Arg256) | 4.4 | 4.2 | 3.5 | 69% |
| DIA in site Sudlow II | ||||
| O1(DIA)-Oη(Tyr410) | 2.7 | 5.4 | 3.3 | 25% |
| CL2(DIA)-Sγ(Cys391) | 4.2 | 4.5 | 4.2 | 54% |
| C3(DIA)-Cδ(Arg484) | 4.1 | 5.0 | 4.5 | 100% |
| Docking | Average Value for MD Trajectory | Final Value After 50 ns of MD Simulation | Lifetime of Direct Interaction, % of the Simulation | |
|---|---|---|---|---|
| WRF in site Sudlow I | ||||
| O1(WRF)-Nη1(Arg222) | 2.7 | 9.7 | 11.5 | 0.2% |
| O2(WRF)-Oη(Tyr150) | 2.7 | 4.7 | 3.1 | 50% |
| O3(WRF)-Nδ2(Asn242) | 6.8 | 6.0 | 3.4 | 9% |
| O3(WRF)-Nζ(Lys199) | 3.2 | 5.2 | 4.8 | 16% |
| DIA in site Sudlow II | ||||
| O1(DIA)-Oη(Tyr411) | 3.7 | 5.9 | 2.9 | 30% |
| CL2(DIA)-Sγ(Cys391) | 3.9 | 4.7 | 3.7 | 52% |
| C3(DIA)-Cδ(Arg485) | 3.9 | 5.6 | 6.0 | 78% |
Disclaimer/Publisher’s Note: The statements, opinions and data contained in all publications are solely those of the individual author(s) and contributor(s) and not of MDPI and/or the editor(s). MDPI and/or the editor(s) disclaim responsibility for any injury to people or property resulting from any ideas, methods, instructions or products referred to in the content. |
© 2024 by the authors. Licensee MDPI, Basel, Switzerland. This article is an open access article distributed under the terms and conditions of the Creative Commons Attribution (CC BY) license (https://creativecommons.org/licenses/by/4.0/).
Share and Cite
Belinskaia, D.A.; Batalova, A.A.; Voronina, P.A.; Shmurak, V.I.; Vovk, M.A.; Polyanichko, A.M.; Sych, T.S.; Samodurova, K.V.; Antonova, V.K.; Volkova, A.A.; et al. Modulation of Albumin Esterase Activity by Warfarin and Diazepam. Int. J. Mol. Sci. 2024, 25, 11543. https://doi.org/10.3390/ijms252111543
Belinskaia DA, Batalova AA, Voronina PA, Shmurak VI, Vovk MA, Polyanichko AM, Sych TS, Samodurova KV, Antonova VK, Volkova AA, et al. Modulation of Albumin Esterase Activity by Warfarin and Diazepam. International Journal of Molecular Sciences. 2024; 25(21):11543. https://doi.org/10.3390/ijms252111543
Chicago/Turabian StyleBelinskaia, Daria A., Anastasia A. Batalova, Polina A. Voronina, Vladimir I. Shmurak, Mikhail A. Vovk, Alexander M. Polyanichko, Tomash S. Sych, Kamila V. Samodurova, Vasilisa K. Antonova, Anastasia A. Volkova, and et al. 2024. "Modulation of Albumin Esterase Activity by Warfarin and Diazepam" International Journal of Molecular Sciences 25, no. 21: 11543. https://doi.org/10.3390/ijms252111543
APA StyleBelinskaia, D. A., Batalova, A. A., Voronina, P. A., Shmurak, V. I., Vovk, M. A., Polyanichko, A. M., Sych, T. S., Samodurova, K. V., Antonova, V. K., Volkova, A. A., Gerda, B. A., Jenkins, R. O., & Goncharov, N. V. (2024). Modulation of Albumin Esterase Activity by Warfarin and Diazepam. International Journal of Molecular Sciences, 25(21), 11543. https://doi.org/10.3390/ijms252111543