Abstract
Phenolic compounds with antioxidant properties have risen in interest due to their benefits for human health. Fragaria chiloensis is a native wild berry species from Chile that develops a white/pink receptacle and white flesh at the ripe stage. Changes in color parameters, anthocyanins, secondary metabolites (phenolics, flavonoids), and total antioxidant capacity were followed during the development and ripening of F. chiloensis fruit. The increment in color ‘a’ index takes place in parallel with anthocyanins rise and the reduction in phenolics, flavonoids, and antioxidant capacity. Good correlations were determined between color development, anthocyanins, and the expression of key phenylpropanoid/flavonoid and anthocyanin pathway genes. To investigate the role of ABA on color development, detached immature fruit (C2 stage) were treated with exogenous ABA and stored at 20 °C. Fruit color development was accelerated by ABA treatment compared to non-treated fruit, and consistent with that, the increment in the accumulation of anthocyanins and transcripts of phenylpropanoid/flavonoid, and anthocyanin pathways genes such as FcPAL, FcCHS, and FcANS were observed. This suggests that ABA promotes transcriptional changes that lead to the color formation on this non-climacteric fruit.
1. Introduction
Nowadays, humans are interested in healthy diets and berries are an excellent source of polyphenolics with antioxidant properties which may protect against oxidative-stress conditions related to illness [1]. Fragaria chiloensis (L.) Mill. is a native wild berry species from Chile, dispersed along the central-south part of Chile between the Andes and the coastal mountains [2]. Two botanical forms have been identified in F. chiloensis (L.) Mill. subsp. chiloensis based on characteristics such as plant size, color, and fruit size: the ‘forma patagonica’ with small red fruit and the ‘forma chiloensis’ with large fruit size, white/pink receptacle, and white flesh [3,4]. The white Chilean strawberry (F. chiloensis (L.) Mill. subsp. chiloensis f. chiloensis) has been cultivated by pre-Columbian populations, and through traditional selection methods, plants producing big fruits of white/pink color have been selected [2]. This non-climacteric fruit is appreciated in the market for its excellent organoleptic attributes such as taste and aroma, in addition to its exotic white-pink color. In the local market, its commercialization price is at least ten times higher than commercial strawberry (F. x ananassa). In addition, it has been reported a high antioxidant activity for the fruit [5,6], and health benefits of its consumption [7,8,9], supporting the fruit as a functional food. Nevertheless, like many berries, the fruit has a short shelf life mainly due to its fast and intense softening [10].
This fruit offers an interesting model to study fruit pigmentation, considering the white/pink color of its receptacle and the white flesh. The typical red color of strawberry fruit is due to anthocyanins, with a major abundance of pelargonidin 3-glucoside; however, the Chilean strawberry fruit developed a white-pink color due to a low level of anthocyanins; the main compound quantified is cyanidin 3-glucoside, followed by pelargonidin 3-glucoside in lesser proportions [6]. Anthocyanins are synthesized through the phenylpropanoid and flavonoid biosynthesis pathways, metabolic pathways that convert phenylalanine into anthocyanins, flavonols, flavons, flavan-3-ols, and proanthocyanidins. Intermediates and final compounds of the route also contribute to the antioxidant machinery of the fruit.
The complete transcriptional profile of genes involved in flavonoid biosynthesis has been described during the development of the F. chiloensis fruit [11]. The expression of structural genes of this complex pathway is highly regulated. Several transcription factors (TF) regulate the flavonoid biosynthesis pathway, especially MYB family proteins. FaMYB1, a TF isolated from Fragaria × ananassa, was reported to suppress the accumulation of certain flavonoid compounds in tobacco flowers [12]. Moreover, the silencing of FaMYB1 by RNA interference resulted in a significant increase in anthocyanin content [13]. F. chiloensis MYB1 ortholog (FcMYB1) was identified and belongs to the R2R3-MYB repressor group [14]. The expression profile of FcMYB1 slightly increased during the ripening of F. chiloensis fruit, showing higher levels of transcripts than Fragaria × ananassa. It was hypothesized that the higher level of FcMYB1 transcripts could contribute to the pigment-deficient phenotype of the fruit. Then, FcMYB1-suppressed fruit showed an increased accumulation of pelargonidin 3-glucoside, in addition to alterations in the transcription level of genes of the flavonoid biosynthesis pathway such as down-regulation of CHI, F3H, DFR, LAR, and ANR, up-regulation of ANS and UFGT, and no change in CHS, confirming the pleiotropic regulation effect of FcMYB1 [14].
Hormonal regulation studies on color formation have been mainly investigated in F. x ananassa fruit. Jia et al. (2011) [15] proved that silencing FaNCED1, an ABA biosynthesis gene, resulted in decreased levels of ABA and non-colored fruit. Moreover, the addition of exogenous ABA rescued the uncolored phenotype. In a recent study, it was proven that FaMYB1 and FaMYB10 reverberate directly in anthocyanin accumulation in response to the elevations of endogenous ABA concentration [16].
In order to improve our knowledge of this native exotic white-pink species, the effect of ABA on color development was evaluated. For that, developing fruit (large green stage) was subjected to ABA treatments following changes in anthocyanins and the transcription level of phenylpropanoid and flavonoid biosynthesis pathway genes. The effect of Fluridon treatment, an inhibitor of ABA biosynthesis, was also assayed. Changes in the content of important metabolites of the pathway related to functional food properties, such as flavonoids and polyphenols, and their antioxidant capacity were also analyzed.
2. Results
2.1. Development of Color Changes and Secondary Metabolites during Development of F. chiloensis Fruit
Even though the white Chilean strawberry does not develop an intense red color in its receptacle, there are some changes in the general appearance of the fruit during its development and ripening. The color of its receptacle changes from green at the immature stage to white/pink color at the ripe stage, meanwhile the color of achenes changes from green to red. These changes were detected by the colorimeter, as chroma values decrease during fruit development which reflects the disappearance of the green background from receptacles and achenes (Figure 1A). These changes are more evident when the parameter ‘a’ is evaluated; the C1 stage has a negative ‘a’ value (green color) that becomes positive (red color) and greater in magnitude as the fruit develops and ripens (Figure 1A). In parallel with this, there is a small increment in the level of anthocyanins during ripening, and the maximum level reached in this fruit lot was 0.45 mg per 100 g FW (Figure 1B).
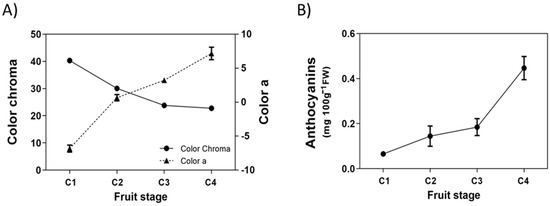
Figure 1.
Changes in fruit color during development of Fragaria chiloensis fruit. (A) Changes in color determined by the colorimeter and expressed as chroma and ‘a’ value; (B) changes in anthocyanins content. Values correspond to the mean ± SE of three replicates of five fruit each.
A series of metabolites related to the phenylpropanoids pathway were evaluated in F. chiloensis fruit. The total content of phenolics and flavonoids decreases significantly between stages C1 and C3 and remains at a low level until the end of F. chiloensis ripening (Figure 2A,B). Levels of 166 mg GAE per 100 g FW for phenolics and 2273 mg QE per 100 g FW for flavonoids were determined in fruit at the ripe stage. A similar pattern of decrease occurs with the antioxidant capacity determined as FRAP and DPPH (Figure 2C,D). At the ripe stage, F. chiloensis fruit ends with FRAP and DPPH values of 935 and 994 μmol Trolox equivalents per 100 g FW, respectively.
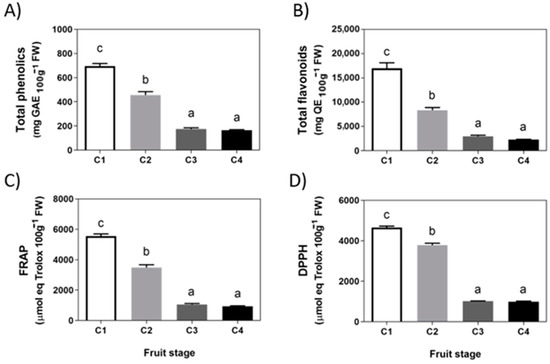
Figure 2.
Changes in phenolics and antioxidants during development of Fragaria chiloensis fruit. (A) Changes in phenolic compounds content; (B) level of flavonoids content; (C) changes in antioxidant content determined by FRAP method; (D) changes in antioxidant content determined by DPPH method. Values correspond to the mean ± SE of three independent extractions and determinations performed in triplicates. Different letters indicate significant differences between fruit stages. One-way ANOVA with Dunnett correction post hoc was used.
2.2. Changes in Response to ABA Treatment
It has been recently reported the effect of ABA treatment on softening of F. chiloensis fruit [17]. In addition to firmness reduction, ABA also accelerates changes in color development of F. chiloensis fruit as indicated by the faster reduction in chroma values and the quicker increment in the ‘a’ parameter observed in ABA treated fruit compared to non-treated fruit (Figure 3A,B). In other words, fruit at the C2 stage with low levels of ABA [17] treated with exogenous ABA took 2 days to reach the final red color (‘a’ parameter) compared to 4 days spent by non-treated fruit to reach the same final color (Figure 3B). The changes in the anthocyanins content are not as clear as direct color determinations; however, there is a notorious increment in anthocyanins in ABA-treated fruit compared to non-treated fruit (Figure 3C), although changes are not statistically significant. Photographs of the fruit taken during the experiment confirm the changes in color development (Figure 3D).
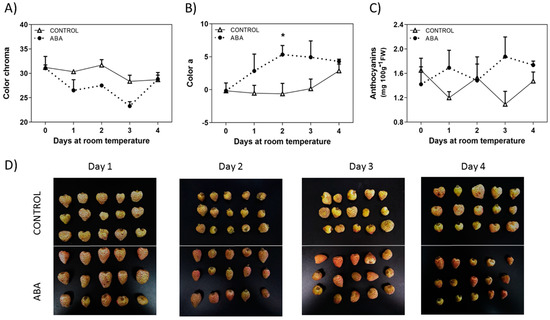
Figure 3.
Changes in fruit color induced by ABA treatment. The pedicel of F. chiloensis fruit at the C2 stage was submerged in 1 mM ABA or only buffer; the fruit was maintained at room temperature. (A) Changes in color expressed as chroma; (B) changes in color expressed as a* (green to red, SCIELAB scale); (C) changes in anthocyanins content. Values correspond to the mean + SE of three replicates of five fruit. Asterisks indicate significant differences between treatments (* p < 0.05; disappeared t-test with Bonferroni correction post hoc). (D) Images reporting the changes in color in the fruit treated with ABA or non-treated. Photos were taken after 1, 2, 3, and 4 days of treatment.
When F. chiloensis fruit at the C2 stage was treated with ABA, there was also a reduction in the level of total phenolics after 2 or 3 days of treatment (Figure 4A). On the other hand, the content of flavonoids temporarily decreases during the first two days in response to ABA but then increases significantly compared to control fruit and fruit from day 0 (Figure 4B). Significant changes in the antioxidant capacity were also observed in response to ABA; a significant reduction in FRAP and DPPH levels were observed after 1, 2, and 3 days of treatment (Figure 4C,D). These indicate that ABA accelerates the reduction in total phenolics and antioxidants in F. chiloensis fruit. Interestingly, there is a general increment in anthocyanins and total flavonoids content in response to ABA.
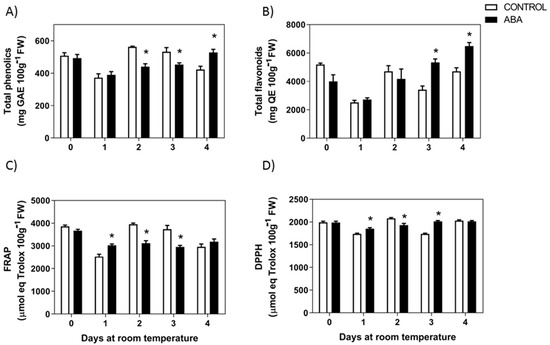
Figure 4.
Changes in phenolics and antioxidants in response to ABA treatment. The pedicel of F. chiloensis fruit at the C2 stage was submerged in 1 mM ABA or only buffer, and maintained at room temperature. (A) Changes in phenolic compounds content; (B) level of flavonoids content; (C) changes in antioxidant content determined by FRAP method; (D) changes in antioxidant content determined by DPPH method. Values correspond to the mean ± SE of three independent extractions and determinations performed in triplicates. Asterisks indicate significant differences between treatments (* p < 0.05). Two-way ANOVA with Tukey correction post hoc was used.
2.3. Expression Level of Anthocyanin Biosynthetic Pathway Genes during Fruit Development and in Response to ABA Treatment
In order to understand the appearance of color in strawberry fruit, the expression level of genes that drives the biosynthesis towards anthocyanins was followed during fruit development. The entire biosynthetic pathway can be split into different metabolic pathways. PAL (phenylalanine ammonium lyase), C4H (cinnamate 4-hydroxylase), and 4CL (4-coumarate:CoA ligase) corresponds to the first three reactions of the phenylpropanoid biosynthesis pathway that transforms phenylalanine into 4-coumaroyl-CoA. The following reactions belong to the flavonoid biosynthesis pathway and involve those performed by CHS (chalcone synthase) and CHI (chalcone isomerase) that transforms 4-coumaroyl-CoA and malonyl-CoA into the flavanone naringenin. Then F3H (flavanone 3β-hydroxylase) converts naringenin into the dihydroflavonol dihydrokaempferol, which is then transformed into dihydroquercetin by F3′H (flavonoid 3′-hydroxylase). At this point, the pathway can be diversified towards flavonols by means of FLS (flavonol synthase) or towards anthocyanins by DFR, ANS, and UFGT. DFR (dihydroflavonol 4-reductase) promotes the synthesis of leucoanthocyanidins, ANS (anthocyanidin synthase) the synthesis of anthocyanidins, and UFGT (UDP-glucose:flavonoid 3-O-glucosyltransferase) the synthesis of anthocyanins. Leucoanthocyanidins can also be transformed into flavan-3-ols by means of LAR (leucoanthocyanidin reductase), and anthocyanidins can be transformed into epi-flavan-3-ols by means of ANR (anthocyanidin reductase). Flavan-3-ols and epi-flavan-3-ols can then be converted into proanthocyanidins.
Two PAL genes have been identified so far in F. chiloensis, FcPAL2 and FcPAL4. The accumulation of FcPAL2 transcripts decreases early during the development of the fruit, with sharp reductions during the transition from the C1 to C2 stage, maintaining low expression levels from the C2 stage until the end of ripening (Figure 5A). Meanwhile, FcPAL4 transcripts increase intensively during the transition from the C1 to C2 stage, maintaining a high expression level from the C2 to C4 stage (Figure 5D). In response to ABA, there is a significant reduction in the accumulation of FcPAL2 transcripts at 6 h, and no changes in expression were observed in Fluridon-treated fruit (Figure 5B). In the longer time, there is a significant increment in FcPAL2 transcripts in response to ABA during the following 4 days of storage (Figure 5C). In the case of FcPAL4, a non-significant increase in transcripts after 24 h could be observed (Figure 5E) and no changes in response to Fluridon in the short-term experiment. When the effect was tested during a longer time frame, a small increment in transcript accumulation of FcPAL4 was observed in ABA treated fruit after 4 days of storage, and the same increment was observed in control fruit (Figure 5F).
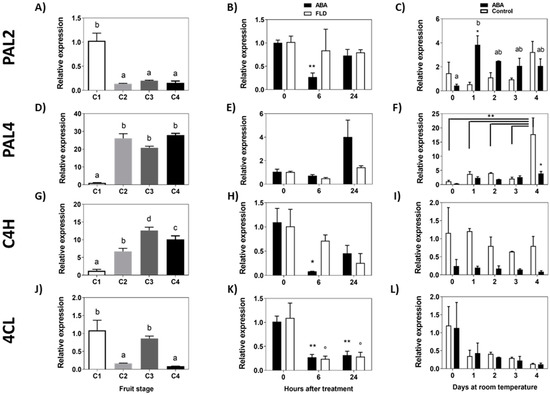
Figure 5.
Expression level of phenylpropanoid pathway genes during development of F. chiloensis fruit and in response to ABA treatment. In the short-term treatment, fruit at C2 stage was immersed in 1 mM ABA or 100 µM Fluridon (FLD). In the long-term treatment the pedicel of the fruit submerged in 1 mM ABA or only buffer. Changes in the expression level of each gene during fruit development are shown on the left-hand side of the figure; in the center the effect of ABA/Fluridon in the short-term treatment; on the right-hand side the effect of ABA in the long-term treatment. The expression level of genes from the first portion of the phenylpropanoid pathway was determined through qPCR analysis: FcPAL2, phenylalanine ammonia-lyase 2 (A–C); FcPAL4, phenylalanine ammonia-lyase 4 (D–F); FcC4H, trans-cinnamate 4-hydroxylase 1 (G–I); Fc4CL, 4-coumarate-CoA ligase (J–L). In expression analysis during development progress of F. chiloensis, different letters indicate significant differences between fruit stages (one-way ANOVA with Dunnett correction post hoc). In ABA short-term treatments, asterisks or circles indicate significant differences compared to time 0 for each hormone/inhibitor treatment (* p < 0.05, ** p < 0.01; one-way ANOVA with Dunnett correction post hoc). For ABA long-term treatment, asterisks indicate significant differences between treatments (* p < 0.05, ** p < 0.01), different letters indicate significant differences between days of ABA treatment, and bars with asterisks indicate significant difference between days of control group; two-way ANOVA with Tukey correction post hoc test was used.
The accumulation of FcC4H transcripts increases early during the development of the fruit, with the maximum level at the C3 stage (Figure 5G). In response to ABA, there is a notorious decrease in FcC4H transcripts after 6 h of treatment which recovers at 24 h; meanwhile, in Fluridon-treated fruit, transcript levels remain almost unchanged (Figure 5H). When the effect of ABA was tested during a longer period of time, a non-significant change in transcripts for FcC4H was determined in ABA-treated fruit or control fruit (Figure 5I). Fc4CL displays an oscillating transcription profile during fruit development; the level of transcripts decreases during the transition between C1 and C2 stages, increases between C2 and C3, and decreases again between C3 and C4 stages (Figure 5J). In response to ABA and Fluridon, there is a significant decrease in Fc4CL transcript levels (Figure 5K). In the longer time, non-significant differences were observed in ABA-treated fruit or the control group (Figure 5L). In summary, considering the phenylpropanoid biosynthetic pathway, the treatment of ABA in the longer time induces the expression of the first gene of the route, FcPAL2 and FcPAL4. In the short time, ABA transiently represses the expression of FcPAL2, and interestingly Fluridon avoids this transcriptional change.
The accumulation of FcCHS transcripts increases during the development of the fruit, with a low expression level at the C1 stage and a high expression level between C2 and C4 stages (Figure 6A). In response to ABA, there was a significant increment in the accumulation of FcCHS transcripts after 24 h of treatment, and interestingly this increment was avoided by Fluridon (Figure 6B,C). The increment in FcCHS expression promoted by ABA is only transient as it was not maintained during the following days (Figure 6C). FcCHI showed an increasing expression profile during the development of F. chiloensis fruit (Figure 6D). In response to ABA, there is a significant reduction in the accumulation of FcCHI transcripts after 6 h and 24 h (Figure 6E); non-significant changes were observed in response to Fluridon. When the effect was tested during a longer period, no changes in the transcript accumulation of FcCHI were observed in ABA-treated fruit (Figure 6F).
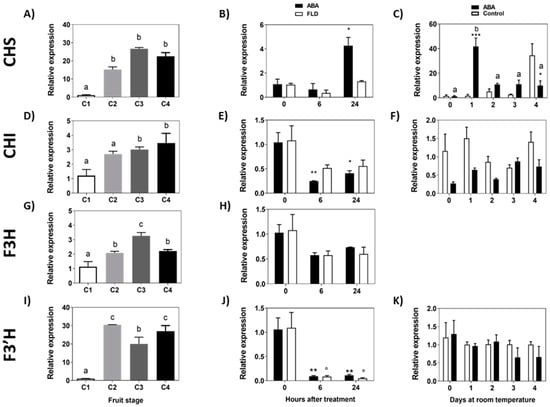
Figure 6.
Expression level of the genes from the initial portion of the flavonoid pathway during development of F. chiloensis fruit and in response to ABA treatment. Fruit at C2 stage was immersed in 1 mM ABA or 100 µM FLD (short-term treatment) or fruit pedicel was submerged in 1 mM ABA or only buffer (longer-time treatment). Changes in the expression level of each gene during fruit development are shown on the left-hand side of the figure; in the center the effect of ABA/FLD in the short term-treatment; on the right-hand side the effect of ABA in the long-term treatment. Gene expression levels of the flavonoid pathway were quantified through qPCR analysis: FcCHS, chalcone synthase (A–C); FcCHI, chalcone isomerase (D–F); FcF3H, flavanone 3-hydroxylase (G,H); FcF3′H, flavonoid-3′-hydroxylase (I–K). In expression analysis during development progress of F. chiloensis, different letters indicate significant differences between fruit stages (one-way ANOVA with Dunnett correction post hoc). In ABA short-term treatments, asterisks or circles indicate significant differences compared to time 0 for each hormone/inhibitor treatment (* p < 0.05, ** p < 0.01; one-way ANOVA with Dunnett correction post hoc). For ABA long-term treatment, asterisks indicate significant differences between treatments (* p < 0.05, ** p < 0.01, *** p < 0.001), different letters indicate significant differences between days of ABA treatment; two-way ANOVA with Tukey correction post hoc test was used.
Transcripts for FcF3H showed an incremental pattern during the development of F. chiloensis fruit with maximum expression values at stage C3 (Figure 6G). In response to ABA or Fluridon, there is a non-significant change in FcF3H transcript levels (Figure 6H). No expression of FcF3H was recorded when ABA was tested in the longer time experiment. Following the pathway, the accumulation of FcF3′H transcripts increases sharply between C1 and C2 stages and remains high during the development of the fruit with higher values at C2 and C4 stages (Figure 6I). In response to ABA and Fluridon, there is a notorious decrease in FcF3′H transcripts after 6 h and 24 h (Figure 6J); however, FcF3′H transcripts remained unchanged in response to ABA during the longer period of time experiment (Figure 6K). In summary, considering the first portion of the flavonoid biosynthetic pathway, the treatment of ABA promotes the temporal induction of FcCHS and the transient repression of FcCHI and FcF3′H. Meanwhile, the transcriptional changes observed for FcCHS and FcCHI were not detected in Fluridon-treated fruit.
Following the synthesis pathway that ends in anthocyanins, the accumulation of transcripts for FcDFR1 increases sharply during the transition from the C1 to C2 stage, keeping a high expression level from C2 until the end of ripening (Figure 7A). ABA treatment significantly reduces the expression of FcDFR1 during the first 6 h but recovers the initial expression level after 24 h; meanwhile, Fluridon does not affect the FcDFR1 transcript level (Figure 7B). During a longer period of time, the transcript accumulation of FcDFR1 displays a tendency to diminish with time in response to ABA, although no significant differences were observed compared to control fruit (Figure 7C).
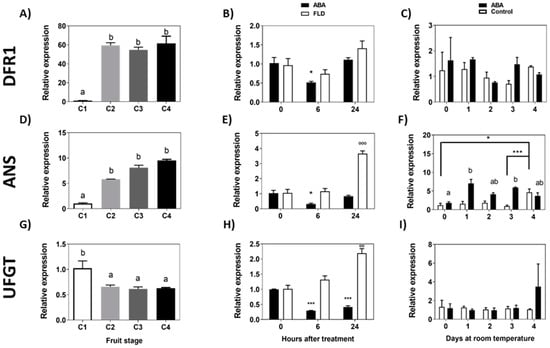
Figure 7.
Expression level of the genes from the final portion of the flavonoid pathway and anthocyanin pathway during development of F. chiloensis fruit and in response to ABA treatment. Fruit at C2 stage was immersed in 1 mM ABA or 100 µM Fluridon (short-term treatment) or fruit pedicel was submerged in 1 mM ABA or only buffer (longer-time treatment). Changes in the expression level of each gene during fruit development are shown on the left-hand side of the figure; in the center the effect of ABA/FLD in the short-term treatment; on the right-hand side the effect of ABA in the long-term treatment. The expression level of genes of the flavonoid pathway was determined through qPCR analysis: FcDFR1, Dihydroflavonol 4-reductase 1 (A–C); FcANS, Anthocyanidin synthase (D–F); FcUFGT, UDP-glucose flavonoid 3-O glucosyltransferase (G–I). In expression analysis during development progress of F. chiloensis, different letters indicate significant differences between fruit stages (one-way ANOVA with Dunnett correction post hoc). In ABA short-term treatments, asterisks or circles indicate significant differences compared to time 0 for each hormone/inhibitor treatment (* p < 0.05, *** p < 0.001; one-way ANOVA with Dunnett correction post hoc). For ABA long-term treatment, asterisks indicate significant differences between treatments (* p < 0.05, *** p < 0.001), different letters indicate significant differences between days of ABA treatment, and bars with asterisks indicate significant difference between days of control group; two-way ANOVA with Tukey correction post hoc test was used.
The accumulation of FcANS transcripts increases during the development of the fruit (Figure 7D). ABA treatment transiently reduces the level of transcripts after 6 h that recovers after 24 h; meanwhile, Fluridon induces the level of transcripts after 24 h (Figure 7E). The expression of FcANS increments in a significant manner from day 1 to day 4 of treatment in response to a long exposure to ABA (Figure 7F).
The level of FcUFGT transcripts decreases throughout the development and ripening of F. chiloensis fruit (Figure 7G). A significant reduction in expression is observed between C1 and C2 stages, and expression remains at a low level until the end of ripening. In response to ABA treatment, the FcUFGT transcripts level decreases significantly after 6 h and 24 h of treatment; meanwhile, Fluridon induces the accumulation of transcripts after 24 h (Figure 7H). In the longer time, no changes in FcUFGT transcripts were observed in ABA-treated fruit (Figure 7I). In conclusion, in response to ABA, there is a temporal reduction in FcANS during the first hours of treatment followed by a significant increment during the following days. These changes were also accompanied by the temporal reduction in the expression of FcDFR1 and FcUFGT. An opposite expression pattern determined in ABA-treated fruit was noticed in response to Fluridon in the case of FcANS and FcUFGT.
The same pathway also drives the metabolic intermediates to the formation of flavan-3-ols by FcLAR and epi-flavan-3-ols by FcANR which can be then converted into proanthocyanidins or can provide intermediates for flavonols synthesis by means of FcFLS. The level of FcFLS transcripts decreases significantly between C1 and C2 stages and remains at a low level during the remaining development stages of F. chiloensis fruit (Figure 8A). ABA and Fluridon treatments significantly reduce the expression of FcFLS (Figure 8B). During a longer period of time, the transcript accumulation of FcFLS displays a tendency to diminish with time in response to ABA (Figure 8C).
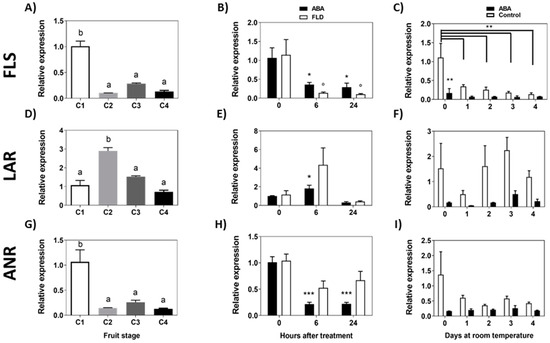
Figure 8.
Expression level of genes converting intermediates of the flavonoid pathway during development of F. chiloensis fruit and in response to ABA treatment. Fruit at C2 stage was immersed in 1 mM ABA or 100 µM Fluridon (short-term treatment) or fruit pedicel was submerged in 1 mM ABA or only buffer (longer-time treatment). Changes in the expression level of each gene during fruit development are shown on the left-hand side of the figure; in the center the effect of ABA/FLD in the short-term treatment; on the right-hand side the effect of ABA in the long-term treatment. The expression level of genes of the flavonoid pathway was determined through qPCR analysis: FcFLS, flavonol synthase (A–C); FcLAR, Leucoanthocyanidin reductase (D–F); FcANR, anthocyanidin reductase (G–I). In expression analysis during development progress of F. chiloensis, different letters indicate significant differences between fruit stages (one-way ANOVA with Dunnett correction post hoc). In ABA short-term treatments, asterisks or circles indicate significant differences compared to time 0 for each hormone/inhibitor treatment (* p < 0.05, ** p < 0.01, *** p < 0.001; one-way ANOVA with Dunnett correction post hoc). For ABA long-term treatment, asterisks indicate significant differences between treatments (* p < 0.05, ** p < 0.01), and bars with asterisks indicate significant difference between days of control group; two-way ANOVA with Tukey correction post hoc test was used.
The accumulation of FcLAR transcripts showed a peak of expression at the C2 stage (Figure 8D). ABA treatment increments the level of FcLAR transcripts after 6 h but recovers to the initial expression level after 24 h; meanwhile, no significant changes were detected by Fluridon treatment (Figure 8E). In response to a long ABA exposure, the expression of FcLAR remains unchanged compared to day 0 (Figure 8F). Finally, the level of FcANR transcripts decreases significantly between C1 and C2 stages and remains at a low level in the remaining stages (Figure 8G). In response to ABA treatment, FcANR transcripts significantly decrease after 6 h and 24 h of treatment; meanwhile, Fluridon does not modify the level of transcripts (Figure 8H). In the longer time, no changes in FcANR transcripts were observed in ABA-treated fruit (Figure 8I). In summary, there is a notorious reduction in the expression of FcFLS in response to ABA, in addition to a transitory reduction in FcANR (6 h, 24 h) and a temporal increment in FcLAR (6 h).
2.4. Expression Level of FcMYB1
MYB1 has been proposed, in addition to other TFs (WD40 and bHLH), as a key regulator of structural genes in the anthocyanins biosynthesis pathway. The accumulation of FcMYB1 transcripts showed no changes during the development of the fruit (Figure 9A). In response to ABA, the expression of FcMYB1 remains unchanged but a transitory increase after 24 h of treatment is noticed; Fluridon treatment also increases FcMYB1 transcripts after 24 h (Figure 9B). In the long-term treatment, non-significant changes were confirmed in ABA-treated fruit (Figure 9C).
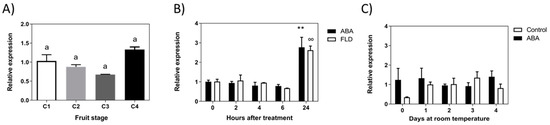
Figure 9.
Expression level of FcMYB1 TF gene during development of F. chiloensis fruit and in response to ABA treatment. Fruit at C2 stage was immersed in 1 mM ABA or 100 µM Fluridon (short-term treatment) or fruit pedicel was submerged in 1 mM ABA or only buffer (long-term treatment). (A) Expression level of FcMYB1 during development and ripening of the fruit. (B) Changes in the expression level of FcMYB1 in response to ABA and FLD during 24 h of treatment. (C) Changes in the expression level of FcMYB1 in response to ABA during 4 days of treatment. In expression analysis during development progress of F. chiloensis, different letters indicate significant differences between fruit stages (one-way ANOVA with Dunnett correction post hoc). In ABA short-term treatments, asterisks or circles indicate significant differences compared to time 0 for each hormone/inhibitor treatment (** p < 0.01; one-way ANOVA with Dunnett correction post hoc). For ABA long-term treatment, asterisks indicate significant differences between treatments, different letters indicate significant differences between days of ABA treatment, and bars with asterisks indicate significant difference between days of control group; two-way ANOVA with Tukey correction post hoc test was used.
3. Discussion
3.1. Changes in Fruit Appearance and Transcriptional Changes during Fruit Development
The data provided indicated that F. chiloensis develops a pinkish appearance which is due to the production of a reduced level of anthocyanins. According to previous reports, the main anthocyanins produced are pelargonidin-3-glucosides. The level of total anthocyanins in ripe F. chiloensis fruit is lower than the level generally quantified in several F. x ananassa cultivars. Here, the level of anthocyanins was quantified is 0.45 mg/100 g FW and recent values reported for different F. x ananassa cultivars are around 17–22 mg/100 g FW at the ripe stage [18].
The complete transcriptional profile of genes involved in the phenylpropanoid and flavonoid biosynthesis pathways has been previously described during the development and ripening of F. chiloensis fruit [10]. In general, the accumulation of transcripts detected here for most of the genes involved in the pathway (Figure 6, Figure 7 and Figure 8) is similar to those reported previously by Salvatierra et al. (2010) [10], except for FcC4H and FcUFGT. The difference could be explained by the fact that new sets of specific primers were designed for the qPCR analyses of these genes that assured unique PCR products.
As a way to understand and explain the changes in color, metabolites, and the transcription level of genes, correlation analyses were performed (Table 1). During the development of F. chiloensis the fruit receptacle develops a pink color appearance, which is accompanied by the increment of anthocyanins in the fruit. The correlation coefficient between color ‘a’ and anthocyanins is 0.87. In parallel with pink color development in F. chiloensis fruit, there is a general reduction in the level of phenolics, flavonoids, and antioxidant capacity throughout fruit development (correlation values are 0.95, 0.97, 0.95, and 0.90 for phenolics, flavonoids, FRAP, and DPPH, respectively). The increment in pink color can be endorsed to the increased expression of genes from the phenylpropanoids and flavonoids biosynthesis pathways such as FcPAL4 (r-value = 0.90), FcC4H (r = 0.88), FcCHS (r = 0.91), CHI (r = 0.99), DFR1 (r = 0.91), and ANS (r = 0.99). Besides, a negative correlation was determined for genes driven to the synthesis of non-anthocyanin compounds such as FLS (r = −0.90) and ANR (r = −0.87), leading in this way to the synthesis of glycosylated anthocyanins and avoiding the synthesis of flavonols and epi-flavan 3-ols. The reduction in flavonoids content observed during F. chiloensis development correlates with the reduction in the expression of FLS (r = 0.89). On the other hand, the fruit antioxidant capacity of the fruit correlates well with the level of phenolics (r = 1 for FRAP, r = 0.98 DPPH) and flavonoids (r = 0.99 for FRAP, r = 0.94 DPPH). Interestingly, FcLAR behaves differently, as it displays a unique expression profile, and non-significant correlation values were determined with none of the descriptors.

Table 1.
Pearson correlation analysis between color parameters, secondary metabolites, antioxidant capacity, and genes (significant values are shown in bold, p < 0.05).
In general, MYB1 displays a low correlation value with most of the parameters under study; however, a medium correlation value was observed for anthocyanin content (r = 0.66).
3.2. ABA Accelerates the Pinkish Color of F. chiloensis Fruit
The treatment of F. chiloensis fruit with ABA accelerates its color development (Figure 3). This was recorded by the increment in the ‘a’ value quantified by the colorimeter and accompanied by the increment in the anthocyanins level. Changes in transcripts were detected in the phenylpropanoids/flavonoids and anthocyanin pathways (Figure 10). ABA induces the expression of FcPAL2 and FcPAL4, the first enzyme committed to the pathway, in addition to the transient induction of FcCHS and repression of FcCHI and FcF3′H. The increment in the expression of FcCHS is avoided by the use of Fluridon, suggesting its dependence on ABA. Importantly, the gene coding for FcANS, the enzyme directly involved in the synthesis of anthocyanins, responds to ABA with a temporal reduction during the first hours followed by a notorious increment in its transcript level during the following days. Again, the temporal expression changes promoted by ABA in FcANS are avoided in Fluridon-treated fruit, confirming its ABA dependence. These changes were also accompanied by the temporary reduction in the expression of FcDFR1 and FcUFGT, a notorious permanent repression of FcFLS, and a temporary repression of FcANR. These transcriptomic changes explained the increment in anthocyanins induced by ABA, allowing the conversion of Phe into the metabolic intermediates driving the synthesis to anthocyanins, and reducing the conversion of them into glycosylated compounds. In addition, they avoided the conversion of intermediates into other metabolic products of this metabolic pathway such as flavonols or epi-flavan 3-ols; the latter can then be transformed into proanthocyanidins.
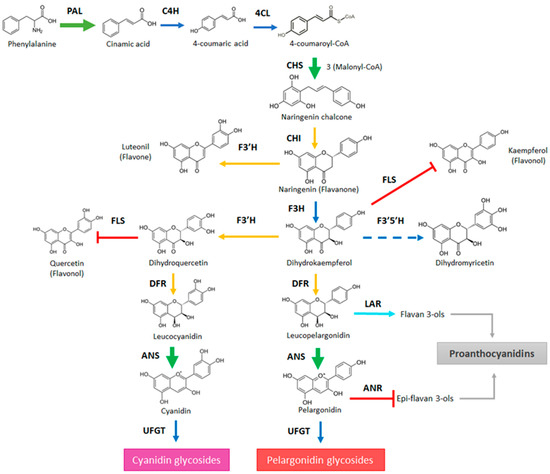
Figure 10.
General view of the phenylpropanoid/flavonoid pathway highlighting the expression changes in response to ABA treatment that explains the increment of color in Fragaria chiloensis fruit. In the scheme, green arrows indicate the increment in expression promoted by ABA; light blue arrow indicates a transitory increment in the expression; blue arrows indicate no changes in the expression level; yellow arrows denote a transient reduction in the expression followed by the increment in expression; red arrows indicate a decrease in the expression level; dashed blue line indicate that transcripts for the gene were not detected in the fruit. The metabolic pathway has been modified from [19].
Remarkably, in response to ABA, there was an increment in the total content of flavonoids (Figure 4B). The method of AlCl3 employed for flavonoids determination [20] can detect flavonols and flavones in a strong manner; meanwhile, flavanones and isoflavones are detected but with less intensity. The increment in total flavonoids observed in response to ABA treatment after 3–4 days could be explained by the reduction in FcFLS expression that provided more intermediates for the route. Some of them can be converted into anthocyanins, meanwhile others into flavones such as luteonil through FcF3′H that recovers initial expression level by day 3. As the AlCl3 method is more sensitive for luteolin (flavone) than for naringenin (flavanone), the conversion of naringenin into luteolin could explain the significant increment in total flavonoids observed in ABA-treated fruit. Nevertheless, this should be confirmed through more precise quantification methods, such as HPLC.
3.3. Role of TFs in the Regulation of the Phenylpropanoid Pathway
It has been reported that structural genes taking part in the biosynthesis of flavonoid pigments are modulated in their expression by TFs [14]. These TF proteins interact with the promoter regions of structural genes located at different levels within the biosynthetic pathway. The intricate interaction network between structural genes and TFs allows the accumulation of particular metabolites. Three TFs proteins have been reported to be involved in the regulation of structural genes in the anthocyanins biosynthesis pathway: MYB, WD40, and bHLH [21,22,23,24]. In fact, the interaction between these three TFs regulates the appearance of fruit color.
In F. chiloensis fruit, the participation of FcMYB1 has been demonstrated in fruit color development. As a negative regulator, the repression of FcMYB1 through RNAi induces the expression of anthocyanins in the fruit through the transcriptional activation of FcANS, but at the same time, the downregulation of FcLAR and FcANR [14].
In our hands, ABA induces the expression of FcMYB1 after 24 h; therefore, we cannot conclude if the changes in expression observed in ABA treated fruit are explained by FcMYB1. Probably, the other associated TFs may have a more direct relationship with the effects promoted by ABA.
4. Materials and Methods
4.1. Fruit Material
White Chilean strawberry fruit was harvested at Purén, Chile, and divided into four different stages (C1, C2, C3, C4) as described by Figueroa et al. (2008) [10].
4.2. Hormonal Treatments
Fruit at the C2 stage (medium size fruit with green receptacle and red achenes) was submerged into 1 mM abscisic acid (ABA, PhytoTechnology Laboratories, Lenexa, KS, USA) or 100 µM Fluridon (PhytoTechnology Laboratories, Lenexa, KS, USA) following the procedure recently described [17]. Three replicates of 5 fruit each were collected just after treatment and after 6 and 24 h of treatment.
In addition, exposure to ABA for longer periods was also performed. In this case, the pedicel of the fruit was submerged in 1 mM ABA or only buffer [17]. Sampling was performed daily for up to 4 days (3 replicates of 5 fruit) after color measurements. In both types of experiments, the fruit was immediately frozen in pools with the help of liquid nitrogen and stored at −80 °C until use.
4.3. Physiological Parameters
Color was measured with the Chroma Meter Model CR-400 (Konica Minolta Inc., Tokyo, Japan) using the CIEL*A*B* scale: a* (range between green and red), b* (range between yellow and blue), and L* (luminosity index) values were recorded. Each fruit was measured twice on opposite faces at the equatorial region. The chroma value (color saturation) was calculated from a* and b* values according to the formulas described by McGuire (1992) [25].
4.4. RNA Extraction, cDNA Synthesis and qPCR Analysis
RNA samples were extracted from 100 mg of frozen F. chiloensis fruit tissue following the methodology recently described [17]. Three independent RNA extractions were prepared from each sample bulk and used for cDNA synthesis.
For real-time PCR analyses, specific primers for each gene under analysis were obtained from the literature or de novo designed from the 5′-UTR region by Primer3 (http://frodo.wi.mit.edu/primer3) (accessed on 9 September 2019) (Table S1, see Supplementary Materials). The qPCR procedure as described in [17] was carried out. qPCR reactions were carried out in triplicates.
Relative expression data correspond to the means of three biological replicates ± SE normalized against FcGAPDH (short-term ABA treatment) or Fc18S (long-term ABA treatment), employing the initial time (0 h, 0 day of control group) as a calibrator.
4.5. Extraction of Metabolites
Methanolic extracts were prepared from frozen samples. For that, 1 g of sample was homogenized in 5 mL of methanol:HCl (99:1) solution and ground in Ultraturrax (Labsynth, Brazil) for 5 min at 4000 rpm. Extracts were stirred overnight at 4 °C and then centrifuged at 10,000× g rpm for 5 min. The supernatant was collected and used for the analysis of several metabolites. Three independent methanolic extracts were prepared from each sample.
4.6. Total Phenolics Content
Determinations were performed according to Singleton et al. (1999) [26]. From methanolic extracts, dilutions with 95% methanol were prepared until reaching concentrations of 100 mg mL−1. Samples were oxidized with the Folin-Ciocalteu reagent (Sigma-Aldrich, St. Louis, MO, USA) and neutralized with 700 mM sodium carbonate (pH 10) (2 h, room temperature). Absorbance was measured at 765 nm using the Epoch microplate spectrophotometer™ 2 (Agilent Technologies, Santa Clara, CA, USA). A standard curve was prepared with gallic acid (Sigma-Aldrich, St. Louis, MO, USA), and results were expressed as mg of gallic acid equivalents per 100 g of fresh weight (GAE 100 g−1 FW).
4.7. Flavonoids Content
The colorimetric aluminum chloride method of Chang et al. (2002) [20] was employed with modifications. Diluted methanolic extracts were mixed with 0.1 mL of aluminum chloride (10%), 0.1 mL 1 M potassium acetate, and 4.7 mL of methanol (80%), and incubated for 30 min at room temperature. Absorbance was measured at 425 nm. Quercetin (Sigma-Aldrich, St. Louis, MO, USA) dissolved in ethanol 80% was used for the calibration curve (1–100 μg mL−1). Results were expressed as mg of quercetin equivalents per 100 g FW (QE 100 g−1 FW).
4.8. Anthocyanins Determination
The differential pH method described by Lee et al. (2008) [27] was followed. For that, 200 μL of the extract was mixed with 800 μL of 0.025 M potassium chloride (pH 1.0) or 800 μL of 0.4 M sodium acetate buffer (pH 4.5). After 30 min of incubation at room temperature, the absorbance at 524 and 700 nm was measured. Anthocyanin content was expressed as mg equivalent of cyanidin 3-glucoside (Sigma-Aldrich, St. Louis, MO, USA) per 100 g FW using absorbance values of A = (A524 nm − A700 nm) pH 1.0 − (A524 nm − A700 nm) pH 4.5, considering a molar extinction coefficient of 26,900.
4.9. Ferric Reducing Antioxidant Content (FRAP)
FRAP was quantified based on Benzie and Strain (1996) [28]. A ferric complex was prepared by mixing 25 mL of 300 mM sodium acetate (pH 3.6), 2.5 mL of 10 mM TPTZ (2,4,6-Tri(2-pyridyl)-s-triazine) (Sigma-Aldrich, St. Louis, MO, USA) (dissolved in 40 mM HCL) and 2.5 mL of 20 mM FeCl3∙6H2O. One hundred microliters of methanolic extract was mixed with 3 mL of FRAP reagent and incubated at 37 °C for 4 min; absorbance was measured at 593 nm. Quantification was contrasted with a Trolox standard curve (60 to 300 μM) (Sigma-Aldrich, St. Louis, MO, USA). The results were expressed in µmol Trolox equivalents per 100 g FW.
4.10. Total Antioxidant Content (DPPH)
The discoloration method of 1,1-diphenyl-2-picrylhydrazyl (DPPH) proposed by Brand-Williams et al. (1995) [29] was employed. Fifty microliters of each sample extract was diluted in methanol and mixed with 950 μL of DPPH radical reagent (0.06 mM) (Sigma-Aldrich, St. Louis, MO, USA). The mixture was incubated for 30 min at room temperature, and absorbance readings were taken at 517 nm. Methanol was used as a negative control. A calibration curve was prepared using Trolox as the standard (60 to 300 μM). Absorbance was converted to percentage antioxidant activity (AA) using AA% = 100 − ((Abs sample/Abs control) × 100). Results were expressed as μmol Trolox equivalents per 100 g FW.
4.11. Correlation Studies
Correlation analyses were performed using R software (1.3.1093) (accessed on 22 November 2021) using ‘ggplot2’ and ‘corrplot’ packages. Pearson’s correlations were obtained (significance p < 0.05).
4.12. Statistical Analysis
For color changes in response to ABA treatment, a random design with 3 biological replicates of 5 fruit each was employed, using a disappeared t-test with Bonferroni correction post hoc. Differences were considered statistically significant when p < 0.05 (*).
For gene expression analyses, the strategy reported in [17] was employed.
5. Conclusions
The data provided here indicate that ABA promotes important changes in F. chiloensis fruit at the C2 stage, such as the advancement in time of firmness reduction (reported elsewhere [17]), color development (Figure 3), and the reduction in total phenolics and antioxidants observed during its normal development (Figure 4). These phenotypic changes are coincident with the increased expression of FcPAL, FcCHS, and FcANS which could explain the advancement of color development due to anthocyanin synthesis (Figure 10). This confirms that ABA has a crucial role in the promotion of ripening-related changes such as color development and the level of antioxidants in this non-climacteric fruit.
Supplementary Materials
The following supporting information can be downloaded at: https://www.mdpi.com/article/10.3390/ijms23073854/s1.
Author Contributions
The present work was conceived and designed by E.M.-A., R.H. and M.A.M.-L.; E.M.-A. and J.G. performed qPCR analysis, quantified metabolites, and prepared the figures; E.M.-A., R.H. and M.A.M.-L. participated in the writing and discussion of the manuscript. Each author participated sufficiently in the work to take public responsibility for appropriate portions of the content. All authors read, edited. and approved the final manuscript. All authors have read and agreed to the published version of the manuscript.
Funding
This research was funded by ANID/FONDECYT grant 1210948.
Institutional Review Board Statement
Not applicable.
Data Availability Statement
All data generated or analyzed during this study are included in this published article.
Acknowledgments
Thanks to the entire lab group for their help during the experiments with fresh fruit.
Conflicts of Interest
The authors declare no conflict of interest. The funders had no role in the design of the study; in the collection, analyses, or interpretation of data; in the writing of the manuscript, or in the decision to publish the results. The authors declare that the research was conducted in the absence of any commercial or financial relationships that could be construed as a potential conflict of interest.
References
- Arena, M.E.; Postemsky, P.; Curvetto, N.R. Accumulation patterns of phenolic compounds during fruit growth and ripening of Berberis buxifolia, a native Patagonian species. N. Z. J. Bot. 2012, 50, 15–28. [Google Scholar] [CrossRef] [Green Version]
- Letelier, L.; Gaete-Eastman, C.; Peñailillo, P.; Moya-León, M.A.; Herrera, R. Southern species from the biodiversity hotspot of central Chile: A source of color, aroma, and metabolites for global agriculture and food industry in a scenario of climate change. Front. Plant Sci. 2020, 11, 1002. [Google Scholar] [CrossRef]
- Staudt, G. Taxonomic studies in the genus fragaria typification of fragaria species known at the time of linnaeus. Can. J. Bot. 1962, 40, 869–886. [Google Scholar] [CrossRef]
- Kesselmeier, J.; Staudt, M. Biogenic volatile organic compounds (VOC): An overview on emission, physiology and ecology. J. Atmos. Chem. 1999, 33, 23–88. [Google Scholar] [CrossRef]
- Cheel, J.; Theoduloz, C.; Rodriguez, J.A.; Caligari, P.D.S.; Schmeda-Hirschmann, G. Free radical scavenging activity and phenolic content in achenes and thalamus from Fragaria chiloensis ssp. chiloensis, F. vesca and F. × ananassa cv. Chandler. Food Chem. 2007, 102, 36–44. [Google Scholar] [CrossRef]
- Simirgiotis, M.J.; Theoduloz, C.; Caligari, P.D.S.; Schmeda-Hirschmann, G. Comparison of phenolic composition and antioxidant properties of two native Chilean and one domestic strawberry genotypes. Food Chem. 2009, 113, 377–385. [Google Scholar] [CrossRef]
- Molinett, S.; Nuñez, F.; Moya-León, M.A.; Zúniga-Hernández, J. Chilean strawberry consumption protects against LPS-induced liver injury by anti-inflammatory and antioxidant capability in Sprague-Dawley rats. Evid.-Based Compl. Alt. Med. 2015, 2015, 320136. [Google Scholar] [CrossRef] [PubMed] [Green Version]
- Avila, F.; Theoduloz, C.; López-Alarcón, C.; Dorta, E.; Schmeda-Hirschmann, G. Cytoprotective mechanisms mediated by polyphenols from Chilean native berries against free radical-induced damage on AGS cells. Oxid. Med. Cell. Longev. 2017, 2017, 9808520. [Google Scholar] [CrossRef]
- Parra-Palma, C.; Fuentes, E.; Palomo, I.; Torres, C.A.; Moya-León, M.A.; Ramos, P. Linking the platelet antiaggregation effect of different strawberries species with antioxidants: Metabolomic and transcript profiling of polyphenols. Bol. Latinoam. Caribe Plantas Med. Aromat. 2018, 17, 36–52. [Google Scholar]
- Figueroa, C.R.; Pimentel, P.; Gaete-Eastman, C.; Moya, M.; Herrera, R.; Caligari, P.D.S.; Moya-León, M.A. Softening rate of the Chilean strawberry (Fragaria chiloensis) fruit reflects the expression of polygalacturonase and pectate lyase genes. Postharvest Biol. Technol. 2008, 49, 210–220. [Google Scholar] [CrossRef]
- Salvatierra, A.; Pimentel, P.; Moya-León, M.A.; Caligari, P.D.S.; Herrera, R. Comparison of transcriptional profiles of flavonoid genes and anthocyanin contents during fruit development of two botanical forms of Fragaria chiloensis ssp. chiloensis. Phytochemistry 2010, 71, 1839–1847. [Google Scholar] [CrossRef] [PubMed]
- Aharoni, A.; Vos, C.H.R.D.; Wein, M.; Sun, Z.; Greco, R.; Kroon, A.; Mol, J.N.M.; O’Connell, A.P. The strawberry FaMYB1 transcription factor suppresses anthocyanin and flavonol accumulation in transgenic tobacco. Plant J. 2001, 28, 319–332. [Google Scholar] [CrossRef] [PubMed]
- Kadomura-Ishikawa, Y.; Miyawaki, K.; Takahashi, A.; Noji, S. RNAi-mediated silencing and overexpression of the FaMYB1 gene and its effect on anthocyanin accumulation in strawberry fruit. Biol. Plantarum 2015, 59, 677–685. [Google Scholar] [CrossRef]
- Salvatierra, A.; Pimentel, P.; Moya-León, M.A.; Herrera, R. Increased accumulation of anthocyanins in Fragaria chiloensis fruits by transient suppression of FcMYB1 gene. Phytochemistry 2013, 90, 25–36. [Google Scholar] [CrossRef] [PubMed]
- Jia, H.-F.; Chai, Y.-M.; Li, C.-L.; Lu, D.; Luo, J.-J.; Qin, L.; Shen, Y.-Y. Abscisic acid plays an important role in the regulation of strawberry fruit ripening. Plant Physiol. 2011, 157, 188–199. [Google Scholar] [CrossRef] [Green Version]
- Wang, H.; Zhang, H.; Yang, Y.; Li, M.; Zhang, Y.; Liu, J.; Dong, J.; Li, J.; Butelli, E.; Xue, Z.; et al. The control of red colour by a family of MYB transcription factors in octoploid strawberry (Fragaria × ananassa) fruits. Plant Biotechnol. J. 2020, 18, 1169–1184. [Google Scholar] [CrossRef] [Green Version]
- Mattus-Araya, E.; Stappung, Y.; Herrera, R.; Moya-León, M.A. Molecular actors involved in the softening of Fragaria chiloensis fruit accelerated by ABA treatment. J. Plant Growth Regul. 2022, 41, 1–16. [Google Scholar] [CrossRef]
- Parra-Palma, C.; Morales-Quintana, L.; Ramos, P. Phenolic content, color development and pigment-related gene expression: A comparative analysis in different cultivars of strawberry during the ripening process. Agronomy 2020, 10, 588. [Google Scholar] [CrossRef] [Green Version]
- Liu, W.; Feng, Y.; Yu, S.; Fan, Z.; Li, X.; Li, J.; Yin, H. The flavonoid biosynthesis network in plants. Int. J. Mol. Sci. 2021, 22, 12824. [Google Scholar] [CrossRef]
- Chang, C.-C.; Yang, M.-H.; Wen, H.-M.; Chern, J.-C. Estimation of total flavonoid content in propolis by two complementary colometric methods. J. Food Drug Anal. 2002, 10, 178–182. [Google Scholar] [CrossRef]
- Allan, A.C.; Hellens, R.P.; Laing, W.A. MYB transcription factors that colour our fruit. Trends Plant Sci. 2008, 13, 99–102. [Google Scholar] [CrossRef] [PubMed]
- Allan, A.C.; Espley, R.V. MYBs drive novel consumer traits in fruits and vegetables. Trends Plant Sci. 2018, 23, 693–705. [Google Scholar] [CrossRef] [PubMed]
- Dubos, C.; Stracke, R.; Grotewold, E.; Weisshaar, B.; Martin, C.; Lepiniec, L. MYB transcription factors in Arabidopsis. Trends Plant Sci. 2010, 15, 573–581. [Google Scholar] [CrossRef] [PubMed]
- Schaart, J.G.; Dubos, C.; De La Fuente, I.R.; van Houwelingen, A.M.M.L.; de Vos, R.C.H.; Jonker, H.H.; Xu, W.; Routaboul, J.-M.; Lepiniec, L.; Bovy, A.G. Identification and characterization of MYB-bHLH-WD40 regulatory complexes controlling proanthocyanidin biosynthesis in strawberry (Fragaria × ananassa) fruits. New Phytol. 2013, 197, 454–467. [Google Scholar] [CrossRef] [PubMed]
- McGuire, R.G. Reporting of objective color measurements. HortScience 1992, 27, 1254–1255. [Google Scholar] [CrossRef] [Green Version]
- Singleton, V.L.; Orthofer, R.; Lamuela-Raventós, R.M. Analysis of total phenols and other oxidation substrates and antioxidants by means of folin-ciocalteu reagent. In Methods in Enzymology; Academic Press: Cambridge, MA, USA, 1999; Volume 299, pp. 152–178. [Google Scholar] [CrossRef]
- Lee, J.; Rennaker, C.; Wrolstad, R.E. Correlation of two anthocyanin quantification methods: HPLC and spectrophotometric methods. Food Chem. 2008, 110, 782–786. [Google Scholar] [CrossRef]
- Benzie, I.F.F.; Strain, J.J. The ferric reducing ability of plasma (FRAP) as a measure of “antioxidant power”: The FRAP assay. Anal. Biochem. 1996, 239, 70–76. [Google Scholar] [CrossRef] [Green Version]
- Brand-Williams, W.; Cuvelier, M.E.; Berset, C. Use of a free radical method to evaluate antioxidant activity. LWT Food Sci. Technol. 1995, 28, 25–30. [Google Scholar] [CrossRef]
Publisher’s Note: MDPI stays neutral with regard to jurisdictional claims in published maps and institutional affiliations. |
© 2022 by the authors. Licensee MDPI, Basel, Switzerland. This article is an open access article distributed under the terms and conditions of the Creative Commons Attribution (CC BY) license (https://creativecommons.org/licenses/by/4.0/).