Abstract
To develop novel inorganic red pigments without harmful elements, we focused on the band structure of Ca2(Mg, Co)WO6 and attempted to narrow its bandgap by replacing the W6+ sites in the host structure of Mo6+. Ca2Mg1−xCoxW1−yMoyO6 (0.10 ≤ x ≤ 0.30; 0.45 ≤ y ≤ 0.60) samples were synthesized by a sol-gel method using citric acids, and the crystal structure, optical properties, and color of the samples were characterized. The Ca2Mg1−xCoxW1−yMoyO6 solid solution was successfully formed, which absorbed visible light at wavelengths below 600 nm. In addition, the absorption wavelength shifted to longer wavelengths with increasing Mo6+ content. This is because a new conduction band composed of a Co3d-W5d-Mo4d hybrid orbital was formed by Mo6+ doping to reduce the bandgap energy. Thus, the color of the samples gradually changed from pale orange to dark red, with a hue angle (h°) of less than 35°. Based on the above results, the optical absorption wavelength of the Ca2Mg1−xCoxW1−yMoyO6 system can be controlled to change the color by adjusting the bandgap energy.
1. Introduction
Inorganic pigments have been utilized for the coloration of ceramics, plastics, glasses, etc., because of their high thermal stability, light resistance, and hiding power. Red inorganic pigments, which indicate warning colors, have been in large demand for applications such as traffic paints. Minium (Pb3O4·2PbO·PbO2), vermilion (HgS), and cadmium red (CdS·CdSe) were used as the red inorganic pigments. Although they exhibit a vivid red color and excellent durability, they contain highly toxic elements, such as Pb, Hg, Cd, and Se, which have negative effects on the human body and environment. Therefore, they are either regulated or banned worldwide. This regulation affects various inorganic materials and is not limited to pigments. For example, toxic HgCl2 catalysts have been made to be replaced by mercury-free catalysts [1]. In this context, the development of environmentally friendly inorganic pigments containing less or no toxic elements has been strongly desired to replace existing harmful inorganic pigments.
Recently, sulfides and oxynitride-based pigments such as Ce2S3 and Ca1−xLaxTaO2−xN1+x have attracted attention as very brilliant color materials [2,3,4]. However, the chemical stability of sulfide pigments is poor and may cause discoloration when mixed with other pigments. The synthesis of oxynitride pigments requires a prolonged flow of toxic ammonia gas. In addition, sulfur oxide or nitrogen oxide gases are generated during calcination. Thus, oxide pigments are preferred for practical use because they are chemically stable. Although several studies have been reported on oxide pigments [5,6,7,8,9,10,11,12,13], environmentally benign reddish inorganic pigments are not yet comparable to conventionally harmful ones.
In this study, we focus on divalent Co ions (Co2+) to develop a novel red inorganic pigment. Octahedrally coordinated Co2+ ions are expected to exhibit a red or reddish violet color because they absorb green visible light between 490 and 560 nm based on the d–d transition attributed to 4T1(F) → 4T1(P) [14,15,16]. LiCoPO4 and (Zn1−xCox)Al2O4 with Co2+ ions have been studied for the development of reddish pigments [15,16], and cobalt violet (Co3(PO4)2) is well known as commercially available. Although there are many materials containing Co for pigments, alloys, catalysis, etc. [17,18,19,20], the Co content tends to be reduced to avoid price escalation because of its high cost. Against this background, there have been many studies on the development of inorganic pigments with low Co contents [21,22,23,24,25,26].
Here, we adopted double-perovskite-type Ca2MgWO6 as a host material for novel inorganic red pigments. Double-perovskite-type oxides are generally referred to as A2BB′O6, where A is a cation with a large ionic radius, B and B’ are cations smaller than A, and the total valences of A, B, and B’ are +12. Ca2MgWO6 has a space group of P21/n and a monoclinic structure, which consists of 8-coordinate Ca2+ at the A site and 6-coordinate octahedral [MgO6] and [WO6] alternating at the B and B’ sites [27,28]. In addition, Ca2MgWO6 is a promising phosphor candidate because of its excellent fluorescent properties [27,28,29]; however, few studies have been conducted on this topic.
From the above, we synthesized Ca2Mg1−xCoxWO6 (0 ≤ x ≤ 0.50) samples that were partially substituted with Co2+ at the Mg2+ site of the Ca2MgWO6 host structure and evaluated their color. Upon substitution with Co2+, the samples became light orange, and the color of the samples changed to brown as the Co2+ content increased, enhancing the light absorption attributed to the d–d transition of Co2+. Among these samples, Ca2Mg1−xCoxWO6 (0.10 ≤ x ≤ 0.30) can be a reddish pigment by strengthening the absorbance of the green-light region between 490 and 560 nm while maintaining the reflectance of the red-light region between 605 and 750 nm.
For the double-perovskite structure of Ca2NiWO6, the bandgap energy can be reduced by partially replacing the W6+ site with Mo6+ [30]. The band structure of Ca2NiWO6 as shown in Figure 1 has a valence band with an orbital hybridized by the t2g orbital of the Ni3d and O2p orbitals and two conduction bands: the low-energy eg orbital of Ni3d and the high-energy W5d orbital [30,31]. By substituting Mo6+ for the W6+ site in this compound, a conduction band composed of the Ni3d-W5d-Mo4d hybrid orbital was newly formed, and the bandgap energy was reduced [30]. In this study, we attempted to replace the W6+ site in the host structure with Mo6+ to narrow the bandgap and exert a red color by expanding the light absorption wavelength to longer wavelengths. In other words, the Ca2Mg1−xCoxW1−yMoyO6 (0.10 ≤ x ≤ 0.30; 0.45 ≤ y ≤ 0.60) samples were synthesized, and their color was evaluated.
Figure 1.
Schematic illustration of band structure for (a) Ca2NiWO6 and (b) Ca2Ni(W, Mo)O6. The black arrows indicate the band gap energy of the host compound, whereas the red arrows indicate the band gap energy of the Mo-doped compound.
2. Results and Discussion
2.1. Ca2Mg1−xCoxWO6 (0 ≤ x ≤ 0.50)
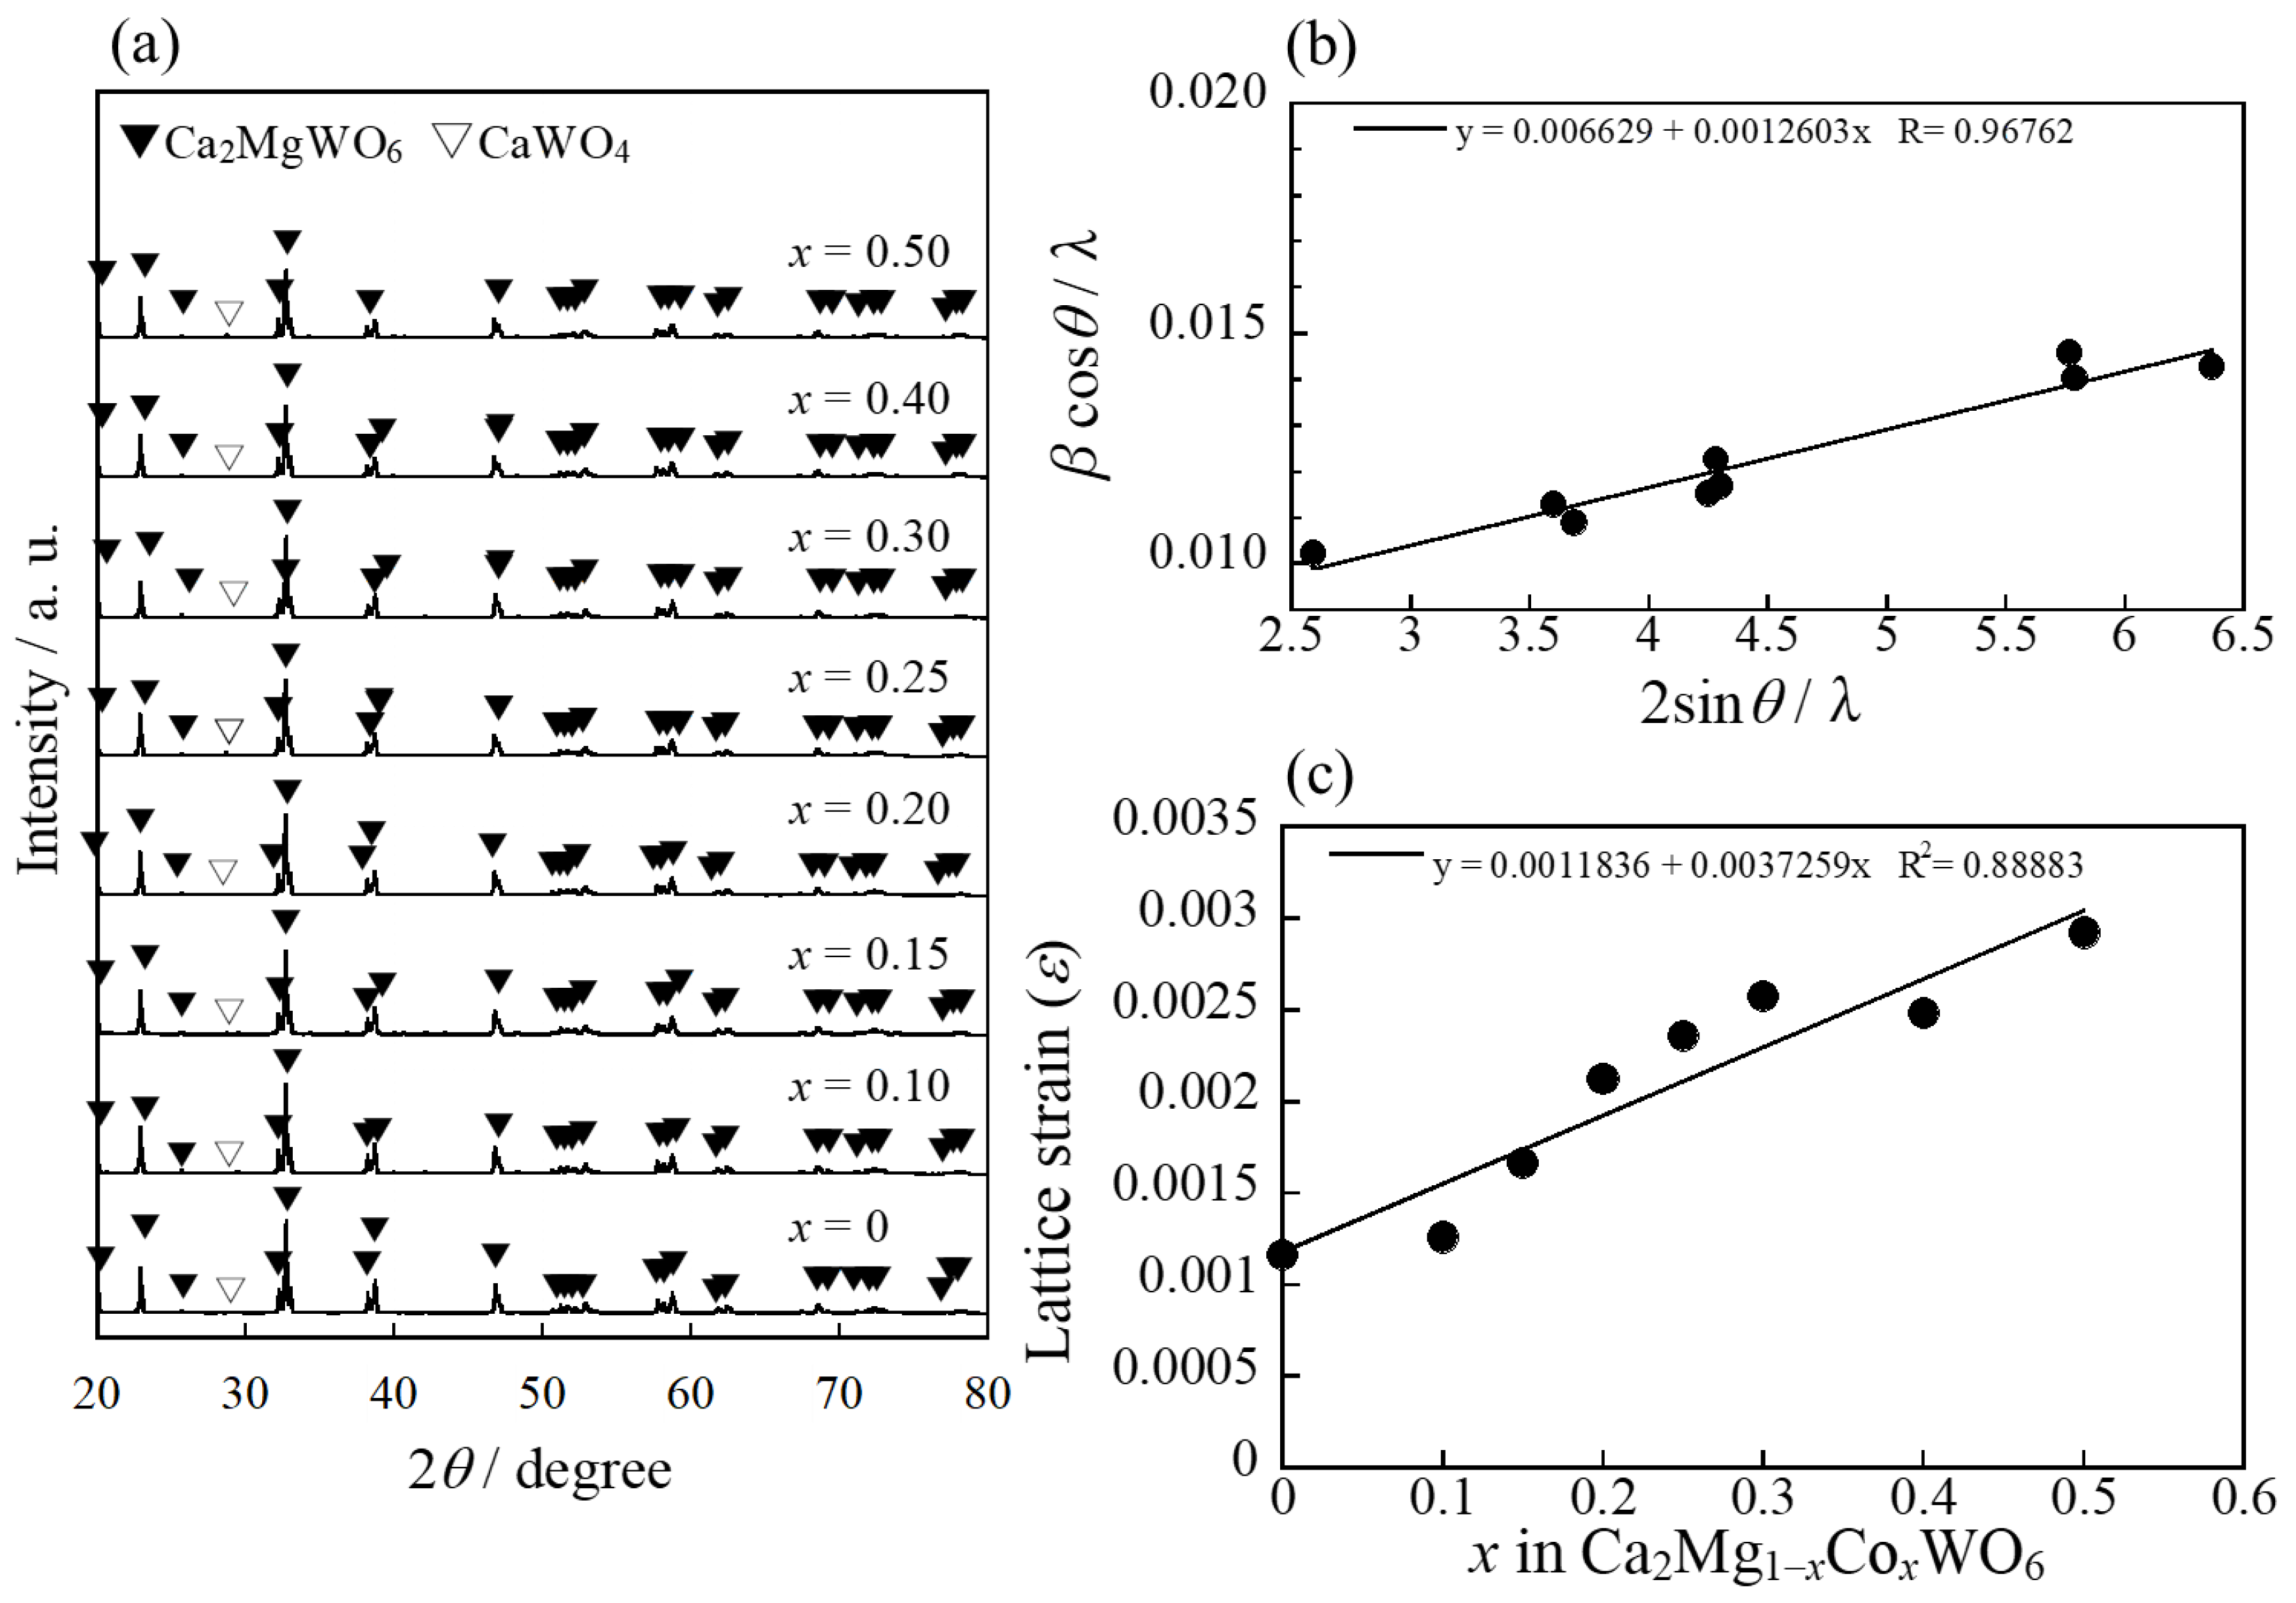
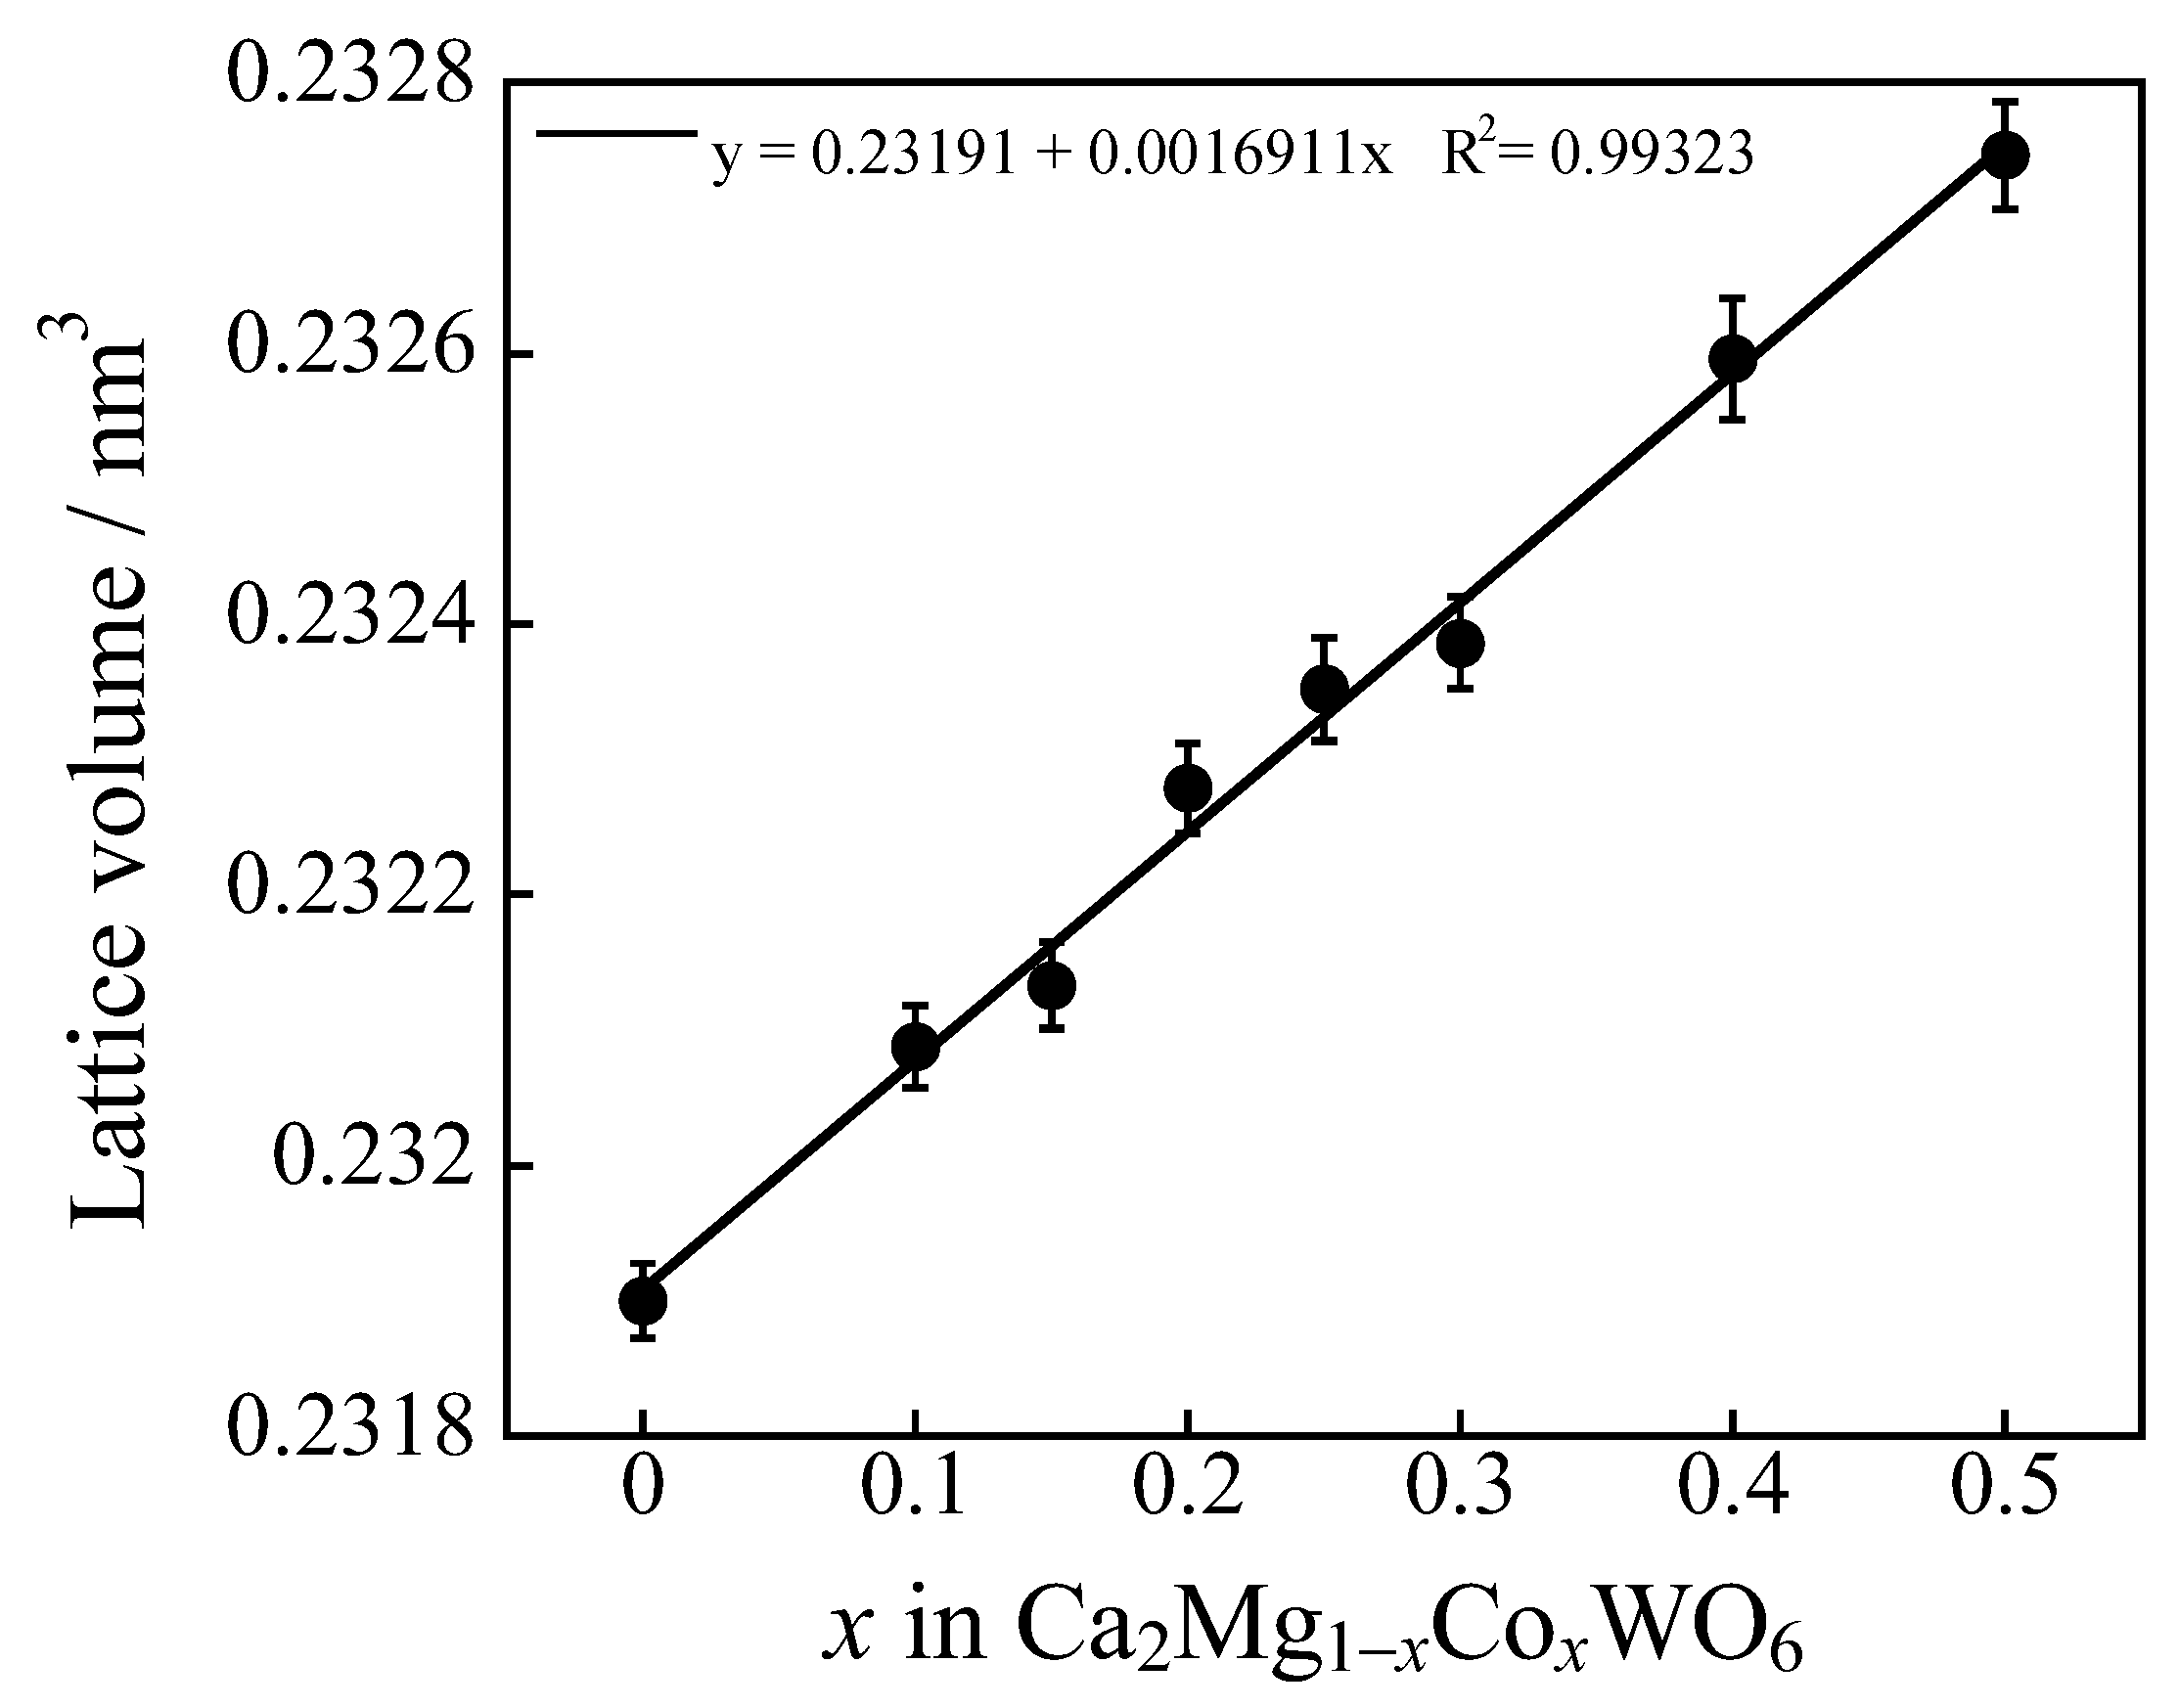
2.1.1. X-ray Powder Diffraction
Figure 2a shows the X-ray powder diffraction (XRD) patterns of the Ca2Mg1−xCoxWO6 (0 ≤ x ≤ 0.50) samples. The Ca2MgWO6 phase was obtained for all samples as the main phase, but a few peaks of CaWO4 were observed as an impurity phase.
Figure 2.
(a) XRD pattern of the Ca2Mg1−xCoxWO6 (0 ≤ x ≤ 0.50) samples; (b) Williamson-Hall (W-H) plot of Ca2MgWO6; and (c) composition dependence of lattice strain (ε) calculated by W-H analysis.
To investigate the lattice strain of these samples, a Williamson-Hall (W-H) analysis was conducted following the equation βcosθ/λ = 2εsinθ/λ + K/D, where K = 0.94 and β, θ, λ, D, and ε represent the peak width at half-maximum intensity, diffraction position, wavelength of radiation, crystallite size, and strain component, respectively [32,33]. The W-H plot of Ca2MgWO6 is shown in Figure 2b, where the slope and intercept represent the strain component and crystallite size, respectively. The lattice strain of all the samples was also estimated using the W-H plot and is summarized in Figure 2c. The lattice strain of the samples increased with increasing Co content, indicating that Co2+ was partially introduced into the host lattice. Therefore, the probability of the d–d transition of Co2+ should increase with the Co concentration in these systems.
The Ca2MgWO6 double-perovskite structure was illustrated by the VESTA program [34], as shown in Figure 3. It has octahedral Mg2+ sites that can be partially replaced by Co2+ ions. The composition dependence of the lattice volume of the samples, calculated from each XRD pattern, is shown in Figure 4. The lattice volume of the samples increased monotonically with good linearity (determination coefficient: R2 > 0.99) by increasing the Co2+ content in the 0 ≤ x ≤ 0.50 range. This phenomenon means that larger Co2+ (ionic radius: 0.0745 nm, 6-coordination site [35]) ions were partially introduced into the Mg2+ (ionic radius: 0.072 nm, 6-coordination site [35]) sites of the host structure. Thus, Ca2Mg1−xCoxWO6 (0 ≤ x ≤ 0.50) solid solutions were successfully synthesized.
Figure 3.
Crystal structure of double-perovskite Ca2MgWO6; Ca: blue, Mg: orange, W: gray, O: red.
Figure 4.
Composition dependence of the lattice volume of the Ca2Mg1−xCoxWO6 (0 ≤ x ≤ 0.50) samples.
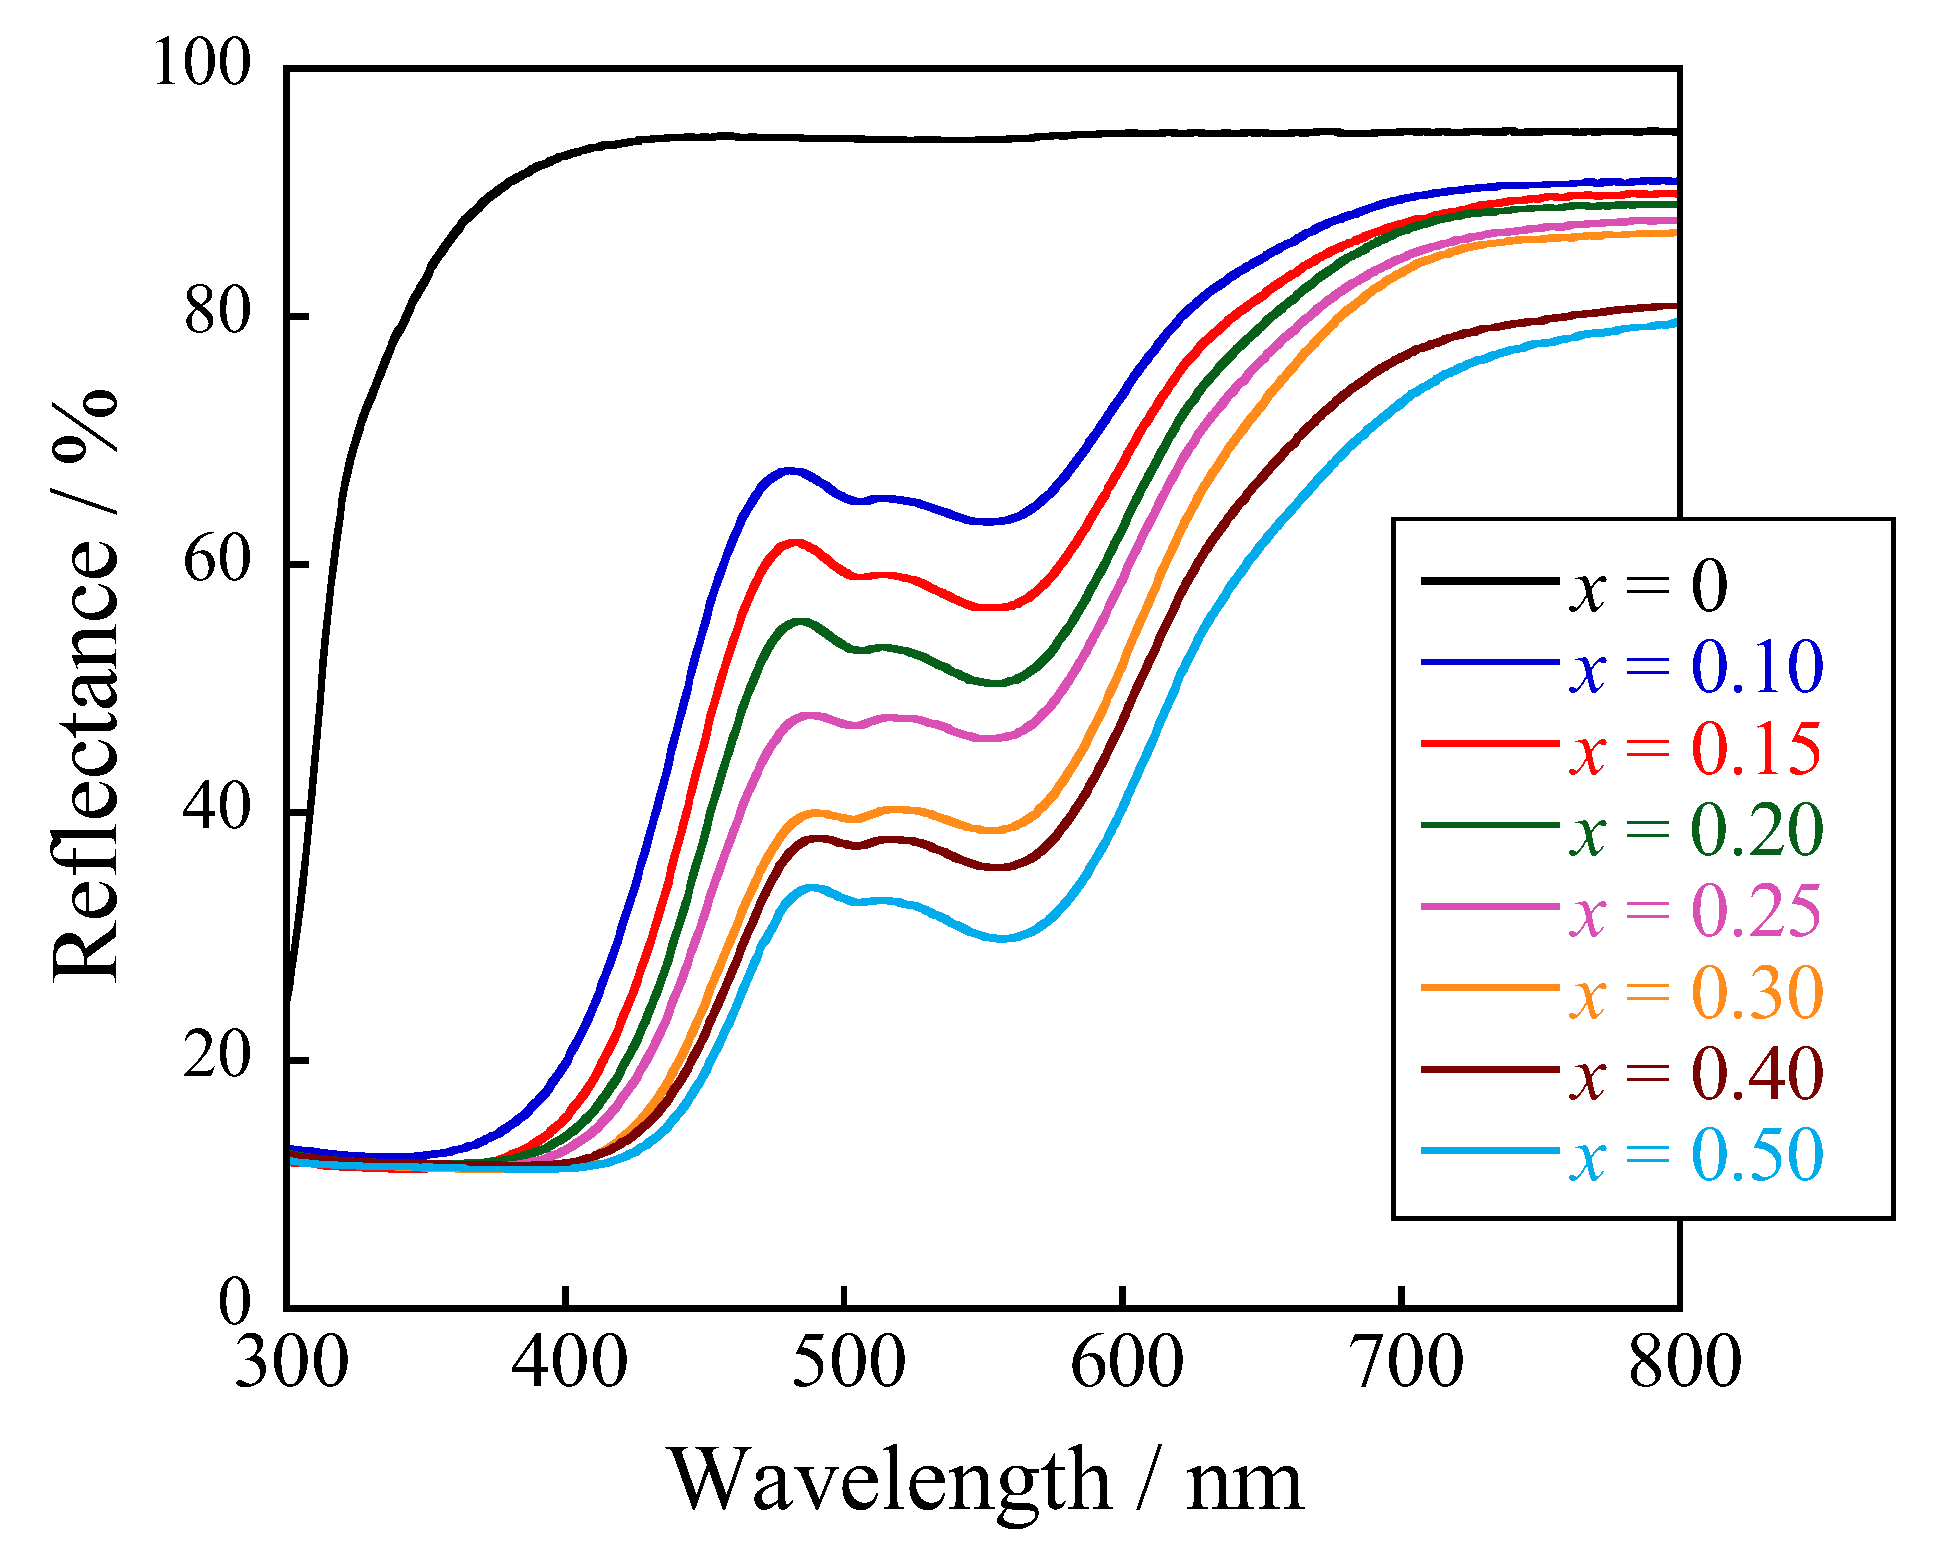
2.1.2. Ultraviolet–Visible Reflectance Spectra
The optical properties of the Ca2Mg1−xCoxWO6 (0 ≤ x ≤ 0.50) samples were evaluated by ultraviolet–visible (UV–vis) reflectance spectroscopy. The UV–vis reflectance spectra of the samples are shown in Figure 5. Ca2MgWO6 (x = 0), as a host compound, strongly reflected all visible light regions. In contrast, the samples with Co2+ absorbed visible light at wavelengths of 350 nm and between 500 and 600 nm. The former light absorption at approximately 350 nm was attributed to the ligand-to-metal charge transfer (LMCT) transition of O2— to Co2+ [36], and the latter between 500 and 600 nm was assigned to the d–d transition (4T1(F) → 4T1(P)) of Co2+ [14,15,16]. The absorption wavelength for the LMCT transition of Co2+ shifted to longer wavelengths with the Co2+ content owing to lattice volume expansion, leading to longer Co–O bond lengths. In addition, the optical absorption based on the d–d transition was enhanced with increasing Co2+ concentration, as shown in Figure 2c. This d–d transition (4T1(F) → 4T1(P)) is a spin-allowed transition, and the transition probability increases with not only the Co2+ content but also the lattice strain.
Figure 5.
UV–vis reflectance spectra of the Ca2Mg1−xCoxWO6 (0 ≤ x ≤ 0.50) samples.
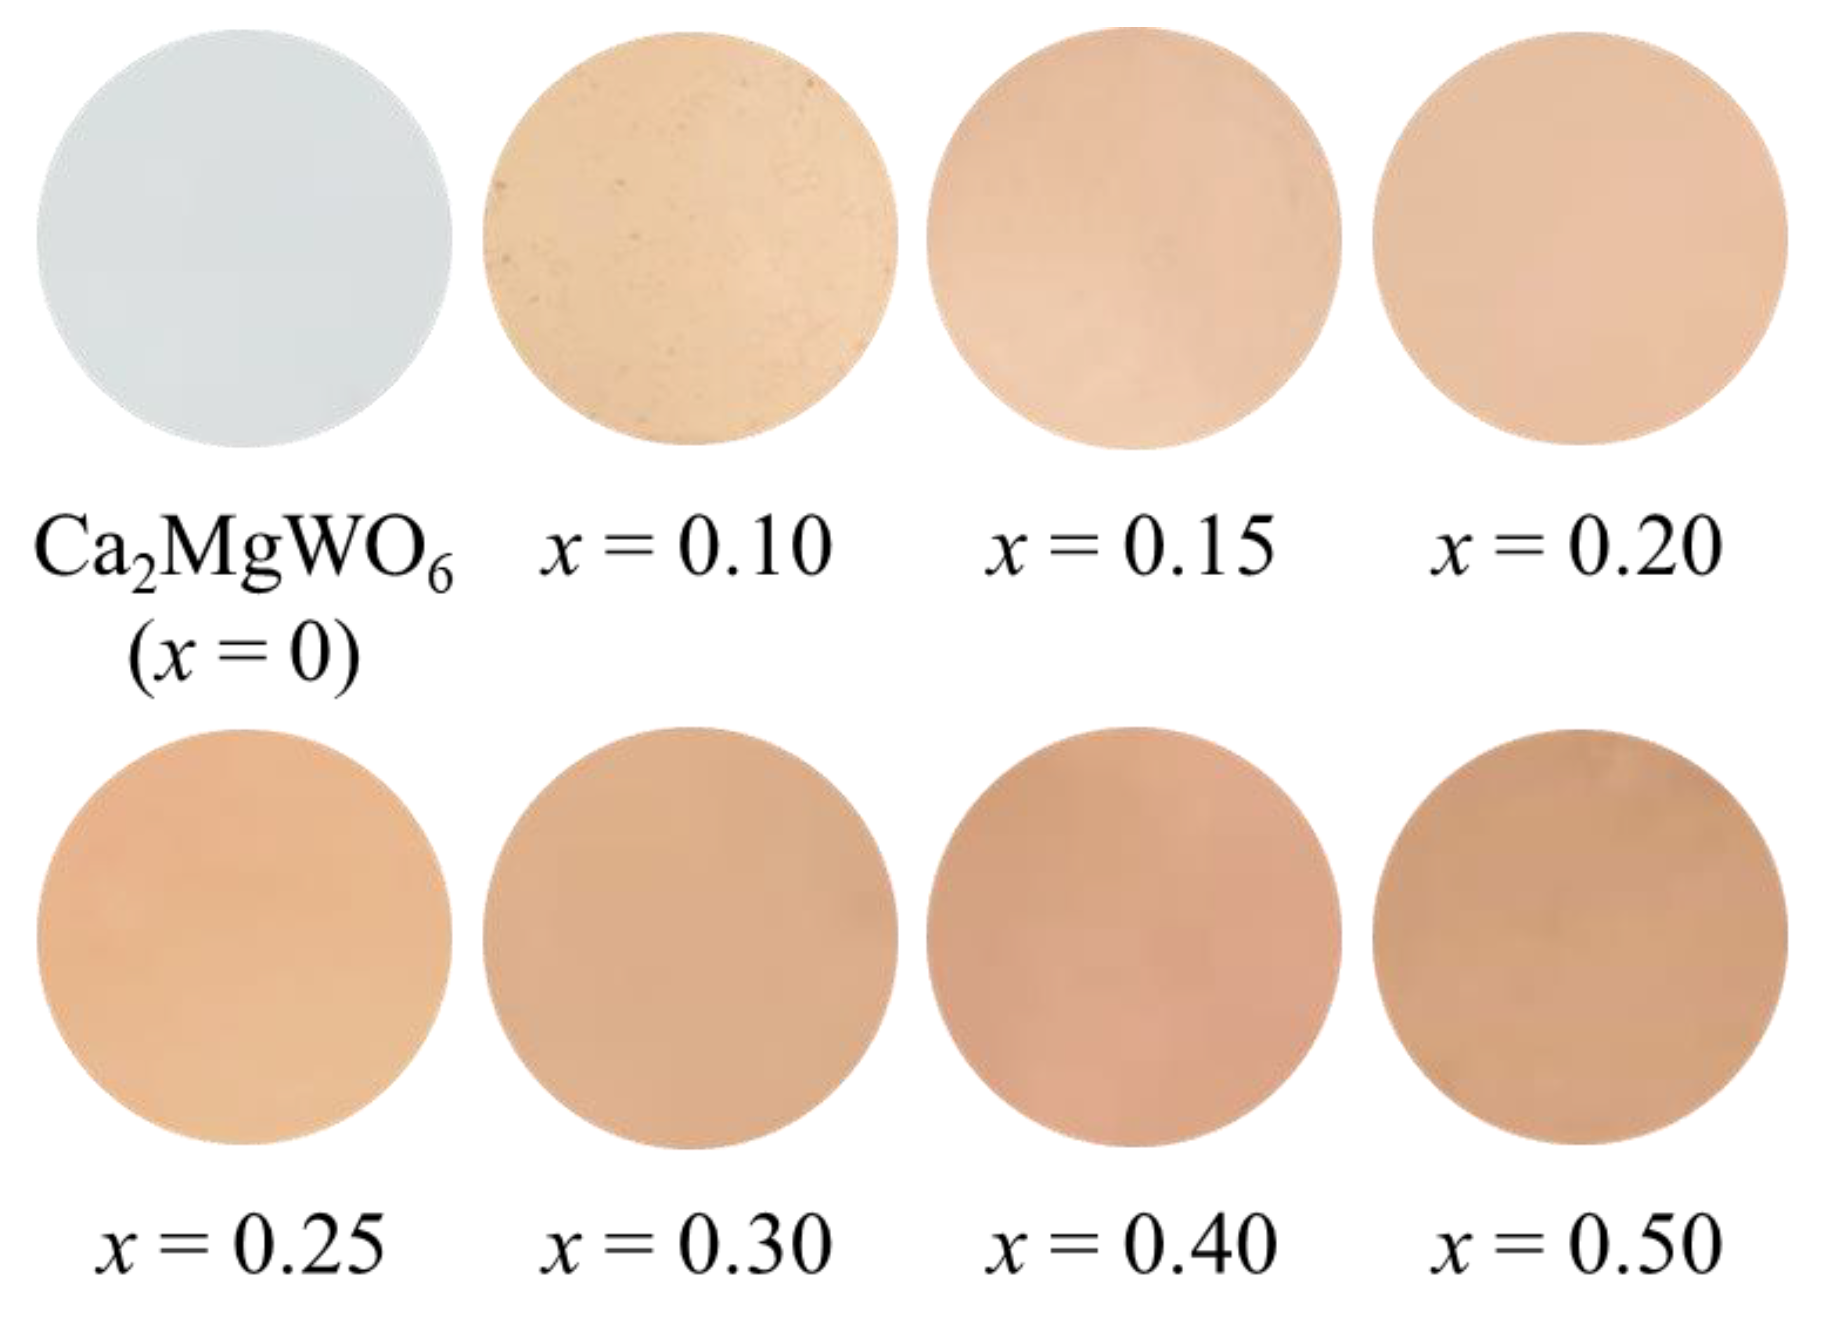
2.1.3. Color Property
The L*a*b*Ch° color coordinate data for the Ca2Mg1−xCoxWO6 (0 ≤ x ≤ 0.50) powder samples are listed in Table 1. Photographs of the samples are shown in Figure 6. In the case of x = 0, the sample strongly reflected visible light and exhibited a white color. In contrast, for x ranging from 0.10 to 0.50, light absorption in the green light region around 490–560 nm increased with increasing Co content. Since the brightness (L*) decreased and the redness (a*) as well as the yellowness (b*) increased, the sample color showed a pale orange for x ranging from 0.10 to 0.30 and brown for x ranging over 0.40. Thus, it was found that a reddish pigment could not be realized by doping the host lattice with only Co.
Table 1.
Color coordinates of the Ca2Mg1−xCoxWO6 (0 ≤ x ≤ 0.50) samples.
Figure 6.
Photographs of the Ca2Mg1−xCoxWO6 (0 ≤ x ≤ 0.50) powder samples.
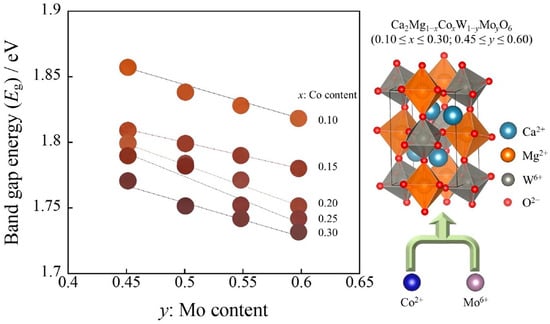
2.2. Ca2Mg1−xCoxW1−yMoyO6 (0.10 ≤ x ≤ 0.30; 0.45 ≤ y ≤ 0.60)
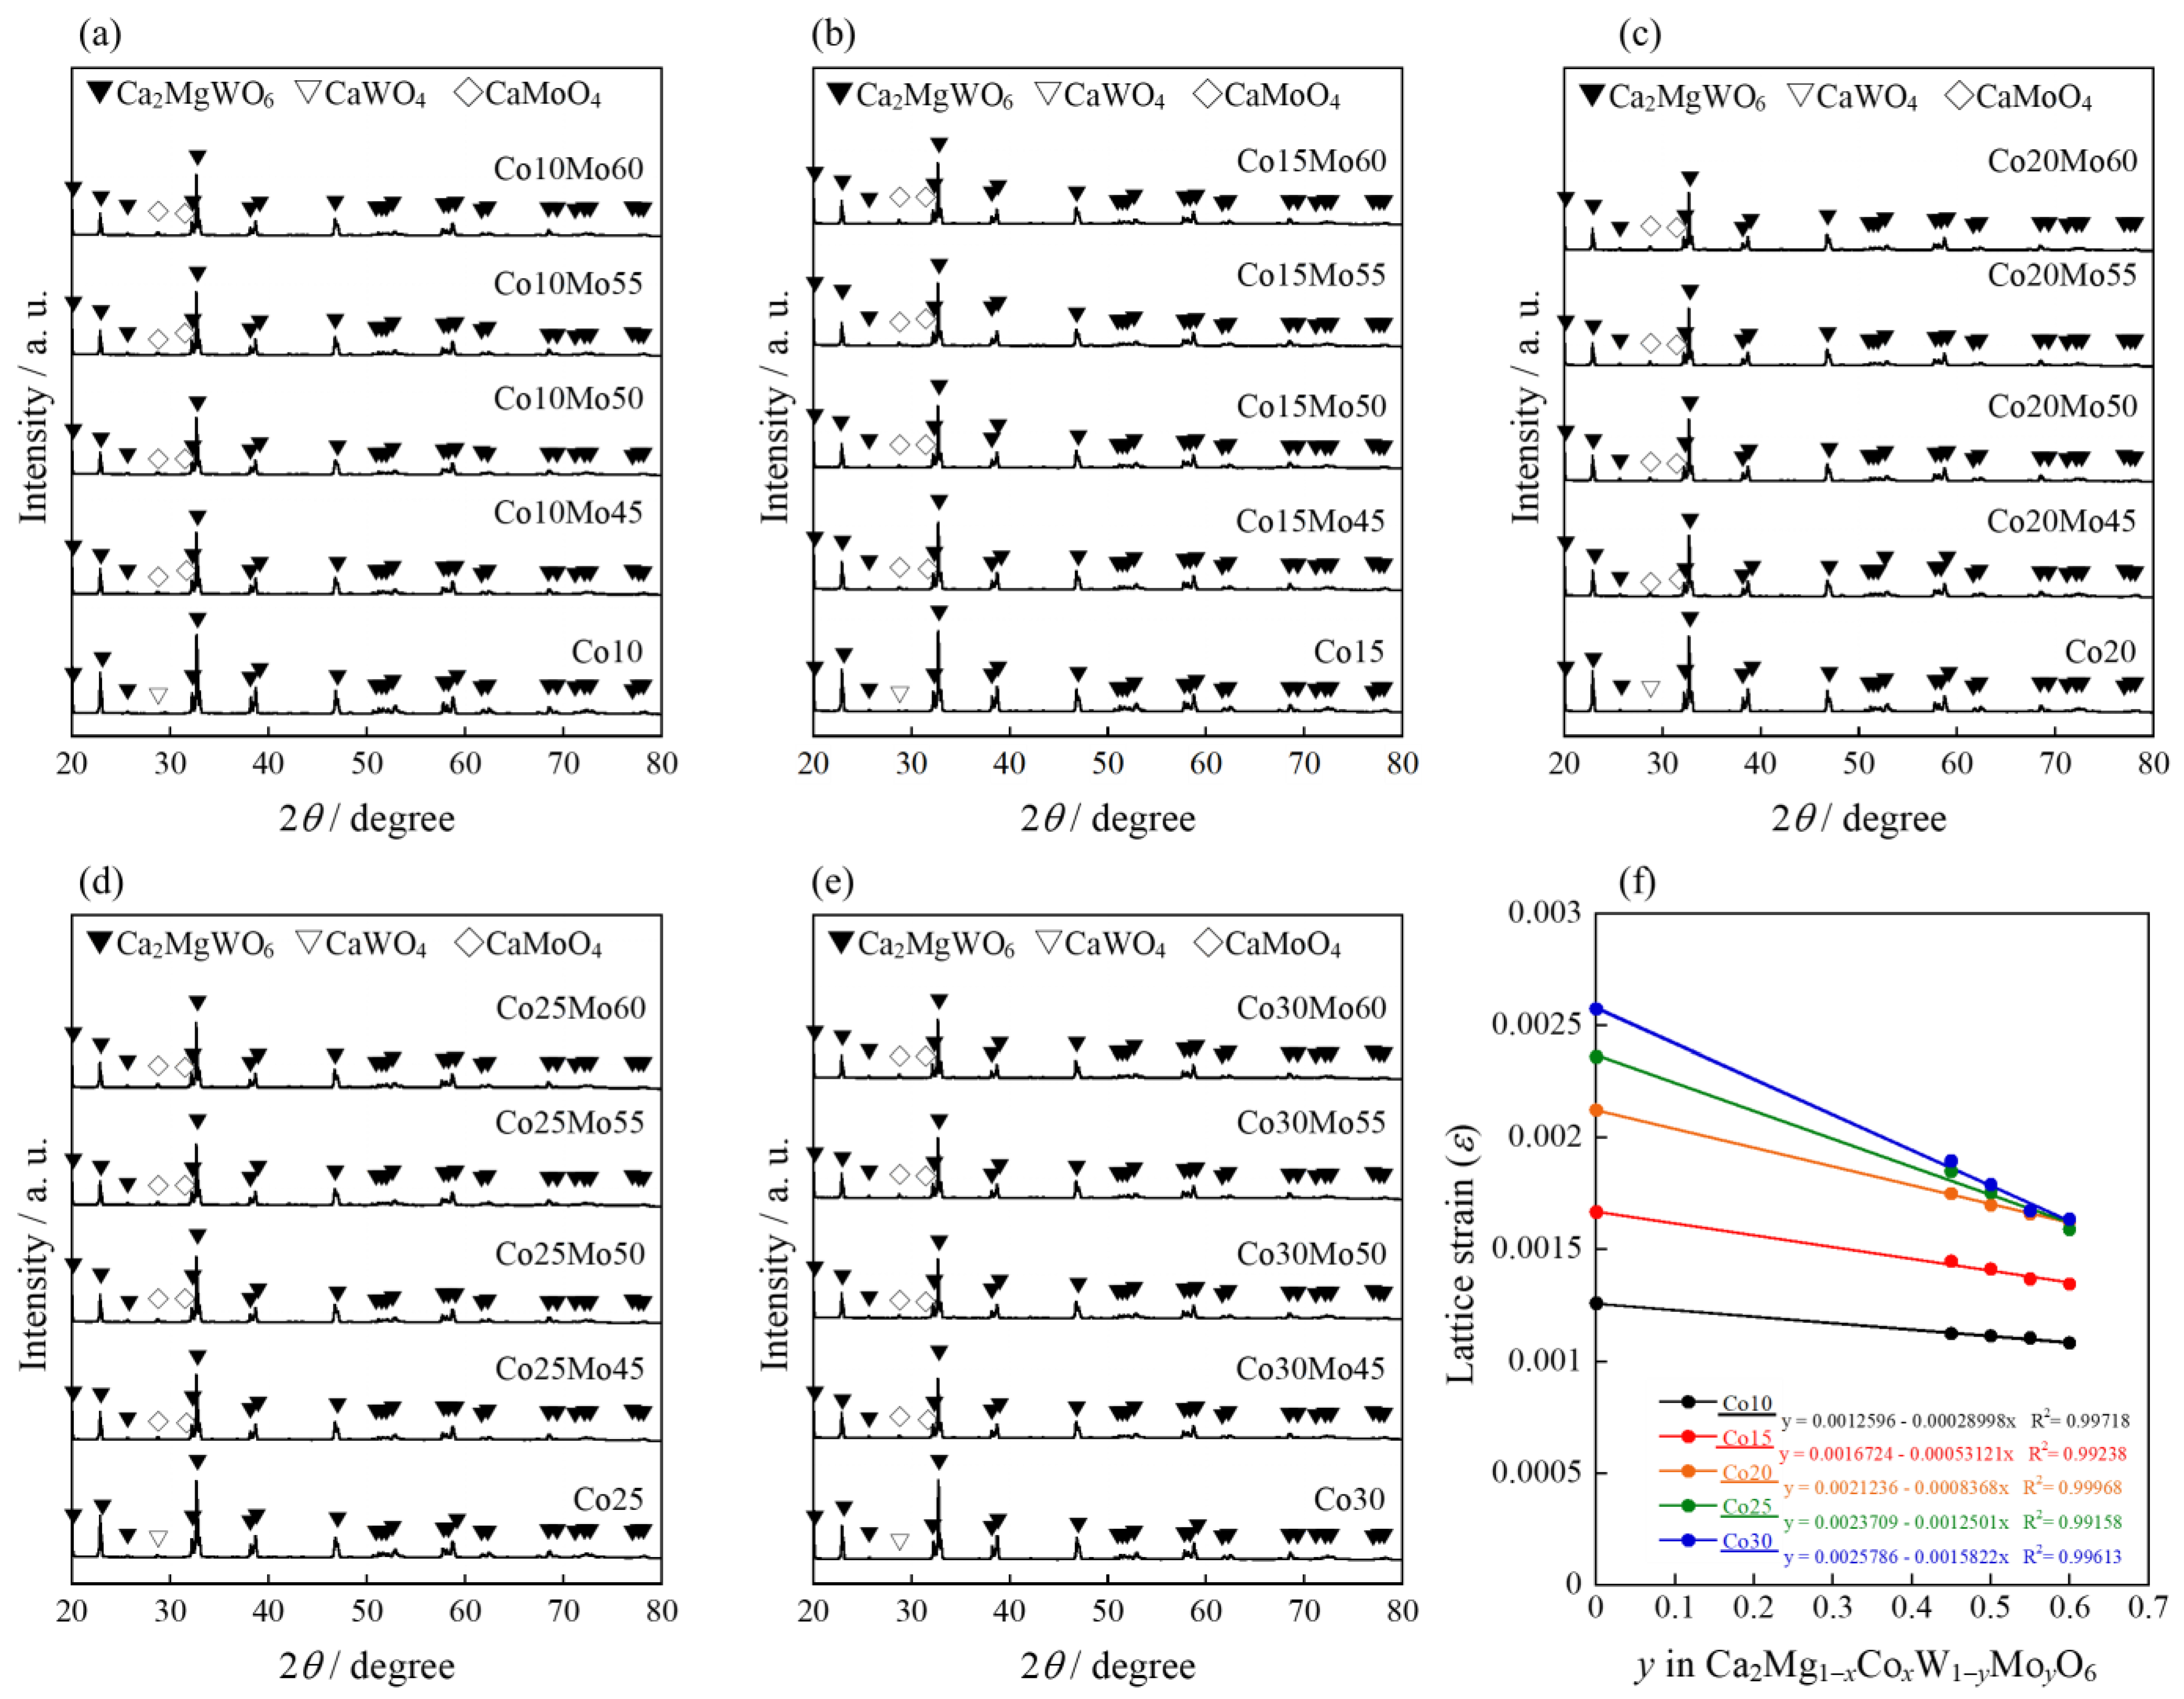
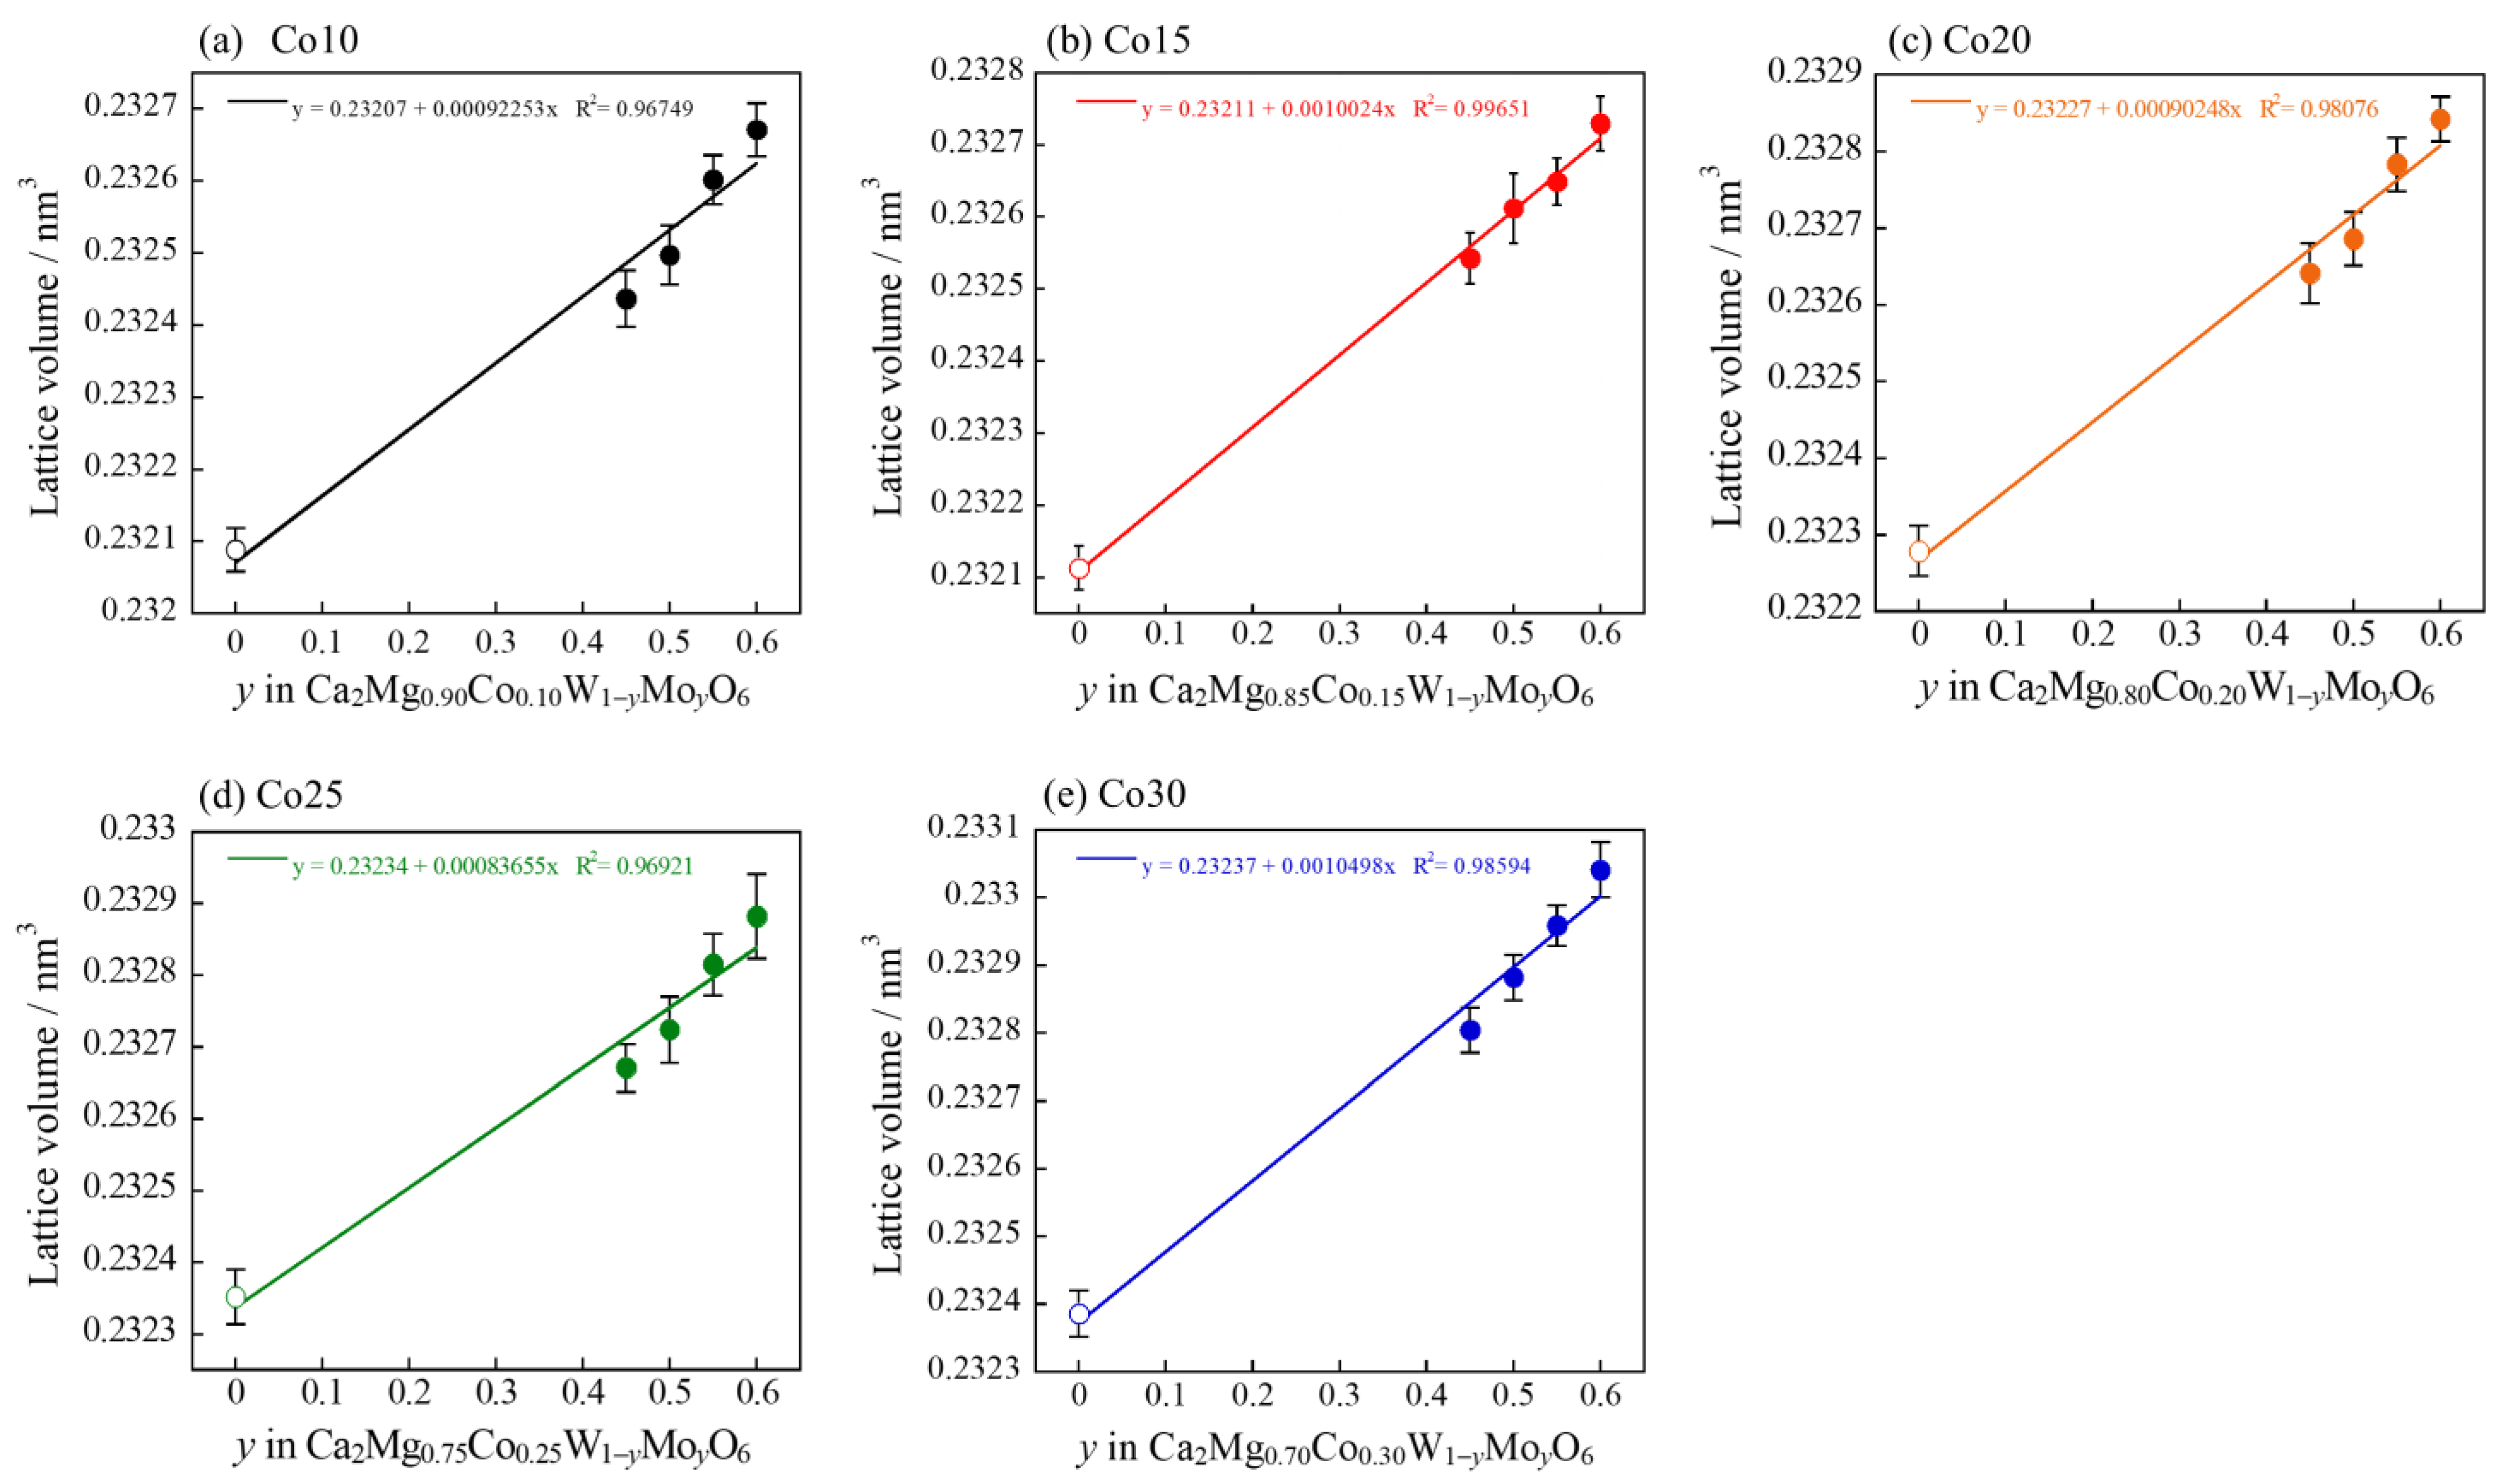
2.2.1. X-ray Powder Diffraction
The Co2+-doped samples, Ca2Mg1−xCoxWO6 (0.10 ≤ x ≤ 0.50), exhibited a pale orange or brown color, and reddish pigments were not obtained. To improve their color, Ca2Mg1−xCoxW1−yMoyO6 (0.10 ≤ x ≤ 0.30; 0.45 ≤ y ≤ 0.60), in which the W6+ site of pale orange Ca2Mg1−xCoxWO6 was partially replaced by Mo6+, was synthesized and characterized. These samples are hereafter referred to as CoaMob, where a and b are the Co and Mo content, respectively. (For example, when Co content is 10% and Mo content is 50%, the sample is described as Co10Mo50.)
The XRD patterns of the CoaMob powder samples are shown in Figure 7a–e. For comparison, the XRD patterns of the CoaMo0 samples are also shown. Although the target Ca2MgWO6 phase was obtained as the main phase for all samples, a few peaks of CaMoO4 were detected as impurities, resulting in a mixed phase. The lattice strain of all the samples was estimated using a W-H plot, as summarized in Figure 7f. The lattice strain of the samples decreased with increasing Mo content, indicating that Mo6+ was partially introduced into the host lattice.
Figure 7.
XRD patterns of the CoaMob samples: (a) a = 10; (b) a = 15; (c) a = 20; (d) a = 25; and (e) a = 30. (f) Composition dependence of lattice strain (ε) for CoaMob calculated by W−H analysis.
The dependence of the lattice volume on the composition of all the samples calculated from each XRD pattern is shown in Figure 8. The introduction of smaller Mo6+ ions (ionic radius: 0.0590 nm at the 6-coordination site [35]) into the W6+ sites (ionic radius: 0.060 nm at the 6-coordination site [35]) should result in a decrease in lattice volume with increasing Mo6+ content. However, the lattice volume of the CoaMob samples increased linearly. This is because W6+, which has a higher electronegativity (6-coordination: 2.175 [37]) in the Ca2(Mg, Co)WO6 structure, was partially replaced by Mo6+ with less electronegativity (6-coordination: 2.101 [37]), extending the bond length for W/Mo–O to expand the lattice volume. Thus, the synthesized samples successfully formed solid solutions.
Figure 8.
Composition dependence of the lattice volume of the CoaMob samples: (a) a = 10; (b) a = 15; (c) a = 20; (d) a = 25; and (e) a = 30.
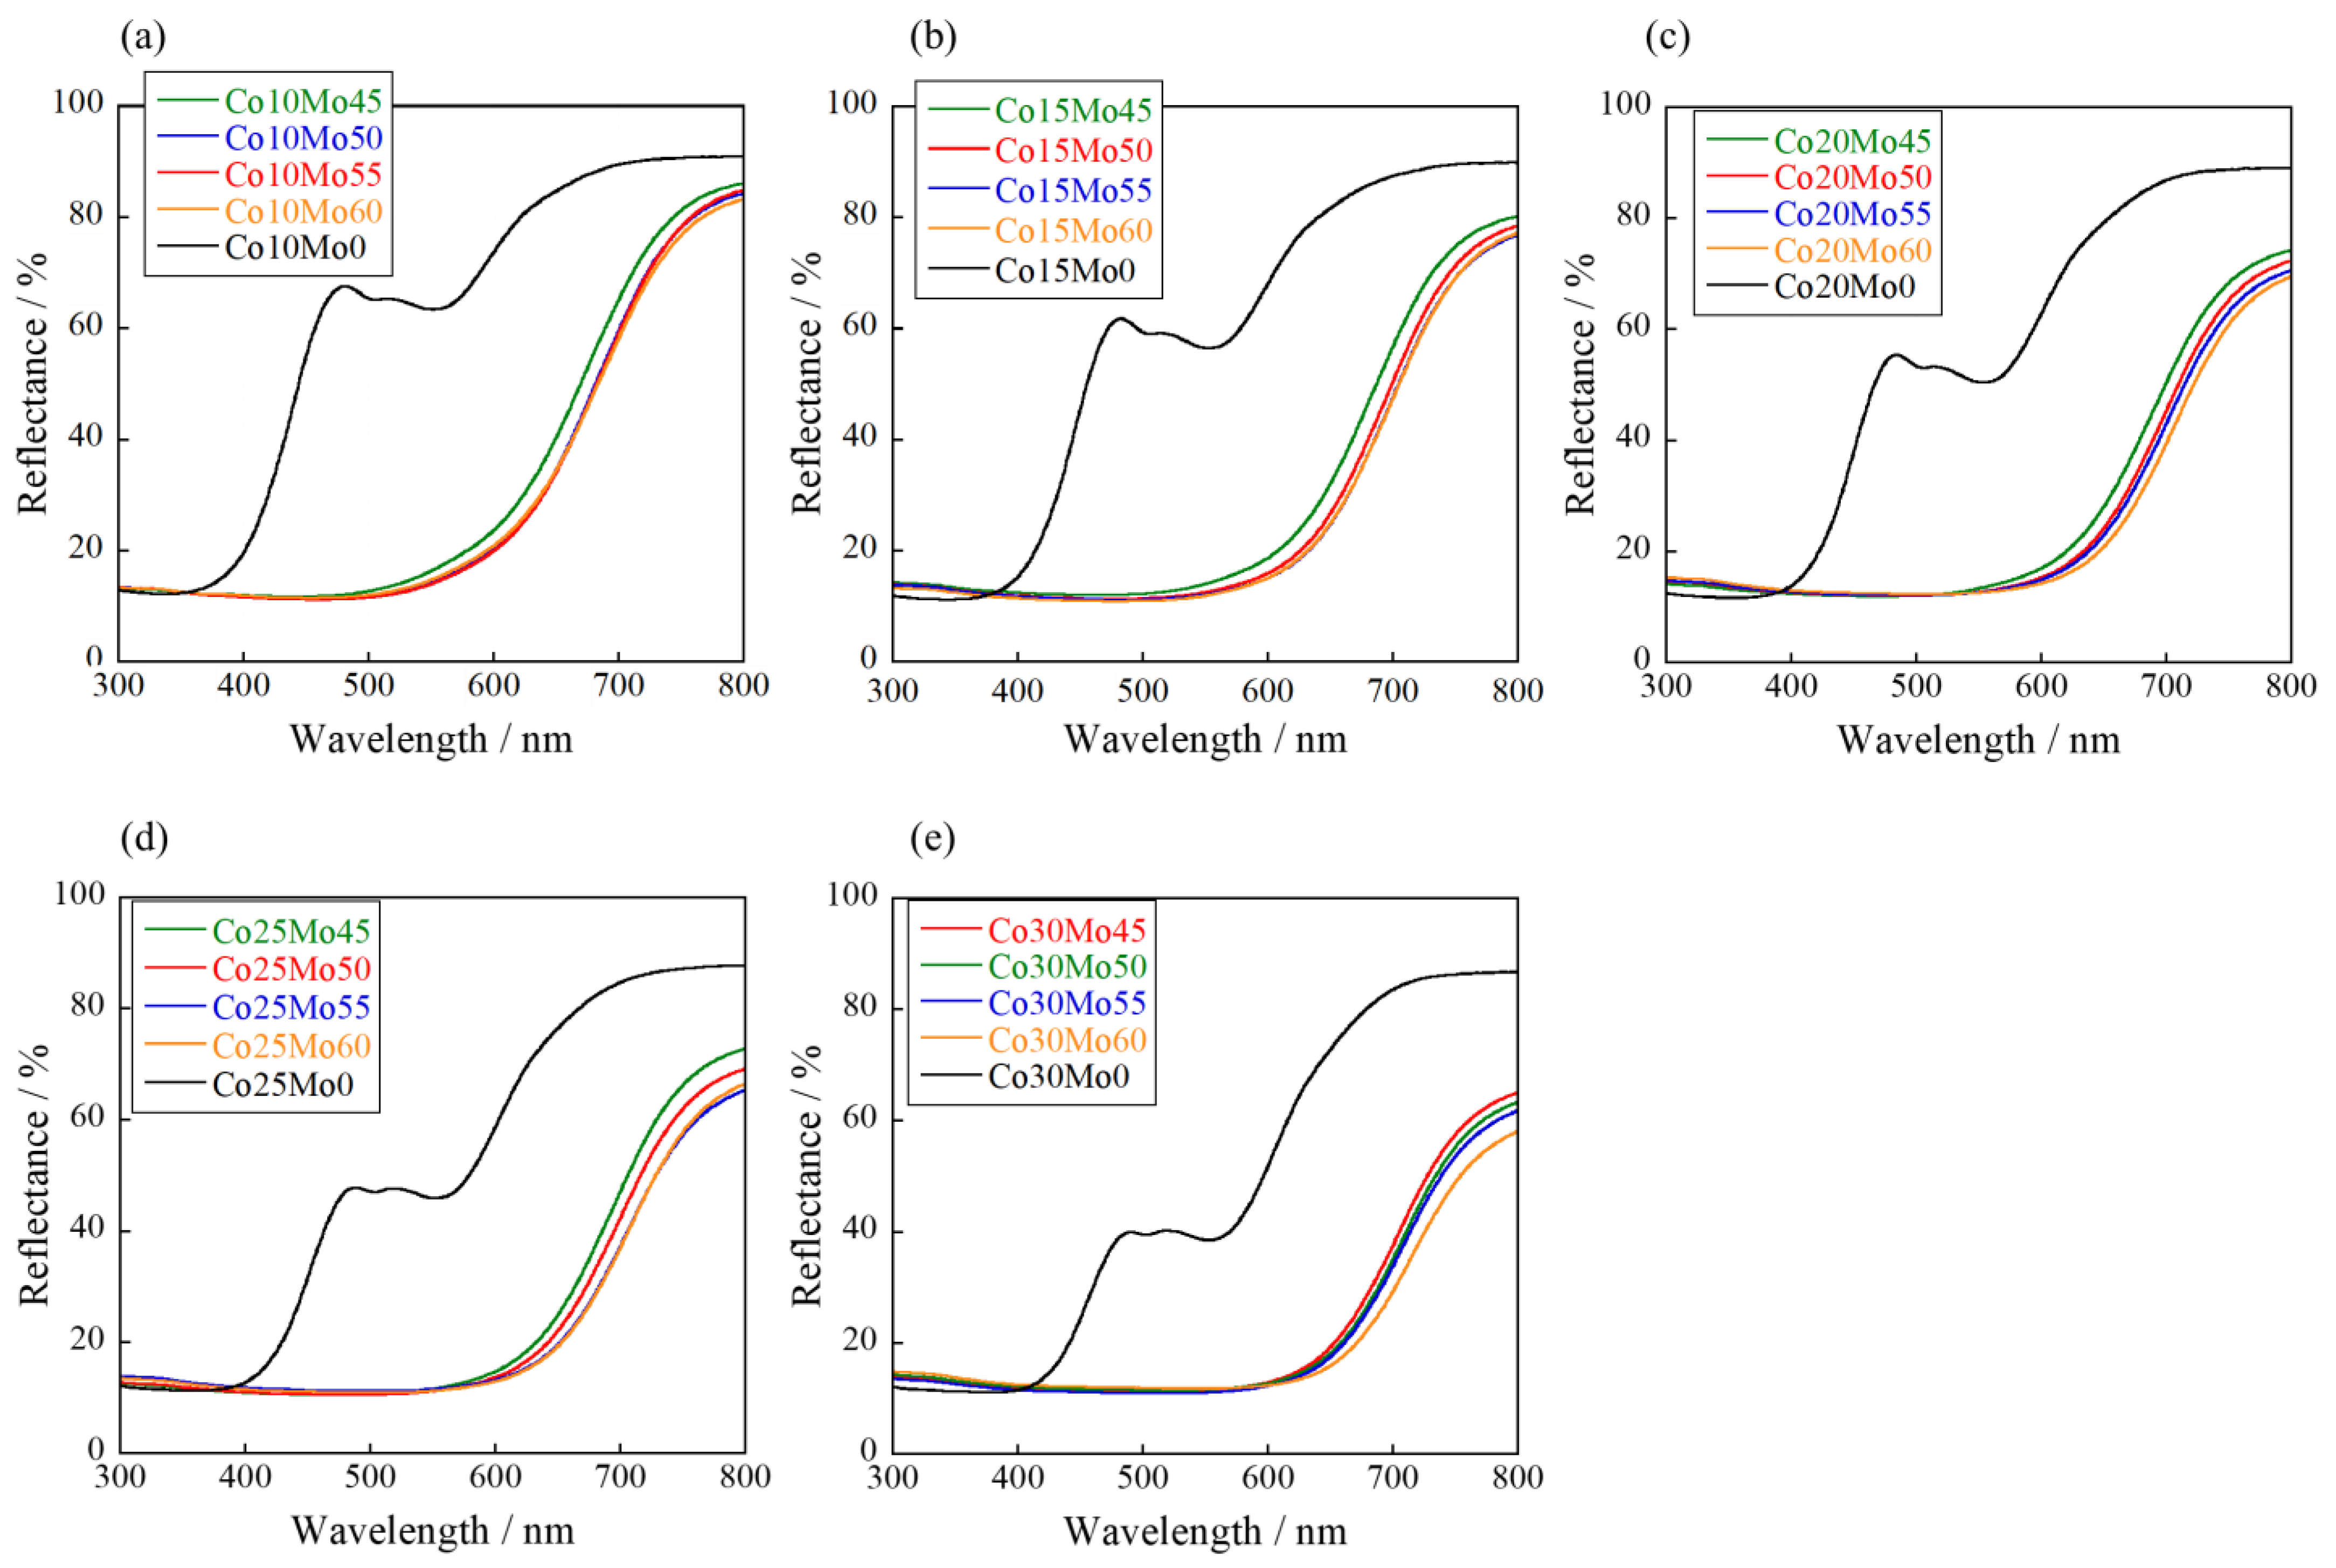
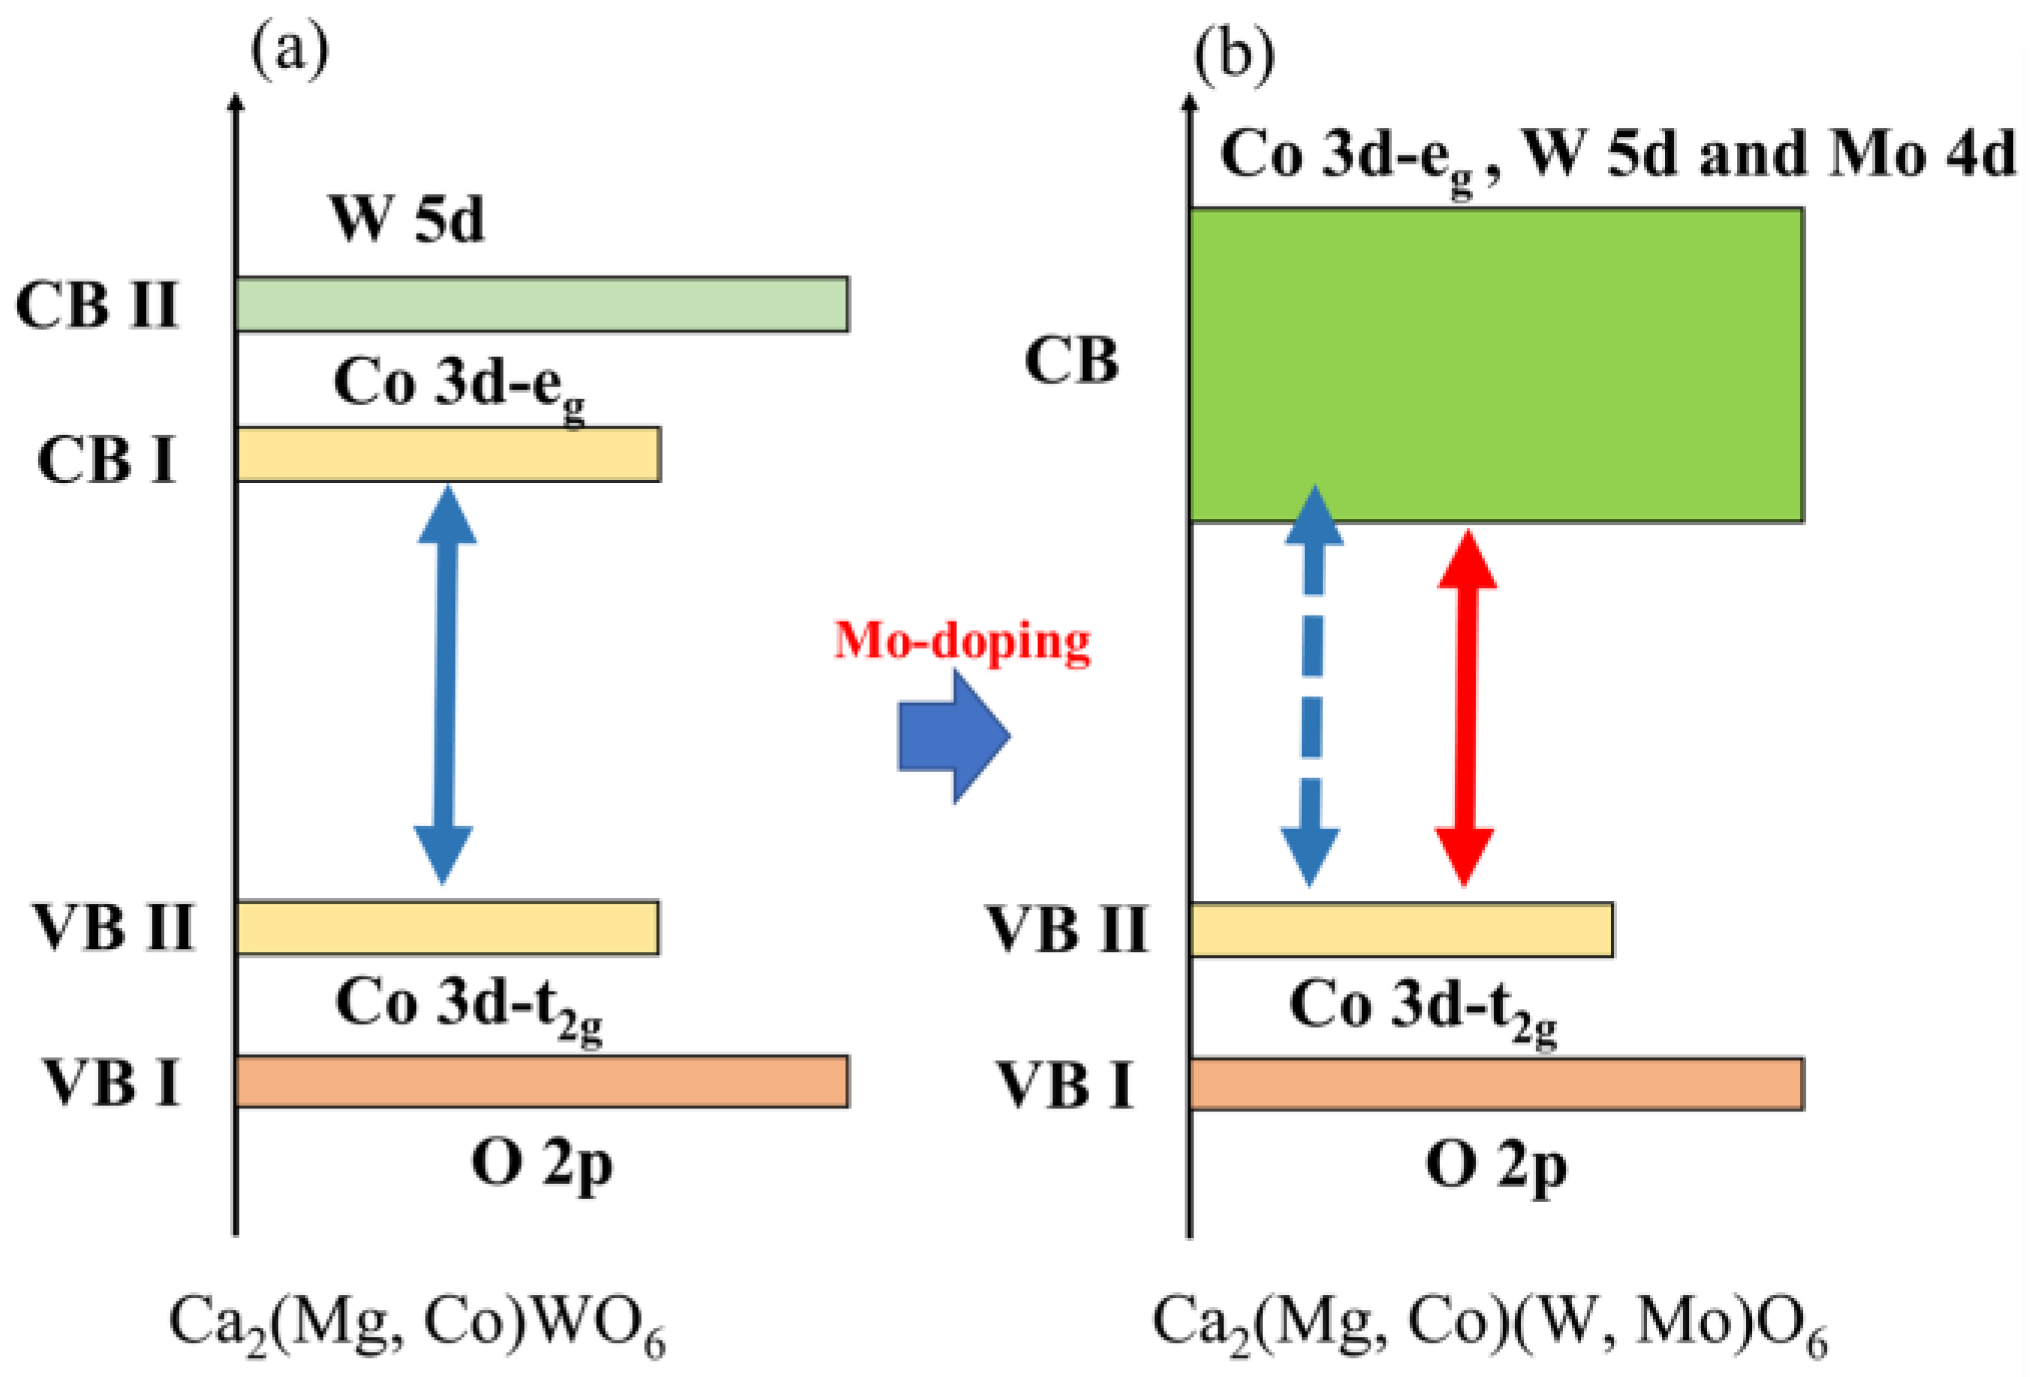
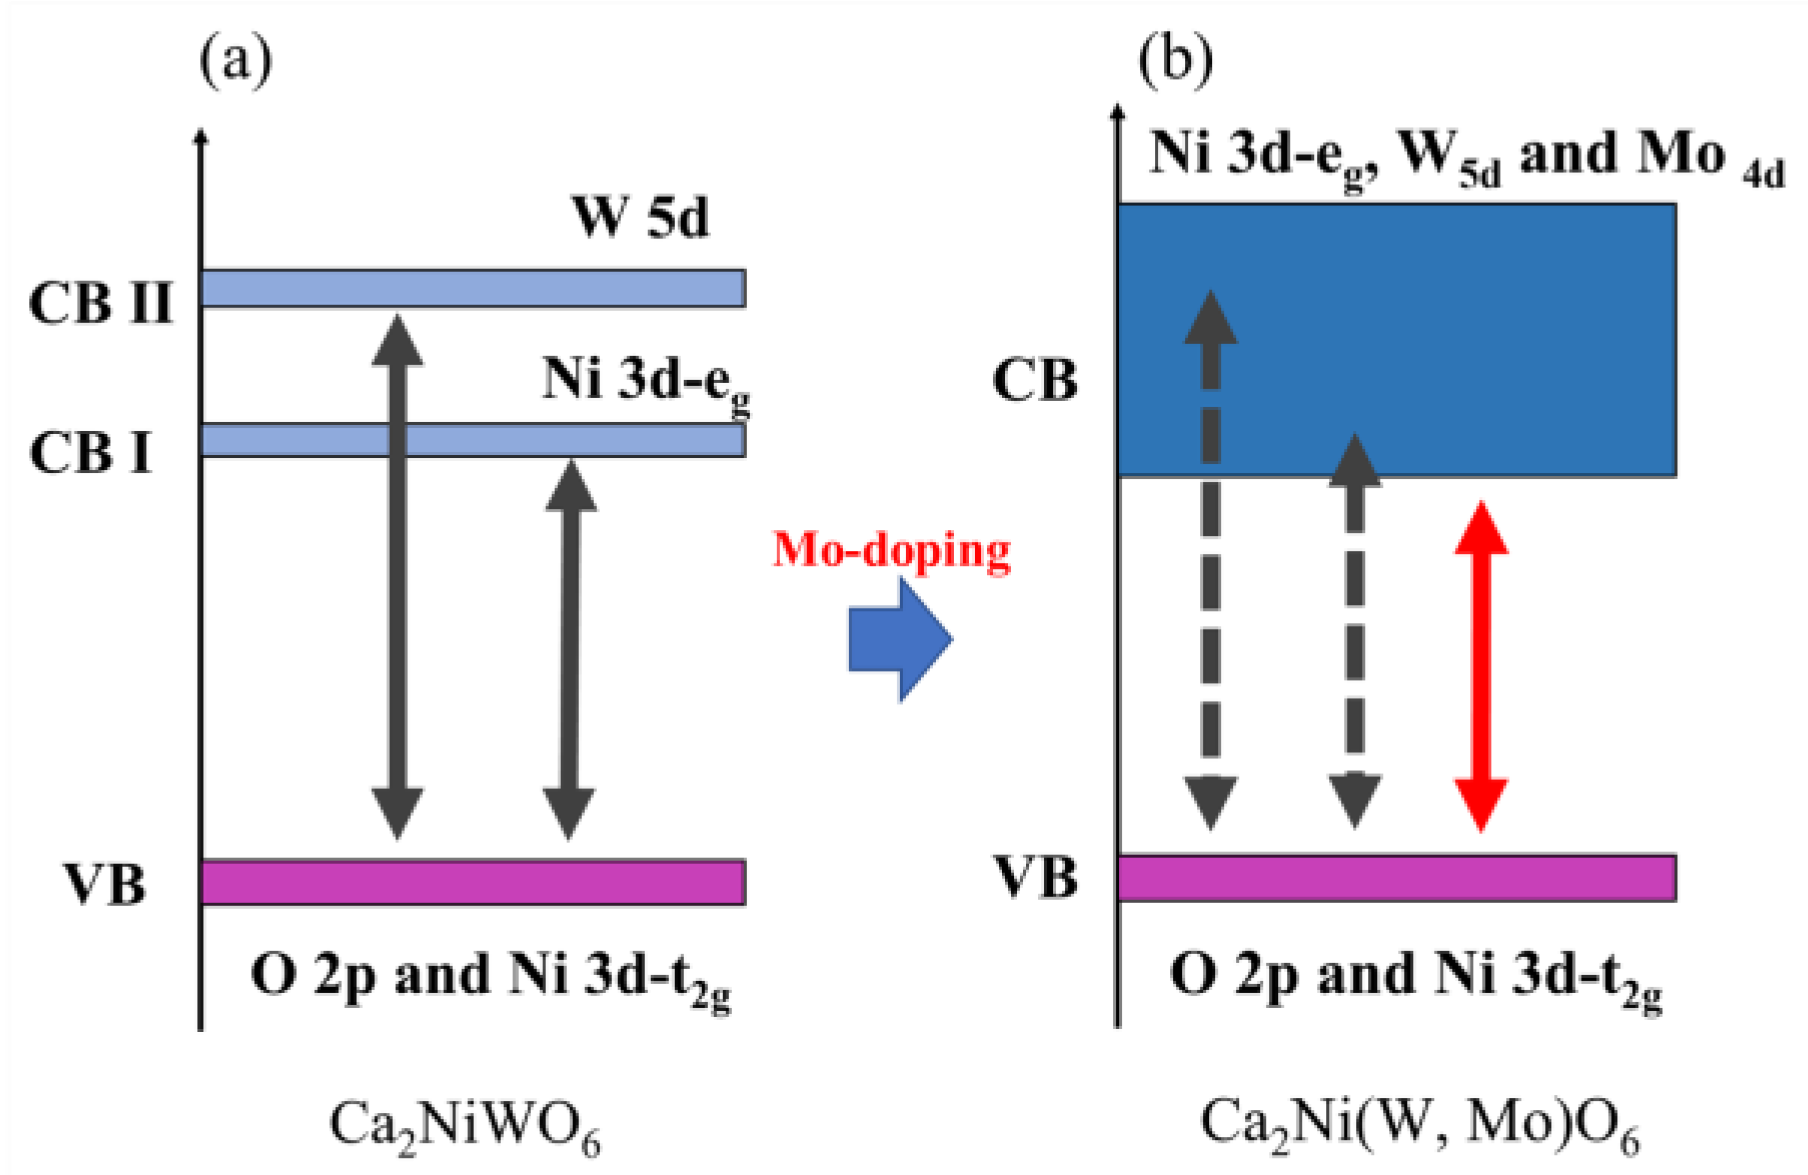
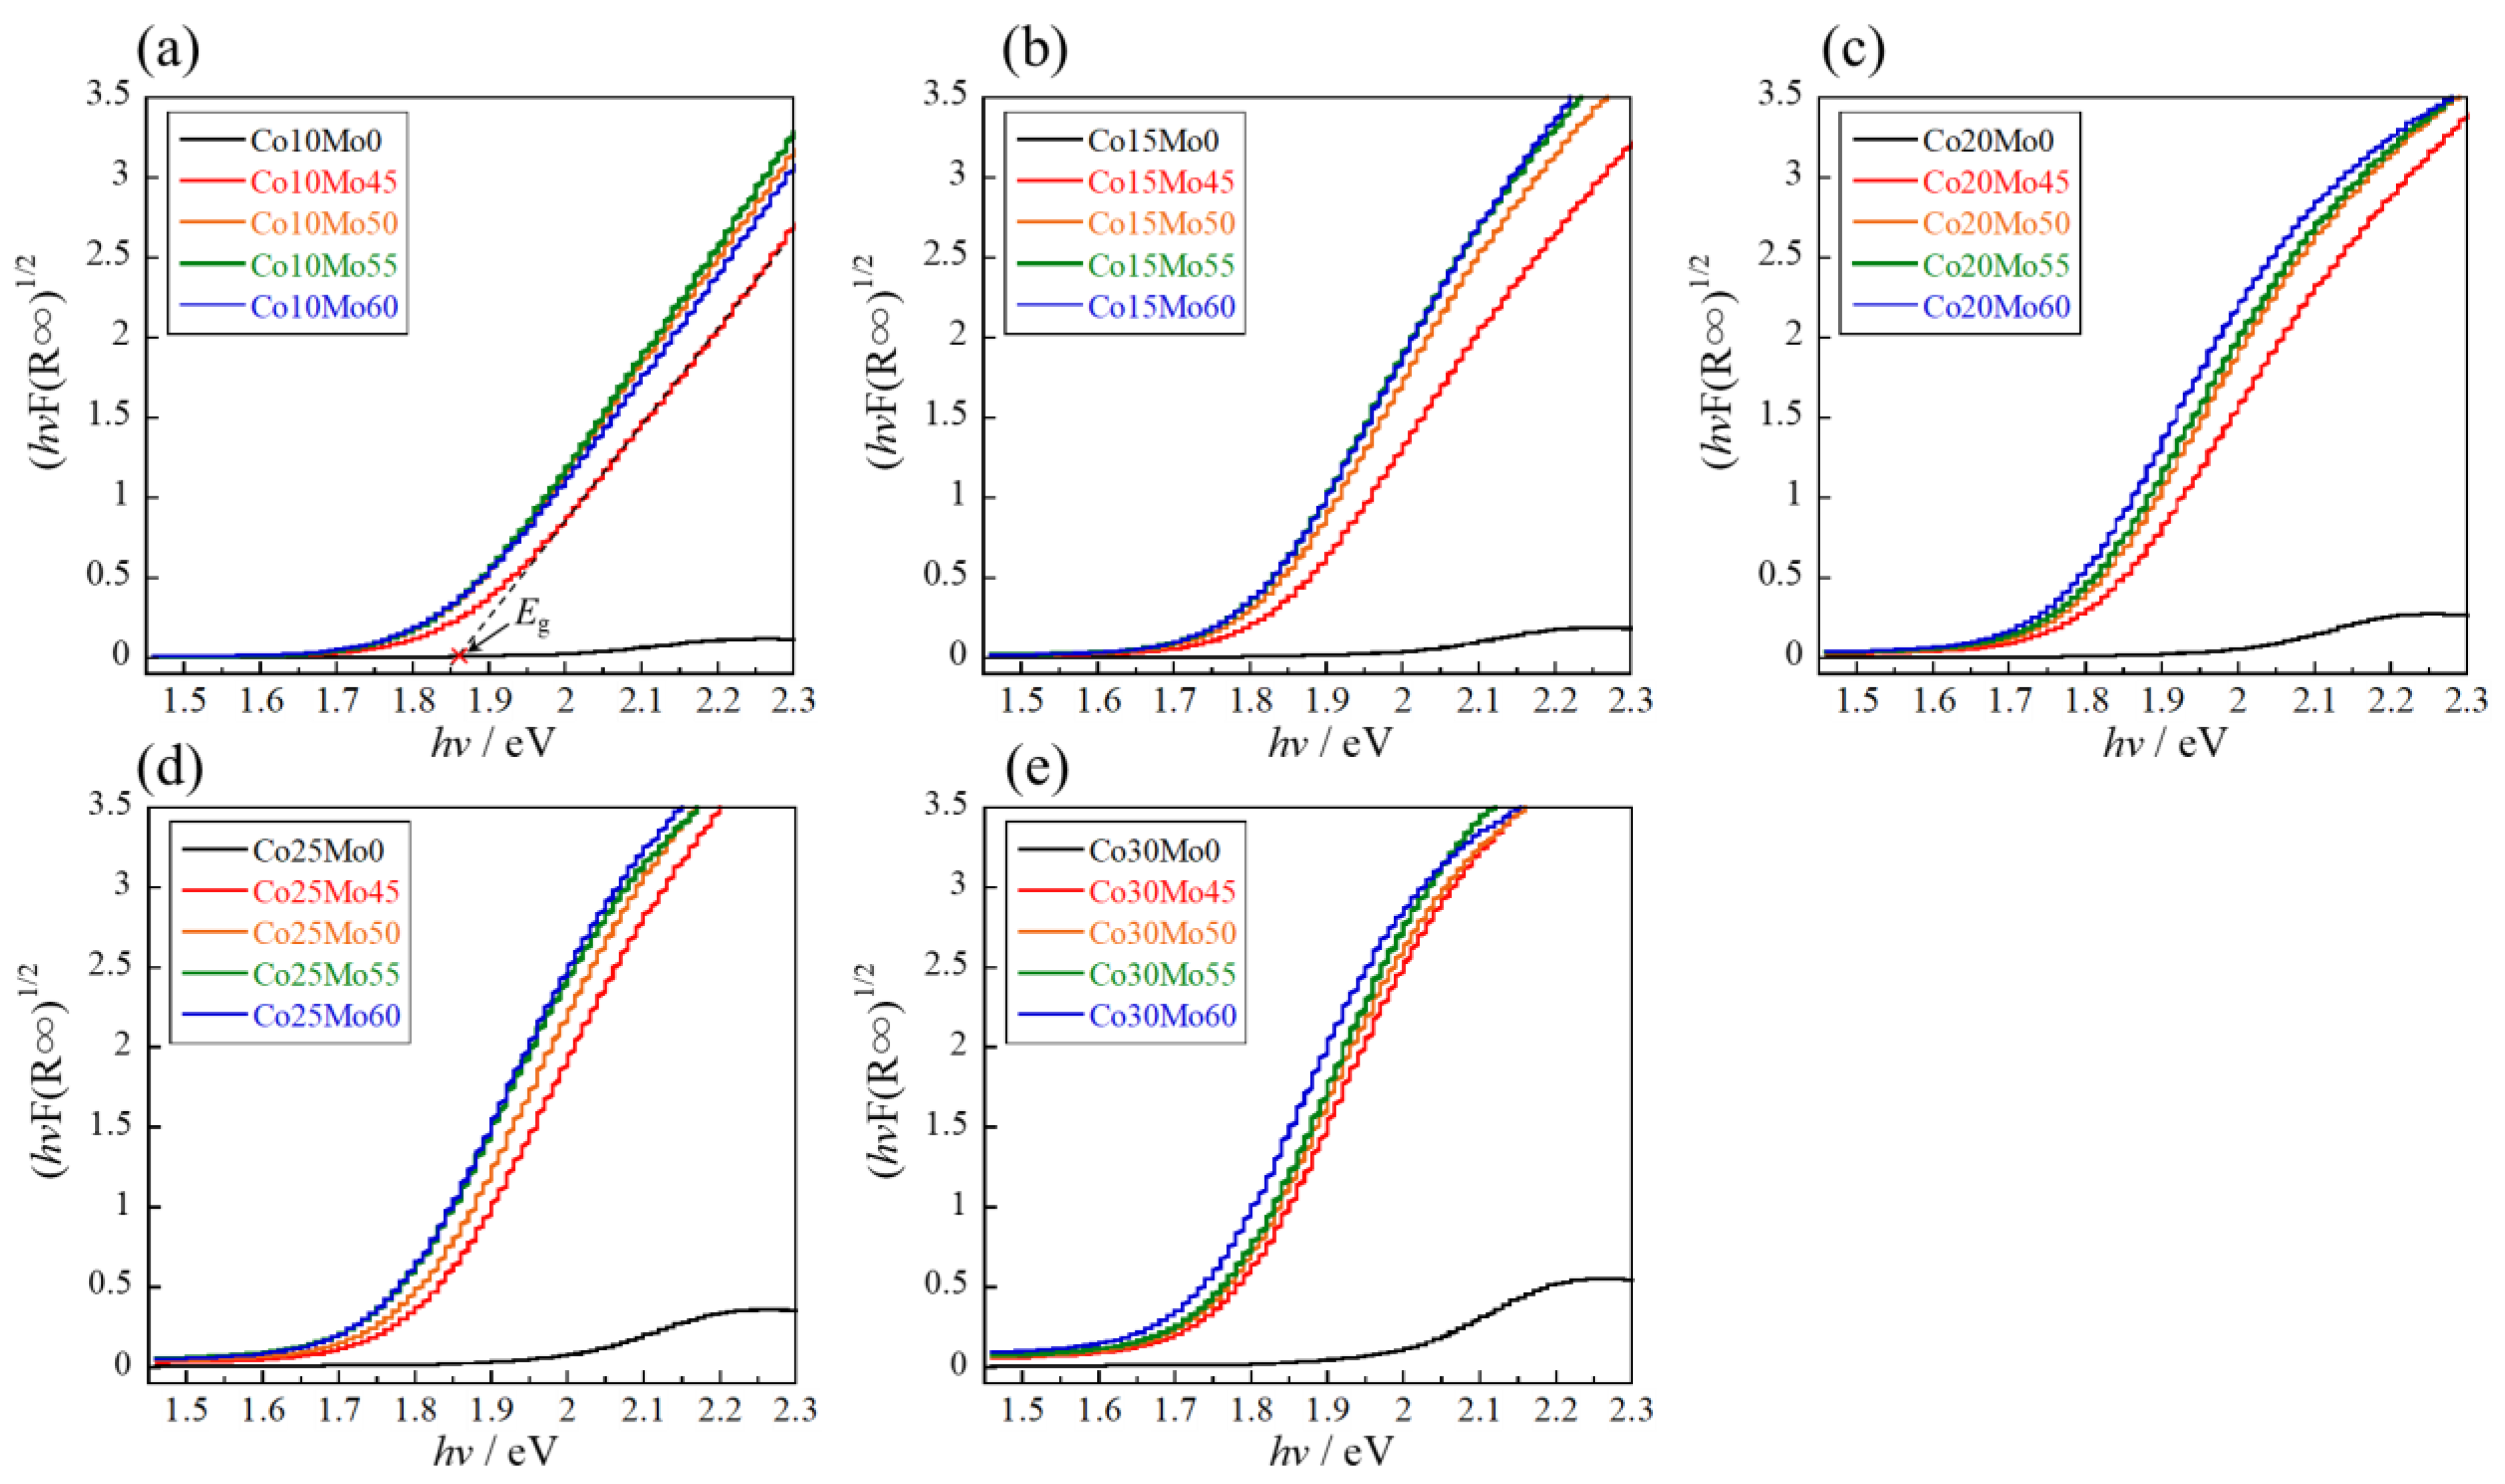
2.2.2. UV–Vis Reflectance Spectra
The UV–Vis reflectance spectra of CoaMob are shown in Figure 9. The results for the CoaMo0 (10 ≤ a ≤ 30) samples are shown for comparison. The Mo-doped samples absorbed intensely visible light at wavelengths below 600 nm, and the absorption wavelength shifted to longer wavelengths with increasing Mo concentrations. This is due to the formation of a new conduction band of the Co3d-W5d-Mo4d hybrid orbital by Mo6+ doping [30], which results in a reduction in the bandgap energy, as shown in Figure 10.
Figure 9.
UV–vis reflectance spectra of the CoaMob samples: (a) a = 10; (b) a = 15; (c) a = 20; (d) a = 25; and (e) a = 30.
Figure 10.
Schematic illustration of band structure for (a) Ca2(Mg, Co)WO6 and (b) Ca2(Mg, Co(W, Mo)O6. The blue arrows indicate the band gap energy of the host compound, whereas the red arrows indicate the band gap energy of the Mo-doped compound.
The bandgap energy (Eg) of these samples was investigated using a Tauc plot [38], which was obtained by converting the corresponding UV–vis reflectance spectra, as shown in Figure 11. The bandgap energy was determined from the Tauc plot by extrapolating the linear area across the hν axis of the graph. The intersection with the hν axis is an estimation of the corresponding Eg. The estimated Eg values are listed in Table 2. The Eg values of the Co- and Mo-doped samples were smaller than those of the Co-doped samples, which means that the Co3d-W5d-Mo4d hybrid orbital as a conduction band was newly constructed by Mo6+ doping, as shown in Figure 10. As expected, the optical bandgap energy decreased with increasing Mo content when the Co content was fixed. Therefore, the bandgap energy of the sample could be finely controlled by co-doping with various concentrations of Co and Mo. In addition, the reduction in bandgap energy leads to a higher electrical conductivity of the materials. The samples synthesized using this bandgap-controlling strategy have potential applications in other fields, such as catalysts for water splitting [39].
Figure 11.
Tauc plot of the CoaMob samples: (a) a = 10; (b) a = 15; (c) a = 20; (d) a = 25; and (e) a = 30.
Table 2.
Bandgap energy (Eg) for the CoaMob samples estimated from the UV–vis reflectance spectra.
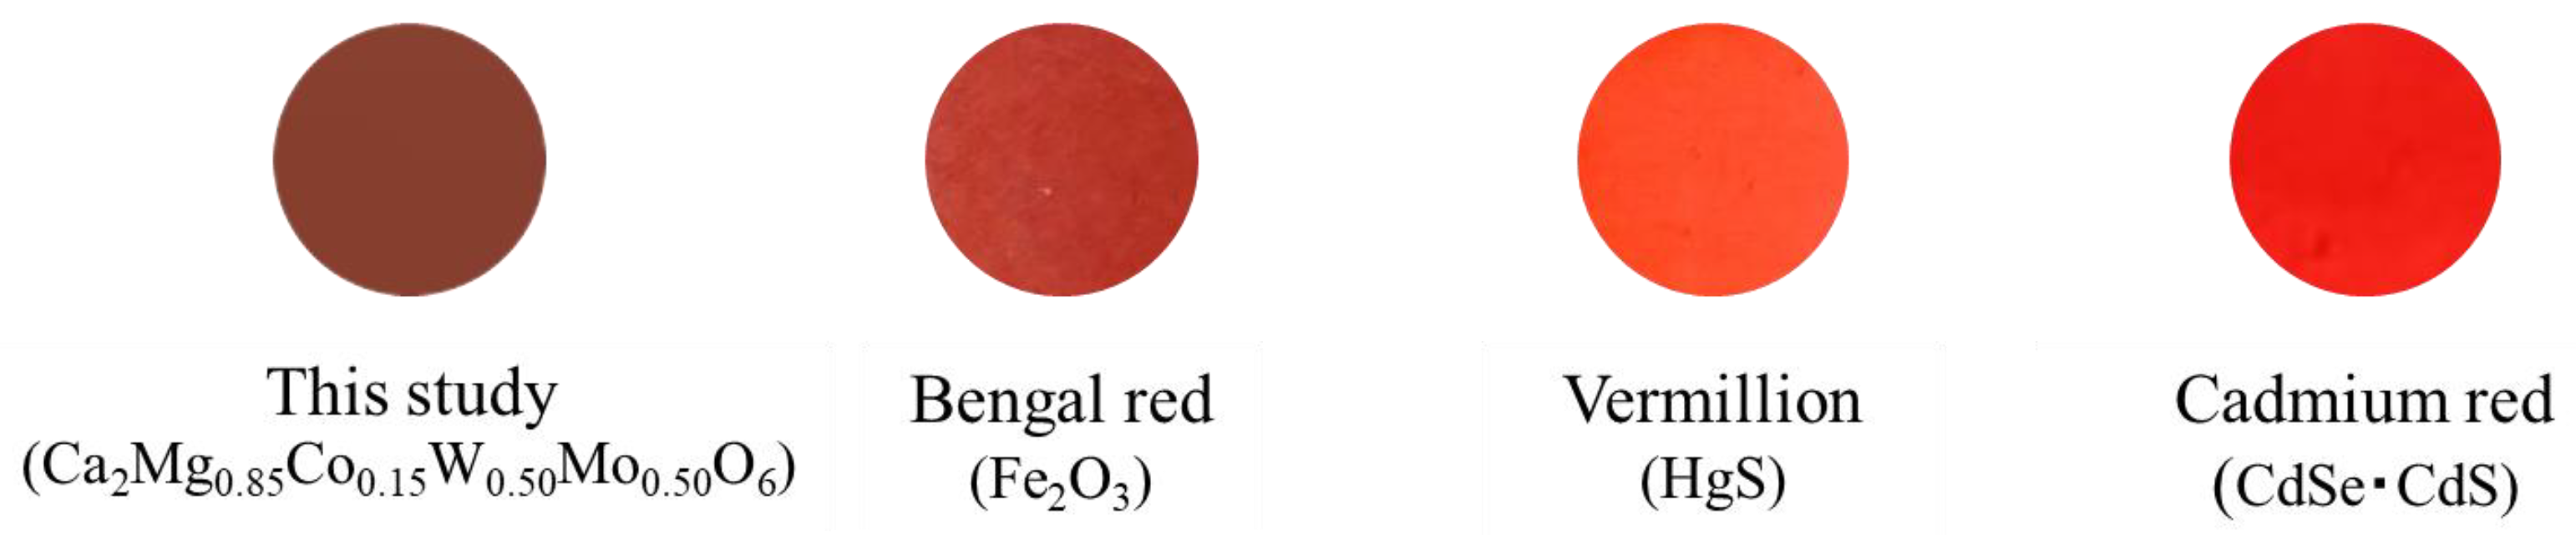
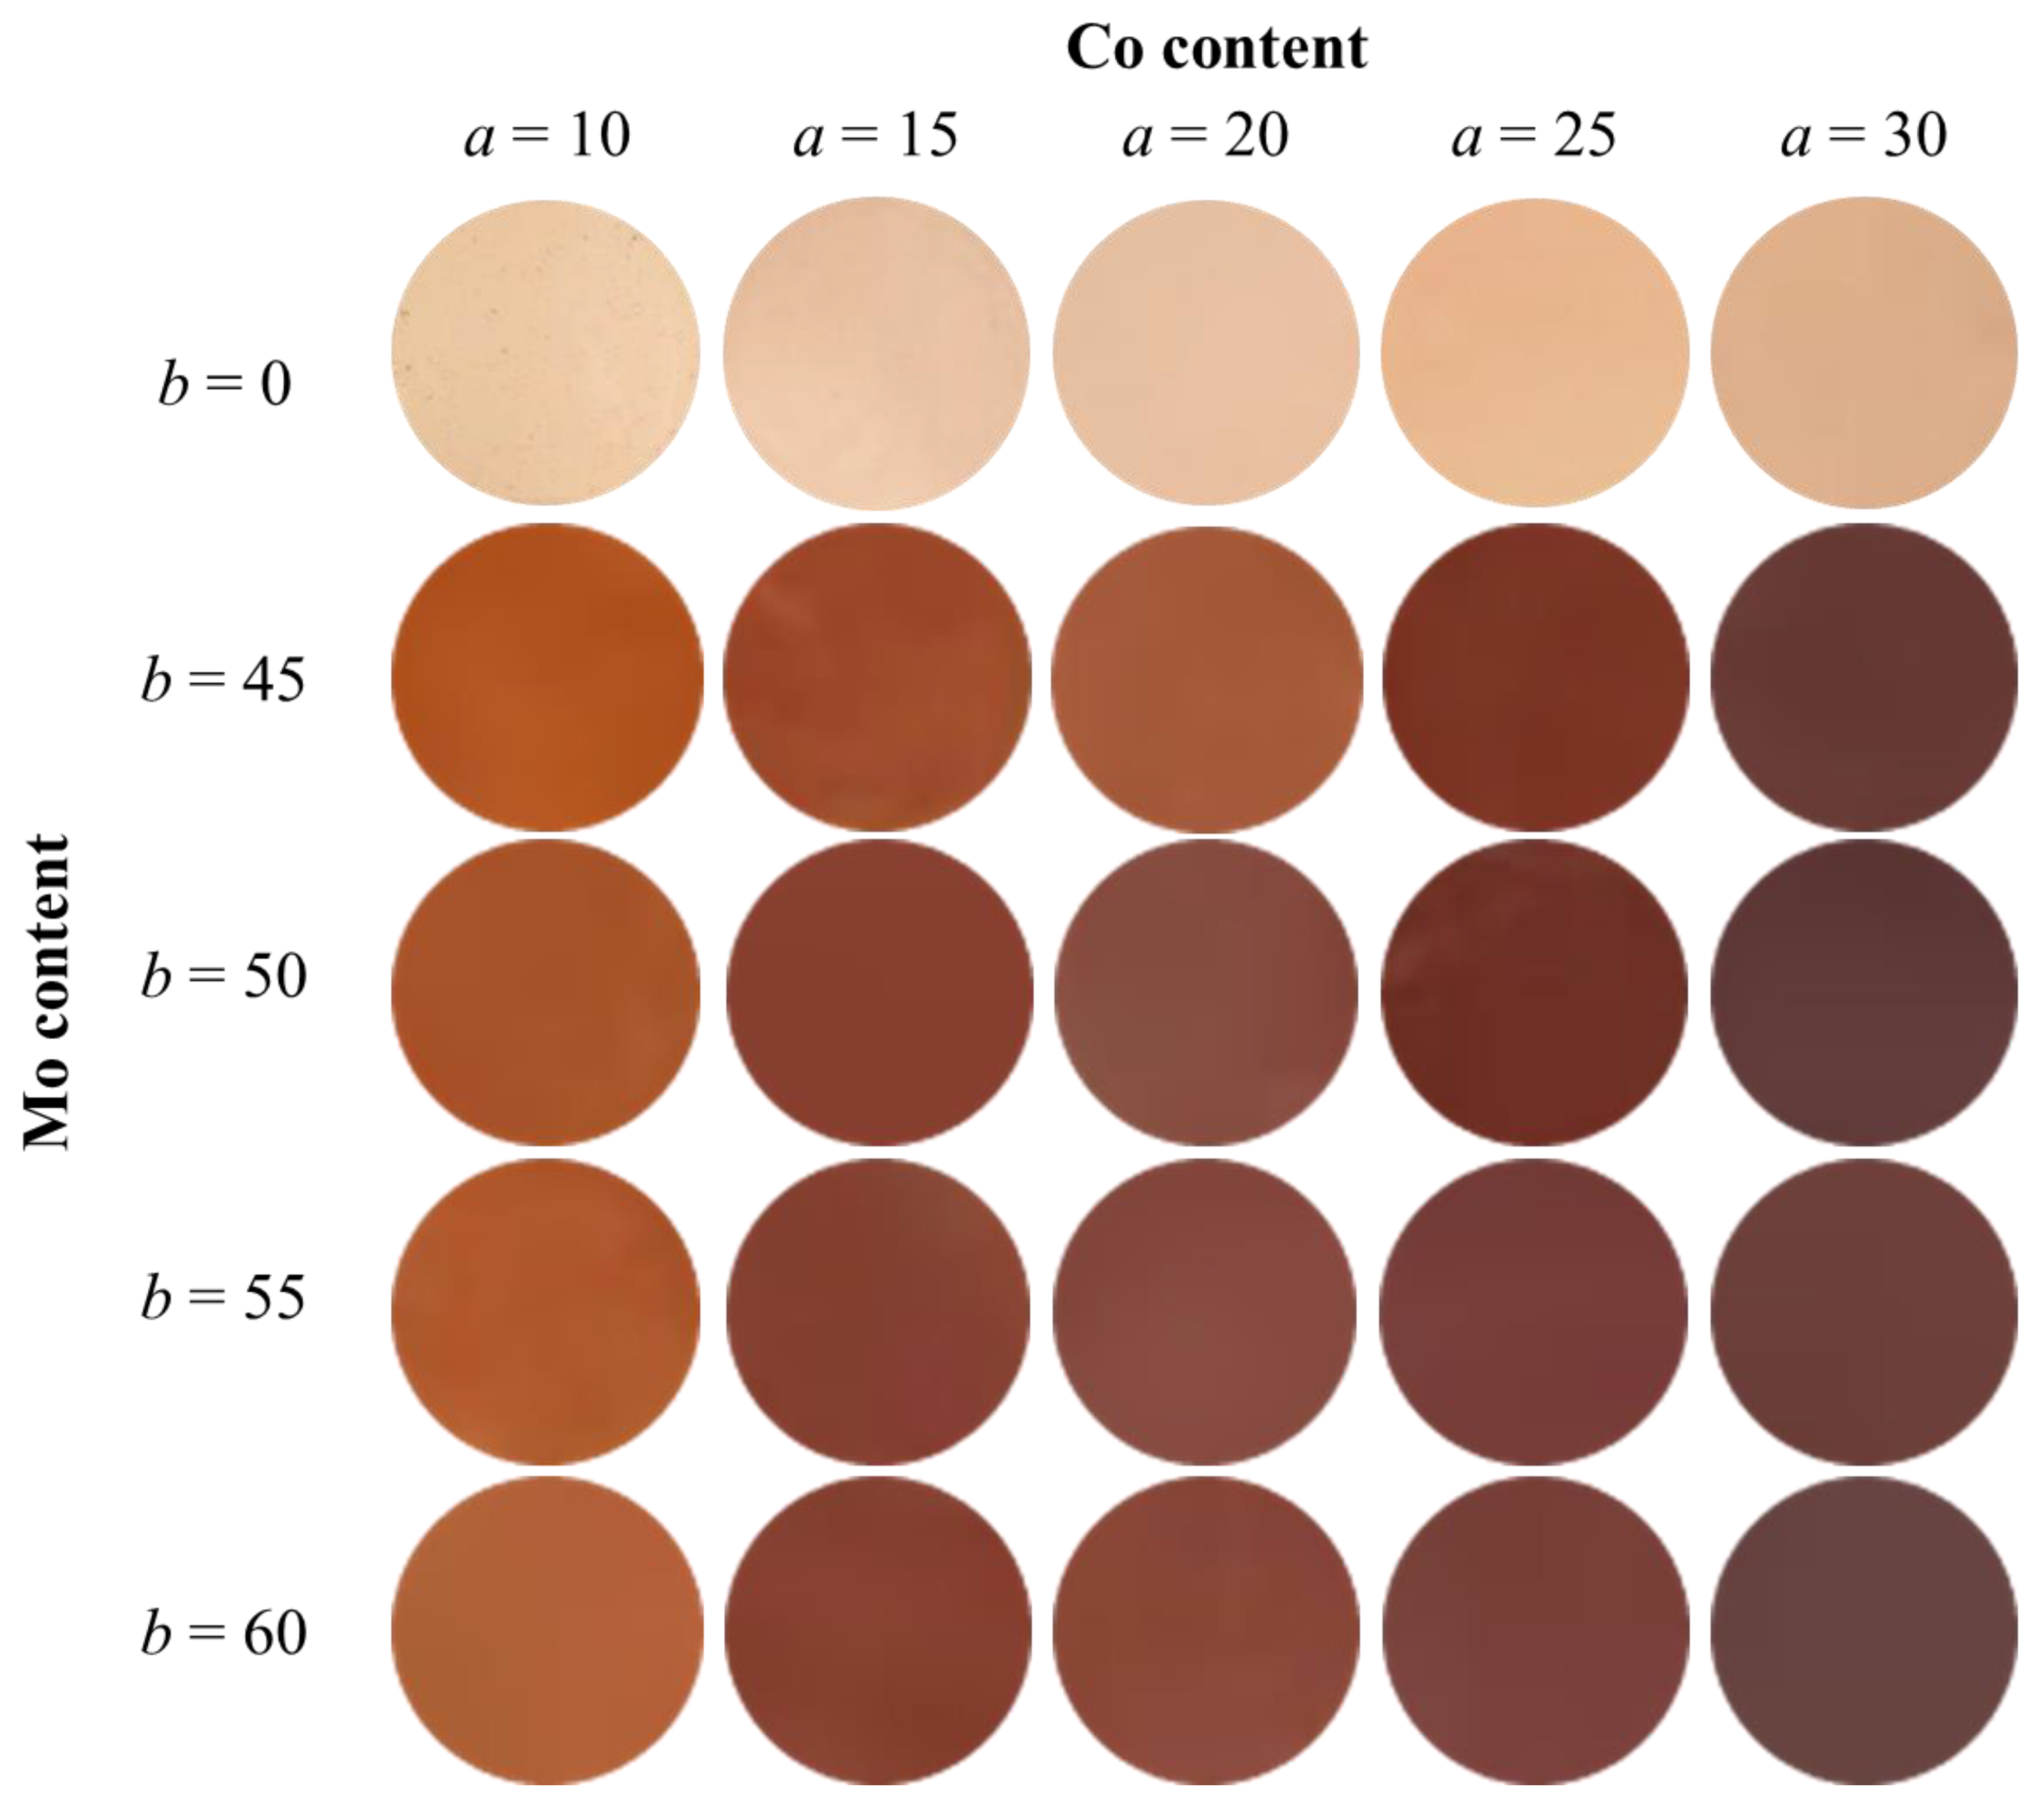
2.2.3. Color Property
The color properties of the CoaMob samples were evaluated using a colorimeter. The L*a*b*Ch° color coordinates and photographs are presented in Table 3 and Figure 12, respectively. Brightness (L*), redness (a*), and yellowness (b*) decreased with increasing Mo6+ content. This is because the samples absorbed not only the green light region (490–560 nm) of the complementary color against the red but also the yellow to red light regions (580–750 nm), as shown in Figure 9. However, the hue angle (h°) decreased with increasing Co and Mo content. When the Co concentration was greater than 15%, h° ranged from 0 to 35, indicating a red color. In fact, the sample color changed from reddish-brown to dark red upon Mo doping. In addition, the Co15Mo50 samples exhibited the highest a* value among the samples with a red hue angle (0 ≤ h° ≤ 35) to be the most nearly red color. Consequently, the color of the sample could be gradually controlled by Co and Mo doping.
Table 3.
Color coordinates for the CoaMob samples.
Figure 12.
Photographs of the CoaMob samples.
The chromatic parameters of the CoaMob sample were compared with those of commercially available red pigments such as Bengal red (Fe2O3), vermillion (HgS), and cadmium red (CdS·CdSe), as listed in Table 4. The photographs are shown in Figure 13. Although the values of a* and b* for Co15Mo50 were smaller than those for commercial red pigments, the pigment synthesized in this study showed the lowest hue angle (h° = 33.9), which means that its color is close to the purest red color among these red pigments. However, further improvements are necessary to make them comparable to the red color of conventionally harmful pigments.
Table 4.
Color coordinates of various red pigments.
Figure 13.
Photographs of Ca2Mg0.85Co0.15W0.50Mo0.50O6, Bengal red, vermillion, and cadmium red pellets made from powder samples.
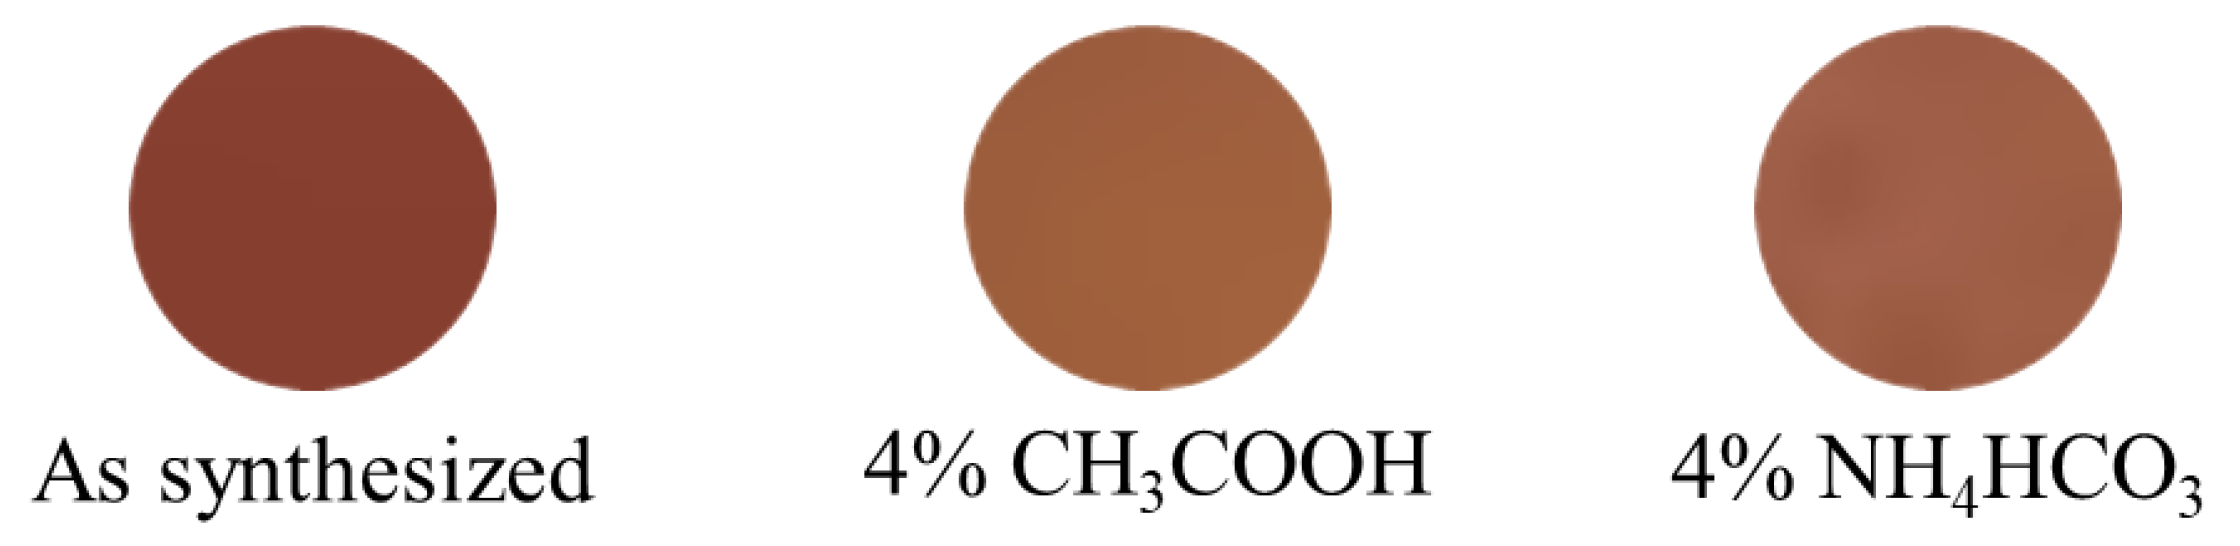
2.2.4. Chemical Stability Test
If pigments are practically used for various applications, such as tableware, their acid-base resistance is an important property. The chemical stability of the Co15Mo50 powder samples was evaluated. The powder samples were soaked for 7 h at room temperature in 4% CH3COOH and 4% NH4HCO3 aqueous solutions, assuming vinegar and baking soda, which are possibly the acids and bases most likely to come into contact with tableware. The samples were washed with deionized water and ethanol and dried at ambient temperature for 24 h. Table 5 summarizes the chromatic parameters of the samples after acid and base resistance tests, and the corresponding photographs of the samples are shown in Figure 14. Unfortunately, the Co15Mo50 pigment was less chemically stable because the color tone changed after the leaching tests in the acid and base solutions. To suppress color degradation, it is necessary to protect the surface with inert substances such as silica.
Table 5.
Color coordinate data of the Co15Mo50 samples before and after the chemical stability test.
Figure 14.
Photographs of Ca2Mg0.85Co0.15W0.50Mo0.50O6 samples before and after the chemical stability test.
3. Materials and Methods
3.1. Synthesis
Ca2Mg1−xCoxWO6 (0 ≤ x ≤ 0.50) samples were synthesized using a citrate sol-gel method. The starting materials were Ca(NO3)2·4H2O (FUJIFILM Wako Pure Chemical Industries Ltd., Osaka, Japan, 98.5%), Mg(NO3)2·6H2O (FUJIFILM Wako Pure Chemical Industries Ltd., 99.5%), Co(NO3)2·6H2O (FUJIFILM Wako Pure Chemical Industries Ltd., 99.5%), and WO3 (Kishida Chemical Co. Ltd., Osaka, Japan, 98.0%). The materials were weighed stoichiometrically to obtain the desired compositions, as listed in Table 6. WO3 was dissolved in 30 cm3 of five-fold diluted aqueous ammonia (FUJIFILM Wako Pure Chemical Industries Ltd., 28.0 wt. %), and the metal nitrates were dissolved in 50 cm3 of deionized water. These solutions were mixed and stirred uniformly, and citric acid (CA; FUJIFILM Wako Pure Chemical Industries Ltd., 98.0%) was added as a chelator to complex the cations in the solution. The molar ratio of the total cations (Ca, Mg, Co, and W) to CA was 2:1. The mixed solution was stirred by heating at 80 °C until a gel was obtained, which was then oven-dried at 120 °C for 24 h. The dried gel was pulverized using an agate mortar and calcined in an alumina crucible at 500 °C for 8 h in air. After calcination, the sample was again heated in an alumina boat at 1250 °C for 5 h in air. The samples were ground in an agate mortar and pestle before characterization.
Table 6.
Amounts of reagents used to synthesize Ca2Mg1−xCoxWO6 (0 ≤ x ≤ 0.50).
CoaMob (10 ≤ a ≤ 30; 45 ≤ b≤ 60), namely Ca2Mg1−xCoxW1−yMoyO6 (0.10 ≤ x ≤ 0.30; 0.45 ≤ y ≤ 0.60), samples were also prepared using a procedure similar to that described above. The starting materials, Ca(NO3)2·4H2O, Mg(NO3)2·6H2O, Co(NO3)2·6H2O, MoO3 (FUJIFILM Wako Pure Chemical Industries Ltd., 99.9%), and WO3, were stoichiometrically weighed, as shown in Table 7. MoO3 and WO3 were dissolved in 30 cm3 of five-fold diluted aqueous ammonia.
Table 7.
Amounts of reagents used to synthesize CoaMob (10 ≤ a ≤ 30; 45 ≤ b≤ 60).
3.2. Characterization
Powder X-ray diffraction (XRD) analysis was performed using an Ultima IV X-ray diffractometer (Rigaku Corporation, Tokyo, Japan) to identify the crystal phases and structures of the samples. XRD patterns were obtained using Cu-Kα radiation, which was operated at a tube voltage of 40 kV and a tube current of 40 mA. The data were collected by scanning over a 2θ range of 20°–80°. The sampling width was 0.02°, and the scan speed was 6° min−1. The lattice volumes were calculated from the XRD peak angles refined by α-Al2O3 as a standard and using CellCalc Ver. 2.20 software. An ultraviolet–visible (UV–Vis) spectrometer (JASCO Corporation, Tokyo, Japan, V-770 with an integrating sphere attachment) was used to record the optical reflectance spectra of the as-prepared samples using a standard white plate as a reference. The step width was 1 nm, and the scan rate was 1000 nm min−1. The bandgap energies of the samples were calculated from the absorption edge of the absorbance spectrum, represented by the Kubelka-Munk function f(R) = (1 − R)2/2R, where f(R) is the theoretical absorbance and R is the measured reflectance [36]. The chromatic parameters of the powder samples were evaluated based on the Commission Internationale de l’Éclairage (CIE) L*a*b*Ch° system using a colorimeter (Konica-Minolta, Inc., Tokyo, Japan, CR-400). A standard C illuminant was used for colorimetric measurements. The L* parameter shows the brightness or darkness in neutral grayscale. Positive and negative a* values represent reddish and greenish colors, respectively. Positive and negative b* values indicate yellowish and bluish colors, respectively. The chroma parameter (C) is the color saturation, which is expressed by the formula C = [(a*)2 + (b*)2]1/2. The hue angle (h°) ranged from 0° to 360° and was calculated using the equation h° = arctan(b*/a*). For the L*a*b*Ch° color coordinate data, all values showed standard deviations of less than 0.1.
4. Conclusions
To develop novel inorganic red pigments with fewer harmful elements, we focused on double-perovskite-type Ca2MgWO6 and Co2+ ions as the host material and chromophores, respectively. Ca2Mg1−xCoxWO6 (0 ≤ x ≤ 0.50) samples were synthesized using the citrate sol-gel method. The sample color turned from white to brown with an increase in Co2+ content due to enhanced light absorption based on the d–d transition, but a reddish color was not obtained. Thus, we attempted to lower the bandgap energy of Ca2Mg1−xCoxWO6 to achieve a red color, and the CoaMob (10 ≤ a ≤ 30; 45 ≤ b ≤ 60) samples were prepared and characterized. When Mo6+ was introduced into the W6+ site of Ca2Mg1−xCoxWO6, a new conduction band corresponding to the Co3d-W5d-Mo4d hybridized orbital was formed, and their bandgap energies decreased, as expected. The bandgap energy decreased with increasing Mo6+ concentrations because of the widening conduction band. As a result, the samples absorbed longer wavelengths of light and exhibited a reddish-brown or dark-red color. Among the samples whose hue angle ranged in red (0 ≤ h° ≤ 35), Co15Mo50 showed the highest a* value of 22.3. Although the vividness of the sample synthesized in this study was less than that of commercially available inorganic red pigments, its chromatic purity was the highest among them. It is noteworthy that the bandgap energy can be controlled by introducing the Mo4d orbital between the Co3d and W4d orbitals to form a new wide conduction band; thus, the color of the sample is also controllable.
Author Contributions
The following are the author contributions to this study: conceptualization, R.O. and T.M.; methodology, K.Y., K.M., R.O. and T.M.; validation, K.Y., R.O. and T.M.; investigation, K.Y., K.M. and R.O.; data curation, K.Y., K.M., R.O. and T.M.; writing—original draft preparation, K.Y.; writing—review and editing, R.O. and T.M.; supervision, T.M.; funding acquisition, T.M. All authors have read and agreed to the published version of the manuscript.
Funding
This research was funded by JSPS KAKENHI, grant numbers JP22K04698 and JP20H02439.
Institutional Review Board Statement
Not applicable.
Informed Consent Statement
Not applicable.
Data Availability Statement
Data are contained within this article.
Conflicts of Interest
The authors declare no conflicts of interest.
References
- Wang, B.; Jin, C.; Shao, S.; Yue, Y.; Zhang, Y.; Wang, S.; Chang, R.; Zhang, H.; Zhao, J.; Li, X. Electron-Deficient Cu Site Catalyzed Acetylene Hydrochlorination. Green. Energy Environ. 2023, 8, 1128–1140. [Google Scholar] [CrossRef]
- Zhang, S.; Ye, M.; Chen, S.; Han, A.; Zang, Y. Synthesis and Characterization of Mica/γ-Ce2−xYxS3 Composite Red Pigments with UV Absorption and High NIR Reflectance. Ceram. Int. 2016, 42, 16023–16030. [Google Scholar] [CrossRef]
- Jansen, M.; Letschert, H.P. Inorganic Yellow-Red Pigments without Toxic Metals. Nature 2000, 404, 980–982. [Google Scholar] [CrossRef] [PubMed]
- Liu, S.-G.; Li, Y.-M.; Wang, Z.-M.; Shen, Z.-Y.; Xie, Z.-X. Enhanced High Temperature Oxidization Resistance of Silica Coated γ-Ce2S3 Red Pigments. Appl. Surf. Sci. 2016, 387, 1147–1153. [Google Scholar] [CrossRef]
- Shiraishi, A.; Takeuchi, N.; Masui, T.; Imanaka, N. Novel Environment Friendly Inorganic Red Pigments Based on Bi4V2O11. RSC Adv. 2015, 5, 44886–44894. [Google Scholar] [CrossRef]
- Yoshida, T.; Masui, T.; Imanaka, N. Novel Environmentally Friendly Inorganic Red Pigments Based on Calcium Bismuth Oxides. J. Adv. Ceram. 2015, 4, 39–45. [Google Scholar] [CrossRef]
- Masui, T.; Imanaka, N. Novel Environment-Friendly Inorganic Red Pigments Based on (Bi, Er, Y, Fe)2O3 Solid Solutions. J. Asian Ceram. Soc. 2014, 2, 195–198. [Google Scholar] [CrossRef]
- Shirpour, M.; Sani, M.A.F.; Mirhabibi, A. Synthesis and Study of a New Class of Red Pigments Based on Perovskite YAlO3 Structure. Ceram. Int. 2007, 33, 1427–1433. [Google Scholar] [CrossRef]
- Kim, S.W.; Hasegawa, T.; Watanabe, M.; Sugimoto, K.; Saito, Y.; Uematsu, K.; Toda, K.; Sato, M. Environmentally Friendly Rb3V5O14 Fluorescent Red Pigment. Dye. Pigm. 2017, 136, 219–223. [Google Scholar] [CrossRef]
- Jiang, P.; Li, J.; Sleight, A.W.; Subramanian, M.A. New Oxides Showing an Intense Orange Color Based on Fe3+ in Trigonal-Bipyramidal Coordination. Inorg. Chem. 2011, 50, 5858–5860. [Google Scholar] [CrossRef]
- Kumari, L.S.; Rao, P.P.; Reddy, M.L. Environment-Friendly Red Pigments from CeO2–Fe2O3–Pr6O11 Solid Solutions. J. Alloys Compd. 2008, 461, 509–515. [Google Scholar] [CrossRef]
- Kumari, L.S.; Rao, P.P.; Sameera, S.; Koshy, P. Synthesis and Optical Properties of Ce0.95Pr0.05−xMxO2 (M = Mn, Si) as Potential Ecological Red Pigments for Coloration of Plastics. Ceram. Int. 2012, 38, 4009–4016. [Google Scholar] [CrossRef]
- Jovaní, M.; Sanz, A.; Beltrán-Mir, H.; Cordoncillo, E. New Red-Shade Environmental-Friendly Multifunctional Pigment Based on Tb and Fe Doped Y2Zr2O7 for Ceramic Applications and Cool Roof Coatings. Dye. Pigm. 2016, 133, 33–40. [Google Scholar] [CrossRef]
- Meseguer, S.; Tena, M.A.; Gargori, C.; Badenes, J.A.; Llusar, M.; Monrós, G. Structure and Colour of Cobalt Ceramic Pigments from Phosphates. Ceram. Int. 2007, 33, 843–849. [Google Scholar] [CrossRef]
- Serment, B.; Corucho, L.; Demourgues, A.; Hadziioannou, G.; Brochon, C.; Cloutet, E.; Gaudon, M. Tailoring the Chemical Composition of LiMPO4 (M = Mg, Co, Ni) Orthophosphates To Design New Inorganic Pigments from Magenta to Yellow Hue. Inorg. Chem. 2019, 58, 7499–7510. [Google Scholar] [CrossRef] [PubMed]
- Fernández-Osorio, A.; Pineda-Villanueva, E.; Chávez-Fernández, J. Synthesis of Nanosized (Zn1−xCox)Al2O4 Spinels: New Pink Ceramic Pigments. Mater. Res. Bull. 2012, 47, 445–452. [Google Scholar] [CrossRef]
- Miccichè, F.; Oostveen, E.; Haveren, J.V.; Linde, R.V.D. The Combination of Reducing Agents/Iron as Environmentally Friendlier Alternatives for Co-Based Driers in the Drying of Alkyd Paints. Prog. Org. Coat. 2005, 53, 99–105. [Google Scholar] [CrossRef]
- Uner, D.; Demirkol, M.K.; Dernaika, B. A Novel Catalyst for Diesel Soot Oxidation. Appl. Catal. B-Environ. 2005, 61, 334–345. [Google Scholar] [CrossRef]
- Frías, M.; Sánchez De Rojas, M.I. Total and Soluble Chromium, Nickel and Cobalt Content in the Main Materials Used in the Manufacturing of Spanish Commercial Cements. Cem. Concr. Res. 2002, 32, 435–440. [Google Scholar] [CrossRef]
- Russell, N.V.; Wigley, F.; Williamson, J. Microstructural Changes to Metal Bond Coatings on Gas Turbine Alloys with Time at High Temperature. J. Mater. Sci. 2000, 35, 2131–2138. [Google Scholar] [CrossRef]
- Llusar, M.; Vitásková, L.; Šulcová, P.; Tena, M.A.; Badenes, J.A.; Monrós, G. Red Ceramic Pigments of Terbium-Doped Ceria Prepared through Classical and Non-Conventional Coprecipitation Routes. J. Eur. Ceram. Soc. 2010, 30, 37–52. [Google Scholar] [CrossRef]
- Llusar, M.; Forés, A.; Badenes, J.A.; Calbo, J.; Tena, M.A.; Monrós, G. Colour Analysis of Some Cobalt-Based Blue Pigments. J. Eur. Ceram. Soc. 2001, 21, 1121–1130. [Google Scholar] [CrossRef]
- Ahmed, I.S.; Shama, S.A.; Moustafa, M.M.; Dessouki, H.A.; Ali, A.A. Synthesis and Spectral Characterization of CoxMg1−xAl2O4 as New Nano-Coloring Agent of Ceramic Pigment. Spectrochim. Acta Part A Mol. Biomol. Spectrosc. 2009, 74, 665–672. [Google Scholar] [CrossRef] [PubMed]
- Robertson, L.; Duttine, M.; Gaudon, M.; Demourgues, A. Cobalt–Zinc Molybdates as New Blue Pigments Involving Co2+ in Distorted Trigonal Bipyramids and Octahedra. Chem. Mater. 2011, 23, 2419–2427. [Google Scholar] [CrossRef]
- Gorodylova, N.; Kosinová, V.; Dohnalová, Ž.; Bělina, P.; Šulcová, P. New Purple-Blue Ceramic Pigments Based on CoZr4(PO4)6. Dye. Pigm. 2013, 98, 393–404. [Google Scholar] [CrossRef]
- Erič, S.; Kostić-Gvozdenović, L.; Miladinović, M.; Pavlović, L. Synthesis of cobalt-based ceramic pigments from industrial waste materials. Ceramics-Silikáty 1990, 34, 61–67. [Google Scholar]
- Cao, R.; Quan, G.; Shi, Z.; Luo, Z.; Hu, Q.; Guo, S. A Double Perovskite Ca2MgWO6:Bi3+ Yellow-Emitting Phosphor: Synthesis and Luminescence Properties. J. Lumin. 2017, 181, 332–336. [Google Scholar] [CrossRef]
- Xu, D.; Wu, X.; Zhang, Q.; Li, W.; Wang, T.; Cao, L.; Meng, J. Fluorescence Property of Novel Near-Infrared Phosphor Ca2MgWO6:Cr3+. J. Alloys Compd. 2018, 731, 156–161. [Google Scholar] [CrossRef]
- Jiang, Y.; Tong, Y.; Chen, S.; Zhang, W.; Hu, F.; Wei, R.; Guo, H. A Three-Mode Self-Referenced Optical Thermometry Based on up-Conversion Luminescence of Ca2MgWO6:Er3+, Yb3+ Phosphors. Chem. Eng. J. 2021, 413, 127470. [Google Scholar] [CrossRef]
- Luo, Y.; Xue, J.; Zhu, X.; Daniel, J.; Gao, X.; Sun, S.; Gao, C.; Bao, J. Enhanced Photocatalytic Oxygen Evolution over Mo-Doped Ca2NiWO6 Perovskite Photocatalyst under Visible Light Irradiation. RSC Adv. 2017, 7, 5821–5826. [Google Scholar] [CrossRef]
- Li, D.; Zheng, J.; Zou, Z. Band Structure and Photocatalytic Properties of Perovskite-Type Compound Ca2NiWO6 for Water Splitting. J. Phys. Chem. Solids 2006, 67, 801–806. [Google Scholar] [CrossRef]
- Williamson, G.K.; Hall, W.H. X-Ray Line Broadening from Filed Aluminium and Wolfram. Acta Metall. 1953, 1, 22–31. [Google Scholar] [CrossRef]
- Guan, D.; Zhong, J.; Xu, H.; Huang, Y.-C.; Hu, Z.; Chen, B.; Zhang, Y.; Ni, M.; Xu, X.; Zhou, W.; et al. A Universal Chemical-Induced Tensile Strain Tuning Strategy to Boost Oxygen-Evolving Electrocatalysis on Perovskite Oxides. Appl. Phys. Rev. 2022, 9, 011422. [Google Scholar] [CrossRef]
- Momma, K.; Izumi, F. VESTA 3 for Three-Dimensional Visualization of Crystal, Volumetric and Morphology Data. J. Appl. Crystallogr. 2011, 44, 1272–1276. [Google Scholar] [CrossRef]
- Shannon, R.D. Revised Effective Ionic Radii and Systematic Studies of Interatomic Distances in Halides and Chalcogenides. Acta Cryst. 1976, A32, 751–767. [Google Scholar] [CrossRef]
- Barreca, D.; Massignan, C.; Daolio, S.; Fabrizio, M.; Piccirillo, C.; Armelao, L.; Tondello, E. Composition and Microstructure of Cobalt Oxide Thin Films Obtained from a Novel Cobalt(II) Precursor by Chemical Vapor Deposition. Chem. Mater. 2001, 13, 588–593. [Google Scholar] [CrossRef]
- Li, K.; Xue, D. Estimation of Electronegativity Values of Elements in Different Valence States. J. Phys. Chem. A 2006, 110, 11332–11337. [Google Scholar] [CrossRef] [PubMed]
- Tauc, J.; Grigorovici, R.; Vancu, A. Optical Properties and Electronic Structure of Amorphous Germanium. Phys. Stat. Sol. 1966, 15, 627–637. [Google Scholar] [CrossRef]
- Guan, D.; Wang, B.; Zhang, J.; Shi, R.; Jiao, K.; Li, L.; Wang, Y.; Xie, B.; Zhang, Q.; Yu, J.; et al. Hydrogen Society: From Present to Future. Energy Environ. Sci. 2023, 16, 4926–4943. [Google Scholar] [CrossRef]
Disclaimer/Publisher’s Note: The statements, opinions and data contained in all publications are solely those of the individual author(s) and contributor(s) and not of MDPI and/or the editor(s). MDPI and/or the editor(s) disclaim responsibility for any injury to people or property resulting from any ideas, methods, instructions or products referred to in the content. |
© 2024 by the authors. Licensee MDPI, Basel, Switzerland. This article is an open access article distributed under the terms and conditions of the Creative Commons Attribution (CC BY) license (https://creativecommons.org/licenses/by/4.0/).