Article

Preparation of Hollow Core–Shell Fe3O4/Nitrogen-Doped Carbon Nanocomposites for Lithium-Ion Batteries

1
School of Chemistry and Chemical Engineering, Yangzhou University, Yangzhou 225002, China
2
Hengshanqiao Senior Middle School, Wujin District, Changzhou 213119, China
3
National Joint Engineering Research Center for Abrasion Control and Molding of Metal Materials & Henan Key Laboratory of High-Temperature Structural and Functional Materials, Henan University of Science and Technology, Luoyang 471003, China
4
College of Materials Science and Technology, Nanjing University of Aeronautics and Astronautics, Nanjing 210016, China
*
Authors to whom correspondence should be addressed.
Molecules 2022, 27(2), 396; https://doi.org/10.3390/molecules27020396
Submission received: 30 November 2021 / Revised: 29 December 2021 / Accepted: 5 January 2022 / Published: 8 January 2022

Abstract

:
Iron oxides are potential electrode materials for lithium-ion batteries because of their high theoretical capacities, low cost, rich resources, and their non-polluting properties. However, iron oxides demonstrate large volume expansion during the lithium intercalation process, resulting in the electrode material being crushed, which always results in poor cycle performance. In this paper, to solve the above problem, iron oxide/carbon nanocomposites with a hollow core–shell structure were designed. Firstly, an Fe2O3@polydopamine nanocomposite was prepared using an Fe2O3 nanocube and dopamine hydrochloride as precursors. Secondly, an Fe3O4@N-doped C composite was obtained by means of further carbonization treatment. Finally, Fe3O4@void@N-Doped C-x composites with core–shell structures with different void sizes were obtained by means of Fe3O4 etching. The effect of the etching time on the void size was studied. The electrochemical properties of the composites when used as lithium-ion battery materials were studied in more detail. The results showed that the sample that was obtained via etching for 5 h using 2 mol L−1 HCl solution at 30 °C demonstrated better electrochemical performance. The discharge capacity of the Fe3O4@void@N-Doped C-5 was able to reach up to 1222 mA g h−1 under 200 mA g−1 after 100 cycles.

1. Introduction

With the rapid development of the global economy, the shortage of fossil fuels and the worsening of environmental pollution have become a great threat to mankind. Therefore, people must develop green and environmentally friendly clean energy to replace traditional fossil fuels [1,2,3,4]. Solar, wind, and tidal energy are renewable and result in lower levels of pollution, making electricity generated from them a good alternative [5,6,7,8]. However, these sources are often intermittently limited. Electrochemical energy storage provides a feasible way to store electric energy [9,10,11,12]. On the one hand, it can solve the intermittence problem of the above energy sources. On the other hand, this allows the mobile storage of energy. Among various electrochemical energy storage devices, lithium-ion batteries have attracted more and more attention because of their high energy density, long life cycle, and environmental friendliness [13,14,15,16,17].
As an important branch of anode materials for lithium-ion batteries, transition metal oxides (MxOy, M = Fe, Co, Ni, Cu, Mn, etc.) have attracted more and more attention. The conversion reaction between transition metal oxides and lithium ion means that they have a high lithium storage capacity [18,19,20,21,22]: MxOy + 2yLi+ + 2ye = yLi2O + xM. In general, transition metal oxides have a significantly higher theoretical specific capacity than graphite when used as anode materials for lithium-ion batteries [23,24,25]. However, it is inevitable that transition metal oxides will experience large volume deformation during the cycling process, which leads to the pulverization of the electrode materials and also results in serious capacity fading [26,27,28,29]. Researchers have started to pay a great deal of attention to one of the transition metal oxides, iron oxide (FeOx). Compared to other metal oxides, such as CoOx and NiO, FeOx has the advantages of being a cheap and abundant resource that is also environmentally friendly [30,31,32]. However, the volume expansion effect and low electrical conductivity limit the application of FeOx in production [30,33,34,35].
Forming composite materials with a carbon coating is an effective way to improve the performance of iron oxides [36,37]. On the one hand, carbon coating can improve the electrical conductivity of electrode materials. On the other hand, it can alleviate the volume expansion effect of iron oxides during the cycling process [36,37]. The conductivity of carbon materials obtained via the carbonization of common carbon sources is usually not good. By doping carbon with nitrogen, the conductivity of carbon materials can be greatly improved in order to better improve the electrochemical performance of iron oxides [38,39,40,41,42,43,44,45,46]. In addition, relevant studies show that the nano-cavity structure can accommodate the volume deformation of the electrode material well during the cycling process, thus improving the cycling performance of the material [47,48]. In this work, Fe2O3 cubes with uniform size are prepared by means of the hydrothermal method. Then, polydopamine is coated on the surface of Fe2O3 cubes. After carbonization, Fe3O4@nitrogen-doped carbon (N-doped C) composites are formed (Scheme 1). The composite is further etched with hydrochloric acid to prepare the core-shell Fe3O4@void@N-doped C nanocomposites (Scheme 1). The void size of the nanocomposites can be regulated via controlling the etching time, improving the performance of FeOx so that it can be used as the electrode material in lithium-ion batteries. A series of Fe3O4@void@N-doped C-x nanocomposites (x is 2, 5, and 10, representing the etching time of 2 h, 5 h and 10 h, respectively) were obtained by etching the carbonized product in acid different numbers of times.

2. Results and Discussion

Figure S1a (see Supplementary Materials) shows the X-ray diffraction (XRD) pattern of the Fe2O3 precursor. Compared to the standard cards, the characteristic peaks of the Fe2O3 cube samples are consistent with the standard peaks of α-Fe2O3 (JCPDS:33-0664). Figure S1b shows the XRD pattern of an Fe3O4@void@N-doped C-2 composite. Compared to the standard card (JCPDS:19-0629), it can be seen that the main characteristic peaks of Fe3O4@void@N-doped C-2 are consistent with the standard peaks of Fe3O4, and the impurity peaks of FeO also appear. This shows that during the carbonization process, most of the Fe2O3 is converted into Fe3O4 and that some of it is converted into FeO.
Figure 1a,b and Figure S2a are scanning electron microscope (SEM) and transmission electron microscope (TEM) images of an Fe2O3 precursor. A large area of cubes with an average size of about 600 nm can be clearly observed. Figure 1c and Figure S3a,b are SEM images of an Fe2O3@PDA composite material. It can be observed that the Fe2O3 cube is coated with a dopamine nanolayer. Figure 1d is a TEM image of the Fe2O3@PDA cube. It is more obvious that the Fe2O3 cube is coated with a dopamine nanolayer, and the average thickness of the coated PDA layer is about 25 nm. Figure 1e,f and Figure S4a,b are SEM and TEM images of the heat-treated Fe3O4@N-doped C sample. It can also be clearly observed from Figure 1e and Figure S5a,b that voids appear in each cube. This is because the Fe2O3 cube is converted into Fe3O4 and FeO under the reductive atmosphere that is generated by dopamine in the process of high temperature carbonization, resulting in volume shrinkage. From the TEM image in Figure 1f, the carbon layer structure and hollow groove structure on the surface of the cube can be observed more clearly.
Figure 2a,b are the SEM and TEM images of Fe3O4@void@N-doped C-2. It can be seen that the void in the cube is obviously larger than the carbonization product before treatment. After 5 h of etching under the same conditions, it can be observed that the void in the cube becomes larger, that some Fe3O4 particles present a hollow structure, and that the core–shell structure is more obvious (Figure 2c,d). After 10 h of etching, it can be observed from Figure 2e,f that the void in the cube continued to grow. This shows that the longer the etching time in hydrochloric acid is at a certain concentration, the larger the corresponding void will be. In addition, Figure 2g,h show that the internal Fe3O4 of the Fe3O4@N-doped C composite has been completely etched after 2 h of etching with 4 mol L−1 hydrochloric acid at 30 °C, forming a hollow carbon cube structure. The above results show that the overall morphology of the material basically does not change before and after heat treatment, and the external carbon layer can still cover the Fe3O4 particle. After a certain etching period, the core–shell structure is formed. Thermogravimetric analysis (TG) was used to detect the carbon content of the composites (Figure S5). It can be seen from the test results that the mass increases from about 225 °C. This is because Fe3O4 is gradually oxidized into Fe2O3 as the temperature increases. The apparent subsequent weightlessness corresponds to the oxidation of carbon to CO2. After the calculation, the carbon contents of the Fe3O4@void@N-doped C-x composites (x = 2, 5 and 10) were determined to be 6.3%, 11.7%, and 20.0%, respectively.
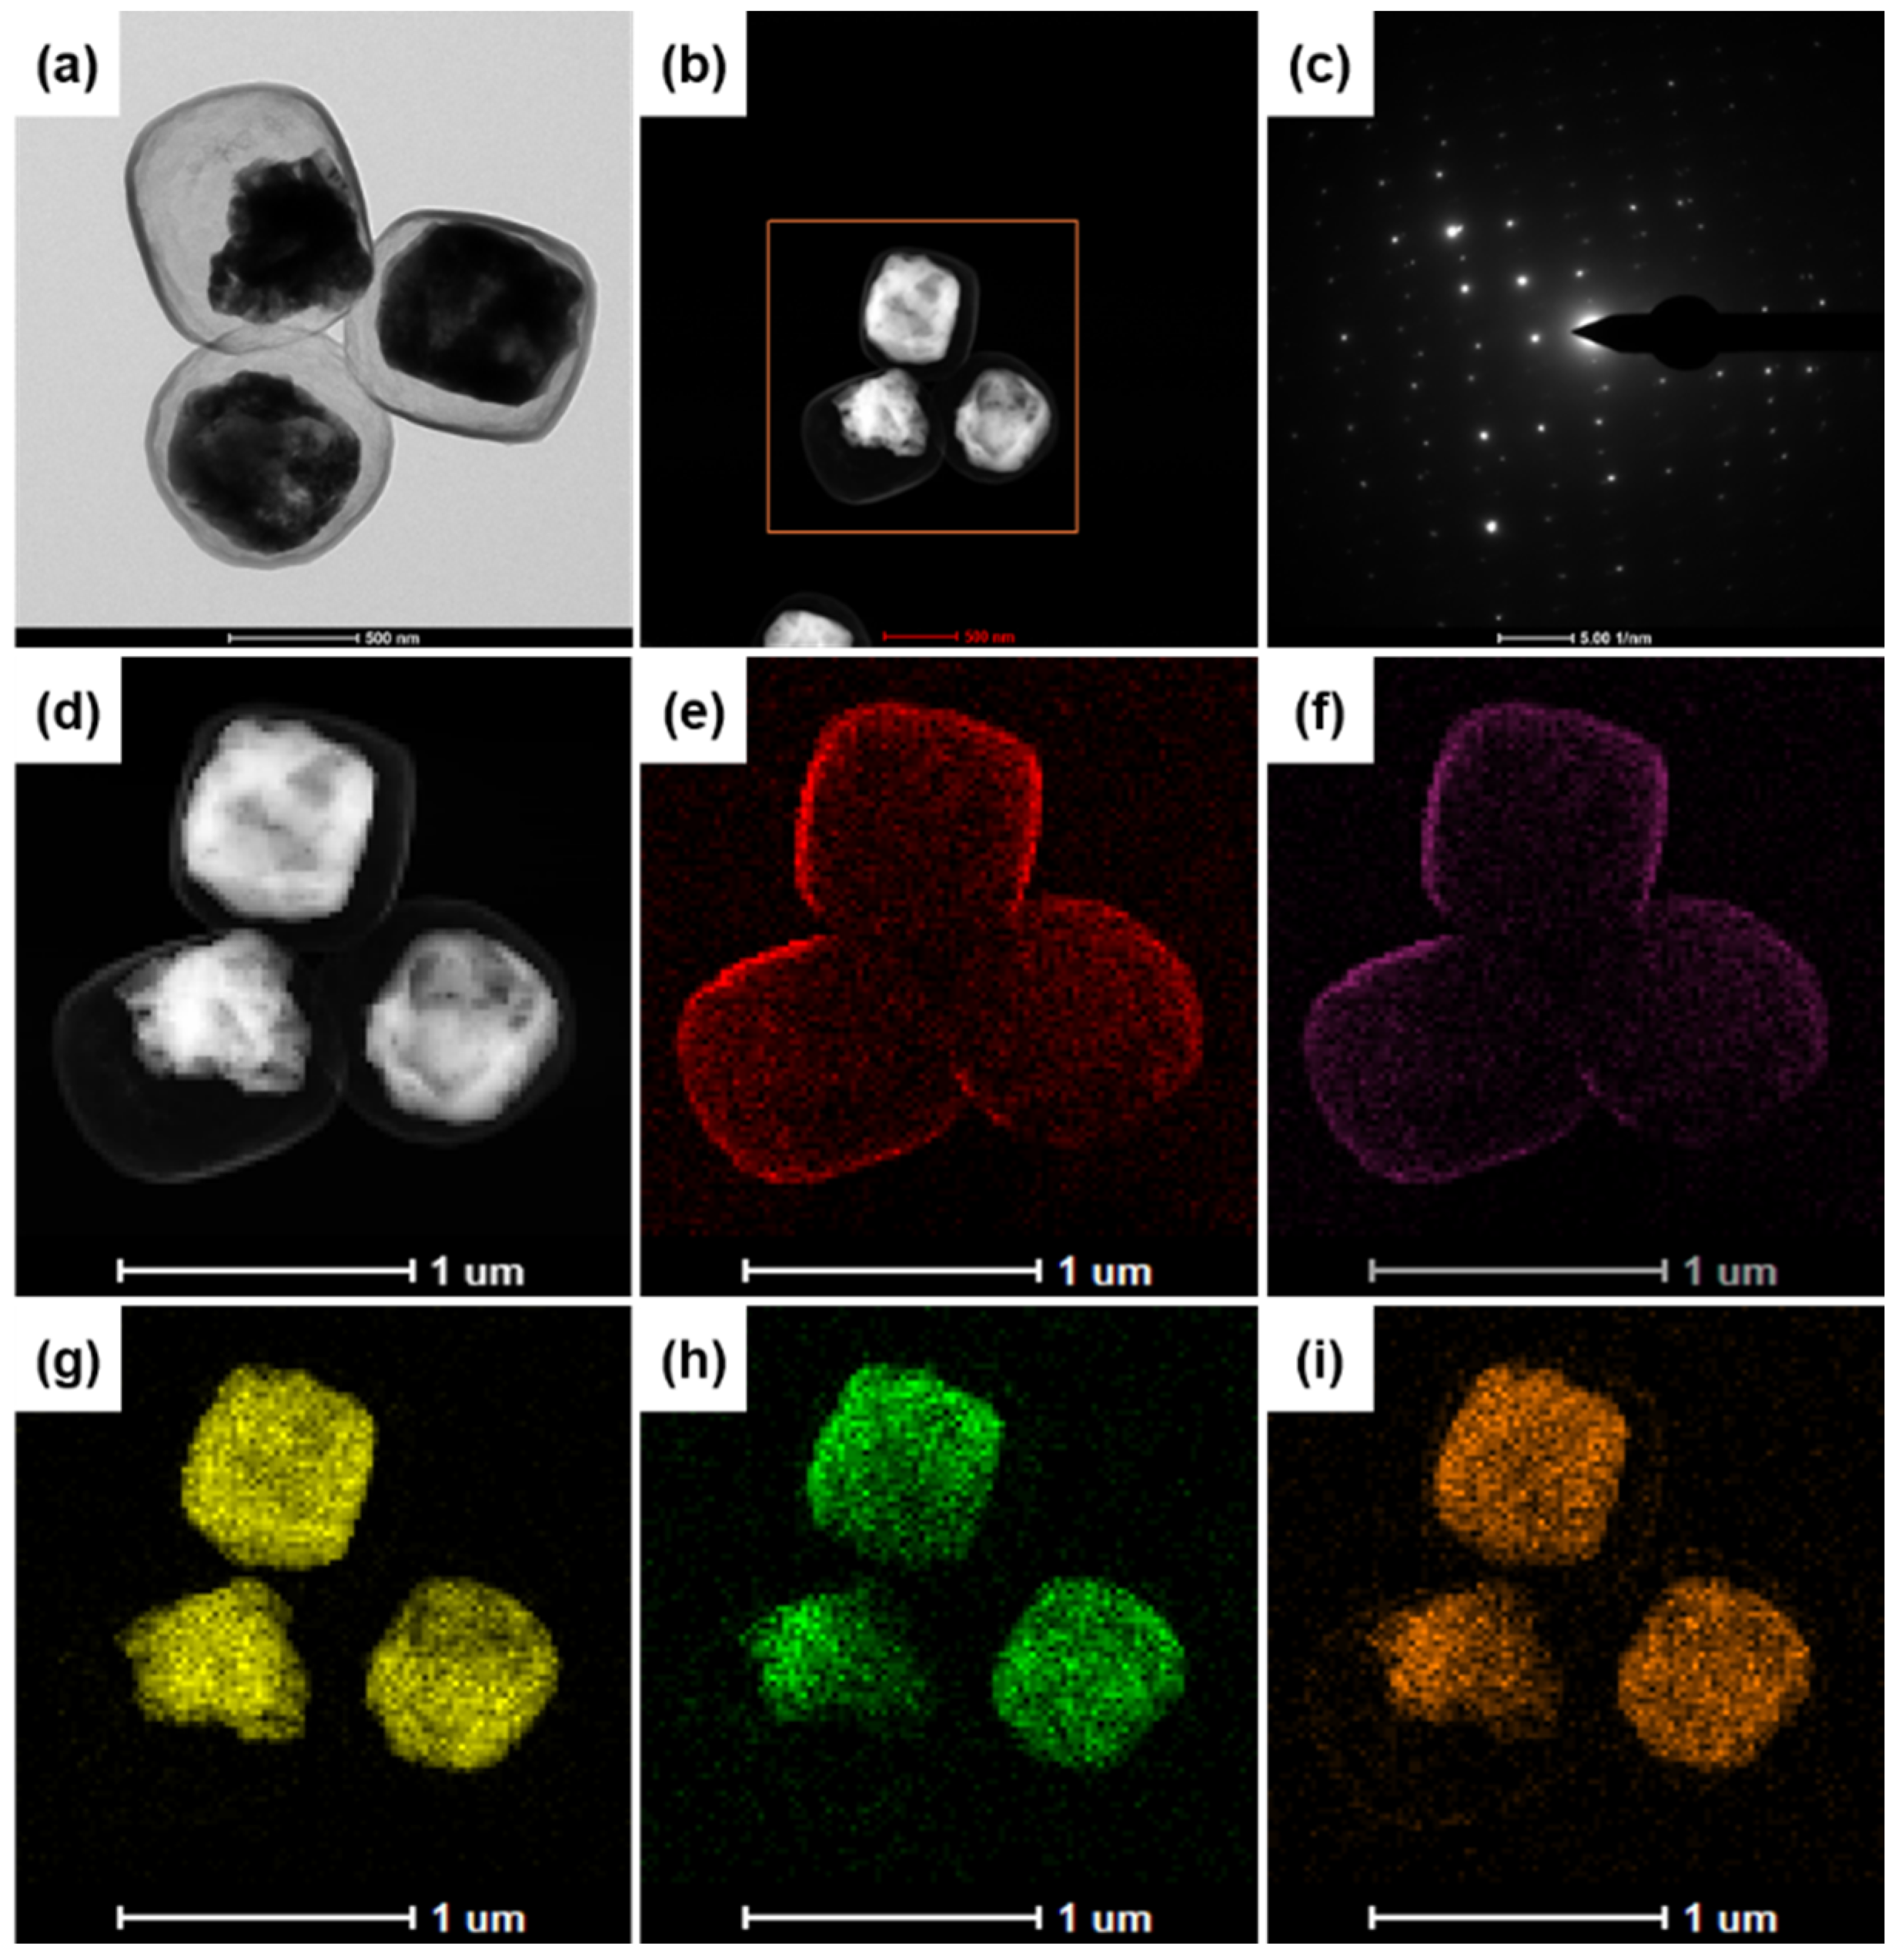
Figure 3 shows the energy dispersive spectroscopy (EDS) element mapping analysis results for the Fe3O4@void@N-doped C-5 composite. The results show that the Fe3O4@void@N-doped C-5 composite contains four elements: Fe, O, N, and C. Figure 3d–i show that the carbon layer completely wraps the inner Fe3O4, which is also effective in proving the existence of the core-shell structure. There is an obvious gap between the core and the shell, which is consistent with previous SEM and TEM results. In addition, Figure 3e,f show that N is evenly distributed in the carbon shell, which indicates that nitrogen doping is achieved when PDA is used as a carbon source. In addition, the electron diffraction image (Figure 3c) shows that the Fe3O4 core has a single crystal structure.
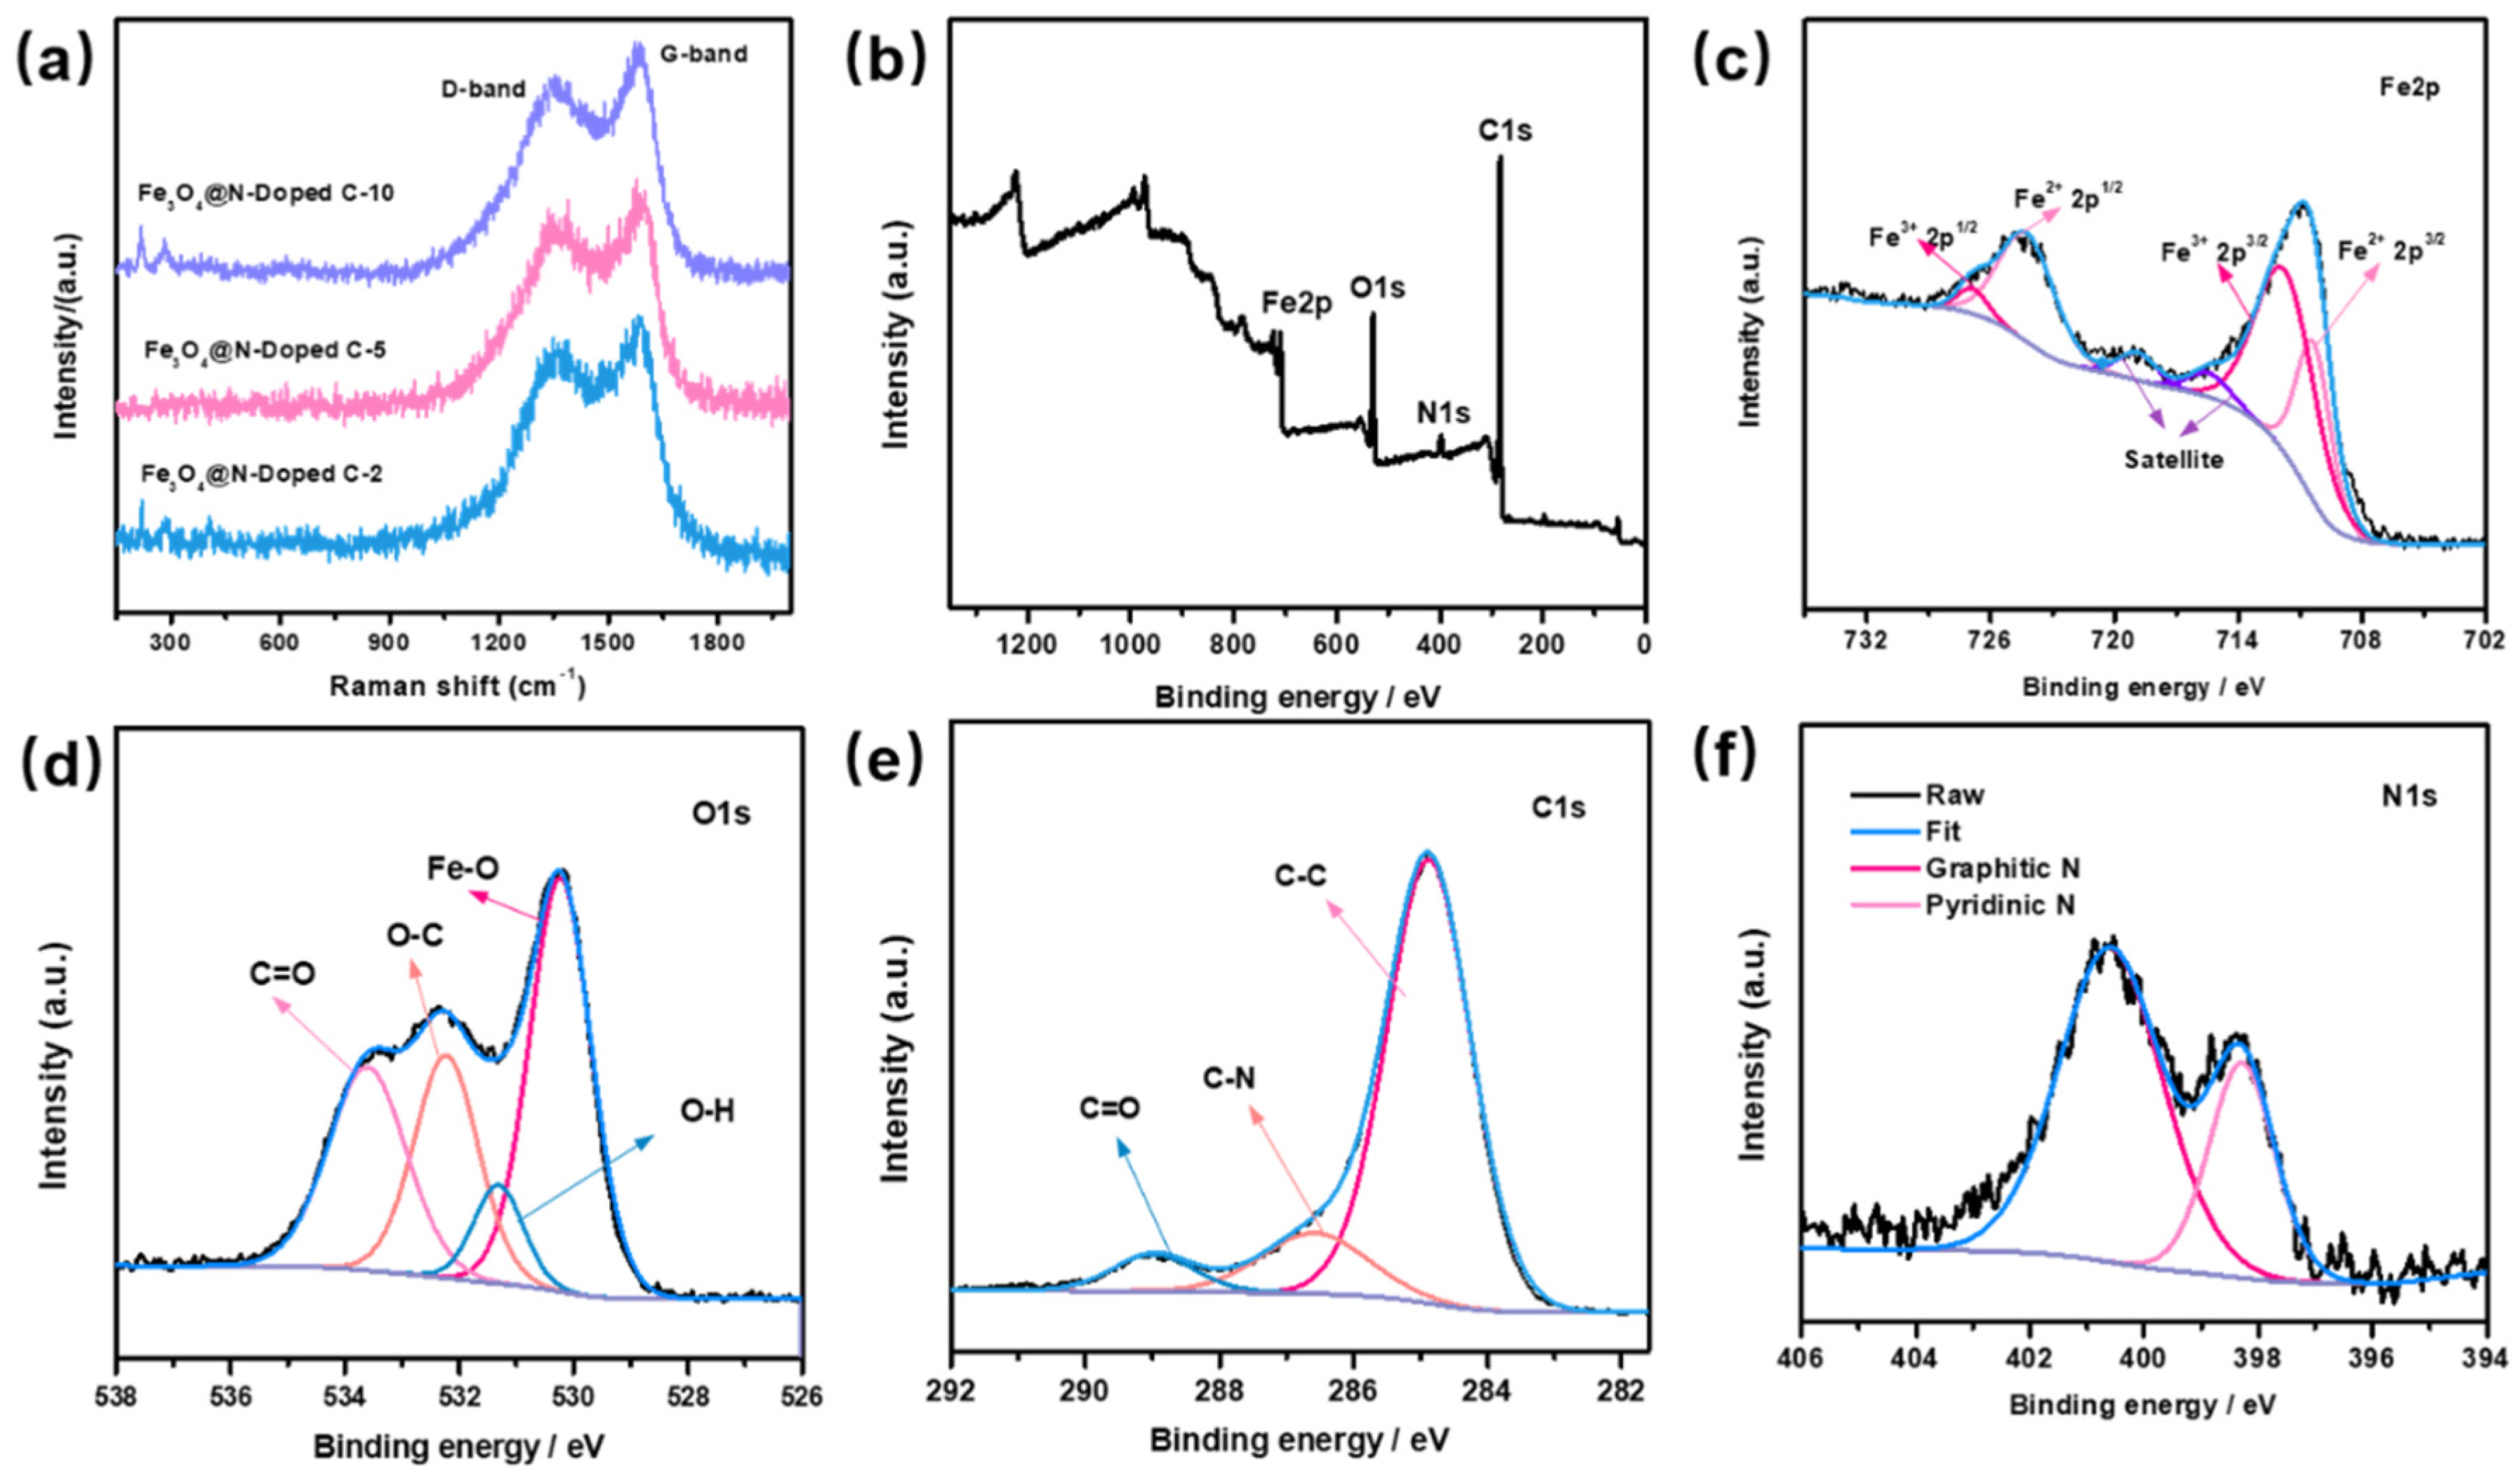
Figure 4a shows the Raman spectra of the Fe3O4@void@N-doped C-x composite. Raman peaks appear at the positions at about 1300 and 1580 cm−1. The peak around 1300 cm−1 is known as the D peak for carbon, which is caused by atomic lattice defects on the surface of the carbon material. The peak at about 1580 cm−1 is known as the G peak of carbon, which is formed by the graphitization of carbon material. The appearance of the D peak and the G peak shows that the carbon materials that were formed by dopamine carbonization have internal defects and a certain degree of graphitization. The strength ratio (ID:IG) of the two peaks of the three composite materials was about 0.65. Because the three composite materials were formed via the etching of Fe3O4@N-doped C samples at different times, the strengths of peak D and peak G is not affected. In addition, very weak Raman characteristic peaks of Fe3O4 also appear at about 200 and 300 cm−1.
Figure 4b–f show the X-ray photoelectron spectroscopy (XPS) analysis results of the Fe3O4@void@N-doped C-5 composite. The presence of Fe, O, C, and N can be observed from Figure 4b, which proves that the sample is composed of Fe, O, C, and N elements. Two characteristic peaks of Fe 2p can be clearly observed at 711.1 eV and 724.5 eV, respectively (Figure 4c). By calculating the peak area in the spectrogram, it can be known that the ratio of Fe3+ to Fe2+ is about 2:1, which is in agreement with the ratio of ferric iron to ferrous iron in Fe3O4. For the O 1s spectrogram (Figure 4d), there are three obvious characteristic peaks in the spectrogram at about 530.4, 532.3 and 533.7 eV, respectively, which correspond to the XPS peak of O2−. For the C 1s spectrogram (Figure 4e), the three smooth peaks at about 284.9, 286.6, and 289.1 eV correspond to C-C, C-N and C=O bonds, respectively. The characteristic peaks of graphite nitrogen and pyridine nitrogen can be clearly observed in the N 1s spectrogram (Figure 4f) and correspond to 400.8 eV and 398.5 eV, respectively. Through XPS analysis, it can be further proven that nitrogen-doped carbon is formed after the carbonization of PDA.
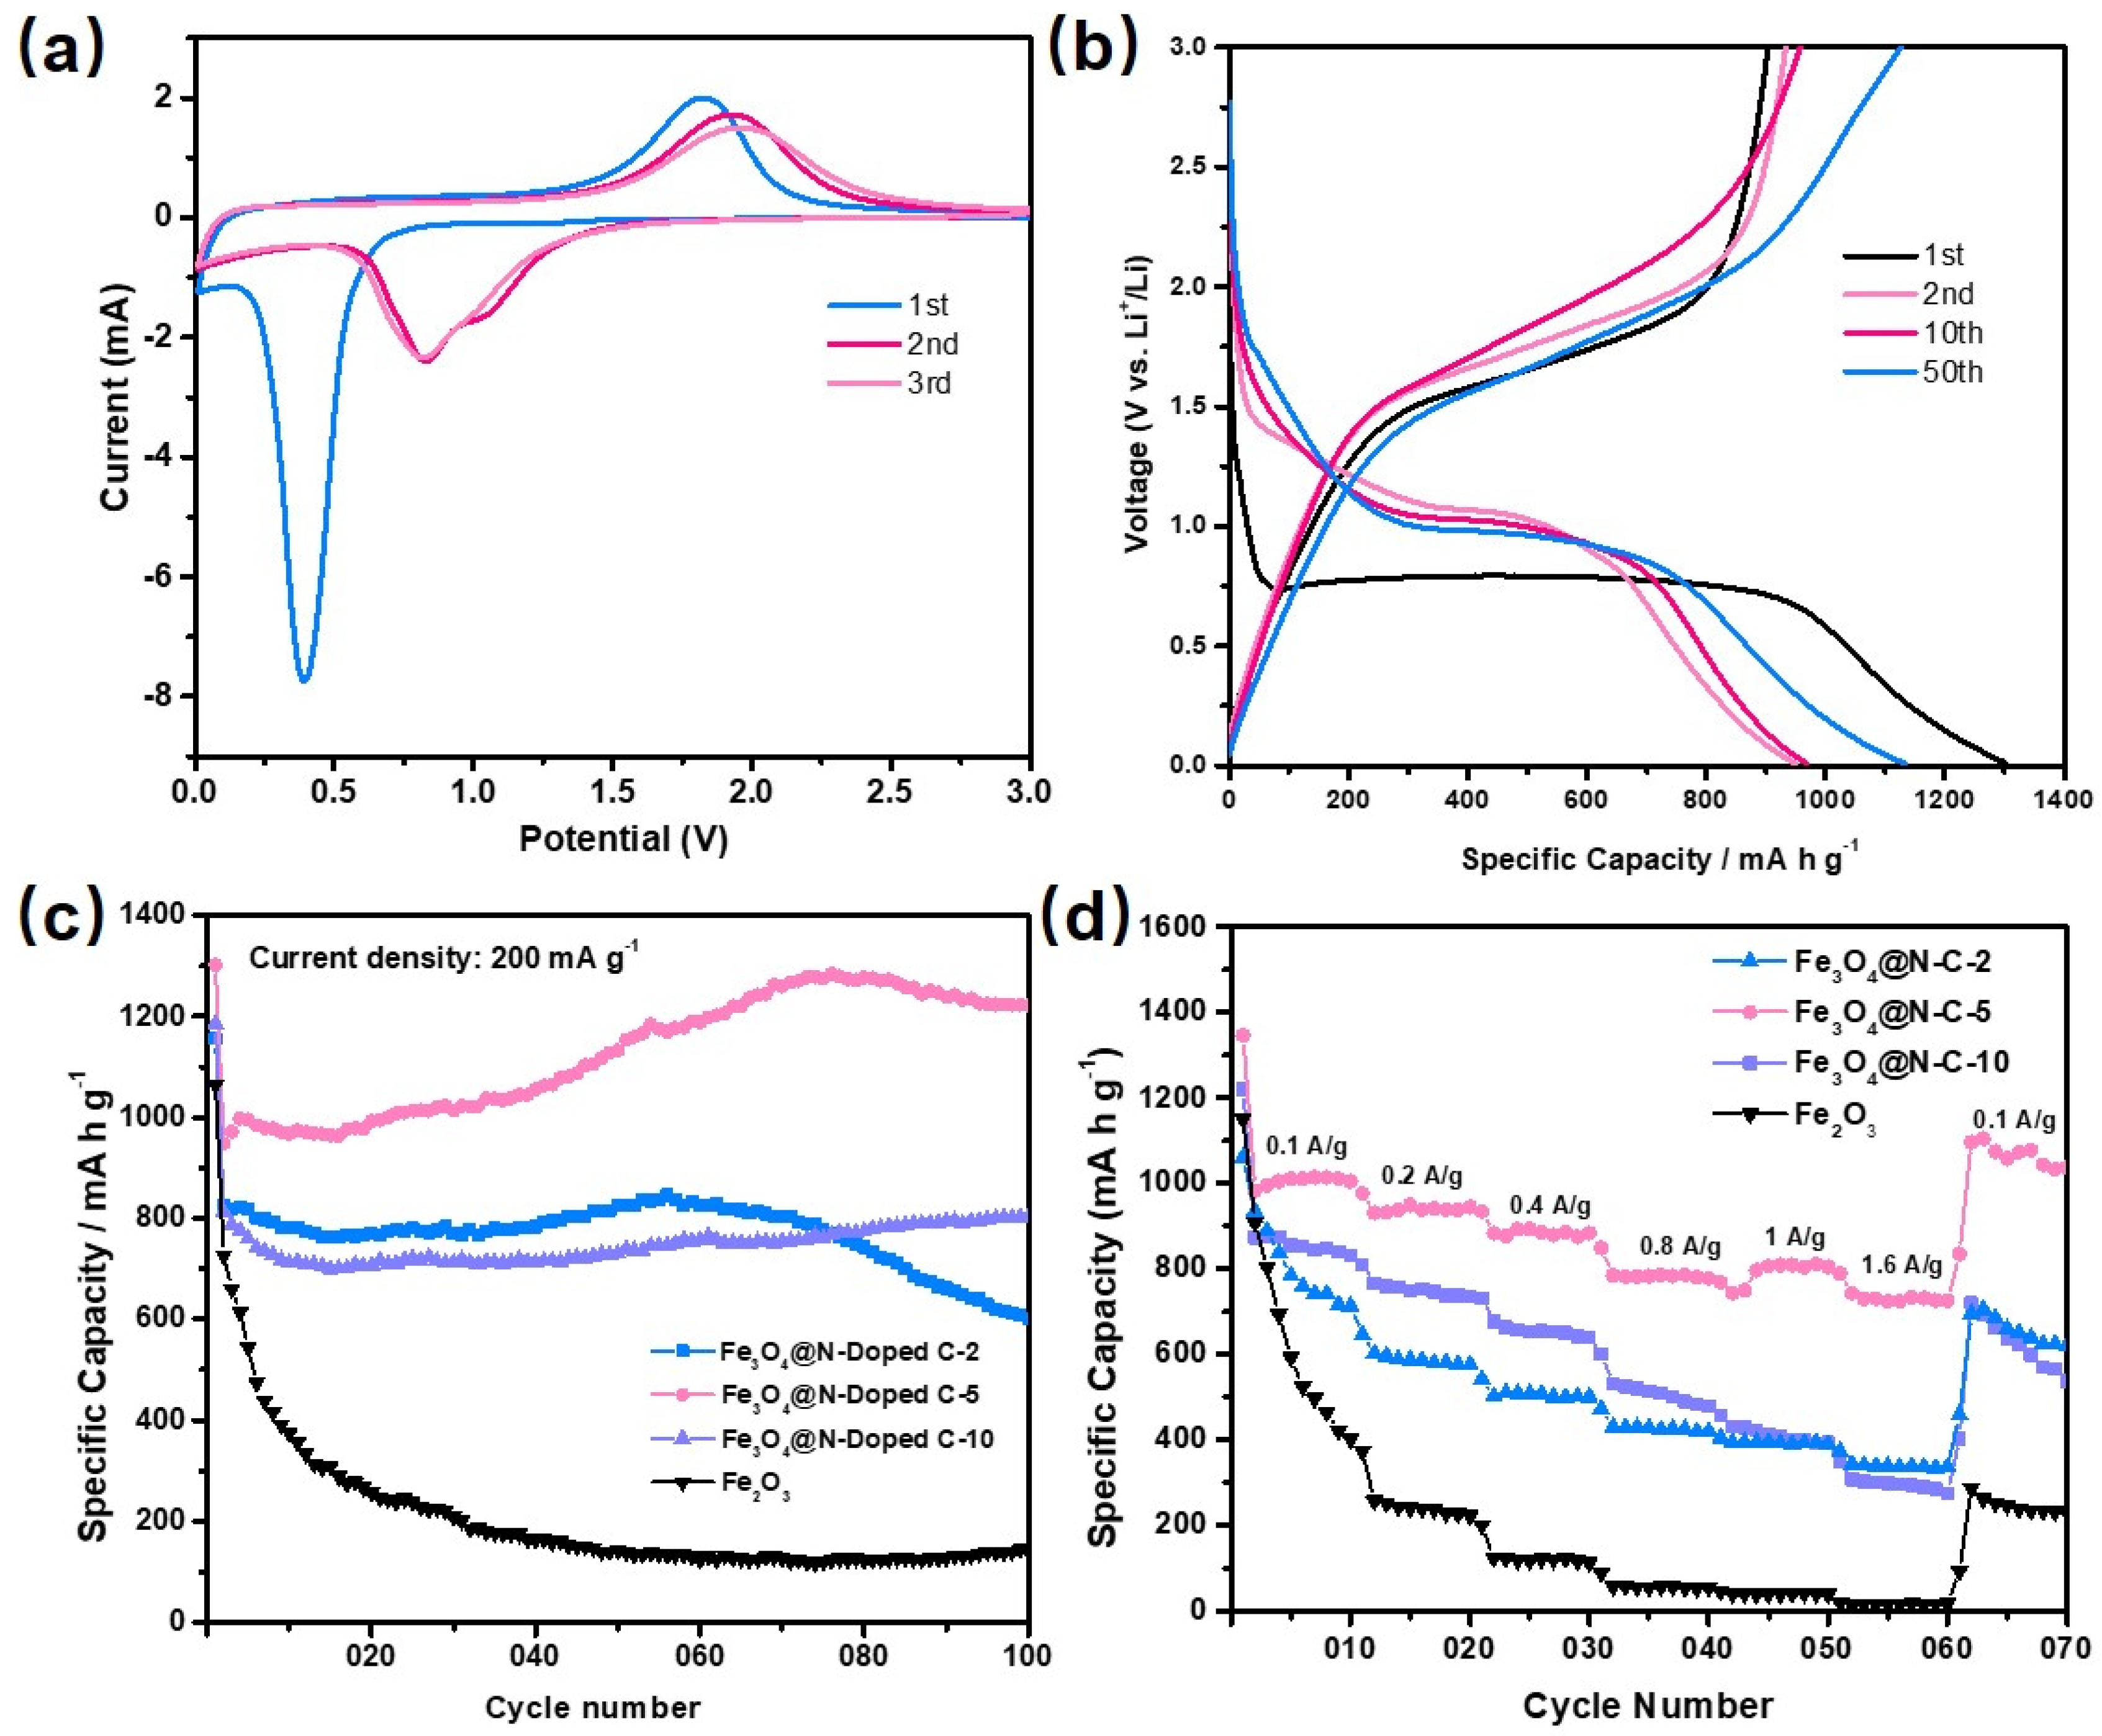
Figure 5a and Figures S6a, S7a, S8a show the cyclic voltammetry (CV) curves of the Fe2O3 and Fe3O4@void@N-doped C-x composite materials (x = 2, 5 and 10) with a voltage range of 0.01–3.0 V and a voltage scanning speed of 0.5 mV S−1. In Figure S6a, there is an obvious reduction peak at 0.43 V in the first cycle of the CV curve. The reduction peak here is due to the reduction of Fe2O3 to Fe and the formation of Li2O (Fe2O3 + 6Li+ + 6e→2Fe + 3Li2O). Due to the solid electrolyte interface (SEI) membrane formed by some of the materials and some of the electrolytes at the same time, the position and intensity of the reduction peak in the following two cycles demonstrate obvious changes [49,50,51]. In the CV curve, the oxidation peak appears at 1.72 V, where the oxidation process is the oxidation of Fe to Fe3+. In the following two cycles, the oxidation peak appears to have been obviously attenuated, indicating that the cycling performance of the Fe2O3 cube sample is poor. Figure 5a and Figures S7a, S8a show the CV curves of the composites of the Fe3O4@void@N-doped C-x. The main active material in the three composites is Fe3O4, and the reduction reaction that takes place during the first cycling is Fe3O4 + 8Li+ + 8e →3Fe + 4Li2O. The difference between the three samples is only the void size of the core–shell structure. Therefore, their CV curves are basically same. The reduction peak of the Fe3O4@void@N-doped C-2 in the first cycle is at 0.36 V and tends to be stable after shifting to 0.8 V in the subsequent cycle. The corresponding oxidation peak is at 1.82 V and tends to be stable after shifting to 2 V in the subsequent cycle. In addition, the change trend in the redox peak in the Fe3O4@void@N-doped C-5 and Fe3O4@void@N-doped C-10 cycles is similar to that of Fe3O4@void@N-doped C-2.
Figure S6b shows the charge–discharge curve of the cubic Fe2O3. The current density is 200 mA g−1, and the tested charge–discharge voltage range is 0.01–3 V. It can be observed that the specific capacities of the first discharge and charge cycle of the cubic Fe2O3 are 1064.8 mA h g−1 and 690.7 mA h g−1, indicating that the cubic Fe2O3 material has a large irreversible capacity for the first cycle. At the 2nd, 10th, and 50th cycles, the discharge specific capacities are 72.6.4, 373.9, and 143.5 mA h g−1, respectively. The cycle capacity decreases rapidly, indicating that the cycle performance of the cubic Fe2O3 is very poor. Figure 5b and Figures S7b, S8b show the representative charge–discharge curves of the first 50 cycles of the Fe3O4@void@N-doped C-x (x = 2, 5, 10) at a 200 mA g−1 current density. It can be observed that the first discharge platform of the three materials is about 0.75 V, which corresponds to the position of a reduction peak in the CV curve. The initial specific discharge capacities of the Fe3O4@void@N-doped C-2, Fe3O4@void@N-doped C-5, and Fe3O4@void@N-doped C-10 are 1155.8, 1302.4, and 1185.9 mA h g−1, respectively. The specific charging capacities are 827.3, 903.6 and 807.8 mA h g−1, respectively, which are lower than the corresponding specific discharge capacities, indicating that the composite also has a specific first irreversible capacity. Relative to the specific initial discharge capacity, the irreversible capacity loss is mainly due to the formation of SEI films. Through the comparison of the four samples, it can be seen that the initial discharge capacity of the composite materials is higher than that of the pure cubic Fe2O3, which is due to the nitrogen-doped carbon significantly improving the conductivity of the composite materials. After 50 cycles, the charge–discharge capacity of the cubic Fe2O3 is significantly lower than that of the Fe3O4@void@N-doped C-x composite, and the capacity fading phenomenon is very serious. However, Fe3O4@void@N-doped C-x still maintains a high specific capacity after 50 cycles, indicating that the cycling performance of the inner Fe3O4 core is significantly improved under the protection of the carbon shell. Moreover, after the same 50 cycles, the specific discharge capacities of Fe2O3, Fe3O4@void@N-doped C-2, Fe3O4@void@N-doped C-5, and Fe3O4@void@N-doped C-10 are 143.5, 825.8, 1132.9, and 730 mA h g−1, respectively. With the increase in void size, the specific capacity of the composites does not increase correspondingly, and the Fe3O4@void@N-doped C-5 material with a suitable core–shell void size shows the maximum specific capacity. The specific capacity of the Fe3O4@void@N-doped C-10 is lower than that of Fe3O4@void@N-doped C-5. This is probably due to the fact that the relative content of active Fe3O4 in Fe3O4@void@N-doped C-10 is lower than that of the Fe3O4@void@N-doped C-5 sample. For Fe3O4@void@C-2, although its Fe3O4 content is very high, the high Fe3O4 content will result in the composite having low overall conductivity. Therefore, its specific capacity is also lower than that of Fe3O4@void@N-doped C-5.
Figure 5c shows the cycle performance diagram of the cube Fe2O3 and the Fe3O4@void@N-doped C-x. The specific discharge capacities of the cubic Fe2O3, Fe3O4@void@N-doped C-2, Fe3O4@void@N-doped C-5, and Fe3O4@void@N-doped C-10 are 143.3, 601.4, 1222, and 802.9 mA h g−1 after 100 cycles, respectively, when the current density is 200 mA g−1 and when the charge and discharge voltage range is 0.01–3V. Comparing the four materials, the specific capacity of the carbon-coated composites is significantly higher than that of the simple Fe2O3 material. Among them, Fe3O4@void@N-doped C-5 has the highest specific capacity, and its capacity continues to increase during the cycle, which is mainly caused by the decomposition of electrolyte. After 60 cycles, the capacity of the Fe3O4@void@N-doped C-2 gradually decreases. This is probably due to the small size of the void between the core and shell of the composite material, which cannot completely alleviate the volume deformation of the Fe3O4 core during the charging and discharging process. With the increasing number of cycles, the ability of the shell to control the volume deformation of Fe3O4 gradually weakens. However, Fe3O4@void@N-doped C-5 and Fe3O4@void@N-doped C-10 show good cyclic stability due to their large internal void size.
The rate performance of the cubic Fe2O3 and Fe3O4@void@N-doped C-x (x = 2, 5 and 10) composites were further tested (Figure 5d). At the current densities of 100, 200, 400, 800, 1000, and 1600 mA g−1, the discharge specific capacities of Fe3O4@void@N-doped C-5 were determined to be 1010.2, 955.3, 889.6, 823.6, 833, and 735.5 mA h g−1, respectively. Although the specific capacity of the Fe3O4@void@N-doped C-5 composite decreased as the current density increased, it still showed a high specific capacity at 1600 mA g−1, indicating that the composite has a good rate performance. When the current density decreased to 100 mA g−1 again, the specific discharge capacity was able to increase to 1165.8 mA h g−1.
In addition, cyclic tests were also carried out for the Fe2O3 and Fe3O4@void@N-doped C-x composites at 800 mA g−1 (Figure S10). After 100 cycles, the specific discharge capacities of the cubic Fe2O3, Fe3O4@void@N-doped C-2, Fe3O4@void@N-doped C-5, and Fe3O4@void@N-doped C-10 materials were 67.8, 188, 602.5 and 506.6 mA h g−1, respectively. Compared to the cycle diagram at 200 mA g−1, the cycle performance at the high current density of 800 mA g−1 is inferior to that at the low current density of 200 mA g−1. In general, lithium-ion battery electrode materials often show better cycle performance at high current densities. However, for the Fe3O4@void@N-doped C-x composite materials, an abnormal phenomenon occurs. This is probably because the active material in the composite system is a single Fe3O4 crystal material with large particles, which is not suitable for charging and discharging with large currents. The electrochemical performance of the Fe3O4@void@N-doped C-5 was compared to the results from reports that have previously been published in the literature. The specific capacity and cycling performance of the Fe3O4@void@N-doped C-5 at 200 mA g−1 reached the level of other similar Fe3O4-based anode materials [52,53].
By comparing the related electrochemical test data above, among all of the composites, the Fe3O4@void@N-doped C-5 composite has the best cycling performance and rate performance. This is directly related to the appropriate acid etching time. The proper pore size between the carbon shell and the Fe3O4 core in the Fe3O4@void@N-doped C-5 material (larger than Fe3O4@void@N-doped C-2) can effectively alleviate the volume expansion of Fe3O4 during the cycle and can also facilitate electrolyte diffusion and the transmission of lithium ions. In addition, the relatively high content of the Fe3O4 active substance in the material (more than in Fe3O4@void@N-doped C-10) ensures its large specific capacity. After 100 cycles, the electrode based on Fe3O4@void@N-doped C-5 was characterized via SEM and TEM (Figures S11 and S12). The results show that the structure is essentially retained after 100 cycles. This indicates the good structural stability of the material during the charge/discharge process.
The electrochemical impedance spectroscopy (EIS) of the assembled lithium-ion battery was also measured in more detail. As shown in Figure S13, the EIS curves of the cube Fe2O3 and the Fe3O4@void@N-doped C-x composite are composed of a small semicircle and a straight line. The small semicircle in the high frequency region is related to the charge transmission process of the electrons and lithium ions at the conductive junction. The lines in the low-frequency region are related to the solid diffusion process of the lithium ions in the active material. It can be observed that the diameter of the small semicircular cube Fe2O3 is larger than that of the Fe3O4@void@N-doped C-x composite, indicating that its electrical conductivity is worse than that of the Fe3O4@void@N-doped C-x composite. The good conductivity of the composites can be attributed to the carbon coating formed by dopamine, which contains many unsaturated bonds (such as C=N and C=C bonds) that are able to provide a large number of excellent conductive matrices for Fe3O4. In addition, the lines in the low-frequency region are all close to 45o, indicating that the lithium ions have good diffusion ability in the active materials.

3. Conclusions

In this work, PDA was used as a carbon source to coat Fe2O3 cubes to form a nitrogen-doped carbon coating layer. Further, the acid etching method was used to prepare composite materials with a core–shell structure and with different void sizes to act as the electrode materials in a lithium-ion battery. The electrochemical test results show that the specific capacity of the composites did not increase as the void size increased. Among all of the samples, the Fe3O4@void@N-doped C-5 with the appropriate void size showed the largest specific capacity, the best cycling performance, and the best rate performance. At a current density of 200 mA g−1, the discharge capacity of the Fe3O4@void@N-doped C-5 was able to reach 1222 mA h g−1 after 100 cycles, which is much higher than the levels achieved by the cubic Fe2O3. The appropriate size of the void between the carbon shell and the Fe3O4 core is not only beneficial to alleviate the volume expansion of Fe3O4 during the cycle, but also to electrolyte diffusion and the transmission of lithium ions.

Supplementary Materials

The following supporting information can be downloaded via the following, Figure S1. (a) XRD patterns of cubic Fe2O3 and standard card; (b) XRD patterns of Fe3O4@void@N-Doped C-2 composite and standard card; Figure S2. (a,b) SEM images of cubic Fe2O3 at different magnification; Figure S3. (a,b) SEM images of cubic Fe2O3@PDA at different magnification; Figure S4. (a,b) SEM images of cubic Fe3O4@N-Doped C at different magnification; Figure S5. The thermogravimetric analysis curves of Fe3O4@void@N-doped C-x composite (x = 2, 5 and 10); Figure S6. (a) Cyclic voltammetry curves of the first three cycles of cubic Fe2O3; (b) Representative charge-discharge curves of cubic Fe2O3; Figure S7. (a) Cyclic voltammetry curves of Fe3O4@void@N-Doped C-2 composite; (b) Representative charge-discharge curves of Fe3O4@void@N-Doped C-2 composite; Figure S8. (a) Cyclic voltammetry curves of Fe3O4@void@N-Doped C-10 composites; (b) Representative charge-discharge curves of Fe3O4@void@N-Doped C-10 composites; Figure S9. dQ/dV curves of all samples for C/D profiles during the second cycling; Figure S10. 100 cycle diagrams of cubic Fe2O3 and Fe3O4@void@N-Doped C-x (x = 2, 5 and 10) composites at 800 mA g−1 current density; Figure S11. SEM images of Fe3O4@void@N-doped C after 100 cycles; Figure S12. TEM images of Fe3O4@void@N-doped C after 100 cycles; Figure S13. EIS curves of cubic Fe2O3 and Fe3O4@void@N-Doped C-x composites; Figure S14. Field-dependent magnetization curve of Fe2O3 measured at room temperature

Author Contributions

Data curation, J.W., Q.H., W.H.; writing—original draft preparation, J.W., Q.H., W.Z., Y.W.; writing—review and editing, K.P., M.Z., H.P.; funding acquisition, K.P., M.Z., H.P. All authors have read and agreed to the published version of the manuscript.

Funding

This research was supported by the National Natural Science Foundation of China (NSFC-U1904215), the Fundamental Research Funds for the Central Universities (No. NS2021039), the Top-notch Academic Programs Project of Jiangsu Higher Education Institutions (TAPP), the Natural Science Foundation of Jiangsu Province (BK20200044), the Program for Young Changjiang Scholars of the Ministry of Education (Q2018270), And the Open Fund of the National Joint Engineering Research Center for abrasion control and molding of metal materials (HKDNM2019010). We also acknowledge the Priority Academic Program Development of Jiangsu Higher Education Institutions and the technical support we received at the Testing Center of Yangzhou University.

Institutional Review Board Statement

Not applicable.

Informed Consent Statement

Not applicable.

Data Availability Statement

Not applicable.

Conflicts of Interest

The authors declare no conflict of interest.

Sample Availability

Samples of the compounds are not available from the authors.

References

  1. Kim, H.; Hong, J.; Park, K.-Y.; Kim, H.; Kim, S.-W.; Kang, K. 3D-0D Graphene-Fe3O4 Quantum Dot Hybrids as High-Performance Anode Materials for Sodium-Ion Batteries. Chem. Rev. 2014, 114, 11788–11827. [Google Scholar] [CrossRef]
  2. Yuan, C.; Wu, H.B.; Xie, Y.; Lou, X.W. Mixed Transition-Metal Oxides: Design, Synthesis, and Energy-Related Applications. Angew. Chem. Int. Ed. 2014, 53, 1488–1504. [Google Scholar] [CrossRef]
  3. Hu, W.; Zheng, M.; Xu, B.; Wei, Y.; Zhu, W.; Li, Q.; Pang, H. Design of Hollow Carbon-based Materials Derived from Metal–Organic Frameworks for Electrocatalysis and Electrochemical Energy Storage. J. Mater. Chem. A 2021, 9, 3880–3917. [Google Scholar] [CrossRef]
  4. Du, M.; Li, Q.; Zhao, Y.; Liu, C.S.; Pang, H. A Review of Electrochemical Energy Storage Behaviors Based on Pristine Metal–Organic Frameworks and Their Composites. Coord. Chem. Rev. 2020, 416, 213341. [Google Scholar] [CrossRef]
  5. Singh, G.K. Solar Power Generation by PV (Photovoltaic) Technology: A Review. Energy 2013, 53, 1–13. [Google Scholar] [CrossRef]
  6. Chen, B.; Yang, Y.; Wang, Z.L. Scavenging Wind Energy by Triboelectric Nanogenerators. Adv. Energy Mater. 2018, 8, 1702649. [Google Scholar] [CrossRef]
  7. Rourke, F.O.; Boyle, F.; Reynolds, A. Tidal Energy Update 2009. Appl. Energy 2010, 87, 398–409. [Google Scholar] [CrossRef]
  8. Liu, H.; Jia, M.; Zhu, Q.; Cao, B.; Chen, R.; Wang, Y.; Wu, F.; Xu, B. 3D-0D Graphene-Fe3O4 Quantum Dot Hybrids as High-Performance Anode Materials for Sodium-Ion Batteries. ACS Appl. Mater. Interfaces 2016, 8, 26878–26885. [Google Scholar] [CrossRef]
  9. Guo, M.; Balamurugan, J.; Li, X.; Kim, N.H.; Lee, J.H. Hierarchical 3D Cobalt-Doped Fe3O4 Nanospheres@NG Hybrid as an Advanced Anode Material for High-Performance Asymmetric Supercapacitors. Small 2017, 13, 1701275. [Google Scholar] [CrossRef]
  10. Cao, X.; Tan, C.; Zhang, X.; Zhao, W.; Zhang, H. Solution-Processed Two-Dimensional Metal Dichalcogenide-Based Nanomaterials for Energy Storage and Conversion. Adv. Mater. 2016, 28, 6167–6196. [Google Scholar] [CrossRef]
  11. Lv, T.-T.; Liu, Y.-Y.; Wang, H.; Yang, S.-Y.; Liu, C.-S.; Pang, H. Crystal Water Enlarging The Interlayer Spacing of Ultrathin V2O5·4VO2·2.72H2O Nanobelts for High-Performance Aqueous Zinc-Ion Battery. Chem. Eng. J. 2021, 411, 128533. [Google Scholar] [CrossRef]
  12. Shan, Y.; Zhang, M.Y.; Bai, Y.; Du, M.; Guo, X.; Pang, H. Design and Synthesis of Transition Metal Oxide/Zeolitic Imidazolate Framework-67 Composites. Chem. Eng. J. 2022, 429, 132146. [Google Scholar] [CrossRef]
  13. Tang, W.; Zhu, Y.; Hou, Y.; Liu, L.; Wu, Y.; Loh, K.P.; Zhang, H.; Zhu, K. Aqueous Rechargeable Lithium Batteries as An Energy Storage System of Superfast Charging. Energy Environ. Sci. 2013, 6, 2093–2104. [Google Scholar] [CrossRef]
  14. Goodenough, J.B.; Park, K.-S. The Li-Ion Rechargeable Battery: A Perspective. J. Am. Chem. Soc. 2013, 135, 1167–1176. [Google Scholar] [CrossRef] [PubMed]
  15. Croguennec, L.; Palacin, M.R. Recent Achievements on Inorganic Electrode Materials for Lithium-Ion Batteries. J. Am. Chem. Soc. 2015, 137, 3140–3156. [Google Scholar] [CrossRef]
  16. Li, F.-S.; Wu, Y.-S.; Chou, J.; Winter, M.; Wu, N.-L. A Mechanically Robust and Highly Ion-Conductive Polymer-Blend Coating for High-Power and Long-Life Lithium-Ion Battery Anodes. Adv. Mater. 2015, 27, 130–137. [Google Scholar] [CrossRef] [PubMed]
  17. Li, M.; Lu, J.; Chen, Z.; Amine, K. 30 Years of Lithium-Ion Batteries. Adv. Mater. 2018, 30, 1800561. [Google Scholar] [CrossRef] [PubMed] [Green Version]
  18. Qin, J.; He, C.; Zhao, N.; Wang, Z.; Shi, C.; Liu, E.-Z.; Li, J. Graphene Networks Anchored with Sn@Graphene as Lithium Ion Battery Anode. ACS Nano 2014, 8, 1728–1738. [Google Scholar] [CrossRef]
  19. Liu, Y.; Zhang, N.; Jiao, L.; Tao, Z.; Chen, J. Ultrasmall Sn Nanoparticles Embedded in Carbon as High-Performance Anode for Sodium-Ion Batteries. Adv. Funct. Mater. 2015, 25, 214–220. [Google Scholar] [CrossRef]
  20. Wu, S.; Han, C.; Iocozzia, J.; Lu, M.; Ge, R.; Xu, R.; Lin, Z. Germanium-Based Nanomaterials for Rechargeable Batteries. Angew. Chem. Int. Ed. 2016, 55, 7898–7922. [Google Scholar] [CrossRef]
  21. Kwon, H.-T.; Lee, C.K.; Jeon, K.-J.; Park, C.-M. Silicon Diphosphide: A Si-Based Three-Dimensional Crystalline Framework as a High-Performance Li-Ion Battery Anode. ACS Nano 2016, 10, 5701–5709. [Google Scholar] [CrossRef] [PubMed]
  22. Liu, X.; Huang, J.-Q.; Zhang, Q.; Mai, L. Nanostructured Metal Oxides and Sulfides for Lithium–Sulfur Batteries. Adv. Mater. 2017, 29, 1601759. [Google Scholar] [CrossRef]
  23. Xu, X.; Shen, J.; Li, F.; Wang, Z.; Zhang, D.; Zuo, S.; Liu, J. Fe3O4@C Nanotubes Grown on Carbon Fabric as a Free-Standing Anode for High-Performance Li-Ion Batteries. Chem. A Eur. J. 2020, 26, 14708–14717. [Google Scholar] [CrossRef]
  24. Liu, J.; Xu, X.; Hu, R.; Yang, L.; Zhu, M. Uniform Hierarchical Fe3O4@Polypyrrole Nanocages for Superior Lithium Ion Battery Anodes. Adv. Energy Mater. 2016, 6, 1600256. [Google Scholar] [CrossRef]
  25. Huang, Y.; Li, Y.; Huang, R.; Yao, J. Ternary Fe2O3/Fe3O4/FeCO3 Composite as a High-Performance Anode Material for Lithium-Ion Batteries. J. Phys. Chem. C 2019, 123, 12614–12622. [Google Scholar] [CrossRef]
  26. Zheng, M.; Tang, H.; Li, L.; Hu, Q.; Zhang, L.; Xue, H.; Pang, H. Hierarchically Nanostructured Transition Metal Oxides for Lithium-Ion Batteries. Adv. Sci. 2018, 5, 1700592. [Google Scholar] [CrossRef] [Green Version]
  27. Yu, S.-H.; Lee, S.H.; Lee, D.J.; Sung, Y.-E.; Hyeon, T. Conversion Reaction-Based Oxide Nanomaterials for Lithium Ion Battery Anodes. Small 2016, 12, 2146–2172. [Google Scholar] [CrossRef]
  28. Li, Q.; Li, H.; Xia, Q.; Hu, Z.; Zhu, Y.; Yan, S.; Ge, C.; Zhang, Q.; Wang, X.; Shang, X.; et al. Extra Storage Capacity in Transition Metal Oxide Lithium-Ion Batteries Revealed by in Situ Magnetometry. Nat. Mater. 2021, 20, 76–83. [Google Scholar]
  29. Fang, S.; Bresser, D.; Passerini, S. Transition Metal Oxide Anodes for Electrochemical Energy Storage in Lithium- and Sodium-Ion Batteries. Adv. Energy Mater. 2020, 10, 1902485. [Google Scholar] [CrossRef]
  30. Cho, J.S.; Hong, Y.J.; Kang, Y.C. Design and Synthesis of Bubble-Nanorod-Structured Fe2O3–Carbon Nanofibers as Advanced Anode Material for Li-Ion Batteries. ACS Nano 2015, 9, 4026–4035. [Google Scholar] [CrossRef]
  31. Zeng, Y.; Yu, M.; Meng, Y.; Fang, P.; Lu, X.; Tong, Y. Iron-Based Supercapacitor Electrodes: Advances and Challenges. Adv. Energy Mater. 2016, 6, 1601053. [Google Scholar] [CrossRef]
  32. Ma, J.; Guo, X.; Yan, Y.; Xue, H.; Pang, H. FeOx-Based Materials for Electrochemical Energy Storage. Adv. Sci. 2018, 5, 1700986. [Google Scholar] [CrossRef]
  33. Wan, Y.; Yang, Z.; Xiong, G.; Guo, R.; Liu, Z.; Luo, H. Anchoring Fe3O4 Nanoparticles on Three-Dimensional Carbon Nanofibers toward Flexible High-Performance Anodes for Lithium-Ion Batteries. J. Power Sources 2015, 294, 414–419. [Google Scholar] [CrossRef]
  34. Wang, J.; Gao, M.; Pan, H.; Liu, Y.; Zhang, Z.; Li, J.; Su, Q.; Du, G.; Zhu, M.; Ouyang, L.; et al. Mesoporous Fe2O3 Flakes of High Aspect Ratio Encased within Thin Carbon Skeleton for Superior Lithium-Ion Battery Anodes. J. Mater. Chem. A 2015, 3, 14178–14187. [Google Scholar] [CrossRef]
  35. Fu, C.; Mahadevegowda, A.; Grant, P.S. Fe3O4/Carbon Nanofibres with Necklace Architecture for Enhanced Electrochemical Energy Storage. J. Mater. Chem. A 2015, 3, 14245–14253. [Google Scholar] [CrossRef]
  36. Li, X.; Ma, Y.; Cao, G.; Qu, Y. FeOx@Carbon Yolk/Shell Nanowires with Tailored Void Spaces as Stable and High-Capacity Anodes for Lithium Ion Batteries. J. Mater. Chem. A 2016, 4, 12487–12496. [Google Scholar] [CrossRef]
  37. Xu, Z.L.; Yao, S.; Cui, J.; Zhou, L.; Kim, J.K. Atomic Scale, Amorphous FeOx/Carbon Nanofiber Anodes for Li-Ion and Na-Ion Batteries. Energy Storage Mater. 2017, 8, 10–19. [Google Scholar] [CrossRef]
  38. Zhao, Y.; Li, X.; Yan, B.; Xiong, D.; Li, D.; Lawes, S.; Sun, X. Recent Developments and Understanding of Novel Mixed Transition-Metal Oxides as Anodes in Lithium Ion Batteries. Adv. Energy Mater. 2016, 6, 1502175. [Google Scholar] [CrossRef]
  39. Li, X.; Zhang, Z.; Li, J.; Ma, Y.; Qu, Y. Structural Influence of Porous FeOx@C Nanorods on Their Performance as Anodes of Lithium-Ion Batteries. J. Mater. Chem. A 2015, 3, 18649–18656. [Google Scholar] [CrossRef]
  40. Zhang, H.; Zhou, L.; Noonan, O.; Martin, D.J.; Whittaker, A.K.; Yu, C. Tailoring the Void Size of Iron Oxide@Carbon Yolk–Shell Structure for Optimized Lithium Storage. Adv. Funct. Mater. 2014, 24, 4337–4342. [Google Scholar] [CrossRef]
  41. Wu, Q.; Zhao, R.; Liu, W.; Zhang, X.; Shen, X.; Li, W.; Diao, G.; Chen, M. In-Depth Nanocrystallization Enhanced Li-Ions Batteries Performance with Nitrogen-Doped Carbon Coated Fe3O4 Yolk−Shell Nanocapsules. J. Power Sources 2017, 344, 74–84. [Google Scholar] [CrossRef]
  42. Kim, J.H.; Kang, Y.C. Synthesis of Uniquely Structured Yolk–Shell Metal Oxide Microspheres Filled with Nitrogen-Doped Graphitic Carbon with Excellent Li–Ion Storage Performance. Small 2017, 13, 1701585. [Google Scholar] [CrossRef] [PubMed]
  43. Wang, L.; Yang, C.; Dou, S.; Wang, S.; Zhang, J.; Gao, X.; Ma, J.; Yu, Y. Nitrogen-Doped Hierarchically Porous Carbon Networks: Synthesis and Applications in Lithium-Ion Battery, Sodium-Ion Battery and Zinc-Air Battery. Electrochim. Acta 2016, 219, 592–603. [Google Scholar] [CrossRef]
  44. Yang, L.; Guo, G.; Sun, H.; Shen, X.; Hu, J.; Dong, A.; Yang, D. Ionic Liquid as the C and N Sources to Prepare Yolk-shell Fe3O4@N-doped Carbon Nanoparticles and its High Performance in Lithium-ion Battery. Electrochim. Acta 2016, 190, 797–803. [Google Scholar] [CrossRef]
  45. Sun, M.; Zhang, G.; Liu, H.; Liu, Y.; Li, J. α-and γ-Fe2O3 Nanoparticle/Nitrogen Doped Carbon Nanotube Catalysts for High-Performance Oxygen Reduction Reaction. Sci. China Mater. 2015, 58, 683–692. [Google Scholar] [CrossRef] [Green Version]
  46. Lei, C.; Han, F.; Li, D.; Li, W.-C.; Sun, Q.; Zhang, X.-Q.; Lu, A.-H. Dopamine as The Coating Agent and Carbon Precursor for The Fabrication of N-Doped Carbon Coated Fe3O4 Composites as Superior Lithium Ion Anodes. Nanoscale 2013, 5, 1168–1175. [Google Scholar] [CrossRef]
  47. Wang, H.; Zheng, Y.; Peng, Z.; Liu, X.; Qu, C.; Huang, Z.; Cai, Z.; Fan, H.; Zhang, Y. Nanocavity-Enriched Co3O4@ZnCo2O4@NC Porous Nanowires Derived from 1D Metal Coordination Polymers for Fast Li+ Diffusion Kinetics and Super Li+ Storage. Dalt. Trans. 2021, 50, 7277–7283. [Google Scholar] [CrossRef] [PubMed]
  48. Chen, Y.; Shi, L.; Li, D.; Dong, Y.; Yuan, Q.; Huang, S.; Yang, H.Y.; Wei, X.; Zhuang, Q.; Ju, Z.; et al. Undercooling-Directed NaCl Crystallization: An Approach towards Nanocavity-Linked Graphene Networks for Fast Lithium and Sodium Storage. Nanoscale 2020, 12, 7622–7630. [Google Scholar] [CrossRef]
  49. Luo, Y.; Luo, J.; Jiang, J.; Zhou, W.; Yang, H.; Qi, X.; Zhang, H.; Fan, H.J.; Yu, D.Y.W.; Li, C.M.; et al. Seed-Assisted Synthesis of Highly Ordered TiO2@α-Fe2O3 Core/Shell Arrays on Carbon Textiles for Lithium-Ion Battery Applications. Energy Environ. Sci. 2012, 5, 6559–6566. [Google Scholar] [CrossRef]
  50. Zheng, F.; He, M.; Yang, Y.; Chen, Q. Nano Electrochemical Reactors of Fe2O3 Nanoparticles Embedded in Shells of Nitrogen-Doped Hollow Carbon Spheres as High-Performance Anodes for Lithium-Ion Batteries. Nanoscale 2015, 7, 3410–3417. [Google Scholar] [CrossRef] [PubMed]
  51. Yin, L.; Gao, Y.J.; Jeon, I.; Yang, H.; Kim, J.P.; Jeong, S.Y.; Cho, C.R. Rice-Panicle-Like γ-Fe2O3@C Nanofibers as High-Rate Anodes for Superior Lithium-Ion Batteries. Chem. Eng. J. 2019, 356, 60–68. [Google Scholar] [CrossRef]
  52. Na, Z.; Yao, R.; Yan, Q.; Wang, X.; Sun, X.; Wang, X. A General Strategy for Enabling Fe3O4 with Enhanced Lithium Storage Performance: Synergy between Yolk-Shell Nanostructures and Doping-Free Carbon. Electrochim. Acta 2021, 367, 137464. [Google Scholar] [CrossRef]
  53. Zhang, J.; Wang, K.; Xu, Q.; Zhou, Y.; Cheng, F.; Guo, S. Beyond Yolk–Shell Nanoparticles: Fe3O4@Fe3C Core@Shell Nanoparticles as Yolks and Carbon Nanospindles as Shells for Efficient Lithium Ion Storage. ACS Nano 2015, 9, 3369–3376. [Google Scholar] [CrossRef] [PubMed]
Scheme 1. Schematic illustration of the fabrication of Fe3O4@void@N-doped C.
Molecules 27 00396 sch001
Figure 1. (a,b) SEM and TEM images of Fe2O3 precursor; (c,d) SEM and TEM images of cube Fe2O3@PDA; (e,f) SEM and TEM images of Fe3O4@N-doped C sample.
Molecules 27 00396 g001
Figure 2. SEM and TEM images of carbonized products after etching for different times: (a,b) Fe3O4@void@N-doped C-2; (c,d) Fe3O4@void@N-doped C-5; (e,f) Fe3O4@void@N-doped C-10; (g,h) the product of 4 mol L−1 hydrochloric acid etching for 2 h.
Molecules 27 00396 g002
Figure 3. EDS element mapping analysis of Fe3O4@void@N-doped C-5 composite: (a,b,d) TEM images; (c) electron diffraction photograph; (e) C elements; (f) N elements; (g,h) Fe elements; (i) O elements.
Molecules 27 00396 g003
Figure 4. (a) Raman spectra of Fe3O4@N-doped C-x composites; XPS spectra of Fe3O4@void@N-doped C-5 composite: (b) full spectrum, (c) Fe 2p, (d) O 1s, (e) C 1s, (f) N 1s.
Molecules 27 00396 g004
Figure 5. (a) Cyclic voltammetry curve of Fe3O4@void@N-doped C-5 composite; (b) representative charge–discharge curves of Fe3O4@void@N-doped C-5 composite; (c) 100 cycle diagrams of Fe2O3 and Fe3O4@void@N-doped C-x (x = 2, 5 and 10) composite at 200 mA g−1 current density; (d) rate performance of cubic Fe2O3 and Fe3O4@void@N-doped C-x composites (x = 2, 5 and 10).
Molecules 27 00396 g005
Publisher’s Note: MDPI stays neutral with regard to jurisdictional claims in published maps and institutional affiliations.