Article

Pressurized Liquid Extraction as a Novel Technique for the Isolation of Laurus nobilis L. Leaf Polyphenols

by
Erika Dobroslavić
,
Ivona Elez Garofulić
*,
Jelena Šeparović
,
Zoran Zorić
,
Sandra Pedisić
and
Verica Dragović-Uzelac
Faculty of Food Technology and Biotechnology, University of Zagreb, Pierottijeva 6, 10 000 Zagreb, Croatia
*
Author to whom correspondence should be addressed.
Molecules 2022, 27(16), 5099; https://doi.org/10.3390/molecules27165099
Submission received: 20 July 2022 / Revised: 8 August 2022 / Accepted: 9 August 2022 / Published: 10 August 2022

Abstract

:
Laurus nobilis L., known as laurel or bay leaf, is a Mediterranean plant which has been long known for exhibiting various health-beneficial effects that can largely be attributed to the polyphenolic content of the leaves. Pressurized liquid extraction (PLE) is a green extraction technique that enables the efficient isolation of polyphenols from different plant materials. Hence, the aim of this research was to determine optimal conditions for PLE (solvent, temperature, number of extraction cycles and static extraction time) of laurel leaf polyphenols and to assess the polyphenolic profile of the optimal extract by ultra-performance liquid chromatography tandem mass spectrometry (UPLC-MS/MS) as well as to evaluate the antioxidant activity determined by FRAP, DPPH and ORAC assays. The optimal PLE conditions were 50% ethanol, 150 °C, one extraction cycle and 5 min static time. The polyphenolic extract obtained at optimal PLE conditions comprised 29 identified compounds, among which flavonols (rutin and quercetin-3-glucoside) were the most abundant. The results of antioxidant activity assays demonstrated that PLE is an efficient green technique for obtaining polyphenol-rich laurel leaf extracts with relatively high antioxidant activity.

1. Introduction

Laurus nobilis L., also known as laurel or bay leaf, is an evergreen plant characteristic of the Mediterranean area with high annual rainfall, whose leaves have been widely used as a spice in traditional cuisine, as well as in folk medicine for treating various health conditions. For that reason, their chemical composition and biological activities have been more well researched than other plant parts [1]. Laurel leaves, which have shown antioxidant [2], anti-inflammatory [3] and antimicrobial activity [4], comprise essential oils, alkaloids, polysaccharides, sugars, norisoprenoids, tocopherols, organic acids and a variety of polyphenols comprising flavonoids and non-flavonoids (phenolic acids and lignans) whose structure varies in complexity [5]. Polyphenols can be considered largely responsible for the laurel leaf extracts’ antioxidant activity [2,6] since they possess redox properties which allow them to act as antioxidant agents [7]. Recovery of these antioxidants is a challenging process since the plant material comprises a variety of polyphenolic structures including simple to complex and highly polymerized polyphenols that often interact with other constituents such as polysaccharides and lipids [8]. Therefore, a key step in the utilization of polyphenols’ beneficial properties is establishing an optimal isolation methodology that would result in their effective recovery, and various techniques may be applied for this purpose. Conventional extraction techniques, such as maceration, heat-reflux and infusion, are generally easily applicable, but also often solvent-, time- and energy-consuming. These techniques may also result in the degradation of thermosensitive polyphenolic compounds and are often difficult to automate, making them inapplicable on larger scales. For this reason, many advanced extraction techniques have emerged in recent years. Pressurized liquid extraction (PLE), known as accelerated solvent extraction (ASE), is an automated green extraction technique which was shown to be an economic and time-efficient alternative to conventional techniques since it resulted in comparable or higher contents of polyphenols in various plant extracts [9]. During PLE, the use of elevated pressures allows the liquid solvents to be used at temperatures above their atmospheric boiling point, resulting in enhanced solubility and diffusion rate of the targeted compounds, while the surface tension and solvent viscosity decrease, which results in a drained matrix after the extraction [10]. PLE can be performed in a dynamic or static setup. During the dynamic mode of operation, the solvent is delivered at a constant flow rate, while in the static mode, the extraction process includes one or several cycles in a predetermined time (most often 5–15 min), with solvent replacement between the cycles [10]. Various parameters, such as solvent, temperature, pressure and time of extraction, can be varied in order to improve the extraction performance. After the optimal isolation methodology has been established, the next step is to identify and quantify individual polyphenols and to evaluate the extracts’ antioxidant activity. Combined chromatographic and spectral techniques such as ultra-performance liquid chromatography tandem mass spectrometry (UPLC-MS/MS) are the most useful tools which allow chemical characterization of both simple and complex polyphenolic structures [11]. Several assays divided into two groups (single electron transfer (SET) and hydrogen atom transfer (HAT)) can be used for determination of antioxidant capacity [12]. The ferric reducing antioxidant power (FRAP) and 2,2-di(4-tert-octylphenyl)-1-picrylhydrazyl (DPPH) assays are both SET colorimetric assays widely used in estimation of plant extracts’ antioxidant capacities, usually applied together or in a combination with other techniques [13]. Oxygen radical absorbance capacity (ORAC) is a HAT method often chosen for antioxidant capacity determination in plant material since it can measure both polar and nonpolar antioxidants, and it is also the most biologically relevant due to the use of the most biologically prevalent peroxyl radical [14].
Therefore, the purpose of this research was to examine how different PLE parameters (solvent, temperature, number of extraction cycles, static extraction time) affect the phenolic content of laurel leaf extracts and to determine the optimal extraction conditions. To the best of our knowledge, PLE has not been applied for the extraction of laurel leaf polyphenols to date; therefore, there are no data on polyphenolic profiles obtained by this technique. Hence, the goal of this research was to identify and quantify individual polyphenols of the laurel leaf extract obtained by PLE at optimal conditions using the UPLC-MS/MS and to evaluate the antioxidant activity of the extract by using the ORAC, DPPH and FRAP assays.

2. Results and Discussion

This study examined the effect of several PLE extraction parameters on the polyphenolic content of laurel leaf extracts. The TPC of the extracts, as determined by the spectrophotometric Folin–Ciocalteu method, is shown in Table 1. The results of the statistical analysis, which was used to determine optimal extraction conditions, are shown in Table 2. Individual compounds in the extract obtained at optimal conditions were identified and quantified by UPLC-MS/MS, while the antioxidant capacity of the optimal PLE extract was characterized by ORAC, DPPH and FRAP assays.
The TPC of the laurel leaf extracts obtained by PLE ranged from 31.87 to 49.30 mg GAE g−1, which is similar to the previously reported value of 46.79 mg GAE g−1 [15], lower than 59.85 mg GAE g−1 [16] and higher than 10.23 mg GAE g−1 [17], all obtained by conventional extraction techniques. The TPC of the extracts is also in the range of phenolic contents obtained by microwave-assisted extraction (MAE) (30.88 to 53.57 mg GAE g−1) and ultrasound-assisted extraction (UAE) (24.43 to 36.74 mg GAE g−1) in our previous research [18].

2.1. Pressurized Liquid Extraction (PLE) Optimization

Ethanol percentage in an aqueous solution (50 and 70%), temperature (90, 120 and 150 °C), number of extraction cycles (one, two and three) and static extraction time (5 and 10 min) were varied during the PLE of laurel leaf polyphenols. As shown in Table 2, the ethanol percentage significantly (p ≤ 0.05) influenced the TPC of the extracts, which was higher when 50% ethanol was used as a solvent. Similarly, Leyva-Jimenez et al. [19] reported that, in the tested range of 15–85% ethanol, 46% ethanol was optimal for the PLE of polyphenols from Lippia citriodora leaves. The use of 50% ethanol also resulted in the highest TPC apple pomace [20] and grape skin extracts [21] obtained by PLE. On the other hand, 71% ethanol was found optimal during PLE of polyphenols from Myrtus communis L. leaves [22]. The different observations might be a result of different polyphenolic contents of the samples and the polarity of present compounds which consequently influences the extraction yield when the ‘‘like dissolves like’’ principle is taken into account [23].
Temperature is an important parameter in PLE extraction since it influences the molecular diffusivity and viscosity of the solvent [24]. Generally, applying higher temperatures increases solubility and recovery of compounds from the plant matrix; however, thermosensitive compounds may degrade at higher temperatures, which is why it is crucial to determine optimal temperatures for each plant material [25]. In the present study, the temperature significantly (p < 0.01) influenced the TPC of the extracts, which increased proportionally with the increase in temperature. Zhao et al. (2012) [26] have observed a similar effect during the extraction of lignans from Fructus Schisandrae where the yield increased proportionally with temperature rise from 80 to 160 °C. A further increase to 180 °C resulted in a lower yield of lignans, possibly due to the mentioned thermal degradation. Repajić et al. have also observed an increase in the TPC of Urtica dioica L. leaf extracts [27], as well as Foeniculum vulgare Mill. seed extracts [28], with the increase in temperature during PLE. In contrast, temperature had no effect during the PLE of phenolic compounds from Olea europaea L. fruit [29].
The number of extraction cycles and the static time are also important since a longer exposure of the analytes to the extraction solvent at elevated temperatures increases the diffusion rate, while multiple extraction cycles may result in the complete extraction of targeted compounds [10]. In the present study, the number of extraction cycles and static extraction time did not significantly influence the TPC of the extracts, contrary to the results reported by Repajić et al. (2020) [27], Li et al. (2019) [21] and Wibisono et al. (2009) [30] where PLE was optimized for the extraction of polyphenols from Urtica dioica L. leaves, grape skin and different plant food materials, respectively. For the PLE of phenolic compounds from Foeniculum vulgare Mill. seeds, Repajić et al. (2021) [28] reported that static time had no significant influence on the phenolic yield, so 5 min was chosen as optimal, while the number of extraction cycles was a significant parameter. Static time of 5 min was also chosen as optimal for the PLE of Rosmarinus officinalis phenolic compounds [31]. Sandei and Vadala (2013) [32] applied one extraction cycle and a static time of 5 min for the optimization of other PLE parameters during the extraction of tomato polyphenols, which are the same as the lowest values applied in our study.
Based on the results of statistical analysis, 50% ethanol, 150 °C, one extraction cycle and a static time of 5 min were chosen as optimal for obtaining the maximum content of polyphenols from laurel leaves.

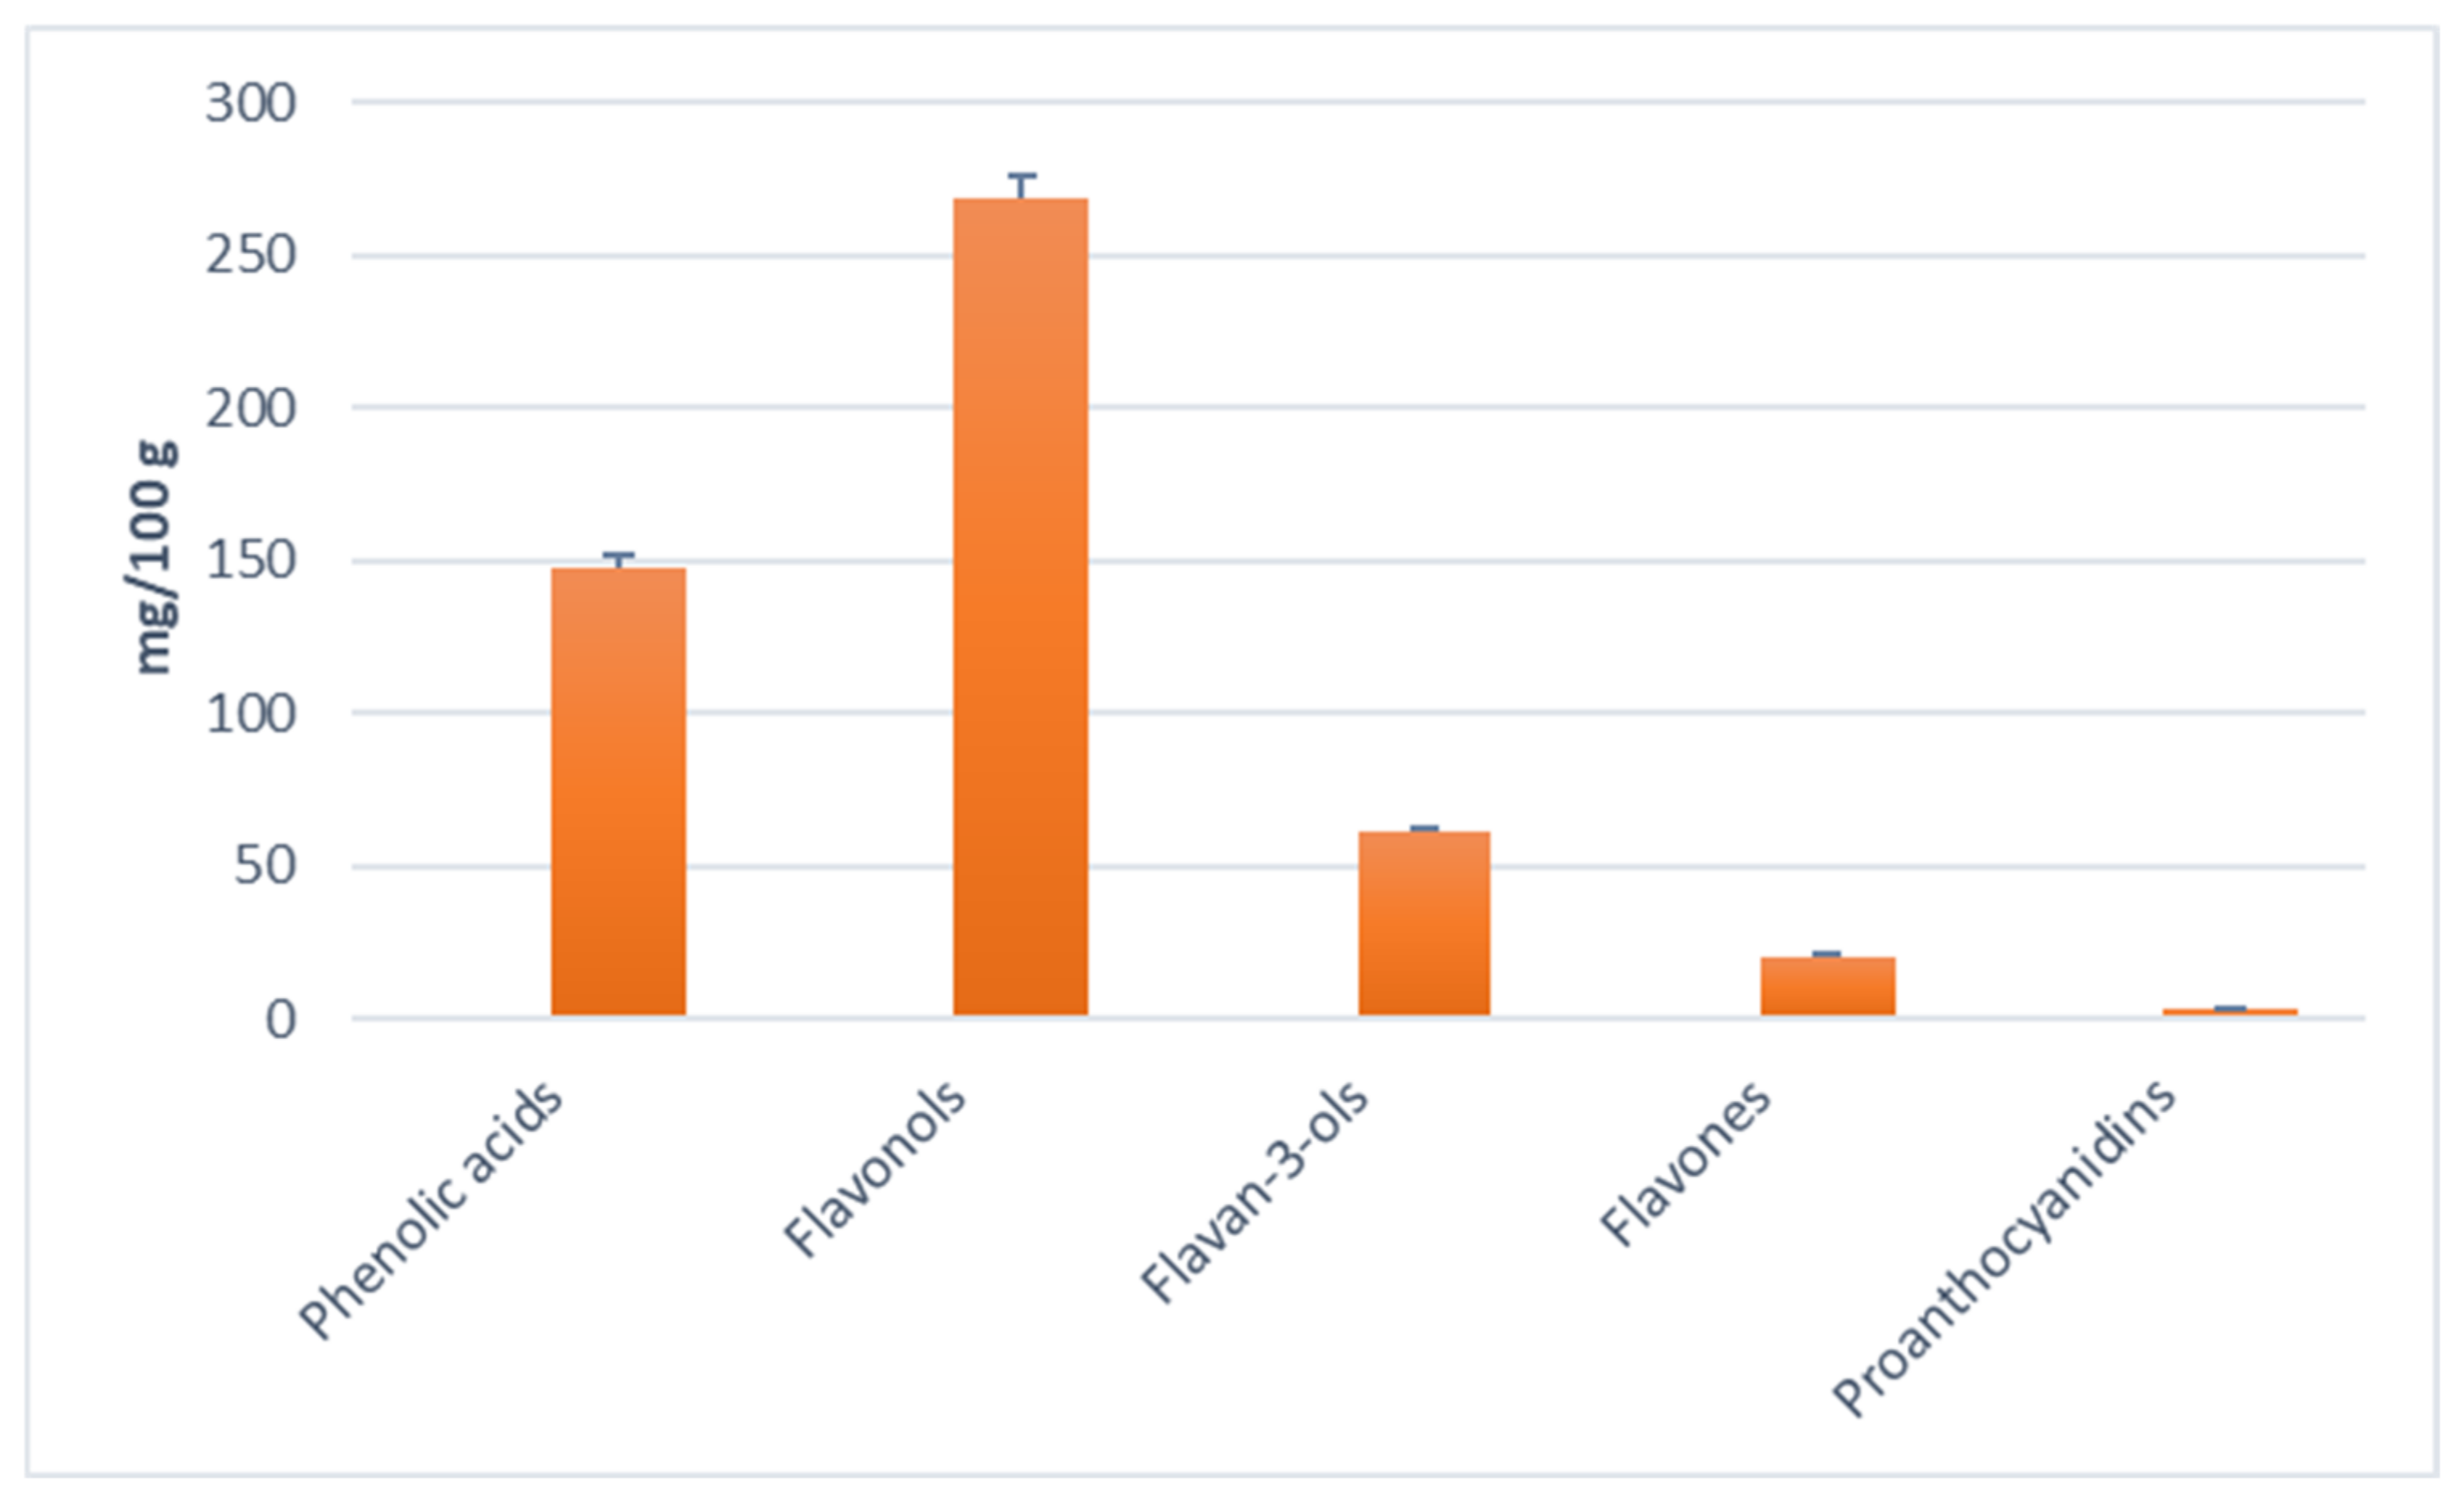
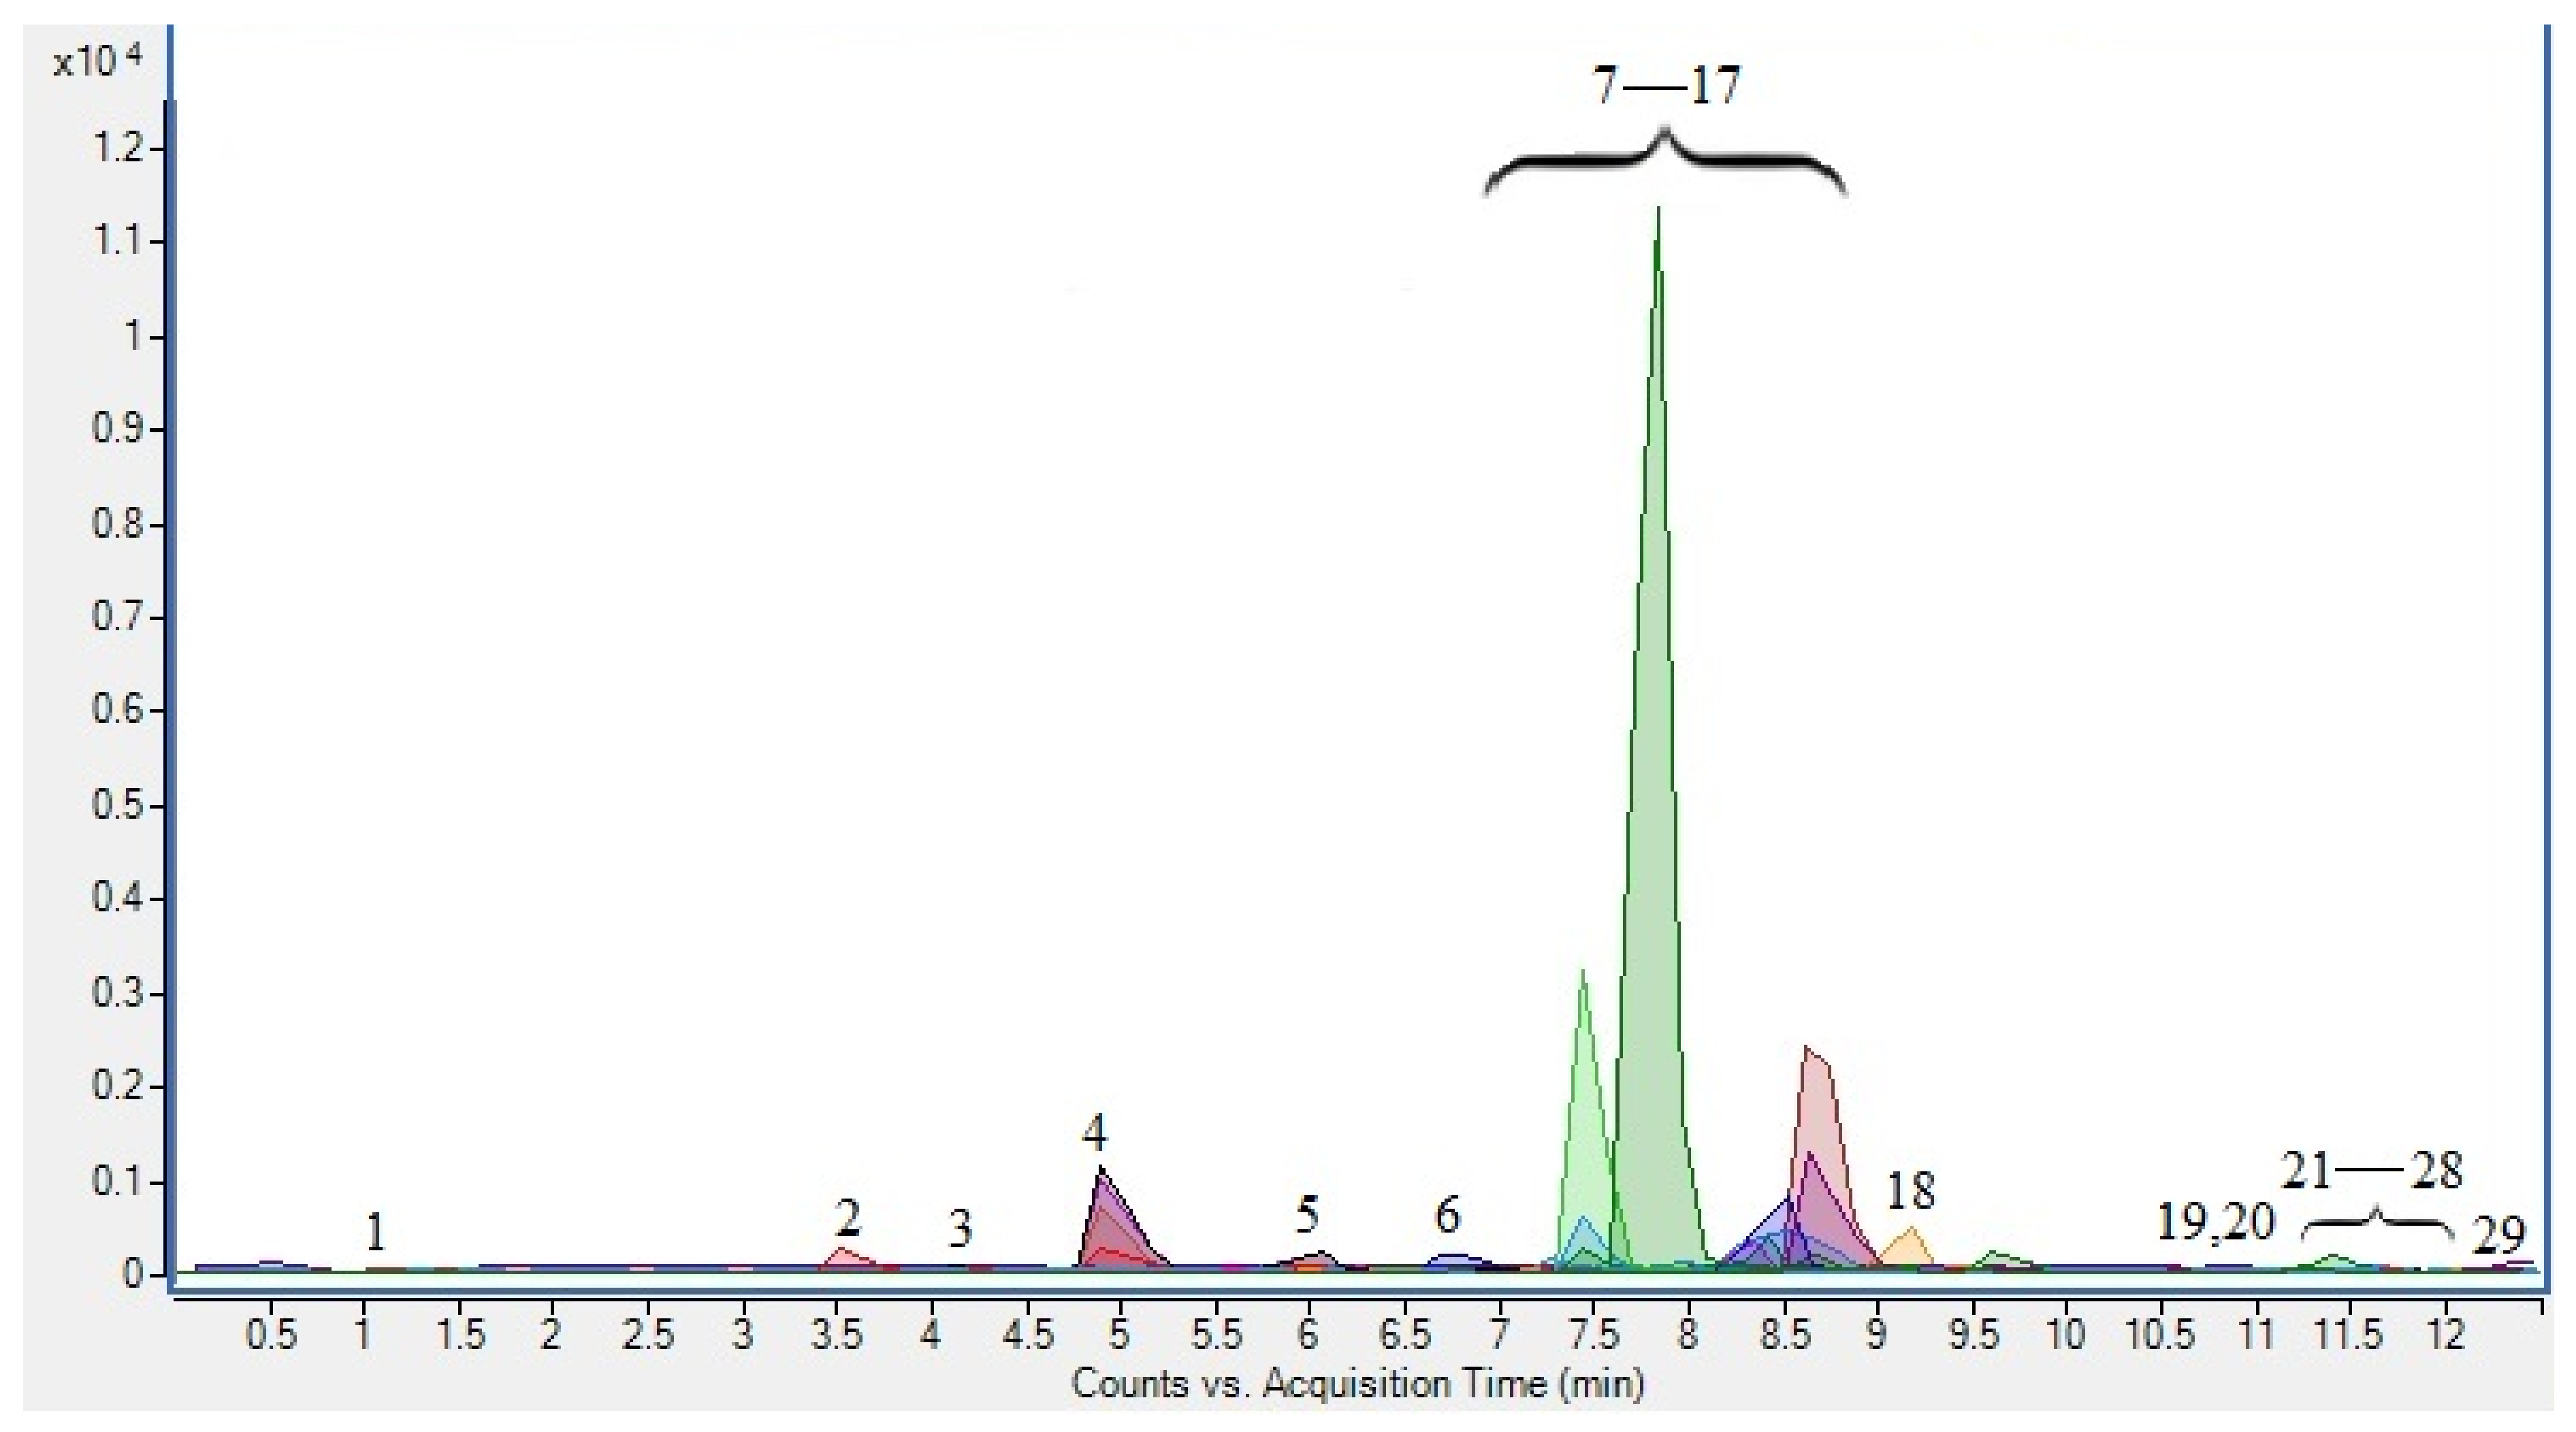
2.2. Polyphenolic Characterization

In order to provide insight into the polyphenolic composition of the laurel leaf extract produced under optimal extraction conditions, UPLC-MS/MS analysis was performed (Table 3). Twenty-nine phenolic compounds, including flavonoids (flavones, flavonols, flavan-3-ols and proanthocyanidins) and phenolic acids, were identified in the extract (Figure 1). The identification of compounds was carried out as described in our previous research [18].
According to UPLC-MS/MS results, flavonols were the most abundant group of phenolic compounds (Figure 2), with rutin and quercetin-3-glucoside being the main representatives. Rutin and quercetin were shown to be stable during exposure to elevated temperatures [33], and data on different thermal degradation rates of various quercetin glycosides showed that quercetin-3-O-glucoside was among the more stable glycosides [34]. The content of rutin and quercetin-3-glucoside was also the highest in laurel leaf extracts obtained by MAE in our previous research [18]. In the same research, the content of phenolic acids of the extracts obtained by conventional heat-reflux extraction (CRE), MAE and UAE was more than 100 mg g−1 lower than that in the extract obtained by PLE in the present study, where caffeic acid was the main representative. Since phenolic acids, especially hydroxycinnamic acids, were shown to be thermally stable [33], the exposure to higher temperatures during PLE may have increased their recovery.
The content of the main flavan-3-ol representatives, catechin and epicatechin, was more than 2-fold lower than their content obtained previously by CRE and more than 3-fold higher than their content obtained previously by UAE and MAE [18]. Even though the high temperature applied during PLE increases the extraction rate, explaining the higher content than in UAE and MAE, thermal degradation of catechin and epicatechin may occur during prolonged exposure to elevated temperatures, leading to their lower content than in the CRE extracts [33,35]. Apigenin was the most abundant flavone in the PLE extract, with a concentration higher than that in extracts obtained by all three techniques applied in the previous research where luteolin was the most abundant flavone [18]. This is in agreement with the findings that apigenin is resistant to prolonged exposure to temperatures around 100 °C, resulting in its higher recovery [36]. Luteolin and its glycosides were previously shown to be less thermally stable than apigenin [33], which is consistent with their recovered amount. The content of procyanidin trimer in the PLE extract was lower than the content in MAE, CRE and UAE extracts obtained previously [18], which is in agreement with previous findings where proanthocyanidins from blueberry and grape pomace were shown to be thermosensitive [37]. In addition, procyanidin oligomers, especially B-type procyanidins, such as the procyanidin trimer detected in the present study, were shown to be the most thermosensitive phenolic compounds in cloudy apple juice [34].
The results of Folin–Ciocalteu spectrophotometry showed significantly higher TPC than that revealed by UPLC-MS/MS, which might be a result of interference caused by non-phenolic constituents present in laurel leaves, such as organic acids, various polysaccharides and sugars [5] which were shown to be detectable by the spectrophotometer [12]. Moreover, it was reported that chlorophyll may interact with the Folin–Ciocalteu reagent, resulting in a seeming increase in the TPC of chlorophyll-rich plant material [38], which could serve as another explanation for the observed discrepancies between the results obtained by chromatographic and spectrophotometric techniques.

2.3. Antioxidant Activity

Antioxidant activity of the extract obtained at the defined optimal extraction conditions was determined by the ORAC, DPPH and FRAP assays, and the results are shown in Table 4.
The ORAC value of the laurel leaf extract obtained by PLE was in the range of those reported in the literature, which have varied from 37.7 μmol TE g−1 [39] to 170 μmol TE g−1 [40] in laurel leaf extracts with lower TPCs (4.04 and 17.66 mg GAE g−1, respectively) than in the present study, to even 2600 μmol TE g−1 [41] for an extract with a TPC similar to that of the present study (44.07 mg GAE g−1). The ORAC value was also in the range of those reported in our previous research carried out on the same laurel leaf sample where CRE resulted in a higher ORAC value (100.09 μmol TE g−1) and MAE and UAE resulted in lower ORAC values (86.04 and 90.27 μmol TE g−1, respectively), which might have been influenced by the previously discussed differences in the individual phenolic compounds’ contents since the antioxidant activity is dependent on the structural features of phenolic compounds [42]. The DPPH value was lower than the 300 μmol TE g−1 reported for a laurel leaf extract [43] where the TPC was 1.01 mg GAE g−1. The FRAP value was in the range of 278 μmol TE g−1 determined in a hydromethanolic laurel leaf extract where the phenolic content was not analyzed [44], and also lower than 504.25 μmol TE g−1 [15] where the TPC of laurel leaf extract was 46.79 mg GAE g−1. The differences between the antioxidant activity and the phenolic contents of laurel leaf extracts indicate that the antioxidant activity is not influenced only by the TPC. Several other factors, including the plant growth environment, harvest season, storage conditions and different extraction techniques, may have affected the extracts’ contents of nonphenolic antioxidants such as organic acids, tocopherols and terpenoids [5]. In addition, it is possible that antagonistic or synergistic mechanisms occur between certain components of the extracts which cannot be clarified only by the TPC and could possibly be explained by further qualitative research [45]. Moreover, the content of individual phenolic compounds may significantly influence the antioxidant activity of the extracts since their antioxidant activity depends on the structural features [46]. This is supported by the results of the present study since the same ORAC and DPPH values were determined in the extracts with different TPCs, as well as the contents of individual compounds.

3. Materials and Methods

3.1. Chemicals and Reagents

Ethanol (96%) and methanol (99.8%) were procured from Lach-ner d.o.o. (Neratovice, Czech Republic), and acetonitrile (HPLC grade) was obtained from J.T. Baker Chemicals (Deventer, the Netherlands). Purified distilled water was produced in a Milli-Q water purification system (Millipore, Bedford, MA, USA). Anhydrous sodium carbonate (≥99.5%), anhydrous sodium acetate (≥99%), formic acid (98–100%), FeCl3 × 6H2O, sodium phosphate (96%) and Folin–Ciocalteu reagent were from Kemika (Zagreb, Croatia); 2,4,6-tri(2-pyridyl)-s-triazine (TPTZ) and 6-hydroxy-2,5,7,8-tetramethylchroman-2-carboxylic acid (Trolox) were from Acros Organics (Thermo Fisher Scientific, Geel, Belgium); fluorescein sodium salt was from Honeywell Research Chemicals (Bucharest, Romania); and hydrochloric acid (37%), glacial acetic acid, 2,20-azobis (2-amidinopropane) hydrochloride (AAPH) and 2,2-diphenyl-1-(2,4,6-trinitrophenyl)hydrazyl (DPPH) were from Sigma-Aldrich (Steinheim, Germany). Authentic standards of myricetin, quercetin-3-glucoside, caffeic, protocatechuic, gallic, ferulic, rosmarinic, syringic, p-coumaric and chlorogenic acids were procured from Sigma-Aldrich (St. Louis, MO, USA). Kaempferol-3-glucoside, catechin, epicatechin gallate, epigallocatechin gallate, apigenin, rutin, luteolin and procyanidin B2 were purchased from Extrasynthese (Genay, France). Apigenin standard was prepared as an ethanol–0.5% v/v dimethyl sulfoxide stock solution, while all other standards were dissolved in methanol. Stock solutions were diluted in order to produce working standard solutions at five concentrations.

3.2. Plant Material

Dried laurel leaves collected in the region of Rijeka, Croatia, in November 2020 were purchased from Šafram d.o.o (Zagreb, Croatia) and stored at room temperature. Prior to extraction, the leaves were ground in an electric grinder (OmniBlend, Vervita, Croatia) until a coarse powder was obtained. The total solids of the obtained powder (>95%) were analyzed by drying to constant mass at 103 ± 2 °C [47].

3.3. Pressurized Liquid Extraction (PLE)

The extractions were performed on a Dionex ASE 350 Accelerated Solvent Extractor (Thermo Fisher Scientific Inc., Sunnyvale, CA, USA) in static mode. One gram of the ground leaves was combined with 2 g of diatomaceous earth and transferred to 34 mL stainless steel cells previously fitted with three cellulose filters. The extraction conditions were varied following the full factorial design (shown in Table 1): ethanol percentage in aqueous solution (50 and 70%), extraction temperature (90, 120 and 150 °C), extraction cycles (1, 2 and 3) and static extraction time (5 and 10 min). The pressure, purge with nitrogen and volume flush were kept constant at 10.34 MPa, 30 s and 50%, respectively. The 250 mL glass vials with Teflon septa used for the collection of the extracts were filtered into volumetric flasks (50 mL) through Whatman No. 40 filter paper (Whatman International Ltd., Kent, UK) and made up to volume with the extraction solvent. The extracts were transferred and stored in plastic Falcon tubes at −18 °C in a nitrogen gas atmosphere until further analysis. All extracts were prepared in duplicate.

3.4. Total Phenolic Content (TPC)

The TPC of laurel leaves was determined following a modified methodology previously established by Shortle et al. [48]. First, 100 µL of the extract (extraction solvent for blank), 200 µL Folin–Ciocalteu reagent and 2 mL of distilled water were put into the reaction tube; 1 mL of sodium carbonate solution (20% w/v) was added into the reaction after 3 min, and the mixture was shaken using Vortex MS2 Minishaker IKA (IKA, Staufen, Germany) at 1800 rpm and incubated at 50 °C in a water bath. The absorbance was read after 25 min on a VWR UV-1600PC Spectrophotometer (VWR, Wayne, PA, USA) at 765 nm. All measurements were carried out in duplicate. Working standard solutions of gallic acid (50–500 mg L−1) were used to prepare a standard calibration curve (y = 0.0035x, R2 = 0.9995). The calculated TPC was expressed as a mean value of mg gallic acid equivalents (GAE) per g sample ± standard deviation.

3.5. UPLC-MS/MS Conditions

Individual polyphenols in the extracts obtained at optimal conditions were identified and quantified using a UPLC-MS/MS system (Agilent series 1290 RRLC instrument) coupled with an Agilent 6430 Triple Quadrupole LC/MS mass spectrometer (Agilent, Santa Clara, CA, USA). The ionization was performed in positive and negative ionization mode by ESI ion source with nitrogen as a desolvation and collision gas. Drying gas temperature was set at 300 °C, flow rate at 11 L h−1, nebulizer pressure at 40 psi and capillary voltage at 4/−3.5 kV. The Zorbax Eclipse Plus C18 column from Agilent (100 × 2.1 mm; 1.8 µm particle size) was used for separations under the following conditions: injection volume 2.5 µm and column temperature 35 °C. Other parameters including gradient conditions, solvent composition and instrumental limits of detection (LOD) and quantification (LOQ) were previously reported by Elez Garofulić et al. (2018) [49]. Agilent MassHunter Workstation Software (ver. B.04.01) (Agilent, Santa Clara, CA, USA) was used for data processing and instrument control. Identification and quantitative determination were performed as described by Dobroslavić et al. (2021) [18]. The concentrations of the analyzed polyphenols were expressed as mg per 102 g sample (mean value ± standard deviation). The analyses were carried out in duplicate.

3.6. Antioxidant Activity

In order to determine the antioxidant activity of the laurel leaf extract obtained at optimal extraction conditions, three assays were applied.

3.6.1. Oxygen Radical Absorbance Capacity (ORAC) Assay

An automated plate reader (BMG LABTECH, Offenburg, Germany) was used to perform the oxygen radical absorbance capacity (ORAC) assay, while the MARS 2.0 software (BMG LABTECH, Offenburg, Germany) was used for data analysis. The assay was performed following a previously reported method [50]. A 240 mM solution of AAPH, a range of Trolox dilutions (3.12–103.99 μM) and 70.3 nM fluorescein solution were prepared with phosphate buffer (pH 7.4). Afterward, a properly diluted sample or Trolox standard was added to 150 µL of fluorescein in a 96-well microplate which was then incubated at 37 °C for 30 min. The first three cycles set the baseline signal, after which the AAPH solution was injected in order to produce the peroxyl radical. The fluorescence intensity (excitation and emission at 485 and 528 nm, respectively) was monitored for 120 min every 90 s. Determinations were carried out in duplicate. The results were expressed as mean value ± standard deviation of μmol Trolox equivalent (TE) per g sample.

3.6.2. DPPH Radical Scavenging Assay

The DPPH radical scavenging assay was performed following the methodology previously described by Brand-Williams et al. (1995) [51], with some modifications. Briefly, 0.75 mL of the extract and 1.5 mL of 0.2 mM methanolic DPPH solution were mixed in a test tube and shaken at 1800 rpm using Vortex MS2 Minishaker IKA (IKA, Staufen, Germany). As a blank, 2.25 mL of methanol was used. The samples were placed in absence of light at room temperature, and the absorbance was measured after 20 min at 517 nm on a VWR UV-1600PC Spectrophotometer (VWR, Wayne, PA, USA). A standard calibration curve (y = −0.008x + 1.3476, R2 = 0.9948) was prepared using standard Trolox solutions in a concentration range of 10–150 μM. The results were expressed as mean value ± standard deviation of μmol TE per g sample.

3.6.3. Ferric Reducing Antioxidant Power (FRAP) Assay

The FRAP assay was performed following a methodology previously described by Shortle et al. (2014) [48], with some modifications. Sodium acetate buffer (0.3 M, pH 3.6), 0.01 M TPTZ solution in 0.04 M hydrochloric acid and 20 mM FeCl3 × 6H2O aqueous solution in a ratio 10:1:1, respectively, were used to prepare the FRAP reagent. The reagent was incubated at 37 °C for 10 min prior to analysis. Afterward, 80 μL of the extract (extraction solvent for blank), 240 μL of distilled water and 2080 μL of FRAP reagent were added into test tubes, shaken at 1800 rpm using Vortex MS2 Minishaker IKA (IKA, Staufen, Germany) and incubated at 37 °C for 5 min. The absorbance was read on a VWR UV-1600PC Spectrophotometer (VWR, Wayne, PA, USA) at 593 nm. A standard calibration curve (y = 0.0013, R2 = 0.9995) was prepared using standard Trolox solutions (25–1000 μM). The results were expressed as mean value ± standard deviation of μmol TE per g sample.

3.7. Statistical Analysis

Statistica ver. 12.0 (Statsoft Inc., Tulsa, OK, USA) software was used for the statistical analysis of the results. For the determination of optimal extraction conditions, TPC was the dependent variable, while a full factorial design (mixed two- and three-level) comprising 72 trials was applied in order to evaluate the influence of the following independent variables: (a) solvent (50% and 70% ethanol), (b) temperature (90, 120 and 150 °C), (c) extraction cycles (1, 2 and 3) and (d) static extraction time (5 and 10 min). The normality and homoscedasticity of the data were analyzed using the Shapiro–Wilk W test and Levene’s test, respectively. Normally distributed data were analyzed using one-way and multifactorial analysis of variance (ANOVA), while Tukey’s HSD multiple comparison test was used to compare marginal means. Nonparametric tests including Kruskal–Wallis one-way ANOVA and multiple comparison of mean ranks were applied for analysis of the data which were not normally distributed and/or not homoscedastic. All of the tests were significant at p ≤ 0.05.

4. Conclusions

PLE, as a novel advanced green extraction technique, was optimized for the efficient isolation of polyphenols from laurel leaves. The optimal extraction conditions determined were 50% ethanol, a temperature of 150 °C, one extraction cycle and a static time of 5 min. The polyphenolic profile of the laurel leaf extract obtained by PLE comprised 29 compounds, including flavonoids (flavones, flavonols, flavan-3-ols and proanthocyanidins) and phenolic acids, and quantitative analysis has shown that flavonols (rutin and quercetin glucoside as the main representatives) were the most abundant group. The antioxidant activity assays have demonstrated that PLE yields extracts with relatively high antioxidant activity through a time-, energy- and solvent-efficient automated process, demonstrating its advantages over conventional extraction techniques in terms of scaling-up processes and reducing solvent, time and energy consumption. Therefore, PLE was proven to be an efficient green extraction technique suitable for the isolation of polyphenols from laurel leaves.

Author Contributions

Conceptualization, I.E.G. and E.D.; formal analysis, E.D., J.Š., Z.Z. and S.P.; data curation, E.D., Z.Z. and S.P.; writing—original draft preparation, E.D.; writing—review and editing, I.E.G.; Funding acquisition, V.D.-U. All authors have read and agreed to the published version of the manuscript.

Funding

This work was supported by the project “Bioactive molecules of medical plant as natural antioxidants, microbicides and preservatives” (KK.01.1.1.04.0093), co-financed by the Croatian Government and the European Union through the European Regional Development Fund—Operational Programme Competitiveness and Cohesion (KK.01.1.1.04.).

Institutional Review Board Statement

Not applicable.

Informed Consent Statement

Not applicable.

Data Availability Statement

Not applicable.

Conflicts of Interest

The authors declare no conflict of interest. The funders had no role in the design of the study; in the collection, analyses or interpretation of data; in the writing of the manuscript; or in the decision to publish the results.

Sample Availability

Samples of the compounds are not available from the authors.

References

  1. Batool, S.; Khera, R.A.; Hanif, M.A.; Ayub, M.A. Bay Leaf. Med. Plant. South Asia 2020, 5, 63–74. [Google Scholar] [CrossRef]
  2. Dias, M.I.; Barros, L.; Dueñas, M.; Alves, R.C.; Oliveira, M.B.P.P.; Santos-Buelga, C.; Ferreira, I.C.F.R. Nutritional and antioxidant contributions of Laurus nobilis L. leaves: Would be more suitable a wild or a cultivated sample? Food Chem. 2014, 156, 339–346. [Google Scholar] [CrossRef] [PubMed] [Green Version]
  3. Mazzio, E.A.; Li, N.; Bauer, D.; Mendonca, P.; Taka, E.; Darb, M.; Thomas, L.; Williams, H.; Soliman, K.F.A. Natural product HTP screening for antibacterial (E.coli 0157:H7) and anti-inflammatory agents in (LPS from E. coli O111:B4) activated macrophages and microglial cells; focus on sepsis. BMC Complement. Altern. Med. 2016, 16, 467. [Google Scholar] [CrossRef] [PubMed] [Green Version]
  4. Houicher, A.; Hechachna, H.; Teldji, H.; Ozogul, F. In Vitro Study of the Antifungal Activity of Essential Oils Obtained from Mentha spicata, Thymus vulgaris, and Laurus nobilis. Recent Pat. Food. Nutr. Agric. 2016, 8, 99–106. [Google Scholar] [CrossRef] [PubMed]
  5. Alejo-Armijo, A.; Altarejos, J.; Salido, S. Phytochemicals and biological activities of laurel tree (Laurus nobilis). Nat. Prod. Commun. 2017, 12, 743–757. [Google Scholar] [CrossRef] [PubMed] [Green Version]
  6. Vinha, A.F.; Guido, L.F.; Costa, A.S.G.; Alves, R.C.; Oliveira, M.B.P.P. Monomeric and oligomeric flavan-3-ols and antioxidant activity of leaves from different Laurus sp. Food Funct. 2015, 6, 1944–1949. [Google Scholar] [CrossRef] [PubMed] [Green Version]
  7. Sang, S.; Hou, Z.; Liebert, J.D.; Yang, C.S. Redox Properties of Tea Polyphenols and Related Biological Activities. Antioxid. Redox Signal. 2005, 7, 1704–1714. [Google Scholar] [CrossRef]
  8. Routray, W.; Orsat, V. Preparative extraction and separation of phenolic compounds. In Natural Products: Phytochemistry, Botany and Metabolism of Alkaloids, Phenolics and Terpenes.; Ramawat, G.K., Mérillon, J.-M., Eds.; Springer: Berlin/Heidelberg, Germany, 2013; pp. 2013–2045. ISBN 9783642221439. [Google Scholar]
  9. Dobroslavić, E.; Repajić, M.; Dragović-Uzelac, V.; Elez Garofulić, I. Isolation of Laurus nobilis Leaf Polyphenols: A Review on Current Techniques and Future Perspectives. Foods 2022, 11, 235. [Google Scholar] [CrossRef]
  10. Mustafa, A.; Turner, C. Pressurized liquid extraction as a green approach in food and herbal plants extraction: A review. Anal. Chim. Acta 2011, 703, 8–18. [Google Scholar] [CrossRef]
  11. López-Fernández, O.; Domínguez, R.; Pateiro, M.; Munekata, P.E.S.; Rocchetti, G.; Lorenzo, J.M. Determination of Polyphenols Using Liquid Chromatography–Tandem Mass Spectrometry Technique (LC–MS/MS): A Review. Antioxidants 2020, 9, 479. [Google Scholar] [CrossRef]
  12. Prior, R.L.; Wu, X.; Schaich, K. Standardized Methods for the Determination of Antioxidant Capacity and Phenolics in Foods and Dietary Supplements. J. Agric. Food Chem. 2005, 53, 4290–4302. [Google Scholar] [CrossRef] [PubMed]
  13. Munteanu, I.G.; Apetrei, C. Analytical methods used in determining antioxidant activity: A review. Int. J. Mol. Sci. 2021, 22, 3380. [Google Scholar] [CrossRef] [PubMed]
  14. Prior, R.L. Oxygen radical absorbance capacity (ORAC): New horizons in relating dietary antioxidants/bioactives and health benefits. J. Funct. Foods 2015, 18, 797–810. [Google Scholar] [CrossRef]
  15. Lu, M.; Yuan, B.; Zeng, M.; Chen, J. Antioxidant capacity and major phenolic compounds of spices commonly consumed in China. Food Res. Int. 2011, 44, 530–536. [Google Scholar] [CrossRef]
  16. Dudonné, S.; Vitrac, X.; Coutière, P.; Woillez, M.; Mérillon, J.-M. Comparative Study of Antioxidant Properties and Total Phenolic Content of 30 Plant Extracts of Industrial Interest Using DPPH, ABTS, FRAP, SOD, and ORAC Assays. J. Agric. Food Chem. 2009, 57, 1768–1774. [Google Scholar] [CrossRef] [PubMed]
  17. Muñiz-Márquez, D.B.; Rodríguez, R.; Balagurusamy, N.; Carrillo, M.L.; Belmares, R.; Contreras, J.C.; Nevárez, G.V.; Aguilar, C.N. Phenolic content and antioxidant capacity of extracts of Laurus nobilis L., Coriandrum sativum L. and Amaranthus hybridus L. CYTA-J. Food 2014, 12, 271–276. [Google Scholar] [CrossRef] [Green Version]
  18. Dobroslavić, E.; Elez Garofulić, I.; Zorić, Z.; Pedisić, S.; Dragović-Uzelac, V. Polyphenolic Characterization and Antioxidant Capacity of Laurus nobilis L. Leaf Extracts Obtained by Green and Conventional Extraction Techniques. Processes 2021, 9, 1840. [Google Scholar] [CrossRef]
  19. Leyva-Jiménez, F.J.; Lozano-Sánchez, J.; Borrás-Linares, I.; Arráez-Román, D.; Segura-Carretero, A. Comparative study of conventional and pressurized liquid extraction for recovering bioactive compounds from Lippia citriodora leaves. Food Res. Int. 2018, 109, 213–222. [Google Scholar] [CrossRef]
  20. Pollini, L.; Cossignani, L.; Juan, C.; Mañes, J. Extraction of phenolic compounds from fresh apple pomace by different non-conventional techniques. Molecules 2021, 26, 4272. [Google Scholar] [CrossRef]
  21. Li, J.; Zhang, S.; Zhang, M.; Sun, B. Novel approach for extraction of grape skin antioxidants by accelerated solvent extraction: Box–Behnken design optimization. J. Food Sci. Technol. 2019, 56, 4879–4890. [Google Scholar] [CrossRef]
  22. Díaz-De-Cerio, E.; Arráez-Román, D.; Segura-Carretero, A.; Ferranti, P.; Nicoletti, R.; Perrotta, G.M.; Gómez-Caravaca, A.M. Establishment of pressurized-liquid extraction by response surface methodology approach coupled to HPLC-DAD-TOF-MS for the determination of phenolic compounds of myrtle leaves. Anal. Bioanal. Chem. 2018, 410, 3547–3557. [Google Scholar] [CrossRef] [PubMed]
  23. Haminiuk, C.W.I.; Plata-Oviedo, M.S.V.; de Mattos, G.; Carpes, S.T.; Branco, I.G. Extraction and quantification of phenolic acids and flavonols from Eugenia pyriformis using different solvents. J. Food Sci. Technol. 2014, 51, 2862–2866. [Google Scholar] [CrossRef] [PubMed] [Green Version]
  24. Saldana, M.D.A.; Ekaette, I.; Ramirez, C.S.V.; dos Reis Coimbra, J.S.; Cardozo-Filho, L. Pressurized fluid extraction of phytochemicals from fruits, vegetables, cereals, and herbs. Fruit Veg. Phytochem. Chem. Hum. Health Second Ed. 2017, 1, 721–748. [Google Scholar] [CrossRef]
  25. Oancea, A.-M.; Onofrei, C.; Turturică, M.; Bahrim, G.; Râpeanu, G.; Stănciuc, N. The kinetics of thermal degradation of polyphenolic compounds from elderberry (Sambucus nigra L.) extract. Food Sci. Technol. Int. 2018, 24, 361–369. [Google Scholar] [CrossRef] [PubMed]
  26. Zhao, L.C.; He, Y.; Deng, X.; Yang, G.L.; Li, W.; Liang, J.; Tang, Q.L. Response surface modeling and optimization of accelerated solvent extraction of four lignans from fructus schisandrae. Molecules 2012, 17, 3618–3629. [Google Scholar] [CrossRef] [Green Version]
  27. Repajić, M.; Cegledi, E.; Kruk, V.; Pedisić, S.; Çinar, F.; Kovačević, D.B.; Žutić, I.; Dragović-Uzelac, V. Accelerated solvent extraction as a green tool for the recovery of polyphenols and pigments fromwild nettle leaves. Processes 2020, 8, 803. [Google Scholar] [CrossRef]
  28. Repajić, M.; Ekić, S.; Kruk, V.; Dragović Uzelac, V. Effect of accelerated solvent extraction conditions on the isolation of bioactive compounds from fennel (Foeniculum vulgare Mill.) seeds. Hrvat. Časopis Za Prehramben. Tehnol. Biotehnol. I Nutr. 2021, 15, 102–106. [Google Scholar] [CrossRef]
  29. Ahmad, R.; Ahmad, N.; Aljamea, A.; Abuthayn, S.; Aqeel, M. Evaluation of solvent and temperature effect on green accelerated solvent extraction (ASE) and UHPLC quantification of phenolics in fresh olive fruit (Olea europaea). Food Chem. 2021, 342, 128248. [Google Scholar] [CrossRef]
  30. Wibisono, R.; Zhang, J.; Saleh, Z.; Stevenson, D.E.; Joyce, N.I. Optimisation of accelerated solvent extraction for screening of the health benefits of plant food materials. Health (Irvine. Calif) 2009, 1, 220–230. [Google Scholar] [CrossRef] [Green Version]
  31. Hirondart, M.; Rombaut, N.; Fabiano-Tixier, A.S.; Bily, A.; Chemat, F. Comparison between pressurized liquid extraction and conventional Soxhlet extraction for rosemary antioxidants, yield, composition, and environmental footprint. Foods 2020, 9, 584. [Google Scholar] [CrossRef]
  32. Sandei, L.; Vadalà, R. Accelerated solvent extraction applied to tomato polyphenols assessment. Acta Hortic. 2013, 971, 225–234. [Google Scholar] [CrossRef]
  33. Setyaningsih, W.; Saputro, I.E.; Palma, M.; Barroso, C.G. Stability of 40 phenolic compounds during ultrasound-assisted extractions (UAE). AIP Conf. Proc. 2016, 1755, 080009. [Google Scholar] [CrossRef] [Green Version]
  34. De Paepe, D.; Valkenborg, D.; Coudijzer, K.; Noten, B.; Servaes, K.; De Loose, M.; Voorspoels, S.; Diels, L.; Van Droogenbroeck, B. Thermal degradation of cloudy apple juice phenolic constituents. Food Chem. 2014, 162, 176–185. [Google Scholar] [CrossRef]
  35. Volf, I.; Ignat, I.; Neamtu, M.; Popa, V. Thermal stability, antioxidant activity, and photo-oxidation of natural polyphenols. Chem. Pap. 2014, 68, 121–129. [Google Scholar] [CrossRef]
  36. Hostetler, G.L.; Riedl, K.M.; Schwartz, S.J. Effects of food formulation and thermal processing on flavones in celery and chamomile. Food Chem. 2013, 141, 1406–1411. [Google Scholar] [CrossRef] [Green Version]
  37. Khanal, R.C.; Howard, L.R.; Prior, R.L. Effect of heating on the stability of grape and blueberry pomace procyanidins and total anthocyanins. Food Res. Int. 2010, 43, 1464–1469. [Google Scholar] [CrossRef]
  38. El-Hamidi, M.; Zaher, F.A. Comparison Between Some Common Clays as Adsorbents of Carotenoids, Chlorophyll and Phenolic Compounds from Vegetable Oils. Am. J. Food Technol. 2016, 11, 92–99. [Google Scholar] [CrossRef]
  39. Zheng, W.; Yang, S.Y. Antioxidant Activity and Phenolic Compounds in Selected Herbs. J. Agric. Food Chem. 2001, 49, 5165–5170. [Google Scholar] [CrossRef]
  40. Kratchanova, M.; Denev, P.; Ciz, M.; Lojek, A.; Mihailov, A. Evaluation of antioxidant activity of medicinal plants containing polyphenol compounds. Comparison of two extraction systems. Acta Biochim. Pol. 2010, 57, 229–234. [Google Scholar] [CrossRef] [Green Version]
  41. Kim, S.J.; Kim, G.H. Inhibitory effects of Tunisian plants extracts on oxidative stress and lipid accumulation in HepG2 cells. Korean J. Food Preserv. 2021, 28, 403–415. [Google Scholar] [CrossRef]
  42. da Silva, E.M.; Rogez, H.; Larondelle, Y. Optimization of extraction of phenolics from Inga edulis leaves using response surface methodology. Sep. Purif. Technol. 2007, 55, 381–387. [Google Scholar] [CrossRef]
  43. Vallverdú-Queralt, A.; Regueiro, J.; Martínez-Huélamo, M.; Rinaldi Alvarenga, J.F.; Leal, L.N.; Lamuela-Raventos, R.M. A comprehensive study on the phenolic profile of widely used culinary herbs and spices: Rosemary, thyme, oregano, cinnamon, cumin and bay. Food Chem. 2014, 154, 299–307. [Google Scholar] [CrossRef] [PubMed]
  44. Carlsen, M.; Halvorsen, B.; Holte, K.; Bohn, S.; Dragland, S.; Sampson, L.; Wiley, C.; Senoo, H.; Umezono, Y.; Sanada, C.; et al. The total antioxidant content of more than 3100 foods, beverages, spices, herbs and supplements used worldwide. Eur. Food Res. Technol. 2011, 233, 3–376. [Google Scholar] [CrossRef] [PubMed]
  45. Shan, B.; Cai, Y.Z.; Sun, M.; Corke, H. Antioxidant Capacity of 26 Spice Extracts and Characterization of Their Phenolic Constituents. J. Agric. Food Chem. 2005, 53, 7749–7759. [Google Scholar] [CrossRef]
  46. Ou, B.; Huang, D.; Hampsch-Woodill, M.; Flanagan, J.A.; Deemer, E.K. Analysis of Antioxidant Activities of Common Vegetables Employing Oxygen Radical Absorbance Capacity (ORAC) and Ferric Reducing Antioxidant Power (FRAP) Assays: A Comparative Study. J. Agric. Food Chem. 2002, 50, 3122–3128. [Google Scholar] [CrossRef] [PubMed]
  47. AOAC. Official Methods of Analysis: Changes in Official Methods of Analysis Made at the Annual Meeting. Supplement; Rockville, M.D., Ed.; Scientific Research: Washington, DC, USA, 1990; Volume 15. [Google Scholar]
  48. Shortle, E.; O’Grady, M.N.; Gilroy, D.; Furey, A.; Quinn, N.; Kerry, J.P. Influence of extraction technique on the anti-oxidative potential of hawthorn (Crataegus monogyna) extracts in bovine muscle homogenates. Meat Sci. 2014, 98, 828–834. [Google Scholar] [CrossRef] [PubMed]
  49. Elez Garofulić, I.; Zorić, Z.; Pedisić, S.; Brnčić, M.; Dragović-Uzelac, V. UPLC-MS 2 Profiling of Blackthorn Flower Polyphenols Isolated by Ultrasound-Assisted Extraction. J. Food Sci. 2018, 83, 2782–2789. [Google Scholar] [CrossRef] [PubMed]
  50. Elez Garofulić, I.; Kruk, V.; Martić, A.; Martić, I.; Zorić, Z.; Pedisić, S.; Dragović, S.; Dragović-Uzelac, V. Evaluation of Polyphenolic Profile and Antioxidant Activity of Pistacia lentiscus L. Leaves and Fruit Extract Obtained by Optimized Microwave-Assisted Extraction. Foods 2020, 9, 1556. [Google Scholar] [CrossRef]
  51. Brand-Williams, W.; Cuvelier, M.E.; Berset, C. Use of a free radical method to evaluate antioxidant activity. LWT-Food Sci. Technol. 1995, 28, 25–30. [Google Scholar] [CrossRef]
Figure 1. UPLC-MS/MS chromatogram of laurel leaf extracts obtained at optimal PLE conditions in MRM acquisition mode: (1) chlorogenic acid, (2) protocatechuic acid, (3) rosmarinic acid, (4) p-coumaric acid, (5) syringic acid, (6) luteolin-6-C-glucoside, (7) rutin, (8) ferulic acid, (9) quercetin-3-glucoside, (10) kaempferol-3-rutinoside, (11) quercetin-3-pentoside, (12) kaempferol-3-O-hexoside, (13) luteolin, (14) isorhamnetin-3-hexoside, (15) myricetin, (16) quercetin-3-rhamnoside, (17) epigallocatechin gallate, (18) kaempferol-3-O-pentoside, (19) caffeic acid, (20) p-hydroxybenzoic acid, (21) apigenin, (22) 3,4-dihidrobenzoic acid hexoside, (23) gallic acid, (24) catechin, (25) epicatechin gallate, (26) procyanidin trimer, (27) apigenin-6-C-(O-deoxyhexosyl)-hexoside, (28) epicatechin, (29) kaempferol-3-O-deoxyhexoside.
Molecules 27 05099 g001
Figure 2. Concentration of different groups of polyphenols determined in the laurel leaf extract obtained at optimal PLE conditions.
Molecules 27 05099 g002
Table 1. Total phenolic content of laurel leaf extracts obtained by PLE.
Extraction ParametersTPC
mg GAE g−1
% EtOHTemperature (°C)Extraction CyclesStatic Extraction Time (min)
50901534.10 ± 2.02
509011033.82 ± 1.87
50902535.38 ± 1.77
509021036.46 ± 0.81
50903535.39 ± 0.71
509031036.46 ± 0.81
501201536.63 ± 1.31
5012011044.03 ± 2.02
501202538.93 ± 1.46
5012021040.78 ± 1.56
501203539.85 ± 0.50
5012031044.60 ± 1.11
501501546.34 ± 1.21
5015011044.46 ± 1.82
501502546.09 ± 1.82
5015021047.99 ± 1.11
501503545.82 ± 1.67
5015031049.30 ± 1.01
70901531.87 ± 1.51
709011032.41 ± 1.87
70902533.25 ± 0.61
709021034.76 ± 1.56
70903535.39 ± 1.51
709031036.24 ± 2.72
701201535.33 ± 2.27
7012011036.42 ± 2.57
701202538.19 ± 0.55
7012021040.44 ± 1.51
701203537.49 ± 1.97
7012031040.12 ± 2.02
701501543.39 ± 0.86
7015011042.98 ± 1.92
701502542.46 ± 1.56
7015021047.06 ± 1.46
701503540.56 ± 0.55
7015031039.73 ± 1.36
TPC = total phenolic content. Results are expressed as mean ± SD.
Table 2. Influence of different PLE parameters on total phenolic content of laurel leaf extracts.
NSource of VariationTPC
(mg GAE g−1)
% EtOHp < 0.05
3650% w/w40.91 ± 0.87 b
3670% w/w38.23 ± 0.72 a
Tp < 0.01
2490 °C34.63 ± 0.39 a
24120 °C39.40 ± 0.62 b
24150 °C44.68 ± 0.62 c
Extraction cyclesp = 0.37
24138.48 ± 1.10 a
24240.15 ± 1.01 a
24340.08 ± 0.91 a
Static extraction timep = 0.14
365 min38.69 ± 0.76 a
3610 min40.45 ± 0.86 a
TPC = total phenolic content. N = number of trials. Results are expressed as mean ± standard error. Values marked with different letters are statistically different at p ≤ 0.05. Statistically significant variable at p ≤ 0.05. Statistically insignificant variable at p ≤ 0.05.
Table 3. Mass spectrometric data on laurel leaf extract obtained at optimal PLE conditions.
CompoundRetention TimeTentative IdentificationConcentration mg/100 g
Phenolic acids
11.008chlorogenic acid *0.46 ± 0.01
23.638protocatechuic acid *58.63 ± 1.66
34.259rosmarinic acid *0.99 ± 0.03
44.937p-coumaric acid *4.25 ± 0.12
55.961syringic acid *0.07 ± 0.00
87.917ferulic acid *1.01 ± 0.03
1910.788caffeic acid *74.44 ± 2.11
2010.802p-hydroxybenzoic acid2.83 ± 0.08
2311.573gallic acid *0.28 ± 0.01
2211.4263.4-dihidrobenz-A-hexoside4.57 ± 0.13
Flavones
66.938luteolin-6-C-glucoside3.91 ± 0.11
138.678luteolin *7.15 ± 0.20
2111.415apigenin *9.40 ± 0.27
2711.998apigenin-6-C-(O-deoxyhexosyl)-hexoside0.27 ± 0.01
Flavonols
77.561rutin *97.31 ± 2.75
97.969quercetin-3-glucoside94.41 ± 2.67
108.349kaempferol-3-rutinoside6.00 ± 0.17
118.39quercetin-3-pentoside7.92 ± 0.22
128.64kaempferol-3-O-hexoside18.02 ± 0.51
148.747isorhamnetin-3-hexoside24.93 ± 0.71
158.791myricetin *2.25 ± 0.06
168.897quercetin-3-rhamnoside9.57 ± 0.27
189.178kaempferol-3-O-pentoside8.04 ± 0.23
2912.299kaempferol-3-O-deoxyhexoside0.14 ± 0.00
Flavan-3-ols
179.014epigallocatechin gallate *0.15 ± 0.00
2411.658catechin *31.35 ± 0.89
2511.898epicatechin gallate *0.34 ± 0.01
2812.055epicatechin29.20 ± 0.83
Proanthocyanidins
2611.977procyanidin trimer3.89 ± 0.11
Total phenols
(mg 10−2 g−1)
--501.84 ± 2.27
Results are expressed as mean ± standard deviation. * identification was confirmed with authentic standards.
Table 4. Antioxidant activity of laurel extracts obtained by PLE determined by various assays.
Assayμmol TE g−1
ORAC97.27 ± 2.01
DPPH73.51 ± 0.22
FRAP311.10 ± 5.67
Results are expressed as mean ± SD.
Publisher’s Note: MDPI stays neutral with regard to jurisdictional claims in published maps and institutional affiliations.

