
Production, Purification, and Study of the Amino Acid Composition of Microalgae Proteins


 ,
,  ,
,  and
and
Abstract
1. Introduction
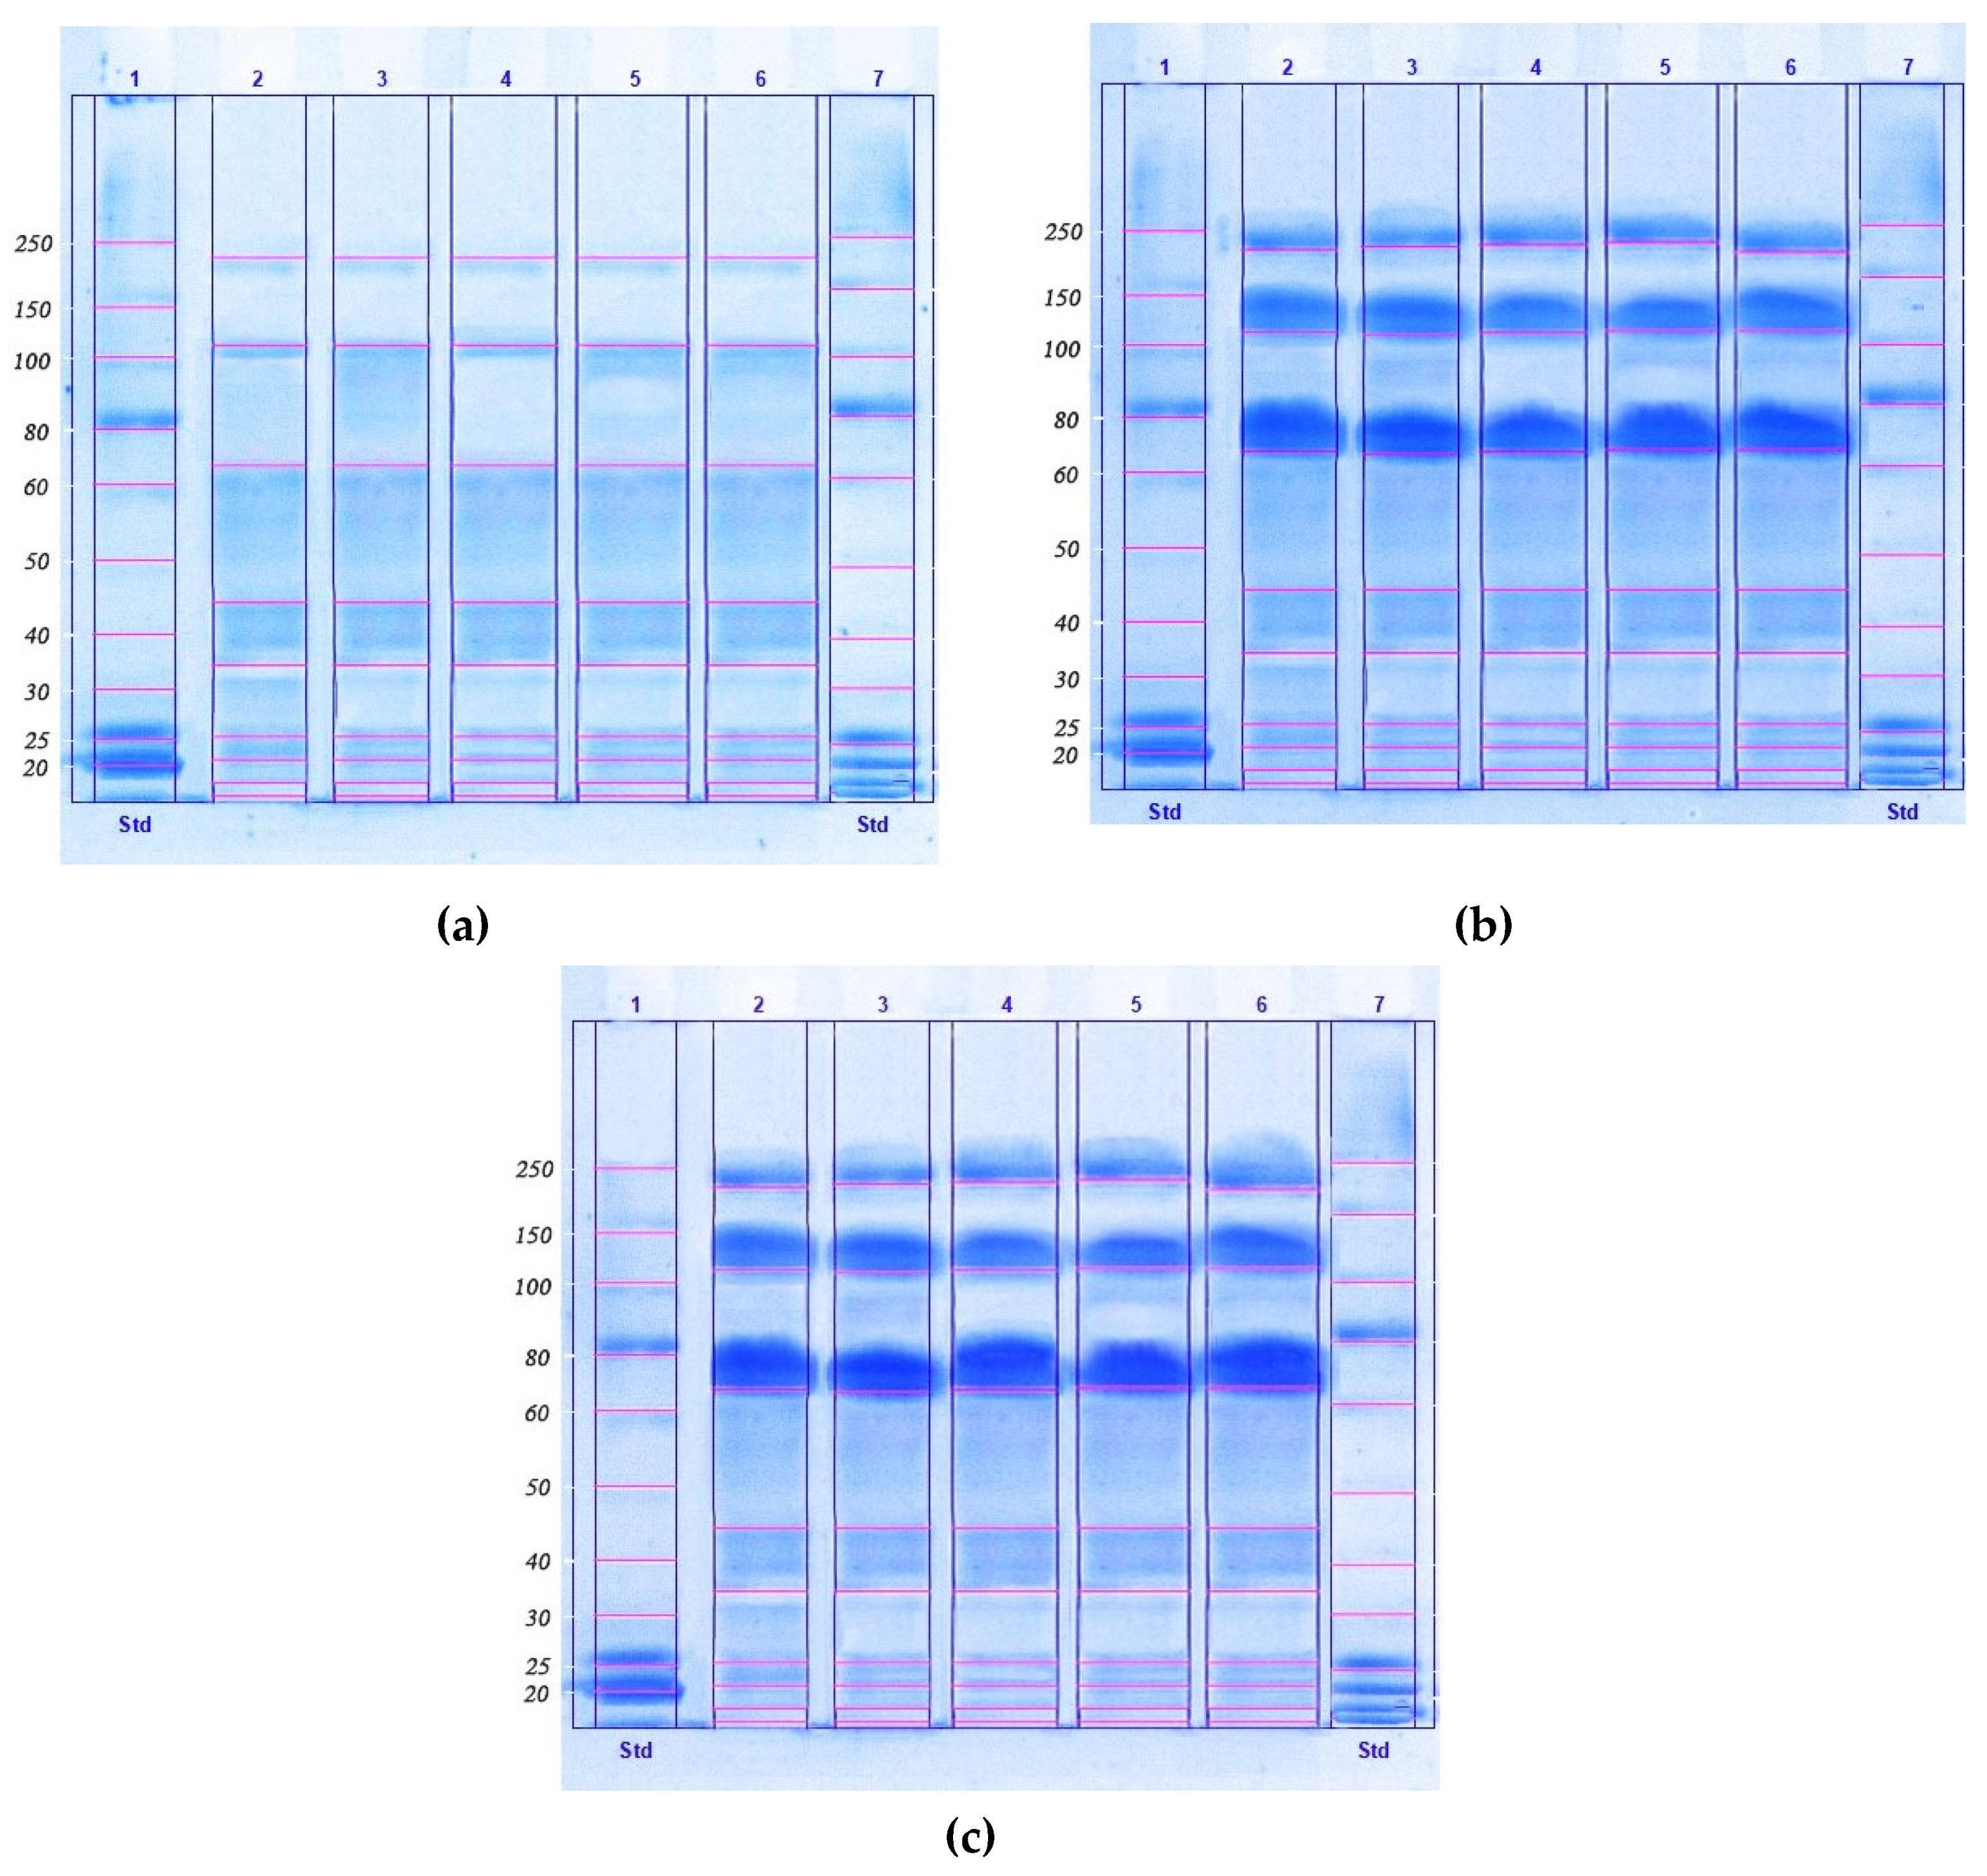
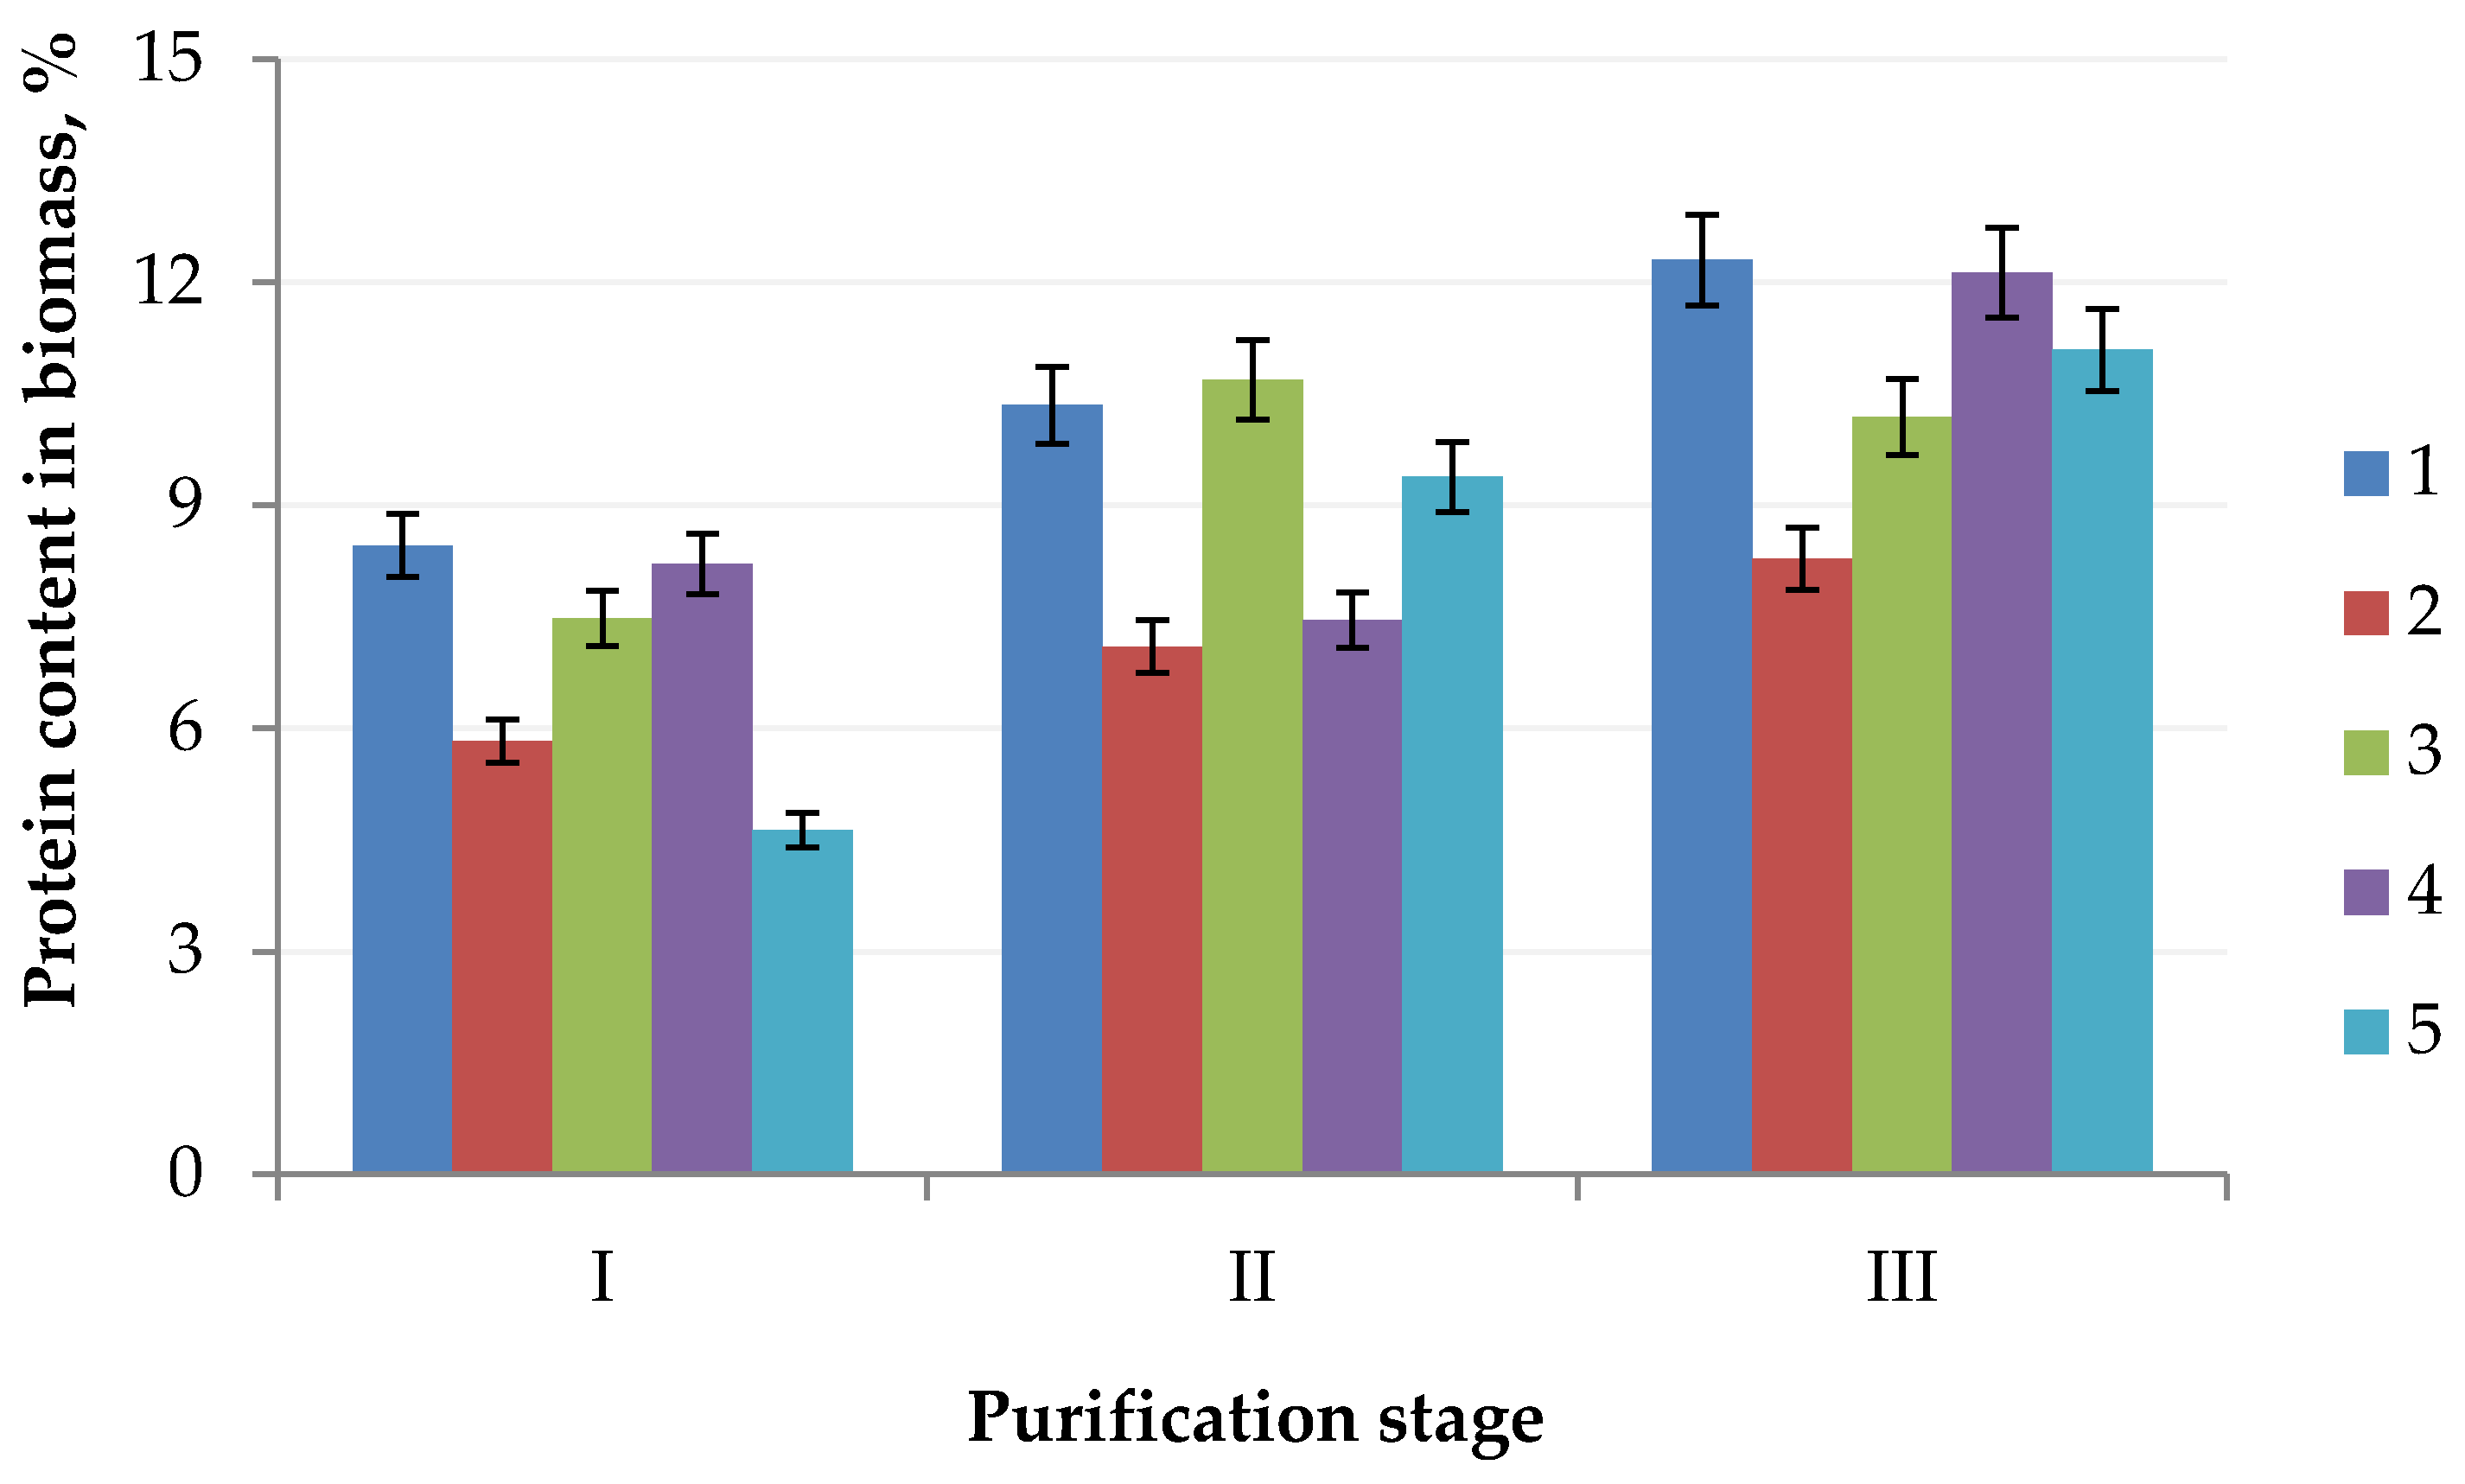
2. Results
- –
- a one-stage method of ultrafiltration;
- –
- a two-stage method of ultrafiltration and high-performance liquid chromatography (HPLC).
3. Discussion
4. Materials and Methods
4.1. Materials and Chemicals
4.2. Microalgae Cultivation
4.3. Production of Protein Concentrate
4.4. Purification of Protein Concentrate
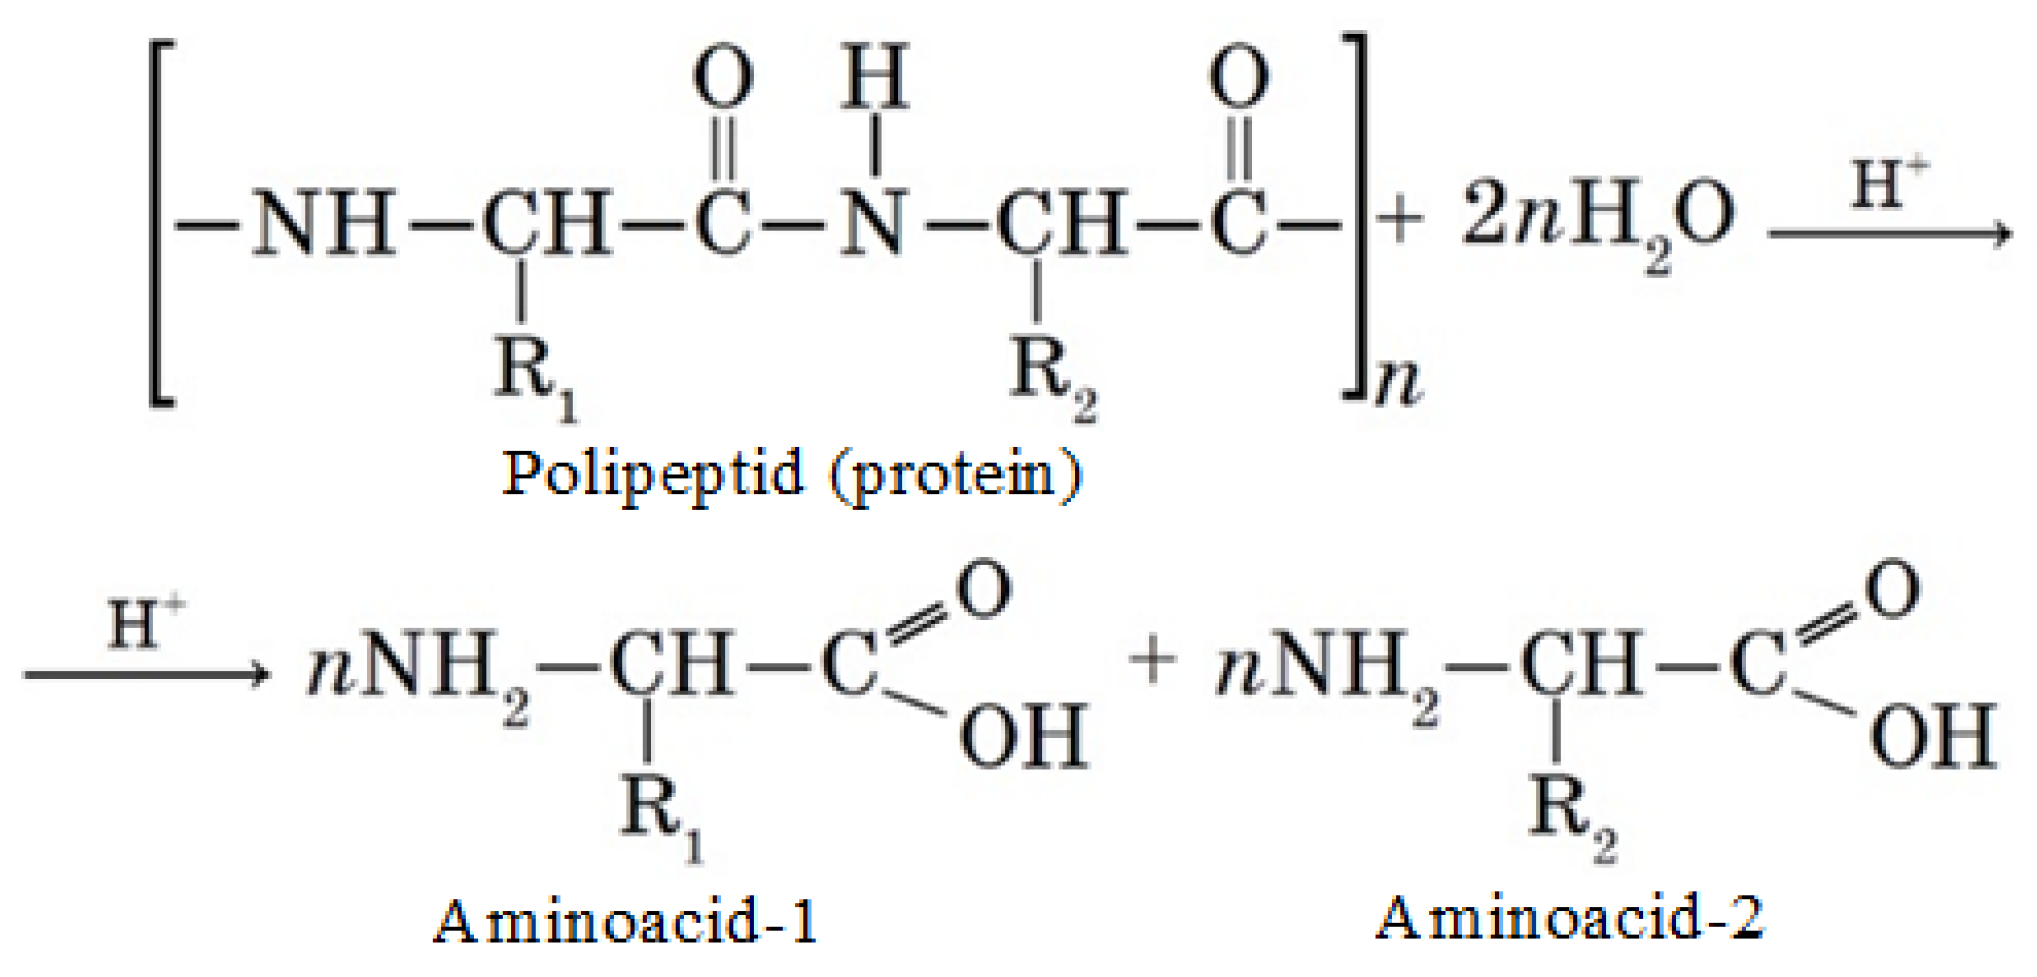
4.5. Determination of the Protein Concentrate Amino Acid Composition
4.6. SDS-PAGE Analysis
4.7. Statistical Analysis
5. Conclusions
Author Contributions
Funding
Institutional Review Board Statement
Informed Consent Statement
Data Availability Statement
Conflicts of Interest
Sample Availability
Appendix A. Sequences of the 18S Ribosomal RNA Gene of the Studied Microorganism (Sample I)
- TGTAGTCATATGCTTGTCTCAAAGATTAAGCCATGCATGTCTAAGTATAAACTGCTTTATACTGTGAAACTGCGAATGGCTCATTAAATCAGTTATAGTTTATTTGATGGTACCTACTACTCGGATACCCGTAGTAAATCTAGAGCTAATACGTGCGTAAATCCCGACTTCTGGAAGGGACGTATTTATTAGATAAAAGGCCGACCGGGCTCTGCCCGACTCGCGGTGAATCATGATAACTTCACGAATCGCATGGCCTTGTGCCGGCGATGTTTCATTCAAATTTCTGCCCTATCAACTTTCGATGGTAGGATAGAGGCCTACCATGGTGGTAACGGGTGACGGAGGATTAGGGTTCGATTCCGGAGAGGGAGCCTGAGAAACGGCTACCACATCCAAGGAAGGCAGCAGGCGCGCAAATTACCCAATCCTGACACAGGGAGGTAGTGACAATAAATAACAATACTGGGCCTTTTCAGGTCTGGTAATTGGAATGAGTACAATCTAAACCCCTTAACGAGGATCAATTGGAGGGCAAGTCTGGTGCCAGCAGCCGCGGTAATTCCAGCTCCAATAGCGTATATTTAAGTTGCTGCAGTTAAAAAGCTCGTAGTTGGATTTCGGGTGGGGCCTGCCGGTCCGCCGTTTCGGTGTGCACTGGCAGGGCCCACCTTGTTGCCGGGGACGGGCTCCTGGGCTTCACTGTCCGGGACTCGGAGTCGGCGCTGTTACTTTGAGTAAATTAGAGTGTTCAAAGCAGGCCTACGCTCTGAATACATTAGCATGGAATAACACGATAGGACTCTGGCCTATCCTGTTGGTCTGTAGGACCGGAGTAATGATTAAGAGGGACAGTCGGGGGCATTCGTATTTCATTGTCAGAGGTGAAATTCTTGGATTTATGAAAGACGAACTACTGCGAAAGCATTTGCCAAGGATGTTTTCATTAATCAAGAACGAAAGTTGGGGGCTCGAAGACGATTAGATACCGTCCTAGTCTCAACCATAAACGATGCCGACTAGGGATCGGCGGATGTTTCTTCGATGACTCCGCCGGCACCTTATGAGAAATCAAAGTTTTTGGGTTCCGGGGGGAGTATGGTCGCAAGGCTGAAACTTAAAGGAATTGACGGAAGGGCACCACCAGGCGTGGAGCCTGCGGCTTAATTTGACTCAACACGGGAAAACTTACCAGGTCCAGACATAGTGAGGATTGACAGATTGAGAGCTCTTTCTTGATTCTATGGGTGGTGGTGCATGGCCGTTCTTAGTTGGTGGGTTGCCTTGTCAGGTTGATTCCGGTAACGAACGAGACCTCAGCCTGCTAAATAGTCACGGTTGGCTCGCCAGCCGGCGGACTTCTTAGAGGGACTATTGGCGACTAGCCAATGAAGCATGAGGCAATAACAGGTCTGTGATGCCCTTAGATGTTCTGGGCCGCACGCGCGCTACACTGATGCATTCAACGAGCTTAGCCTTGGCCGAGAGGCCCGGGTAATCTTTGAAACTGCATCGTGATGGGGATAGATTATTGCAATTATTAATCTTCAACGAGGAATGCCTAGTAAGCGCAAGTCATCAGCTTGCGTTGATTACGTCCCTGCCCTTTGTACACACCGCCCGTCGCTCCTACCGATTGGGTGTGCTGGTGAAGTGTTCGGATTGGCGACCGGGGGCGGTCTCCGCTCTCGGCCGCCGAGAAGTTCATTAAACCCTCCCACCTAGAGGAAGGAGAAGTCGTAACAAGGTTTCCGTAGGTGAACCTGCGGAAGGATCA
Appendix B. Sequences of the 18S Ribosomal RNA Gene of the Studied Microorganism (Sample II)
- AGAGTTTGATCCTGGCTCAGGATGAACGCTGGCGGTCTGCTTAACACATGCAAGTCGAACGGGCTCTTCGGAGCTAGTGGCGGACGGGTGAGTAACACGTGAGAATCTGGCTCCCGGTCGGGGACAACAGAGGGAAACTTCTGCTAATCCCGGATGAGCCGAAAGGTAAAAGATTTATCGCCGGGAGATGAGCTCGCGTCTGATTAGCTAGTTGGTGAGGTAAAGGCTCACCAAGGCGACGATCAGTAGCTGGTCTGAGAGGATGATCAGCCACACTGGGACTGAGACACGGCCCAGACTCCTACGGGAGGCAGCAGTGGAGAATTTTCCGCAATGGGCGCAAGCCTGACGGAGCAAGACCGCGTGGGGGAGGAAGGCTCTTGGGTTGTAAACCCCTTTTCTCAAGGAAGAACACAATGACGGTACTTGAGGAATAAGCCTCGGCTAACTCCGTGCCAGCAGCCGCGGTAATACGGAGGAGGCAAGCGTTATCCGGAATGATTGGGCGTAAAGCGTCCGTAGGTGGCAGTTCAAGTCTGCTGTCAAAGACAGTAGCTCAACTACTGAAAGGCAGTGGAAACTGAACAGCTAGAGTACGGTAGGGGCAGAGGGAATTCCCGGTGTAGCGGTGAAATGCGTAGATATCGGGAAGAACACCGGTGGCGAAAGCGCTCTGCTGGGCCGTAACTGACACTGAGGGACGAAAGCTAGGGGAGCGAATGGGATTAGATACCCCAGTAGTCCTAGCCGTAAACGATGGAAACTAGGTGTAGCCTGTATCGACCCGGGCTGTGCCGAAGCTAACGCGTTAAGTTTCCCGCCTGGGGAGTACGCACGCAAGTGTGAAACTCAAAGGAATTGACGGGGGCCCGCACAAGCGGTGGAGTATGTGGTTTAATTCGATGCAACGCGAAGAACCTTACCAGGGCTTGACATGTCCGGAATCTTGGTGAAAGCCGAGAGTGCCTTCGGGAGCCGGAACACAGGTGGTGCATGGCTGTCGTCAGCTCGTGTCGTGAGGTGTTGGGTTAAGTCCCGCAACGAGCGCAACCCTCGTCCTTAGTTGCCATCATTCAGTTGGGCACTTTAGGGAGACTGCCGGTGACAAACCGGAGGAAGGTGGGGATGACGTCAAGTCATCATGCCCCTTACGTCCTGGGCTACACACGTACTACAATGGGGGGGACAAAGGGTAGCCAAGACGCGAGTCTGAGCCAATCCCGTAAACCTCTCCTCAGTTCAGATTGCAGGCTGCAACTCGCCTGCATGAAGGAGGAATCGCTAGTAATCGCAGGTCAGCATACTGCGGTGAATCCGTTCCCGGGCCTTGTACACACCGCCCGTCACACCATGGAAGTTAGCCACGCCCGAAGTCGTTACTCTAACCGTTCGCGGAGGAGGATGCCGAAGGCAGGGCTGATGACTGGGGTGAAGTCGTAACAAGGTAGCCGTACCGGAAGGTGTGGCTGGATCACCTCCTTTTTAGGGAGACCTACTTCGAGATATCGCGCCTTAACAACTATAGCCGTGTCTTGAGGTCATCCTTAGGTCGGATGGGGCGGTCAGAGAGCTTTCAAACTTTAGGGTTCGTGTTATGGGCTATTAGCTCAGGTGGTTAGAGCGCACCCCTGATAAGGGTGAGGTCCCTGGTTCAAGTCCAGGATGGCCCACATCCACCCCAAACTGGGGGTATAGCTCAGTTGGTAGAGCGCTGCCTTTGCACGGCAGAAGTCAGCGGTTCGAGTCCGCTTACCTCCACTCTCCTTTGTGATGGTGCTAGTTGGGGTGAGATGAGATGAGATGACCTCTGATAGATAATTTATCACTGTACAGCTCCTAAATCTTTAGATGTTAGTCTGAGATTGGATAGCTGGACATCTGTTCCAGTCAGAACCTTGAAAACTGCATAGAGAAAAGCATAATGGTGTAGGAAAACGTCGTAAAGACAATTCCAATGTAGGTCAAGCTACAAAGGGCTAACGGTGGAACCTAGGCACACAGAGCGGCCGCAAA
Appendix C. Sequences of the 18S Ribosomal RNA Gene of the Studied Microorganism (Sample III)
- TGAGTTTGATCCTGGCTCAGGATGAACGCTGGCGGTATGCTTAACACATGCAAGTCGAACGGTGTCTTTCGGACACAGTGGCGGACGGGTGAGTAACGCGTGAGAATCTGGCTCTAGGTCTGGGACAACCACTGGAAACGGTGGCTAATACCGGATGTGCCCTTCGGGGTGAAAGGTTAACTGCCTGGAGATGAGCTCGCGTCTGATTAGCTAGTTGGGAAGTGTTCAAGTGGACTCCCAAGGCGACGATCAGTAGCTGGTCTGAGAGGACGATCAGCCACACTGGGACTGAGACACGGCCCAGACTCCTACGGGAGGCAGCAGTGGGGAATTTTCCGCAATGGGCGAAAGCCTGACGGGAGCAATACCGCGTGAGGGAGGAAGGCTCTTGGGTCGTAAACGCTCTTTTCTCAGGGAAGAACACAATGACGGTACCTGAGGAATAAGCATCGGCTAACTCCGTGCCAGCAGCCGCGGTAATACGGAGGATGCAAGCGTTATCCGGAATGATTGGGCGTAAAGCGTCCGCAGGTGGCAATGTAAGTCTGCTGTTAAAGAGTCTAGCTCAACTAGATAAAAGCAGTGGAAACTACATAGCTAGAGTGCGTTCGGGGCAGAGGGAATTCCTGGTGTAGCGGTGAAATGCGTAGAGATCAGGAAGAACACCAGTGGCGAAGGCGCTCTGCTAGGCCGTAACTGACACTGAGGGACGAAAGCTAGGGGAGCGAATGGGATTAGATACCCCAGTAGTCCTAGCCGTAAACGATGGATACTAGGCGTGGCTTGTATCGACCCGAGCCGTGCCGTAGCTAACGCGTTAAGTATCCCGCCTGGGGAGTACGCCGGCAACGGTGAAACTCAAAGGAATTGACGGGGGCCCGCACAAGCGGTGGAGTATGTGGTTTAATTCGATGCAACGCGAAGAACCTTACCAAGGCTTGACATGTCGCGAATCTTCTCGAAAGGGAAGAGTGCCTTCGGGAGCGCGAACACAGGTGGTGCATGGCTGTCGTCAGCTCGTGTCGTGAGATGTTGGGTAAGTCCCGCAACGAGCGCAACCCTCGTTTTAGTTGCCAGCATTAAGTTGGGCACTCTAGAGAGACTGCCGGTGACAAACCGGAGGAAGGTGGGGATGACGTCAAGTCAGCATGCCCCTTACGCCTTGGGCTACACACGTACTACAATGCTCCGGACAGAGGGCAGCAAGCATGCGAATGCAAGCAAATCCCGTAAACCGGAGCTCAGTTCAGATCGCAGGCTGCAACTCGCCTGCGTGAAGGAGGAATCGCTAGTAATTGCAGGTCAGCATACTGCAGTGAATTCGTTCCCGGGCCTTGTACACACCGCCCGTCACACCATGGAAGCTGGTAGTGCCCGAAGTCATTACTCCAACTTTTCGGAGAGGAGGATGCCTAAGGCAGGACTGGTGACTGGGGTGAAGTCGTAACAAGGTAGCCGTACCGGAAGGTGTGCTGGGGATCACTC
Appendix D. Sequences of the 18S Ribosomal RNA Gene of the Studied Microorganism (Sample IV)
- CTGGTTGATCCTGCCAGTAGTCATATGCTTGTCTCAAAGATTAAGCCATGCATGTCTAAGTATAAACTGCTTATACTGTGAAACTGCGAATGGCTCATTAAATCAGTTATAGTTTATTTGATGGTACCTTTACTCGGATAACCGTAGTAATTCTAGAGCTAATACGTGCGTAAATCCAGACTTCTGGAAGGGACGTATTTATTAGATAAAAGGCCAGCCGGGCTTGCCCGACTCTTGGCGAATCATGATAACTTCACGAATCGCACGGCTTTATGCCGGCGATGTTTCATTCAAATTTCTGCCCTATCAACTTTCGATGGTAGGATAGAGGCCTACCATGGTGGTAACGGGTGACGGAGGATTAGGGTTCGATTCCGGAGAGGGAGCCTGAGAAACGGCTACCACATCCAAGGAAGGCAGCAGGCGCGCAAATTACCCAATCCCAACACGGGGAGGTAGTGACAATAAATAACAATACCGGGCATTTTTGTCTGGTAATTGGAATGAGTACAATCTAAATCCCTTAACGAGTATCCATTGGAGGGCAAGTCTGGTGCCAGCAGCCGCGGTAATTCCAGCTCCAATAGCGTATATTTAAGTTGTTGCAGTTAAAAAGCTCGTAGTTGGATTTCGGGTGGGTTGTAGCGGTCAGCCTTTGGTTAGTACTGCTACGGCCTACCTTTCTGCCGGGGACGAGCTCCTGGGCTTAACTGTCCGGGACTCGGAATCGGCGAGGTTACTTTGAGTAAATTAGAGTGTTCAAAGCAAGCCTACGCTCTGAATACATTAGCATGGAATAACACGATAGGACTCTGGCTTATCTTGTTGGTCTGTAAGACCGGAGTAATGATTAAGAGGGACAGTCGGGGGCATTCGTATTTCATTGTCAGAGGTGAAATTCTTGGATTTATGAAAGACGAACTTCTGCGAAAGCATTTGCCAAGGATGTTTTCATTAATCAAGAACGAAAGTTGGGGGCTCGAAGACGATTAGATACCGTCGTAGTCTCAACCATAAACGATGCCGACTAGGGATTGCCAGGTGTTTCGTTGATGACCCTGCCAGCACCTTATGAGAAATCAAAGTTTTTGGGTTCCGGGGGGAGTATGGTCGCAAGGCTGAAACTTAAAGGAATTGACGGAAGGGCACCACCAGGCGTTAACTTAGCAGCAAGCTCAGCGCCTCAAAGTCGAAGGGAAACCTTTGGCTAGTATCTGGGTGTAGATTTCACCTAAGTGCAACACTGTTCAAATTGCGGGAAAGCCCTAAAGCTTTGCTAACCAAGCTGTCCTAGAAATGGGATGGTGGCCAGGTGAAAGACCTTGGGTACGGTAAAATCAGCAAAGATGCAACAATGGGCAATCCGCAGCCAAGCTCCTACGGGCTGTCAAAGCCTATGGAGAAGGTTCAGAGACTAAATGGCAGTGGGCAAGCATGGCAATGCTTGCTTAAGATATAGTCCGTCCCAGCTGAGAAGCTGCCTATGAGAGGAATGCCGTAAGGCAGGAGAGCTAATAGGAAGTAAGTGTCTTTAATCAACTTACTTGGATTCCACGGGAGCCTGCGGCTTAATTTGACTCAACACGGGAAAACTTACCAGGTCCAGACACGGGGAGGATTGACAGATTGAGAGCTCTTTCTTGATTCTGTGGGTGGTGGTGCATGGCCGTTCTTAGTTGGTGGGTTGCCTTGTCAGGTTGATTCCGGTAACGAACGAGACCTCAGCCTGCTAAATAGTCACGTCTACCTCGGTAGGCGCCTGACTTCTTAGAGGGACTATTGGCGTTTAGCCAATGGAAGTGTGAGGCAATAACAGGTCTGTGATGCCCTTAGATGTTCTGGGCCGCACGCGCGCTACACTGATGCATTCAACGAGCCTATCCTTGGCCGAGAGGTCCGGGTAATCTTTGAAACTGCATCGTGATGGGGATAGATTATTGCAATTATTAGTCTTCAACGAGGAATGCCTAGTAAGCGCGAGTCATCAGCTCGCGTTGATTACGTCCCTGCCCTTTGTACACACCGCCCGTCGCTCCTACCGATTGGGTGTGCTGGTGAAGTGTTTGGATCGGTACCAATGGGGGGAAACCTCTGTTGGTACTGAGAAGAACATTAAACCCTCCCACCTAGAGGAAGGAGAAGTCGTAACAAGGTTTCCGTAGGTGAACCT GCAGAAGGATCA
Appendix E. Sequences of the 18S Ribosomal RNA Gene of the Studied Microorganism (Sample V)
- AACCTGGTTGATCCTGCCAGTAGTCATATGCTTGTCTCAAAGATTAAGCCATGCATGTCTAAGTATAAGCGAGTATACAGTGAAACTGCGAATGGCTCATTAAATCAGTTATGGTTTATTTGATGGTACCTTACTACTTGGATACCCGTAGTAATTCTAGAGCTAATACATGCAGGAGTTCGCTGGTTCKTGCGCCGCGATGTATTTATTAGATAAGAGACCAACCCGCCTTGTGCGGTTGCGTGCCGAGTCATAATAACTGTTCGAATCGCATGGCTCTGACGCCGGCGATGGTTCATTCAAGTTTCTGCCCTATCAGCTTTCGATGGTAGGATAGAGGCCTACCATGGCGTTAACGGGTAACGGAGAATTAGGGTTCGATTCCGGAGAGGGAGCCTGAGAGATGGCTACCACATCCAAGGAAGGCAGCAGGCGCGTAAATTGCCCGAATCCTGACACAGGGAGGTAGTGACAAGAAATAACAATACAGGGCCATCTTGGTCTTGTACTTGGAATGAGTACAATTTACATCTCTTCACGAGGATCAATTGGAGGGCAAGTCTGGTGCCAGCAGCCGCGGTAATTCCAGCTCCAATAGCGTATATTAAAGTTGTTGCAGTTAAAACGCTCGTAGTCGGATTTCGGGTCGGTTGCGCCGGTCTGCCGATGGGTATGCACTGGCGGAGTCGTCCTTTCTTCCGGAGACCGGGCCTCCTCTTAGCTGAGCGGGTTCGGGAGACGGATCGTTTACTTTGAAAAAATCAGAGTGTTTCAAGCAGGCAGCTCGCTCTTGCATGGATTAGCATGGGATAATGAAATAGGACTCTGGTGCTATTTTGTTGGTTTCGAACACCGGAGTAATGGTCAACAGGGACAGTCAGGGGCACTCGTATTCCGCCGAGAGAGGTGAAATTCTCAGACCAGCGGAAGACGAACCACTGCGAAAGCATTTGCCAGGGATGTTTTCACTGATCAAGAACGAAAGTTAGGGGATCGAAGACGATCAGATACCGTCGTAGTCTTAACCATAAACCATGCCGACTAGGGATTGGAGGCTGTTCCTTTTGTGACTCCTTCAGCACCTTTCGGGAAACTAAAGTCTTTGGGTTCCGGGGGGAGTATGGTCGCAAGGCTGAAACTTAAAGGAATTGACGGAAGGGCACCACCAGGAGTGGAGCCTGCGGCTTAATTTGACTCAACACGGGGAAACTTACCAGGTCCAGACATTGTGAGGATTGACAGATTGAGAGCTCTTTCTTGATTCGATGGGTGGTGGTGCATGGCCGTTCTTAGTTGGTGGAGTGATTTGTCTGGTTAATTCCGTTAACGAACGAGACCGCAGCCTGCTAAATAGTTTCGCGAACACTCCGTTGGCGTTGAGCTTCTTAGAGGGACAACTTGTCTTCAACAAGTGGAAGTTTGCGGCAATAACAGGTCTGTGATGCCCTTAGATGTTCTGGGCCGCACGCGCGCTACACTGATGCATTCAGCGAGTCTCTTCCCTTGGCCGAGAGGTCCGGGTAATCTTGTGAACTTGCATCGTGATGGGGATAGATTATTGCAATTATTAATCTTCAACGAGGAATTCCTAGTAAGCGCATGTCATCAGCGTGCGTTGATTACGTCCCTGCCCTTTGTACACACCGCCCGTCGCTCCTACCGATTGAATGATCCGGTGAGGCCCCCGGACTGTGGCAACGTGGCTGGTGTTCCAGCCGCGATGCCGCGGGAAGTTGTCCAAACCTTATCATTTAGAGGAAGGAGAAGTCGTAACAAGGTTTCCGTAGGTGAACCTGCAGAAGGATCAA
References
- Amorim, M.L.; Soares, J.; dos Reis Coimbra, J.S.; de Oliveira Leite, M.; Teixeira Albino, L.F.; Martins, M.A. Microalgae proteins: Production, separation, isolation, quantification, and application in food and feed. Crit. Rev. Food Sci. Nutr. 2020, 1–27. [Google Scholar] [CrossRef] [PubMed]
- Schade, S.; Stangl, G.I.; Meier, T. Distinct microalgae species for food—Part 2: Comparative life cycle assessment of microalgae and fish for eicosapentaenoic acid (EPA), docosahexaenoic acid (DHA), and protein. J. Appl. Phycol. 2020, 32, 2997–3013. [Google Scholar] [CrossRef]
- El-Ahmady El-Naggar, N.; Hussein, M.H.; Shaaban-Dessuuki, S.A.; Dalal, S.R. Production, extraction and characterization of Chlorella vulgaris soluble polysaccharides and their applications in AgNPs biosynthesis and biostimulation of plant growth. Sci. Rep. 2020, 10, 3011. [Google Scholar] [CrossRef]
- Chew, K.W.; Chia, S.R.; Lee, S.Y.; Zhu, L.; Show, P.L. Enhanced microalgal protein extraction and purification using sustainable microwave-assisted multiphase partitioning technique. Chem. Eng. J. 2019, 367, 1–8. [Google Scholar] [CrossRef]
- Dolganyuk, V.; Belova, D.; Babich, O.; Prosekov, A.; Ivanova, S.; Katserov, D.; Patyukov, N.; Sukhikh, S. Microalgae: A promising source of valuable bioproducts. Biomolecules 2020, 10, 1153. [Google Scholar] [CrossRef]
- Bishop, W.M.; Zubeck, H.M. Evaluation of microalgae for use as nutraceuticals and nutritional supplements. J. Nutr. Food Sci. 2012, 2, 5. [Google Scholar] [CrossRef]
- Ghribi, A.M.; Gafsi, I.M.; Blecker, C.; Danthine, S.; Attia, H.; Besbes, S. Effect of drying methods on physicochemical and functional properties of chickpea protein concentrates. J. Food Eng. 2015, 165, 179–188. [Google Scholar] [CrossRef]
- Vernèsa, L.; Abert-Viana, M.; El Maâtaouib, M.; Tao, Y.; Bornard, I.; Chemat, F. Application of ultrasound for green extraction of proteins from spirulina. Mechanism, optimization, modeling, and industrial prospects. Ultrason. Sonochem. 2019, 54, 48–60. [Google Scholar] [CrossRef]
- Waghmare, A.G.; Salve, M.K.; Arya, S.S.; LeBlanc, J.G. Concentration and characterization of microalgae proteins from Chlorella pyrenoidosa. Bioresour. Bioprocess. 2016, 3, 16. [Google Scholar] [CrossRef]
- Chia, S.R.; Chew, K.W.; Zaid, H.F.M.; Chu, D.-T.; Tao, Y.; Show, P.L. Microalgal protein extraction from chlorella vulgaris fsp-e using triphasic partitioning technique with sonication. Front. Bioeng. Biotechnol. 2019, 7, 396. [Google Scholar] [CrossRef]
- Kai Ru, I.T.; Sung, Y.Y.; Jusoh, M.; Abdul Wahid, M.E.; Nagappan, T. Chlorella vulgaris: A perspective on its potential for combining high biomass with high value bioproducts. Appl. Phycol. 2020, 1, 2–11. [Google Scholar]
- Grimi, N.; DuboisLuc, A.; Marchal, M.; Vorobiev, E. Microalgal biomass refining and valorization. Bioresour. Technol. 2013, 153, 254–259. [Google Scholar] [CrossRef]
- Hu, J.; Nagarajan, D.; Zhang, Q.; Chang, J.S.; Lee, D.J. Heterotrophic cultivation of microalgae for pigment production: A review. Biotechnol. Adv. 2018, 36, 54–67. [Google Scholar] [CrossRef]
- Mazumdar, N.; Novis, P.M.; Visnovsky, G.; Gostomski, P.A. Effect of nutrients on the growth of a new alpine strain of Haematococcus (Chlorophyceae) from New Zealand. Phycol. Res. 2019, 67, 21–27. [Google Scholar] [CrossRef]
- Zhan, J.; Rong, J.; Wang, Q. Mixotrophic cultivation, a preferable microalgae cultivation mode for biomass/bioenergy production, and bioremediation, advances and prospect. Int. J. Hydrogen Energy 2017, 42, 8505–8517. [Google Scholar] [CrossRef]
- Mantzorou, A.; Ververidis, F. Microalgal biofilms: A further step over current microalgal cultivation techniques. Sci. Total Environ. 2019, 651, 3187–3201. [Google Scholar] [CrossRef] [PubMed]
- Rackis, J.J.; Sessa, D.J.; Honig, D.H. Flavor problems of vegetable food proteins. J. Am. Oil Chem. Soc. 1979, 56, 262–271. [Google Scholar] [CrossRef]
- Morais Junior, W.G.; Gorgich, M.; Corrêa, P.S.; Martins, A.A.; Mata, T.M.; Caetano, N.S. Microalgae for biotechnological applications: Cultivation, harvesting and biomass processing. Aquaculture 2020, 528, 735562. [Google Scholar] [CrossRef]
- Becker, E.W. Micro-algae as a source of protein. Biotechnol. Adv. 2007, 25, 207–210. [Google Scholar] [CrossRef] [PubMed]
- Kadnikova, I.A.; Selivanova, O.N.; Shcherbakova, N.S. Himicheskiy sostav pal’marievyh vodorosley (Palmariales, Rhodophyta) poberezh’ya Kamchatki [Chemical composition of kelp (Palmariales, Rhodophyta) on the Kamchatka coast]. Izv. TINRO [TINRO News] 2012, 169, 246–254. (In Russian) [Google Scholar]
- Dolganyuk, V.; Andreeva, A.; Budenkova, E.; Sukhikh, S.; Babich, O.; Ivanova, S.; Prosekov, A.; Ulrikh, E. Study of morphological features and determination of the fatty acid composition of the microalgae lipid complex. Biomolecules 2020, 10, 1571. [Google Scholar] [CrossRef] [PubMed]
- Alam, A.; Xu, J.-L.; Wang, Z. (Eds.) Microalgae Biotechnology for Food, Health and High Value Products; Springer: Singapore, 2020. [Google Scholar] [CrossRef]
- Barinova, S. Essential and practical bioindication methods and systems for the water quality assessment. Int. J. Environ. Sci. Nat. Resour. 2017, 2, 1–11. [Google Scholar] [CrossRef]
- Mathys, A.; Caporgno, M.P. Trends in microalgae incorporation into innovative food products with potential health benefits. Front. Nutr. 2018, 6, 5. [Google Scholar] [CrossRef]
- Kasaai, M.R. Molecular weight distribution for biopolymers: A review. J. Polym. Biopolym. Phys. Chem. 2018, 6, 39–44. [Google Scholar]
- Sarkar, S.; Manna, M.S.; Bhowmick, T.K.; Gayen, K. Priority-based multiple products from microalgae: Review on techniques and strategies. Crit. Rev. Biotechnol. 2020, 40, 590–607. [Google Scholar] [CrossRef]
- Rincon, S.M.; Urrego, N.F.; Avila, K.J.; Romero, H.M.; Beyenal, H. Photosynthetic activity assessment in mixotrophically cultured Chlorella vulgaris biofilms at various developmental stages. Algal Res. 2019, 38, 101408. [Google Scholar] [CrossRef]
- Schägger, H.; von Jagow, G. Tricine-sodium dodecyl sulfate-polyacrylamide gel electrophoresis for the separation of proteins in the range from 1 to 100 kDa. Anal. Biochem. 1987, 166, 368–379. [Google Scholar] [CrossRef]
- Bleakley, S.; Hayes, M. Algal proteins: Extraction, application, and challenges concerning production. Foods 2017, 6, 33. [Google Scholar] [CrossRef] [PubMed]


| Molecular Weight Range, kDa | The Relative Content of the Fraction, % | ||||
|---|---|---|---|---|---|
| Chlorella vulgaris | Arthrospira platensis | Nostoc sp. | Dunaliella salina | Pleurochrysis carterae | |
| 227.0–225.0 | 9.0 a | 9.6 a | 8.4 b | 9.2 a | 9.8 a |
| 115.0–112.0 | 11.5 a | 11.4 a | 9.3 b | 10.8 a | 12.2 a |
| 70.0–67.0 | 12.0 a | 12.3 a | 14.5 b | 11.6 a | 11.8 a |
| 45.0–43.0 | 13.7 a | 13.9 a | 14.9 b | 14.3 b | 13.4 a |
| 35.0–33.0 | 8.2 a | 8.3 a | 10.3 b | 8.1 a | 8.0 a |
| 27.0–25.0 | 11.6 a | 10.8 a | 6.1 b | 11.6 a | 11.9 a |
| 21.0–20.0 | 11.5 a | 11.2 a | 12.1 a | 10.7 b | 12.0 a |
| 17.0–15.0 | 10.4 a | 10.8 a | 11.8 b | 12.4 b | 9.1 c |
| 15.0–13.0 | 12.1 a | 11.7 a | 12.6 a | 11.3 a | 11.8 a |
| Molecular Weight Range, kDa | The Relative Content of the Fraction, % | ||||
|---|---|---|---|---|---|
| Chlorella vulgaris | Arthrospira platensis | Nostoc sp. | Dunaliella salina | Pleurochrysis carterae | |
| 227.0–225.0 | 14.8 a | 15.4 a | 14.7 a | 16.2 b | 17.3 b |
| 115.0–112.0 | 17.6 a | 18.8 b | 16.5 a | 19.0 b | 21.5 c |
| 70.0–67.0 | 19.7 a | 21.1 a | 25.4 c | 23.4 c | 20.8 a |
| 45.0–43.0 | 9.8 a | 7.4 b | 9.8 a | 8.2 b | 7.6 b |
| 35.0–33.0 | 6.7 a | 6.2 a | 6.6 a | 6.8 a | 6.6 a |
| 27.0–25.0 | 7.6 a | 7.8 a | 3.7 b | 6.6 a | 6.9 a |
| 21.0–20.0 | 8.5 a | 7.7 b | 8.3 a | 6.4 c | 6.8 c |
| 17.0–15.0 | 7.6 a | 8.1 a | 7.4 a | 7.0 a | 5.8 b |
| 15.0–13.0 | 7.7 a | 7.5 a | 7.6 a | 6.4 b | 6.7 b |
| Molecular Weight Range, kDa | The Relative Content of the Fraction, % | ||||
|---|---|---|---|---|---|
| Chlorella vulgaris | Arthrospira platensis | Nostoc sp. | Dunaliella salina | Pleurochrysis carterae | |
| 227.0–225.0 | 18.4 a | 19.1 b | 18.2 a | 19.2 b | 21.1 c |
| 115.0–112.0 | 27.6 a | 28.2 a | 26.4 a | 30.4 b | 29.5 b |
| 70.0–67.0 | 31.5 a | 31.6 a | 36.2 b | 32.1 a | 31.8 a |
| 45.0–43.0 | 4.8 a | 3.5 b | 4.4 a | 3.6 b | 3.3 b |
| 35.0–33.0 | 3.2 a | 2.7 a | 2.5 a | 2.9 a | 2.7 a |
| 27.0–25.0 | 3.1 a | 3.2 a | 1.5 b | 2.7 a | 2.9 a |
| 21.0–20.0 | 2.5 a | 2.6 a | 2.7 a | 1.8 a | 1.9 a |
| 17.0–15.0 | 4.6 a | 4.9 a | 3.8 a | 3.7 ab | 3.0 b |
| 15.0–13.0 | 4.3 a | 4.2 a | 4.3 a | 3.6 a | 3.8 a |
| Amino Acid | Amino Acid Content, g/100 g Protein | ||||
|---|---|---|---|---|---|
| Chlorella vulgaris | Arthrospira platensis | Nostoc sp. | Dunaliella salina | Pleurochrysis carterae | |
| Alanine | 10.82 ± 0.32 a | 11.48 ± 0.34 a | 9.88 ± 0.29 a | 10.99 ± 0.32 a | 11.51 ± 0.34 a |
| Arginine | 7.33 ± 0.21 a | 6.02 ± 0.18 a | 6.15 ± 0.18 a | 8.16 ± 0.24 a | 6.88 ± 0.20 a |
| Aspartic acid | 8.54 ± 0.25 a | 10.12 ± 0.30 b | 9.18 ± 0.27 a | 9.56 ± 0.28 ab | 9.19 ± 0.27 a |
| Cysteine | 1.47 ± 0.04 a | 1.94 ± 0.05 a | 1.54 ±0.04 a | 1.63 ± 0.04 a | 2.03 ± 0.06 a |
| Glutamic acid | 10.28 ± 0.30 a | 14.36 ± 0.43 b | 12.38 ± 0.37 a | 12.41 ± 0.37 a | 15.17 ± 0.45 b |
| Glycine | 7.14 ± 0.21 a | 5.25 ± 0.15 b | 6.54 ± 0.19 ab | 8.71 ± 0.26 a | 7.02 ± 0.21 a |
| Histidine | 1.52 ± 0.04 a | 2.19 ± 0.06 a | 2.01 ± 0.06 a | 1.73 ± 0.05 a | 1.89 ± 0.05 a |
| Isoleucine | 3.36 ± 0.10 a | 4.48 ± 0.13 a | 3.68 ± 0.11 a | 4.09 ± 0.12 a | 4.22 ± 0.12 a |
| Leucine | 8.41 ± 0.25 a | 9.81 ± 0.29 a | 9.41 ± 0.28 a | 9.58 ± 0.28 a | 9.93 ± 0.29 a |
| Lysine | 5.35 ± 0.16 a | 7.11 ± 0.21 b | 6.47 ± 0.19 a | 5.99 ± 0.17 a | 7.24 ± 0.21 b |
| Methionine | 2.52 ± 0.07 a | 1.93 ± 0.05 a | 2.23 ± 0.06 a | 2.79 ± 0.08 a | 2.41 ± 0.07 a |
| Phenylalanine | 6.17 ± 0.18 a | 7.85 ± 0.23 a | 7.15 ± 0.21 a | 6.98 ± 0.20 a | 7.69 ± 0.23 a |
| Proline | 5.08 ±0.15 a | 5.17 ± 0.15 a | 5.28 ± 0.15 a | 5.23 ± 0.15 a | 5.12 ± 0.15 a |
| Serine | 4.34 ± 0.13 a | 3.31 ± 0.09 a | 3.16 ± 0.09 a | 4.81 ± 0.14 a | 3.48 ±0.10 a |
| Threonine | 5.46 ± 0.16 a | 4.57 ± 0.13 b | 5.31 ± 0.15 a | 5.16 ± 0.15 a | 5.67 ± 0.17 a |
| Tryptophan | 0.21 ± 0.01 a | 1.16 ± 0.03 b | 1.02 ± 0.03 b | 0.18 ± 0.01 a | 1.14 ± 0.03 b |
| Tyrosine | 4.34 ± 0.13 a | 7.85 ± 0.23 b | 6.84 ± 0.20 b | 4.86 ± 0.14 a | 7.69 ± 0.23 b |
| Valine | 6.89 ± 0.20 a | 7.81 ± 0.23 a | 7.15 ± 0.21 a | 7.23 ± 0.21 a | 7.55 ± 0.22 a |
Publisher’s Note: MDPI stays neutral with regard to jurisdictional claims in published maps and institutional affiliations. |
© 2021 by the authors. Licensee MDPI, Basel, Switzerland. This article is an open access article distributed under the terms and conditions of the Creative Commons Attribution (CC BY) license (https://creativecommons.org/licenses/by/4.0/).
Share and Cite
Andreeva, A.; Budenkova, E.; Babich, O.; Sukhikh, S.; Ulrikh, E.; Ivanova, S.; Prosekov, A.; Dolganyuk, V. Production, Purification, and Study of the Amino Acid Composition of Microalgae Proteins. Molecules 2021, 26, 2767. https://doi.org/10.3390/molecules26092767
Andreeva A, Budenkova E, Babich O, Sukhikh S, Ulrikh E, Ivanova S, Prosekov A, Dolganyuk V. Production, Purification, and Study of the Amino Acid Composition of Microalgae Proteins. Molecules. 2021; 26(9):2767. https://doi.org/10.3390/molecules26092767
Chicago/Turabian StyleAndreeva, Anna, Ekaterina Budenkova, Olga Babich, Stanislav Sukhikh, Elena Ulrikh, Svetlana Ivanova, Alexander Prosekov, and Vyacheslav Dolganyuk. 2021. "Production, Purification, and Study of the Amino Acid Composition of Microalgae Proteins" Molecules 26, no. 9: 2767. https://doi.org/10.3390/molecules26092767
APA StyleAndreeva, A., Budenkova, E., Babich, O., Sukhikh, S., Ulrikh, E., Ivanova, S., Prosekov, A., & Dolganyuk, V. (2021). Production, Purification, and Study of the Amino Acid Composition of Microalgae Proteins. Molecules, 26(9), 2767. https://doi.org/10.3390/molecules26092767