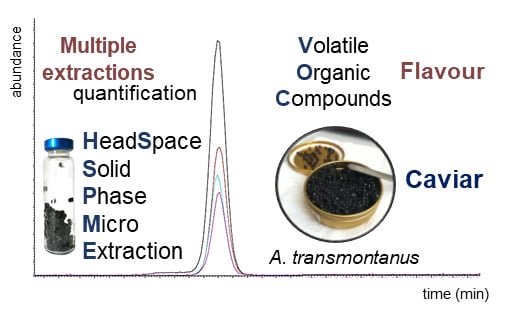
Volatile Organic Compounds Profile in White Sturgeon (Acipenser transmontanus) Caviar at Different Stages of Ripening by Multiple Headspace Solid Phase Microextraction

 ,
,  , ,
, , 
Abstract
1. Introduction
2. Results and Discussion
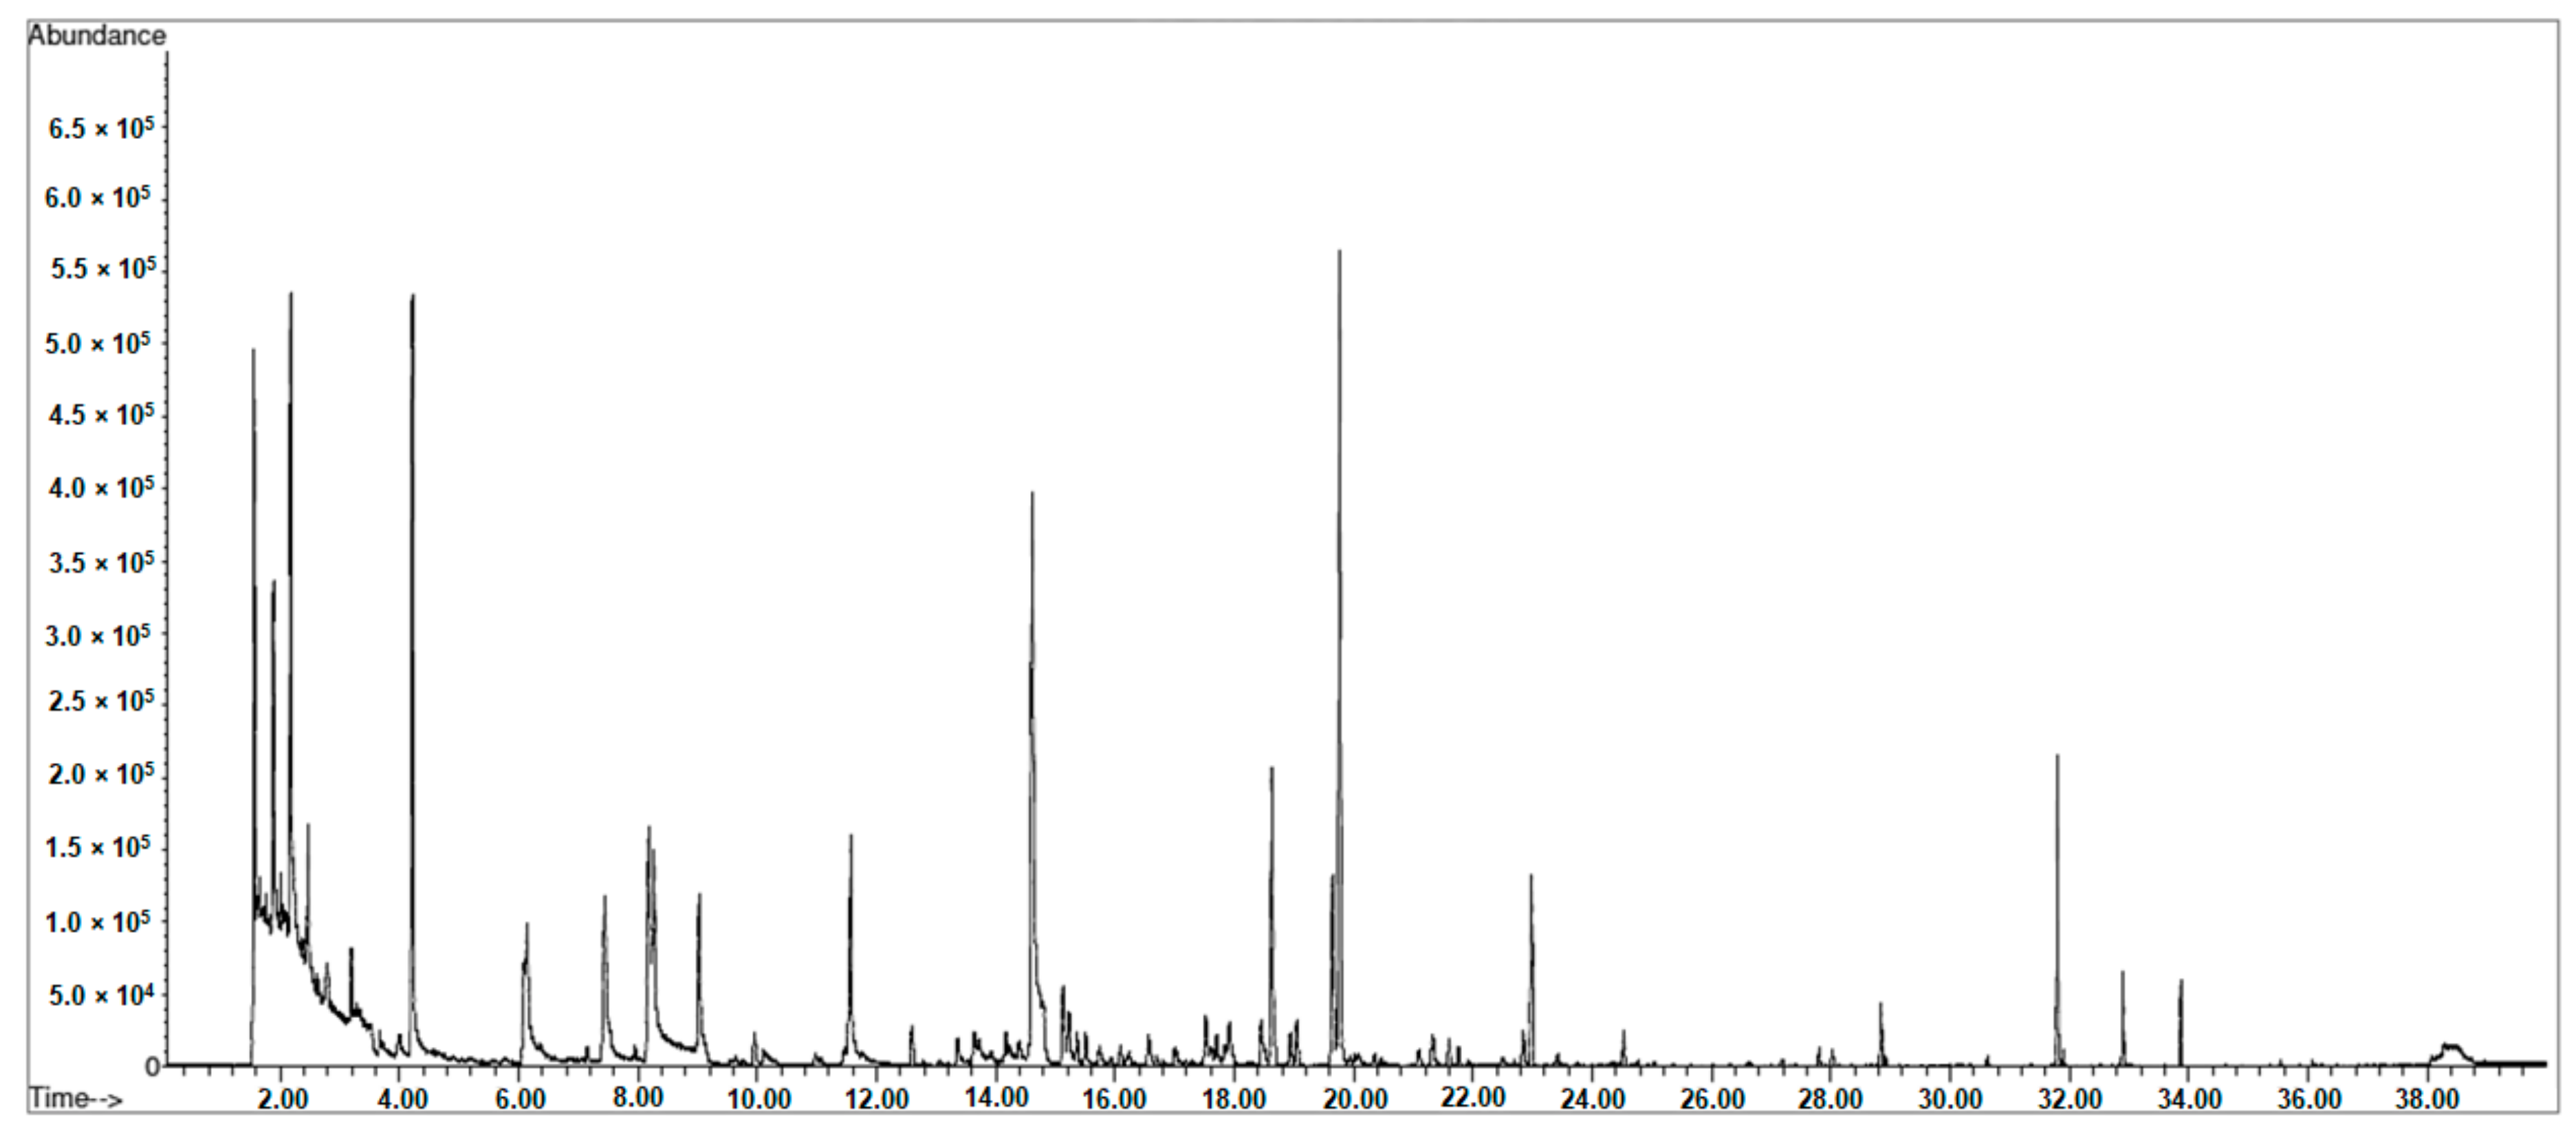
2.1. MHS Extraction Method Development
2.2. Caviar VOCs Identification and Quantification
3. Materials and Methods
3.1. Samples
3.2. SPME, GC and MS Parameters
3.3. Identification of the Volatiles
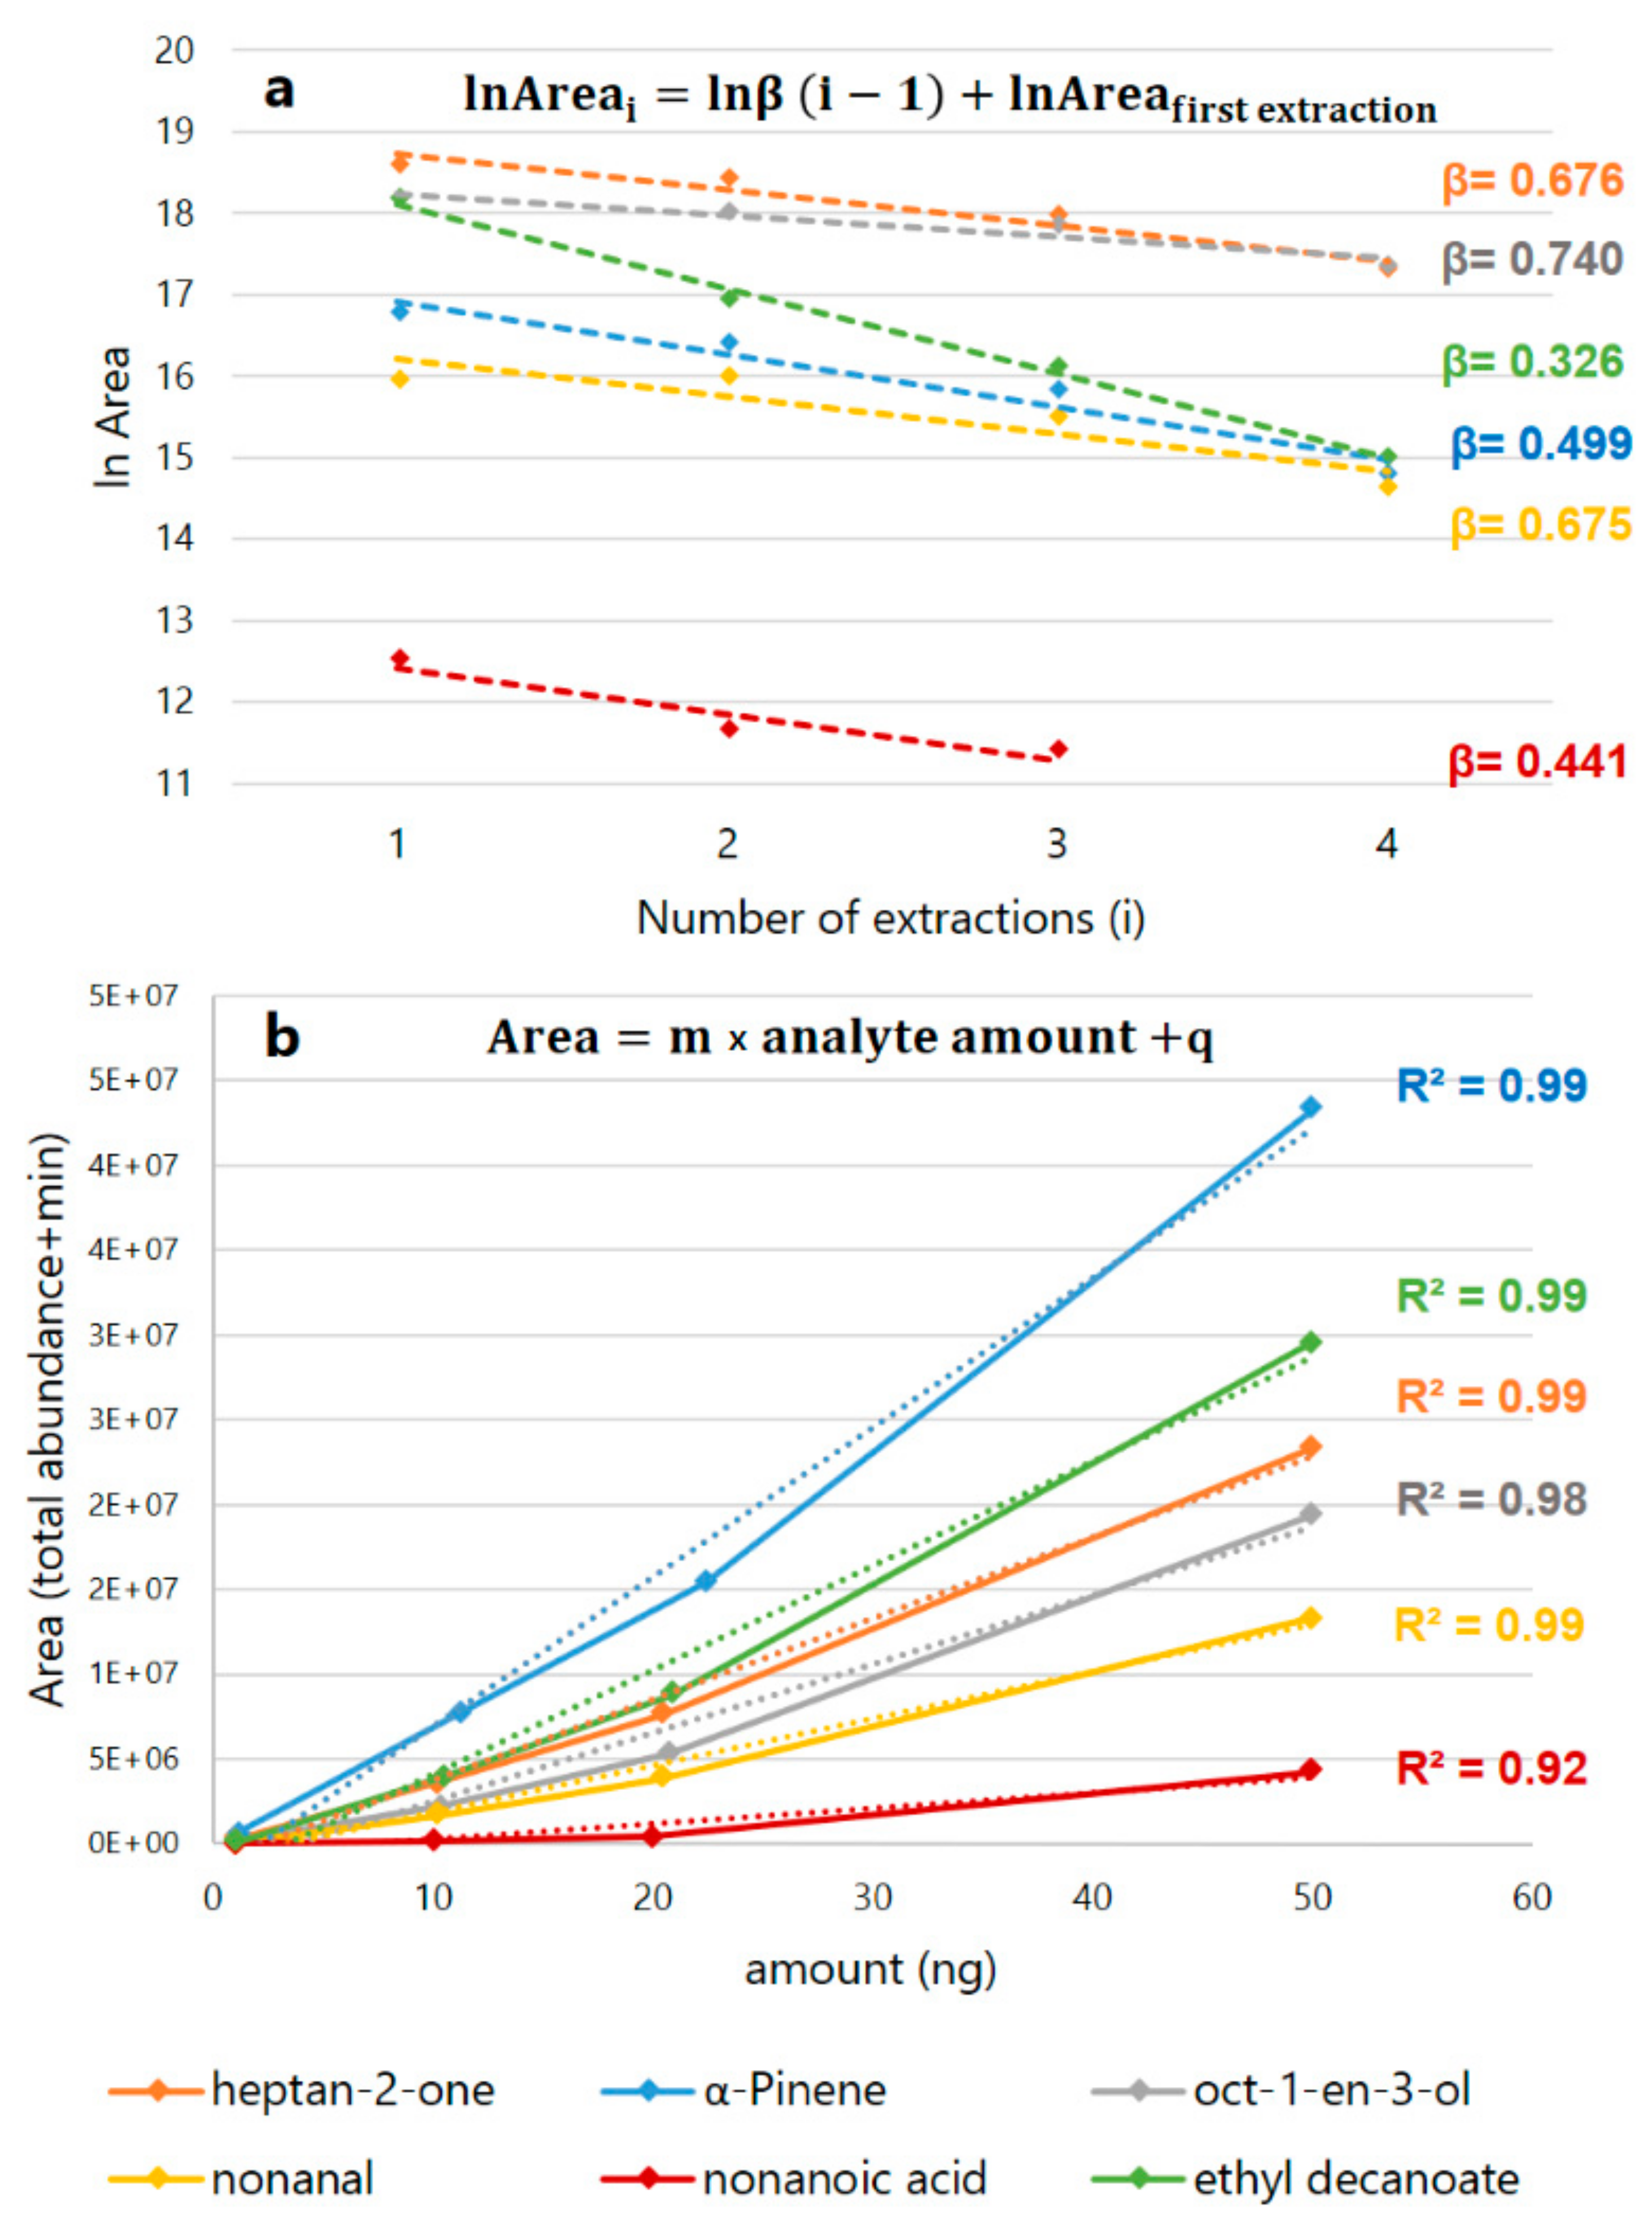
3.4. Quantification by Multiple-Extractions and External Calibration Approach
3.5. Statistical Analysis
4. Conclusions
Supplementary Materials
Author Contributions
Funding
Conflicts of Interest
References
- Codex Alimentarius Codex Standard. CODEX STAN 291–2010 Page 2 of 4. 2013. Available online: http://www.fao.org/fao-who-codexalimentarius/codex-texts/list-standards/en/ (accessed on 28 January 2020).
- Bronzi, P.; Chebanov, M.; Michaels, J.T.; Wei, Q.; Rosenthal, H.; Gessner, J. Sturgeon meat and caviar production: Global update 2017. J. Appl. Ichthyol. 2019, 35, 257–266. [Google Scholar] [CrossRef]
- CITES. Convention on International Trade in Endangered Species of Wild Fauna and Flora. Available online: https://www.cites.org/eng/disc/text.php (accessed on 28 January 2020).
- Fain, S.R.; Straughan, D.J.; Hamlin, B.C.; Hoesch, R.M.; LeMay, J.P. Forensic genetic identification of sturgeon caviars traveling in world trade. Conserv Genet. 2013, 14, 855–874. [Google Scholar] [CrossRef]
- Rehbein, H.; Molkentin, J.; Schubring, R.; Lieckfeldt, D.; Ludwig, A. Development of advanced analytical tools to determine the origin of caviar. J. Appl Ichthyol. 2008, 24, 65–70. [Google Scholar] [CrossRef]
- Pappalardo, A.M.; Petraccioli, A.; Capriglione, T.; Ferrito, V. From Fish Eggs to Fish Name: Caviar Species Discrimination by COIBar-RFLP, an Efficient Molecular Approach to Detect Fraud in the Caviar Trade. Molecules 2019, 24, 2468. [Google Scholar] [CrossRef]
- Gessner, J.; Würtz, S.; Kirschbaum, F.; Wirth, M. Biochemical composition of caviar as a tool to discriminate between aquaculture and wild origin. J. Appl Ichthyol. 2008, 24, 52–56. [Google Scholar] [CrossRef]
- Wirth, M.; Kirschbaum, F.; Gessner, J.; Williot, P.; Patriche, N.; Billard, R. Fatty acid composition in sturgeon caviar from different species: Comparing wild and farmed origins. Int Rev. Hydrobiol. 2002, 87, 629–636. [Google Scholar] [CrossRef]
- Caprino, F.; Moretti, V.M.; Bellagamba, F.; Turchini, G.M.; Busetto, M.L.; Giani, I.; Paleari, M.A.; Pazzaglia, M. Fatty acid composition and volatile compounds of caviar from farmed white sturgeon (Acipenser transmontanus). Anal. Chim Acta. 2008, 617, 139–147. [Google Scholar] [CrossRef]
- Wirth, M.; Kirschbaum, F.; Gessner, J.; Krüger, A.; Patriche, N.; Billard, R. Chemical and biochemical composition of caviar from different sturgeon species and origins. Nahrung - Food. 2000, 44, 233–237. [Google Scholar] [CrossRef]
- Guidelines for the Sensory Evaluation of Fish and Shellfish in Laboratories; CAC-GL 31-1999; 1991; pp. 1–32.
- Josephson, D.B.; Lindsay, R.C. Enzymic Generation of Volatile Aroma Compounds from Fresh Fish. In Biogeneration of Aromas; ACS Publications: Washington, DC, USA, 1986; pp. 201–219. [Google Scholar] [CrossRef]
- Arthur, C.L.; Pawliszyn, J. Solid Phase Microextraction with Thermal Desorption Using Fused Silica Optical Fibers. Anal. Chem. 1990, 62, 2145–2148. [Google Scholar] [CrossRef]
- Zhang, Z.; Pawliszyn, J. Headspace Solid-Phase Microextraction. Anal. Chem. 1993, 65, 1843–1852. [Google Scholar] [CrossRef]
- Ouyang, G.; Pawliszyn, J. A critical review in calibration methods for solid-phase microextraction. Anal. Chim Acta. 2008, 627, 184–197. [Google Scholar] [CrossRef] [PubMed]
- García-Vico, L.; Belaj, A.; Sánchez-Ortiz, A.; Martínez-Rivas, J.M.; Pérez, A.G.; Sanz, C. Volatile Compound Profiling by HS-SPME/GC-MS-FID of a Core Olive Cultivar Collection as a Tool for Aroma Improvement of Virgin Olive Oil. Molecules 2017, 22, 2141. [Google Scholar] [CrossRef]
- Bueno, M.; Resconi, V.C.; Campo, M.M.; Ferreira, V.; Escudero, A. Development of a robust HS-SPME-GC-MS method for the analysis of solid food samples. Analysis of volatile compounds in fresh raw beef of differing lipid oxidation degrees. Food Chem. 2019, 281, 49–56. [Google Scholar] [CrossRef] [PubMed]
- Cordero, C.; Guglielmetti, A.; Sgorbini, B.; Bicchi, C.; Allegrucci, E.; Gobino, G.; Baroux, L.; Merle, P. Odorants quantitation in high-quality cocoa by multiple headspace solid phase micro-extraction: Adoption of FID-predicted response factors to extend method capabilities and information potential. Anal. Chim Acta. 2019, 1052, 190–201. [Google Scholar] [CrossRef]
- Costa, R.; Tedone, L.; De Grazia, S.; Dugo, P.; Mondello, L. Multiple headspace-solid-phase microextraction: An application to quantification of mushroom volatiles. Anal. Chim Acta. 2013, 770, 1–6. [Google Scholar] [CrossRef]
- Kolb, B. Multiple headspace extraction-A procedure for eliminating the influence of the sample matrix in quantitative headspace, gas chromatography. Chromatographia 1982, 15, 587–594. [Google Scholar] [CrossRef]
- Kolb, B.; Ettre, L.S. Static Headspace-Gas. In Chromatography. Theory and Practice, 2nd ed.; John Wiley & Sons, Inc.:: Hoboken, NJ, USA, 2006. [Google Scholar]
- Tena, M.T.; Carrillo, J.D. Multiple solid-phase microextraction: Theory and applications. TrAC - Trends Anal. Chem. 2007, 26, 206–214. [Google Scholar] [CrossRef]
- Serrano, E.; Beltrán, J.; Hernández, F. Application of multiple headspace-solid-phase microextraction followed by gas chromatography-mass spectrometry to quantitative analysis of tomato aroma components. J. Chromatogr A. 2009, 1216, 127–133. [Google Scholar] [CrossRef]
- Van Den Dool, H.; Kratz, P.D. A Generalization of the Retention Index System Including Linear Temperature Programmed Gas-Liquid Partition Chromatography. J. Chromatogr A. 1963, 11, 463–471. [Google Scholar] [CrossRef]
- Kovàts, E. Characterization of organic compounds by gas chromatography. Part 1. Retention indices of aliphatic halides, alcohols, aldehydes and ketones. 1958, 41, 1915–1932. [Google Scholar] [CrossRef]
- Duflos, G.; Coin, V.M.; Cornu, M.; Antinelli, J.F.; Malle, P. Determination of volatile compounds to characterize fish spoilage using headspace/mass spectrometry and solid-phase microextraction/gas chromatography/mass spectrometry. J. Sci Food Agric. 2006, 86, 600–611. [Google Scholar] [CrossRef]
- Iglesias, J.; Gallardo, J.M.; Medina, I. Determination of carbonyl compounds in fish species samples with solid-phase microextraction with on-fibre derivatization. Food Chem. 2010, 123, 771–778. [Google Scholar] [CrossRef]
- Prost, C.; Hallier, A.; Cardinal, M.; Serot, T.; Courcoux, P. Effect of Storage Time on Raw Sardine (Sardina pilchardus) Flavor and Aroma Quality. J. Food Sci. 2004, 69, S198–S204. [Google Scholar] [CrossRef]
- Aro, T.; Tahvonen, R.; Koskinen, L.; Kallio, H. Volatile compounds of Baltic herring analysed by dynamic headspace sampling-gas chromatography-mass spectrometry. Eur Food Res. Technol. 2003, 216, 483–488. [Google Scholar] [CrossRef]
- Milo, C.; Grosch, W. Changes in the Odorants of Boiled Trout (Salmo fario) As Affected by the Storage of the Raw Material. J. Agric. Food Chem. 1993, 41, 2076–2081. [Google Scholar] [CrossRef]
- Josephson, D.B.; Lindsay, R.C.; Stuiber, D.A. Biogenesis of lipid-derived volatile aroma compounds in the emerald shiner (Notropis atherinoides). J. Agric. Food Chem. 1984, 32, 1347–1352. [Google Scholar] [CrossRef]
- Iglesias, J.; Medina, I.; Bianchi, F.; Careri, M.; Mangia, A.; Musci, M. Study of the volatile compounds useful for the characterisation of fresh and frozen-thawed cultured gilthead sea bream fish by solid-phase microextraction gas chromatography-mass spectrometry. Food Chem. 2009, 115, 1473–1478. [Google Scholar] [CrossRef]
- Moretti, V.M.; Vasconi, M.; Caprino, F.; Bellagamba, F. Fatty Acid Profiles and Volatile Compounds Formation During Processing and Ripening of a Traditional Salted Dry Fish Product. J. Food Process. Preserv. 2017, 41. [Google Scholar] [CrossRef]
- Ólafsdóttir, G. Volatile Compounds As Quality Indicators In Chilled Fish: Evaluation Of Microbial Metabolites By An Electronic Nose. Ph.D. Thesis, University of Iceland, Reykjavík, Iceland, 2005. [Google Scholar]
- Frankel, E.N. Foods. In Lipid Oxidation, 2nd ed.; The Oily Press: Bridgwater, UK, 2005; pp. 299–354. [Google Scholar]
- Grosh, W. Lipid degradation products and flavours. In Food Flavours. Part A- Introduction; Morton, I.D., MacLeod, A.J., Eds.; Elsevier Science Ltd.: Amsterdam, The Netherlands, 1982; p. 325. [Google Scholar]
- Josephson, D.B.; Lindsay, R.C.; Stuiber, D.A. Identification of Compounds Characterizing the Aroma of Fresh Whitefish (Coregonus clupeaformis). J. Agric. Food Chem. 1983, 31, 326–330. [Google Scholar] [CrossRef]
- Karahadian, C.; Lindsay, R.C. Evaluation of compounds contributing characterizing fishy flavors in fish oils. J. Am. Oil Chem Soc. 1989, 66, 953–960. [Google Scholar] [CrossRef]
- Lindsay, R.C. Fish flavors. Food Rev. Int. 1990, 6, 437–455. [Google Scholar] [CrossRef]
- Kawai, T.; Sakaguchi, M. Fish flavor. Crit Rev. Food Sci Nutr. 1996, 36, 257–298. [Google Scholar] [CrossRef] [PubMed]
- Jónsdóttir, R.; Ólafsdóttir, G.; Chanie, E.; Haugen, J.E. Volatile compounds suitable for rapid detection as quality indicators of cold smoked salmon (Salmo salar). Food Chem. 2008, 109, 184–195. [Google Scholar] [CrossRef]
- Lopez, A.; Vasconi, M.; Bellagamba, F.; Mentasti, T.; Moretti, V.M.M. Sturgeon meat and caviar quality from different cultured species. Fishes 2020, 5, 9. [Google Scholar] [CrossRef]
- Joffraud, J.J.; Leroi, F.; Roy, C.; Berdagué, J.L. Characterisation of volatile compounds produced by bacteria isolated from the spoilage flora of cold-smoked salmon. Int J. Food Microbiol. 2001, 66, 175–184. [Google Scholar] [CrossRef]
- Balasubramanian, S.; Panigrahi, S. Solid-Phase Microextraction (SPME) Techniques for Quality Characterization of Food Products: A Review. Food Bioprocess. Technol. 2011, 4, 1–26. [Google Scholar] [CrossRef]
- Jørgensen, L.V.; Huss, H.H.; Dalgaard, P. Significance of volatile compounds produced by spoilage bacteria in vacuum-packed cold-smoked salmon (Salmo salar) analyzed by GC-MS and multivariate regression. J. Agric. Food Chem. 2001, 49, 2376–2381. [Google Scholar] [CrossRef]
- Ardö, Y. Flavour formation by amino acid catabolism. Biotechnol Adv. 2006, 24, 238–242. [Google Scholar] [CrossRef] [PubMed]
- Giri, A.; Osako, K.; Okamoto, A.; Ohshima, T. Olfactometric characterization of aroma active compounds in fermented fish paste in comparison with fish sauce, fermented soy paste and sauce products. Food Res. Int. 2010, 43, 1027–1040. [Google Scholar] [CrossRef]
- Ólafsdóttir, G.; Jónsdóttir, R. Volatile Aroma Compounds in Fish. In Handbook fo Seafood and Seafood Products Analysis; Nollet, L.L.M., Toldrà, F., Eds.; Taylor and Francis Group, LLC: Abingdon, FL, USA.
- Pripi-Nicolau, L.; De Revel, G.; Bertrand, A.; Maujean, A. Formation of flavor components by the reaction of amino acid and carbonyl compounds in mild conditions. J. Agric. Food Chem. 2000, 48, 3761–3766. [Google Scholar] [CrossRef]
- Milo, C.; Grosch, W. Detection of Odor Defects in Boiled Cod and Trout by Gas Chromatography–Olfactometry of Headspace Samples. J. Agric. Food Chem. 1995, 43, 459–462. [Google Scholar] [CrossRef]
- Weenen, H.; Van Der Ven, J.G.M. The formation of strecker aldehydes. ACS Symp Ser. 2001, 794, 183–195. [Google Scholar] [CrossRef]
- Belitz, H.D.; Grosch, W.; Schieberle, P. Food Chemistry. Springer-Verlag: Berlin, Germany, 2009. [Google Scholar] [CrossRef]
- Yaylayan, V.A. Recent Advances in the Chemistry of Strecker Degradation and Amadori Rearrangement: Implications to Aroma and Color Formation. Nippon Shokuhin Kagaku Kogaku Kaishi 2003, 50, 372–377. [Google Scholar] [CrossRef]
- Aro, T.; Brede, C.; Manninen, P.; Kallio, H. Determination of semivolatile compounds in Baltic herring (Clupea harengus membras) by supercritical fluid extraction-supercritical fluid chromatography-gas chromatography-mass spectrometry. J. Agric. Food Chem. 2002, 50, 1970–1975. [Google Scholar] [CrossRef] [PubMed]
- Selli, S.; Cayhan, G.G. Analysis of volatile compounds of wild gilthead sea bream (Sparus aurata) by simultaneous distillation-extraction (SDE) and GC-MS. Microchem J. 2009, 93, 232–235. [Google Scholar] [CrossRef]
- Selli, S.; Rannou, C.; Prost, C.; Robin, J.; Serot, T. Characterization of aroma-active compounds in rainbow trout (I) eliciting an off-odor. J. Agric. Food Chem. 2006, 54, 9496–9502. [Google Scholar] [CrossRef]
- Tanchotikul, U.; Hsieh, T.C.Y. Volatile Flavor Components in Crayfish Waste. J. Food Sci. 1989, 54, 1515–1520. [Google Scholar] [CrossRef]
- Tanchotikul, U.; Hsieh, T.C.Y. Analysis of Volatile Flavor Components in Steamed Rangia Clam by Dynamic Headspace Sampling and Simultaneous Distillation and Extraction. J. Food Sci. 1991, 56, 327–331. [Google Scholar] [CrossRef]
- Alasalvar, C.; Taylor, K.D.A.; Shahidi, F. Comparison of volatiles of cultured and wild sea bream (Sparus aurata) during storage in ice by dynamic headspace analysis/gas chromatography-mass spectrometry. J. Agric. Food Chem 2005, 53, 2616–2622. [Google Scholar] [CrossRef]
- Hsieh, R.J.; Kinsella, J.E. Lipoxygenase Generation of Specific Volatile Flavor Carbonyl Compounds in Fish Tissues. J. Agric. Food Chem. 1989, 37, 279–286. [Google Scholar] [CrossRef]
- Spurvey, S.; Pan, B.S.; Shahidi, F. Flavour of shellfish. In Flavor of Meat, Meat Products and Seafoods; Shahidi, F., Ed.; Springer US: New York, NY, USA, 1998; pp. 159–196. [Google Scholar]
- Vejapham, W.; Hsieh, T.C.Y.; Williams, S.S. Volatile Flavor Components from Boiled Crayfish (Procambarus clarkii) Tail Meat. J. Food Sci. 1988, 53, 1666–1670. [Google Scholar] [CrossRef]
- Miller, A.; Scanlan, R.A.; Lee, J.S.; Libbey, L.M.; Morgan, M.E. Volatile compounds produced in sterile fish muscle (Sebastes melanops) by Pseudomonas perolens. Appl Microbiol. 1973, 25, 257–261. [Google Scholar] [CrossRef] [PubMed]
- Nordvi, B.; Langsrud, O.; Egelandsdal, B.; Slinde, E.; Vogt, G.; Gutierrez, M.; Olsen, E. Characterization of volatile compounds in a fermented and dried fish product during cold storage. J. Food Sci. 2007, 72. [Google Scholar] [CrossRef] [PubMed]
- Olafsdottir, G.; Jonsdottir, R.; Lauzon, H.L.; Luten, J.; Kristbergsson, K. Characterization of volatile compounds in chilled cod (Gadus morhua) fillets by gas chromatography and detection of quality indicators by an electronic nose. J. Agric. Food Chem. 2005, 53, 10140–10147. [Google Scholar] [CrossRef] [PubMed]
- Laursen, B.G.; Leisner, J.J.; Dalgaard, P. Carnobacterium Species: Effect of metabolic activity and interaction with Brochothrix thermosphacta on sensory characteristics of modified atmosphere packed shrimp. J. Agric. Food Chem. 2006, 54, 3604–3611. [Google Scholar] [CrossRef]
- Fall, P.A.; Leroi, F.; Cardinal, M.; Chevalier, F.; Pilet, M.F. Inhibition of Brochothrix thermosphacta and sensory improvement of tropical peeled cooked shrimp by Lactococcus piscium CNCM I-4031. Lett. Appl. Microbiol. 2010, 50, 357–361. [Google Scholar] [CrossRef]
- Edirisinghe, R.K.B.; Graffham, A.J.; Taylor, S.J. Characterisation of the volatiles of yellowfin tuna (Thunnus albacares) during storage by solid phase microextraction and GC-MS and their relationship to fish quality parameters. Int J. Food Sci Technol. 2007, 42, 1139–1147. [Google Scholar] [CrossRef]
- Iglesias, J.; Medina, I. Solid-phase microextraction method for the determination of volatile compounds associated to oxidation of fish muscle. J. Chromatogr A. 2008, 1192, 9–16. [Google Scholar] [CrossRef]
- Zhang, Z.; Li, G.; Luo, L.; Chen, G. Study on seafood volatile profile characteristics during storage and its potential use for freshness evaluation by headspace solid phase microextraction coupled with gas chromatography-mass spectrometry. Anal. Chim Acta. 2010, 659, 151–158. [Google Scholar] [CrossRef]
- Turchini, G.M.; Giani, I.; Caprino, F.; Moretti, V.M.; Valfrè, F. Discrimination of origin of farmed trout by means of biometrical parameters, fillet composition and flavor volatile compounds. Ital. J. Anim Sci. 2004, 3, 123–140. [Google Scholar] [CrossRef]
- Olafsdottir, G.; Nesvadba, P.; Di Natale, C.; Careche, M.; Oehlenschläger, J.; Tryggvadóttir, S.V.; Schubring, R.; Kroeger, M.; Heia, K.; Esaiassen, M.; et al. Multisensor for fish quality determination. Trends Food Sci Technol. 2003, 15, 86–93. [Google Scholar] [CrossRef]
- Le Pape, M.-A.; Grua-Priol, J.; Prost, C.; Demaimay, M. Optimization of Dynamic Headspace Extraction of the Edible Red Algae Palmaria palmata and Identification of the Volatile Components. J. Agric. Food Chem 2007, 52, 550–556. [Google Scholar] [CrossRef] [PubMed]
Sample Availability: Not available. |


| Target Family | Target Compound | β | Studied Range (ng) | m | q | R2 | LOD(ng) |
|---|---|---|---|---|---|---|---|
| Aldehydes | nonanal | 0.67463 | 1–50 | 286363 | −1 × 10⁶ | 0.9834 | 0.71 |
| Alcohols | oct-1-en-3-ol | 0.74021 | 1–50 | 422066 | −2 × 10⁶ | 0.9773 | 0.91 |
| Acids | nonanoic acid | 0.44139 | 1–50 | 84741 | 572724 | 0.8744 | 1.92 |
| Terpenes and hydrocarbons | α-Pinene | 0.49902 | 1–50 | 910076 | −2 × 10⁶ | 0.9903 | 0.17 |
| Ketones | heptan-2-one | 0.67552 | 1–50 | 490916 | −1 × 10⁶ | 0.991 | 0.46 |
| Esters | ethyl decanoate | 0.3256 | 1–50 | 636175 | −2 × 10⁶ | 0.9843 | 1.02 |
| Volatile Compounds | Retention Time (min) | Mean of Identification 1 | LRI | t0 Raw Eggs | t1 Caviar 60 Days | t2 Caviar 120 Days | t3 Caviar 180 Days | t4 Caviar 240 Days | Sign | |
|---|---|---|---|---|---|---|---|---|---|---|
| n = 4 | n = 4 | n = 4 | n = 2 | n = 4 | ||||||
| Aldehydes | ||||||||||
| 1 | 3-methylbutanal | 3.196 | MS, STD, LRI | 655 | 3.48 ± 1.96 A | 8.84 ± 5.88 A | 9.07 ± 3.74 A | 10.10 ± 1.73 A | 29.66 ± 7.33 B | ** |
| 2 | 2-methylbutanal | 3.345 | MS, LRI | 664 | nd | 2.58 ± 1.20 A | 3.20 ± 1.46 A | 3.48 ± 0.51 A | 11.09 ± 2.76 B | ** |
| 3 | hexanal | 7.449 | MS, STD, LRI | 801 | 6.70 ± 3.63 A | 8.87 ± 2.86 A | 7.77 ± 6.49 A | 9.93 ± 1.46 A | 19.31 ± 12.64 B | ** |
| 4 | (E)-hex-2-enal | 9.541 | MS, STD, LRI | 854 | nd | nd | nd | 0.59 ± 0.52 A | 1.36 ± 0.76 B | ** |
| 5 | 3-methylsulfanylpropanal | 11.611 | MS, LRI | 905 | nd | 1.49 ± 1.07 A | 1.72 ± 0.62 A | 2.29 ± 0.22 A | 7.66 ± 3.25 B | ** |
| 6 | benzaldehyde | 13.642 | MS, STD, LRI | 960 | 2.06 ± 0.82 A | 1.60 ± 0.49 A | 1.27 ± 0.24 A | 2.19 ± 0.07 A | 4.57 ± 0.97 B | ** |
| 7 | octanal | 15.226 | MS, STD, LRI | 1003 | 2.48 ± 1.07 A | 1.26 ± 0.31 BC | 1.03 ± 0.21 B | 1.11 ± 0.08 BC | 1.64 ± 0.22 C | ** |
| 8 | (2E,4E)-hepta-2,4-dienal | 15.481 | MS, STD, LRI | 1010 | nd | nd | nd | nd | 0.75 ± 0.85 | |
| 9 | 2-phenylacetaldehyde | 16.566 | MS, LRI | 1042 | 2.01 ± 0.97 A | 7.92 ± 5.21 A | 7.80 ± 3.33 A | 11.46 ± 0.67 A | 38.29 ± 14.96 B | ** |
| 10 | (E)-oct-2-enal | 17.082 | MS, LRI | 1058 | nd | nd | nd | nd | 0.97 ± 1.06 | |
| 11 | nonanal | 18.630 | MS, STD, LRI | 1104 | 11.64 ± 7.00 A | 3.24 ± 1.22 BC | 3.88 ± 0.85 B | 4.85 ± 0.67 BC | 5.98 ± 1.22 B | ** |
| 12 | decanal | 21.755 | MS, STD, LRI | 1205 | 1.28 ± 0.39 A | 0.96 ± 0.22 AB | 1.01 ± 0.12 AB | 1.21 ± 0.22 AB | 0.68 ± 0.54 B | * |
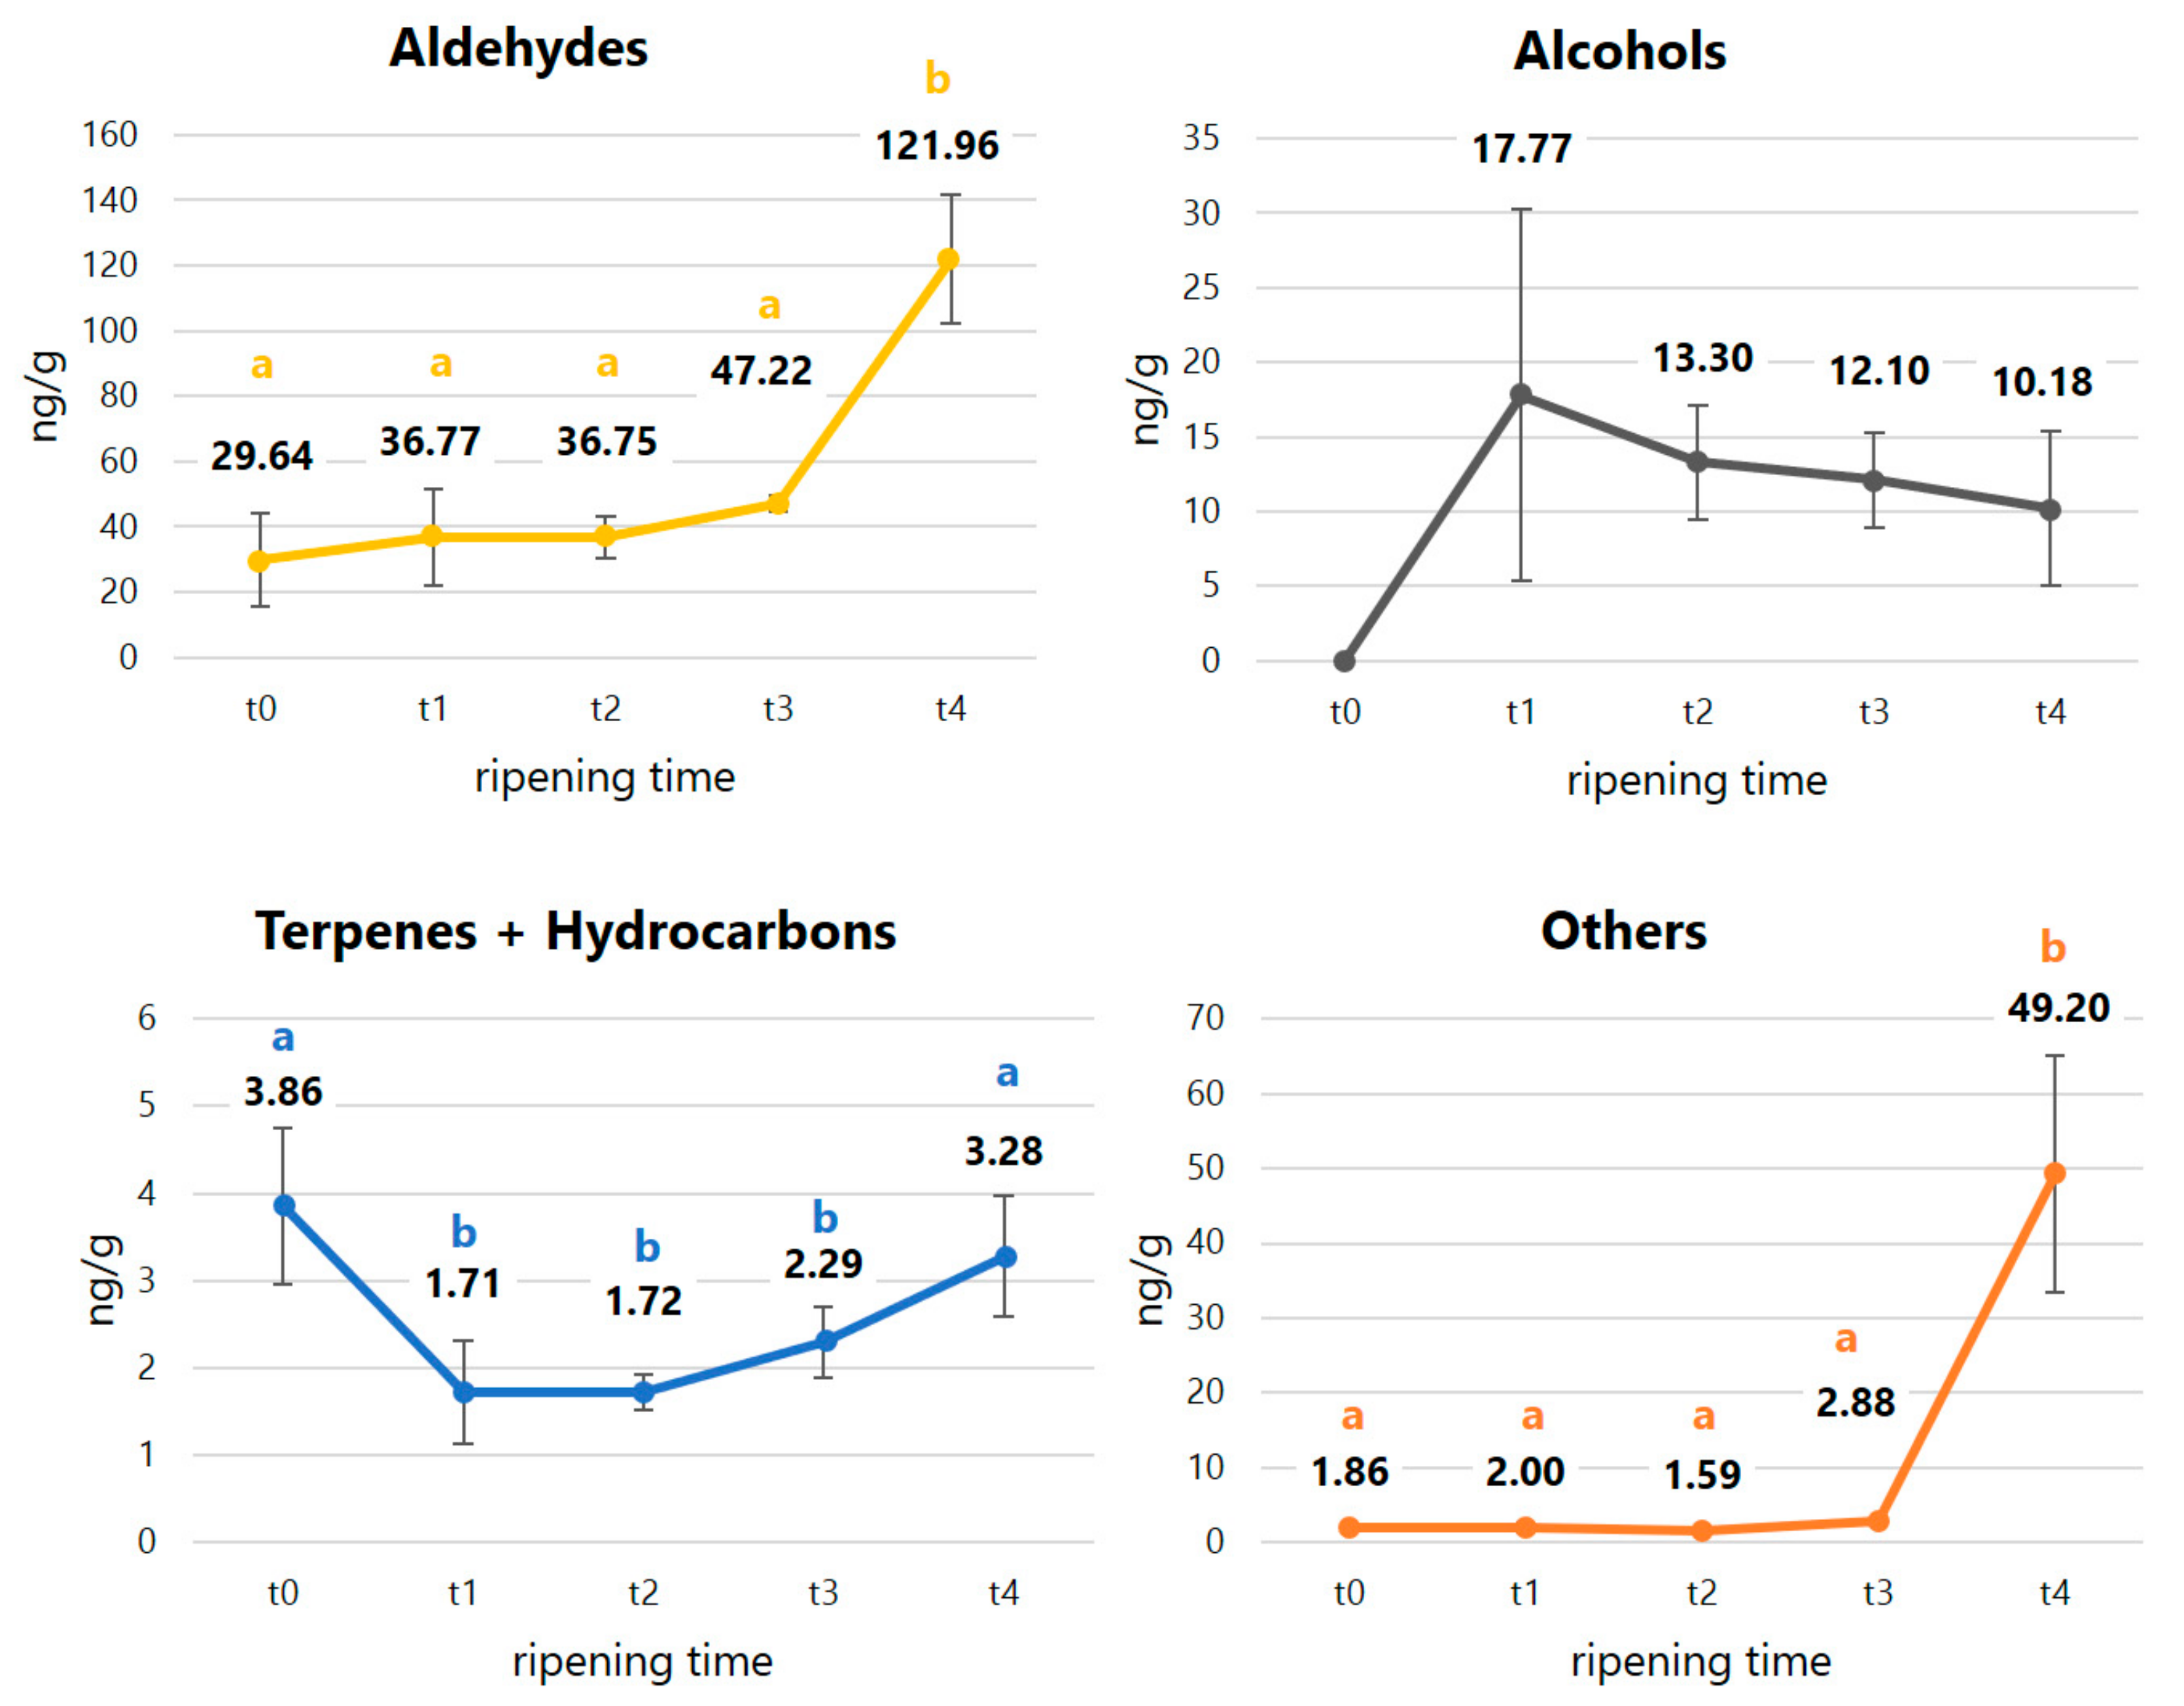
| ∑aldehydes | 29.64 ± 14.31 A | 36.77 ± 14.97 A | 36.75 ± 6.54 A | 47.22 ± 2.53 A | 121.96 ± 19.80 B | ** | ||||
| Alcohols | ||||||||||
| 13 | pent-1-en-3-ol | 3.675 | MS, LRI | 682 | nd | 2.00 ± 0.52 | 1.96 ± 0.51 | 2.23 ± 0.29 | 2.91 ± 2.56 | |
| 14 | 3-methylbutan-1-ol | 5.126 | MS, STD, LRI | 734 | nd | nd | nd | nd | 4.95 ± 6.32 | |
| 15 | oct-1-en-3-ol | 14.423 | MS, STD, LRI | 981 | nd | 2.07 ± 0.68 | 1.52 ± 0.70 | 1.46 ± 0.07 | 1.35 ± 1.50 | |
| 16 | 2-ethylhexan-1-ol | 16.088 | MS, LRI | 1028 | nd | 13.70 ± 11.93 | 9.82 ± 3.84 | 8.41 ± 2.92 | nd | |
| ∑alcohols | nd | 17.77 ± 12.45 | 13.30 ± 3.82 | 12.10 ± 3.21 | 9.22 ± 5.56 | |||||
| Terpenes and hydrocarbons | ||||||||||
| 17 | α-pinene | 12.606 | MS, STD, LRI | 932 | 0.95 ± 0.44 | 0.97 ± 0.50 | 0.73 ± 0.14 | 0.66 ± 0.04 | 1.11 ± 0.40 | |
| 18 | 3-carene | 15.374 | MS, STD, LRI | 1007 | nd | nd | 0.44 ± 0.18 | 0.57 ± 0.03 | 0.36 ± 0.28 | |
| 19 | 1,2,3-trimethylbenzene | 15.760 | MS, STD, LRI | 1018 | 0.66 ± 0.11 A | 0.13 ± 0.23 B | nd | 0.35 ± 0.31 a | nd | ** |
| 20 | limonene | 16.103 | MS, STD, LRI | 1029 | 0.63 ± 0.05 | nd | nd | nd | 0.60 ± 0.03 | |
| 21 | β-ocimene | 16.700 | MS, STD, LRI | 1047 | 0.44 ± 0.30 | nd | nd | nd | nd | |
| 22 | caryophyllene | 27.741 | MS, STD, LRI | 1423 | 0.14 ± 0.27 | nd | nd | nd | nd | |
| 23 | pristane | 32.902 | MS, LRI | 1704 | 1.04 ± 0.43 AC | 0.62 ± 0.06 B | 0.56 ± 0.05 B | 0.71 ± 0.03 AB | 1.20 ± 0.22 C | ** |
| ∑terpenes and hydrocarbons | 3.86 ± 0.90 A | 1.71 ± 0.59 B | 1.72 ± 0.20 B | 2.29 ± 0.41 B | 3.28 ± 0.69 A | ** | ||||
| Other compounds | ||||||||||
| 24 | 2-butanone, 3-hydroxy | 4.797 | MS, LRI | 724 | nd | nd | nd | nd | 48.17 ± 16.87 | |
| 25 | nonanoic acid | 23.424 | MS, STD, LRI | 1263 | 1.86 ± 0.33 | 2.00 ± 0.60 | 1.59 ± 0.13 | 2.88 ± 0.12 | 1.03 ± 1.65 | |
| ∑other compounds | 1.86 ± 0.33 A | 2.00 ± 0.60 A | 1.59 ± 0.13 A | 2.88 ± 0.12 A | 49.20 ± 15.81 B | ** |
© 2020 by the authors. Licensee MDPI, Basel, Switzerland. This article is an open access article distributed under the terms and conditions of the Creative Commons Attribution (CC BY) license (http://creativecommons.org/licenses/by/4.0/).
Share and Cite
Lopez, A.; Vasconi, M.; Bellagamba, F.; Mentasti, T.; Pazzaglia, M.; Moretti, V.M. Volatile Organic Compounds Profile in White Sturgeon (Acipenser transmontanus) Caviar at Different Stages of Ripening by Multiple Headspace Solid Phase Microextraction. Molecules 2020, 25, 1074. https://doi.org/10.3390/molecules25051074
Lopez A, Vasconi M, Bellagamba F, Mentasti T, Pazzaglia M, Moretti VM. Volatile Organic Compounds Profile in White Sturgeon (Acipenser transmontanus) Caviar at Different Stages of Ripening by Multiple Headspace Solid Phase Microextraction. Molecules. 2020; 25(5):1074. https://doi.org/10.3390/molecules25051074
Chicago/Turabian StyleLopez, Annalaura, Mauro Vasconi, Federica Bellagamba, Tiziana Mentasti, Mario Pazzaglia, and Vittorio Maria Moretti. 2020. "Volatile Organic Compounds Profile in White Sturgeon (Acipenser transmontanus) Caviar at Different Stages of Ripening by Multiple Headspace Solid Phase Microextraction" Molecules 25, no. 5: 1074. https://doi.org/10.3390/molecules25051074
APA StyleLopez, A., Vasconi, M., Bellagamba, F., Mentasti, T., Pazzaglia, M., & Moretti, V. M. (2020). Volatile Organic Compounds Profile in White Sturgeon (Acipenser transmontanus) Caviar at Different Stages of Ripening by Multiple Headspace Solid Phase Microextraction. Molecules, 25(5), 1074. https://doi.org/10.3390/molecules25051074