
Production of Methane, Hydrogen and Ethanol from Secale cereale L. Straw Pretreated with Sulfuric Acid

 ,
,  ,
,  , ,
, ,  , and
, and
Abstract
1. Introduction
2. Results and Discussion
2.1. Products of Secale cereale L. Straw Pretreatment
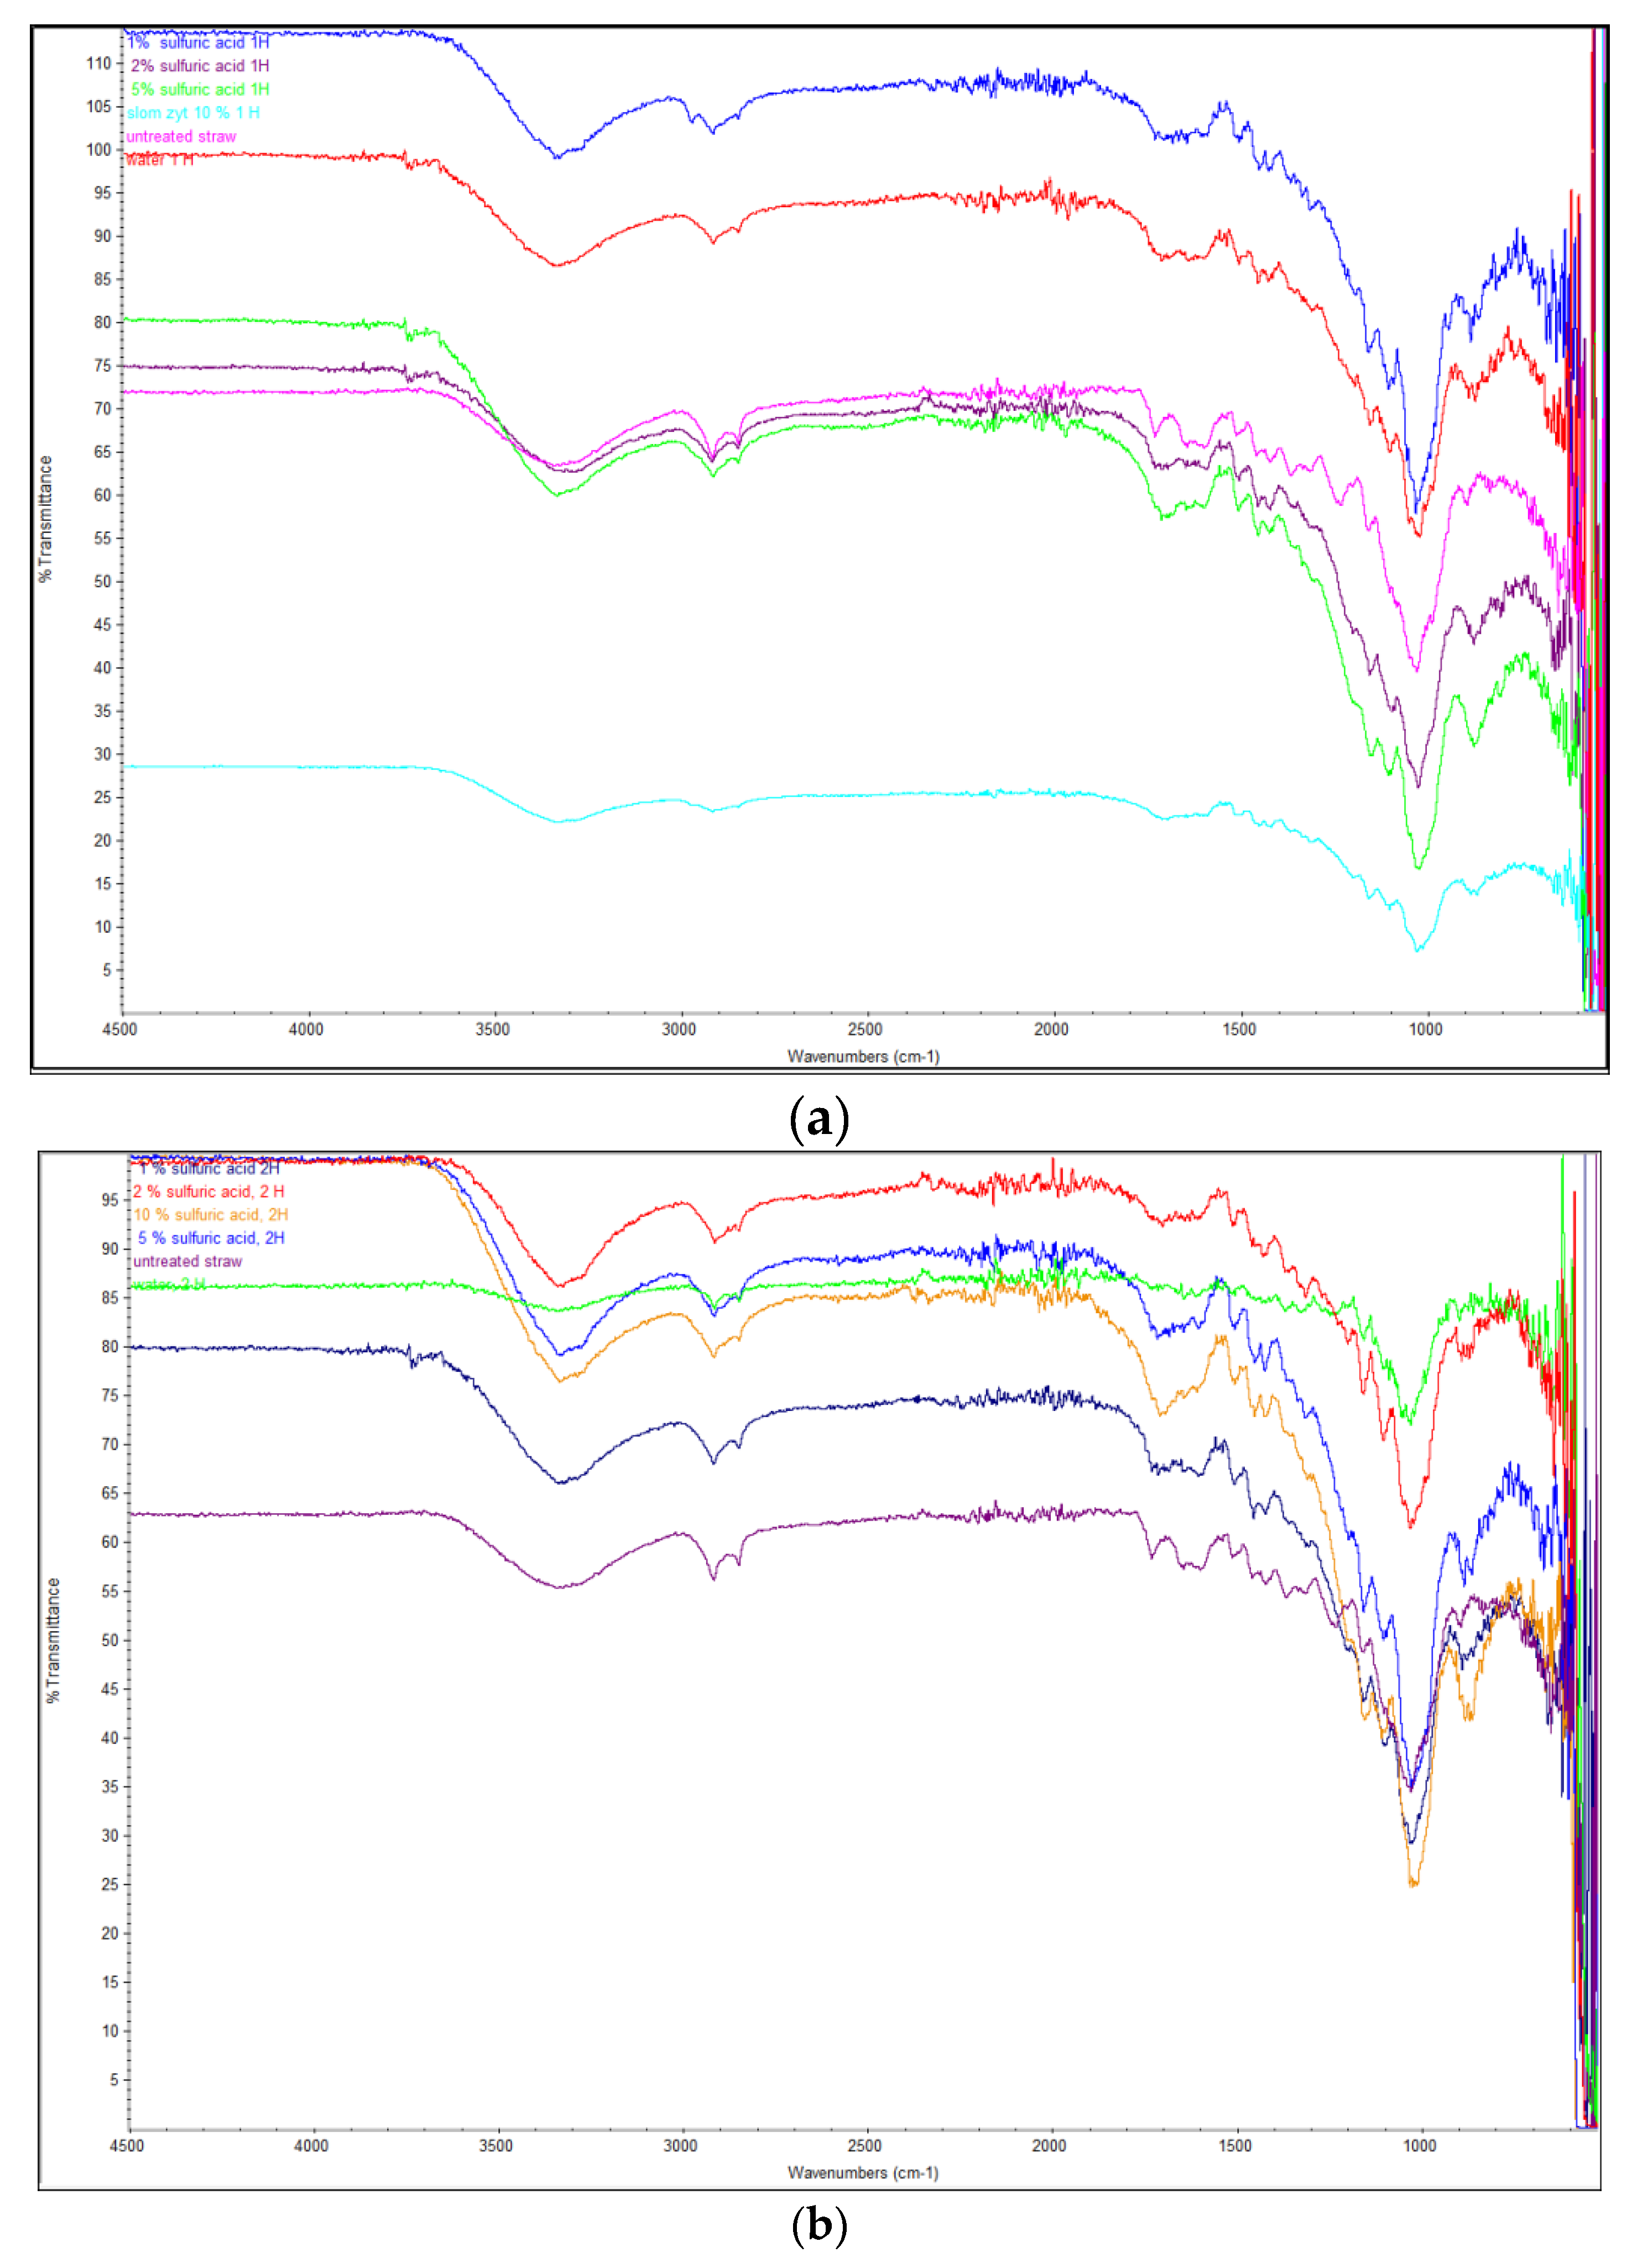
2.2. FTIR Analysis of rye Straw Before and After Chemical Hydrolysis
2.3. XRD Analysis
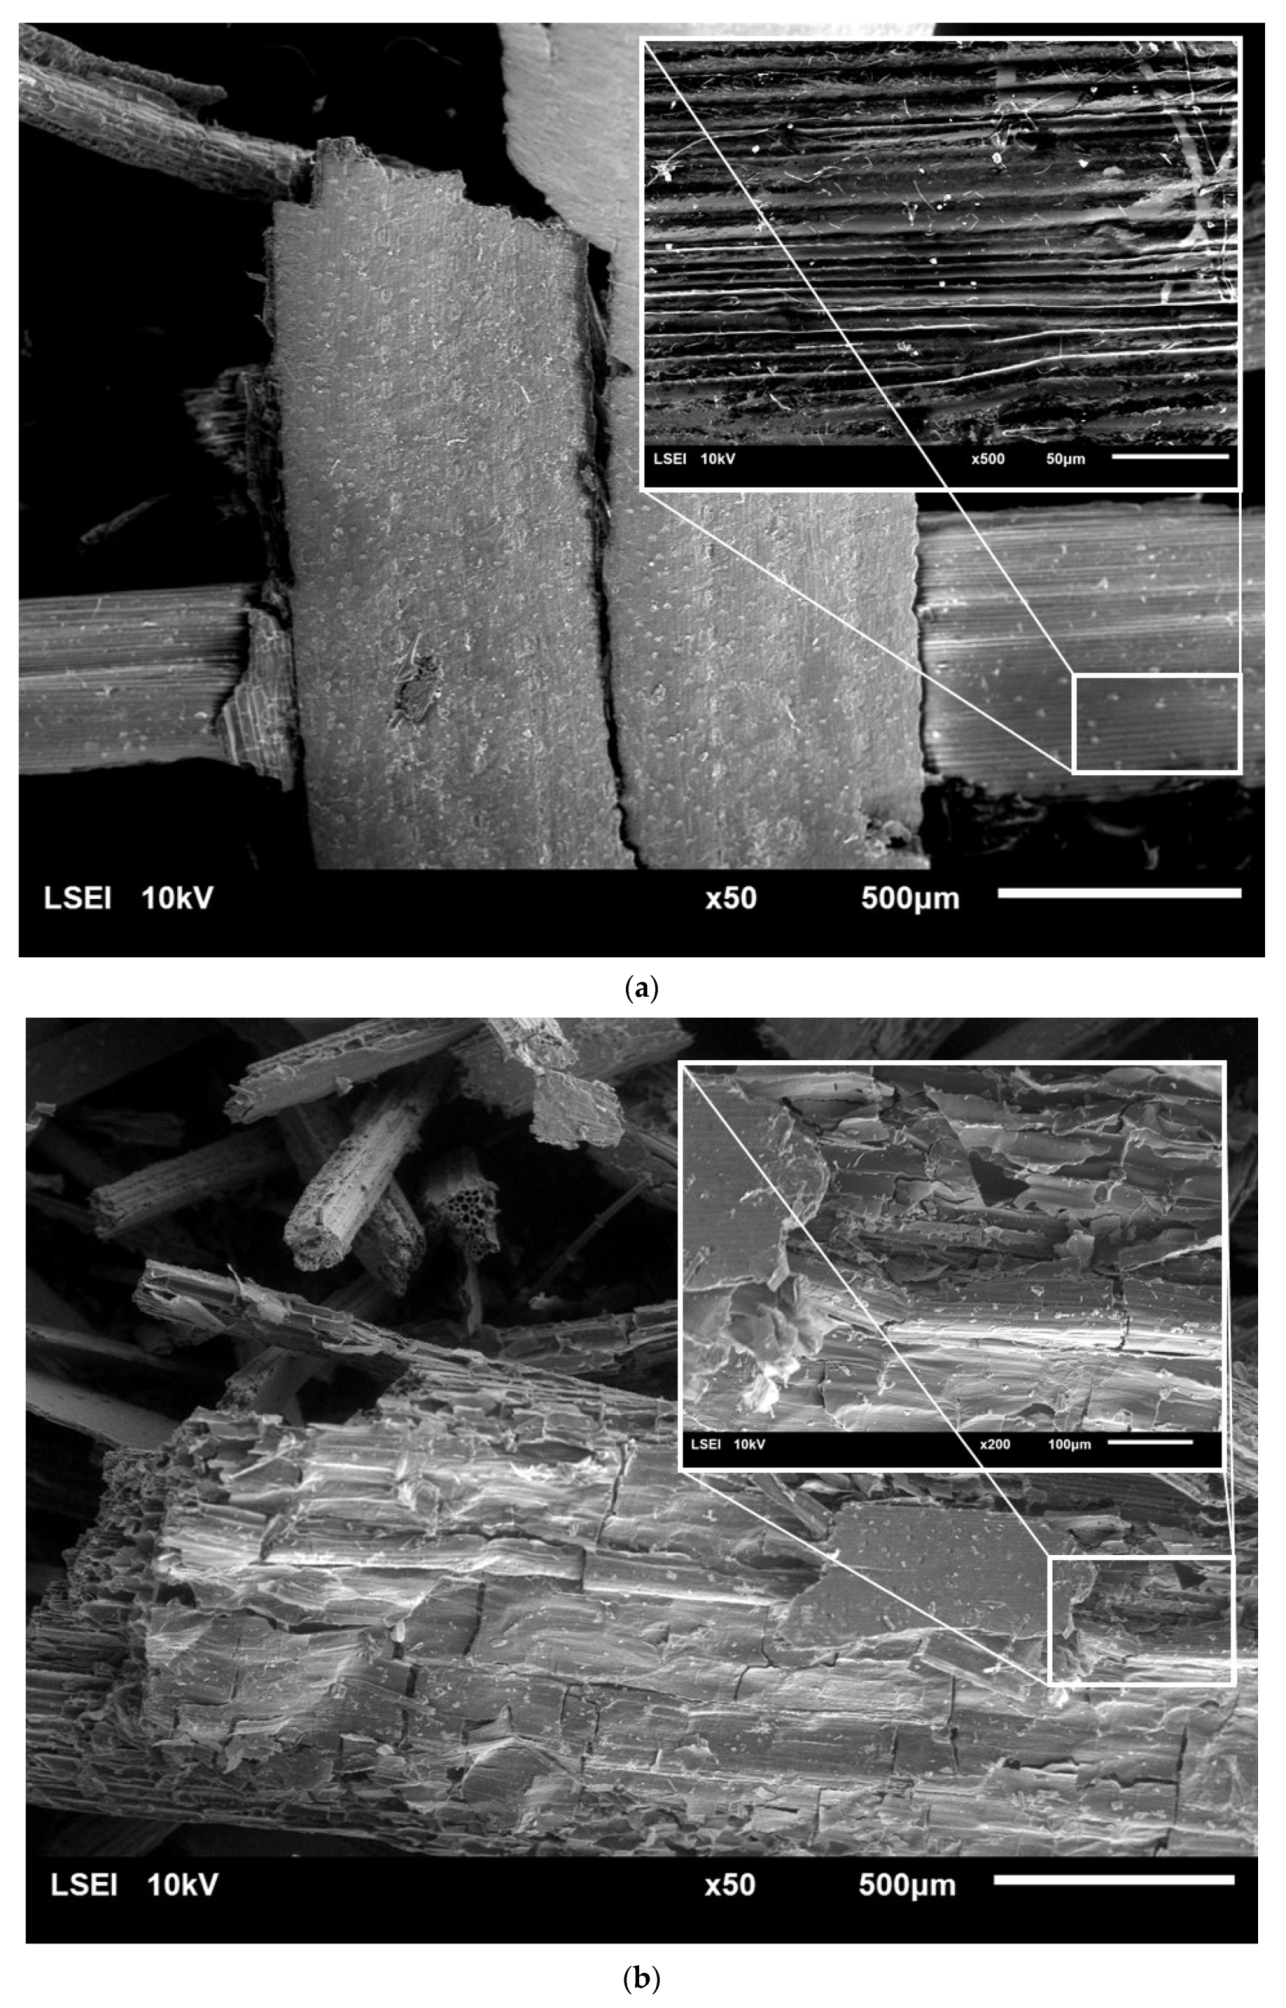
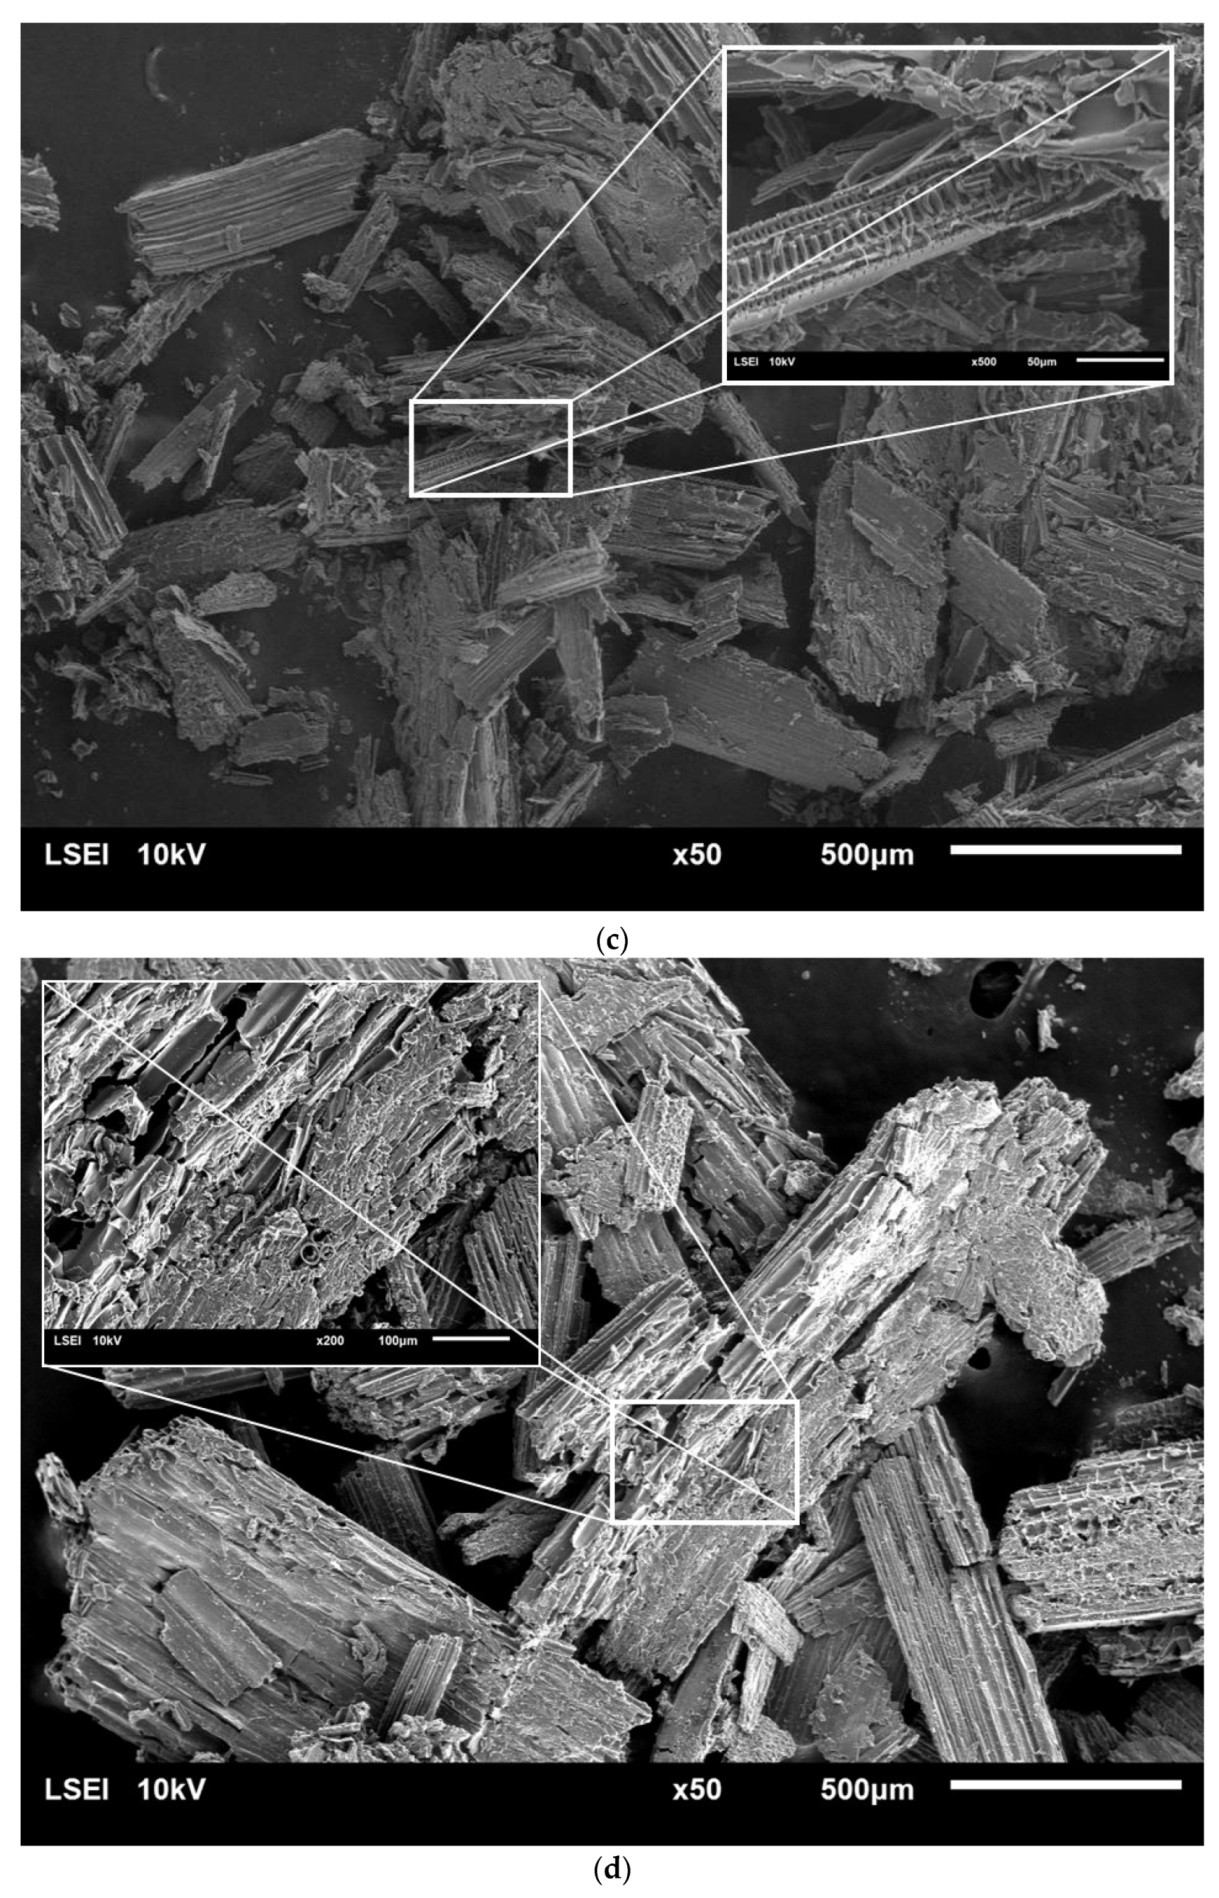
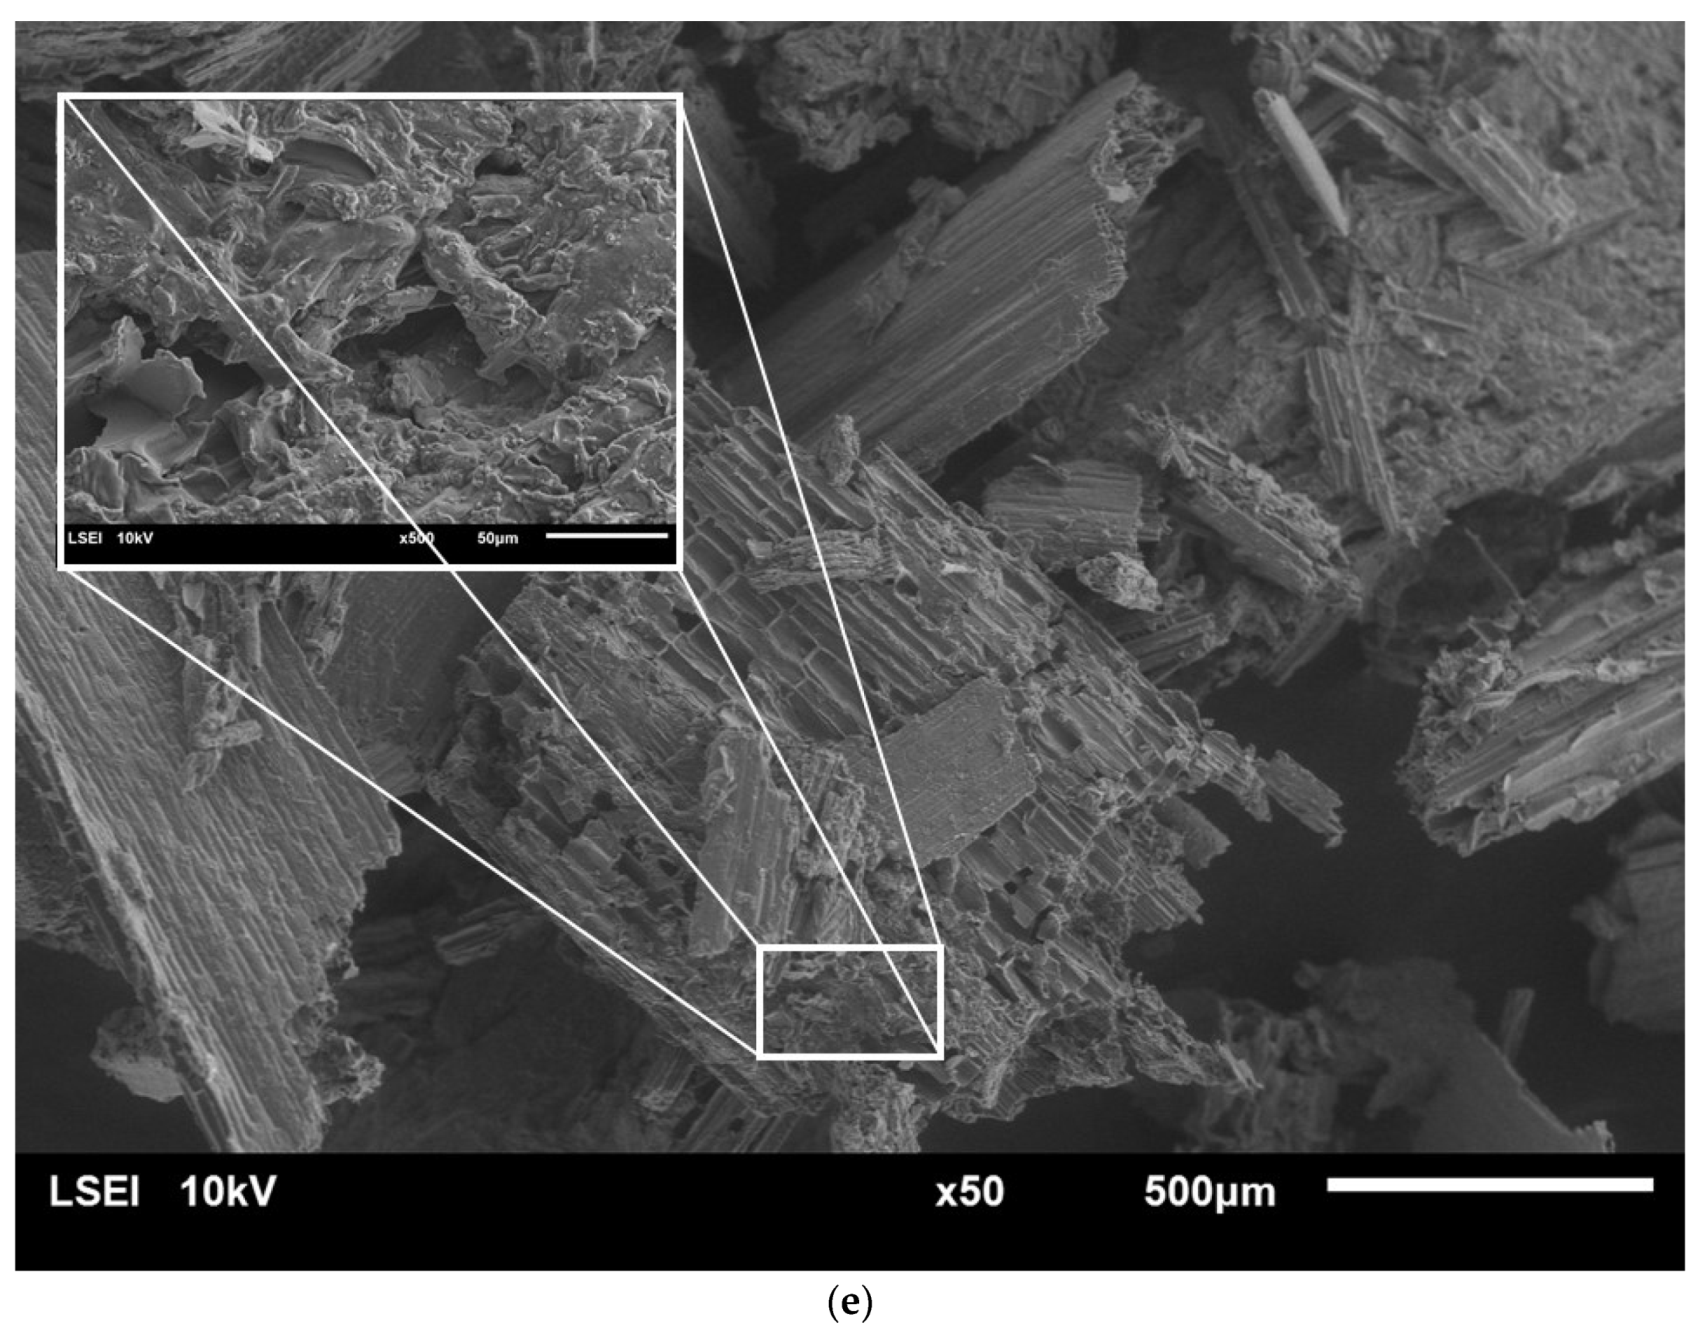
2.4. SEM Analysis
2.5. Ethanol Production
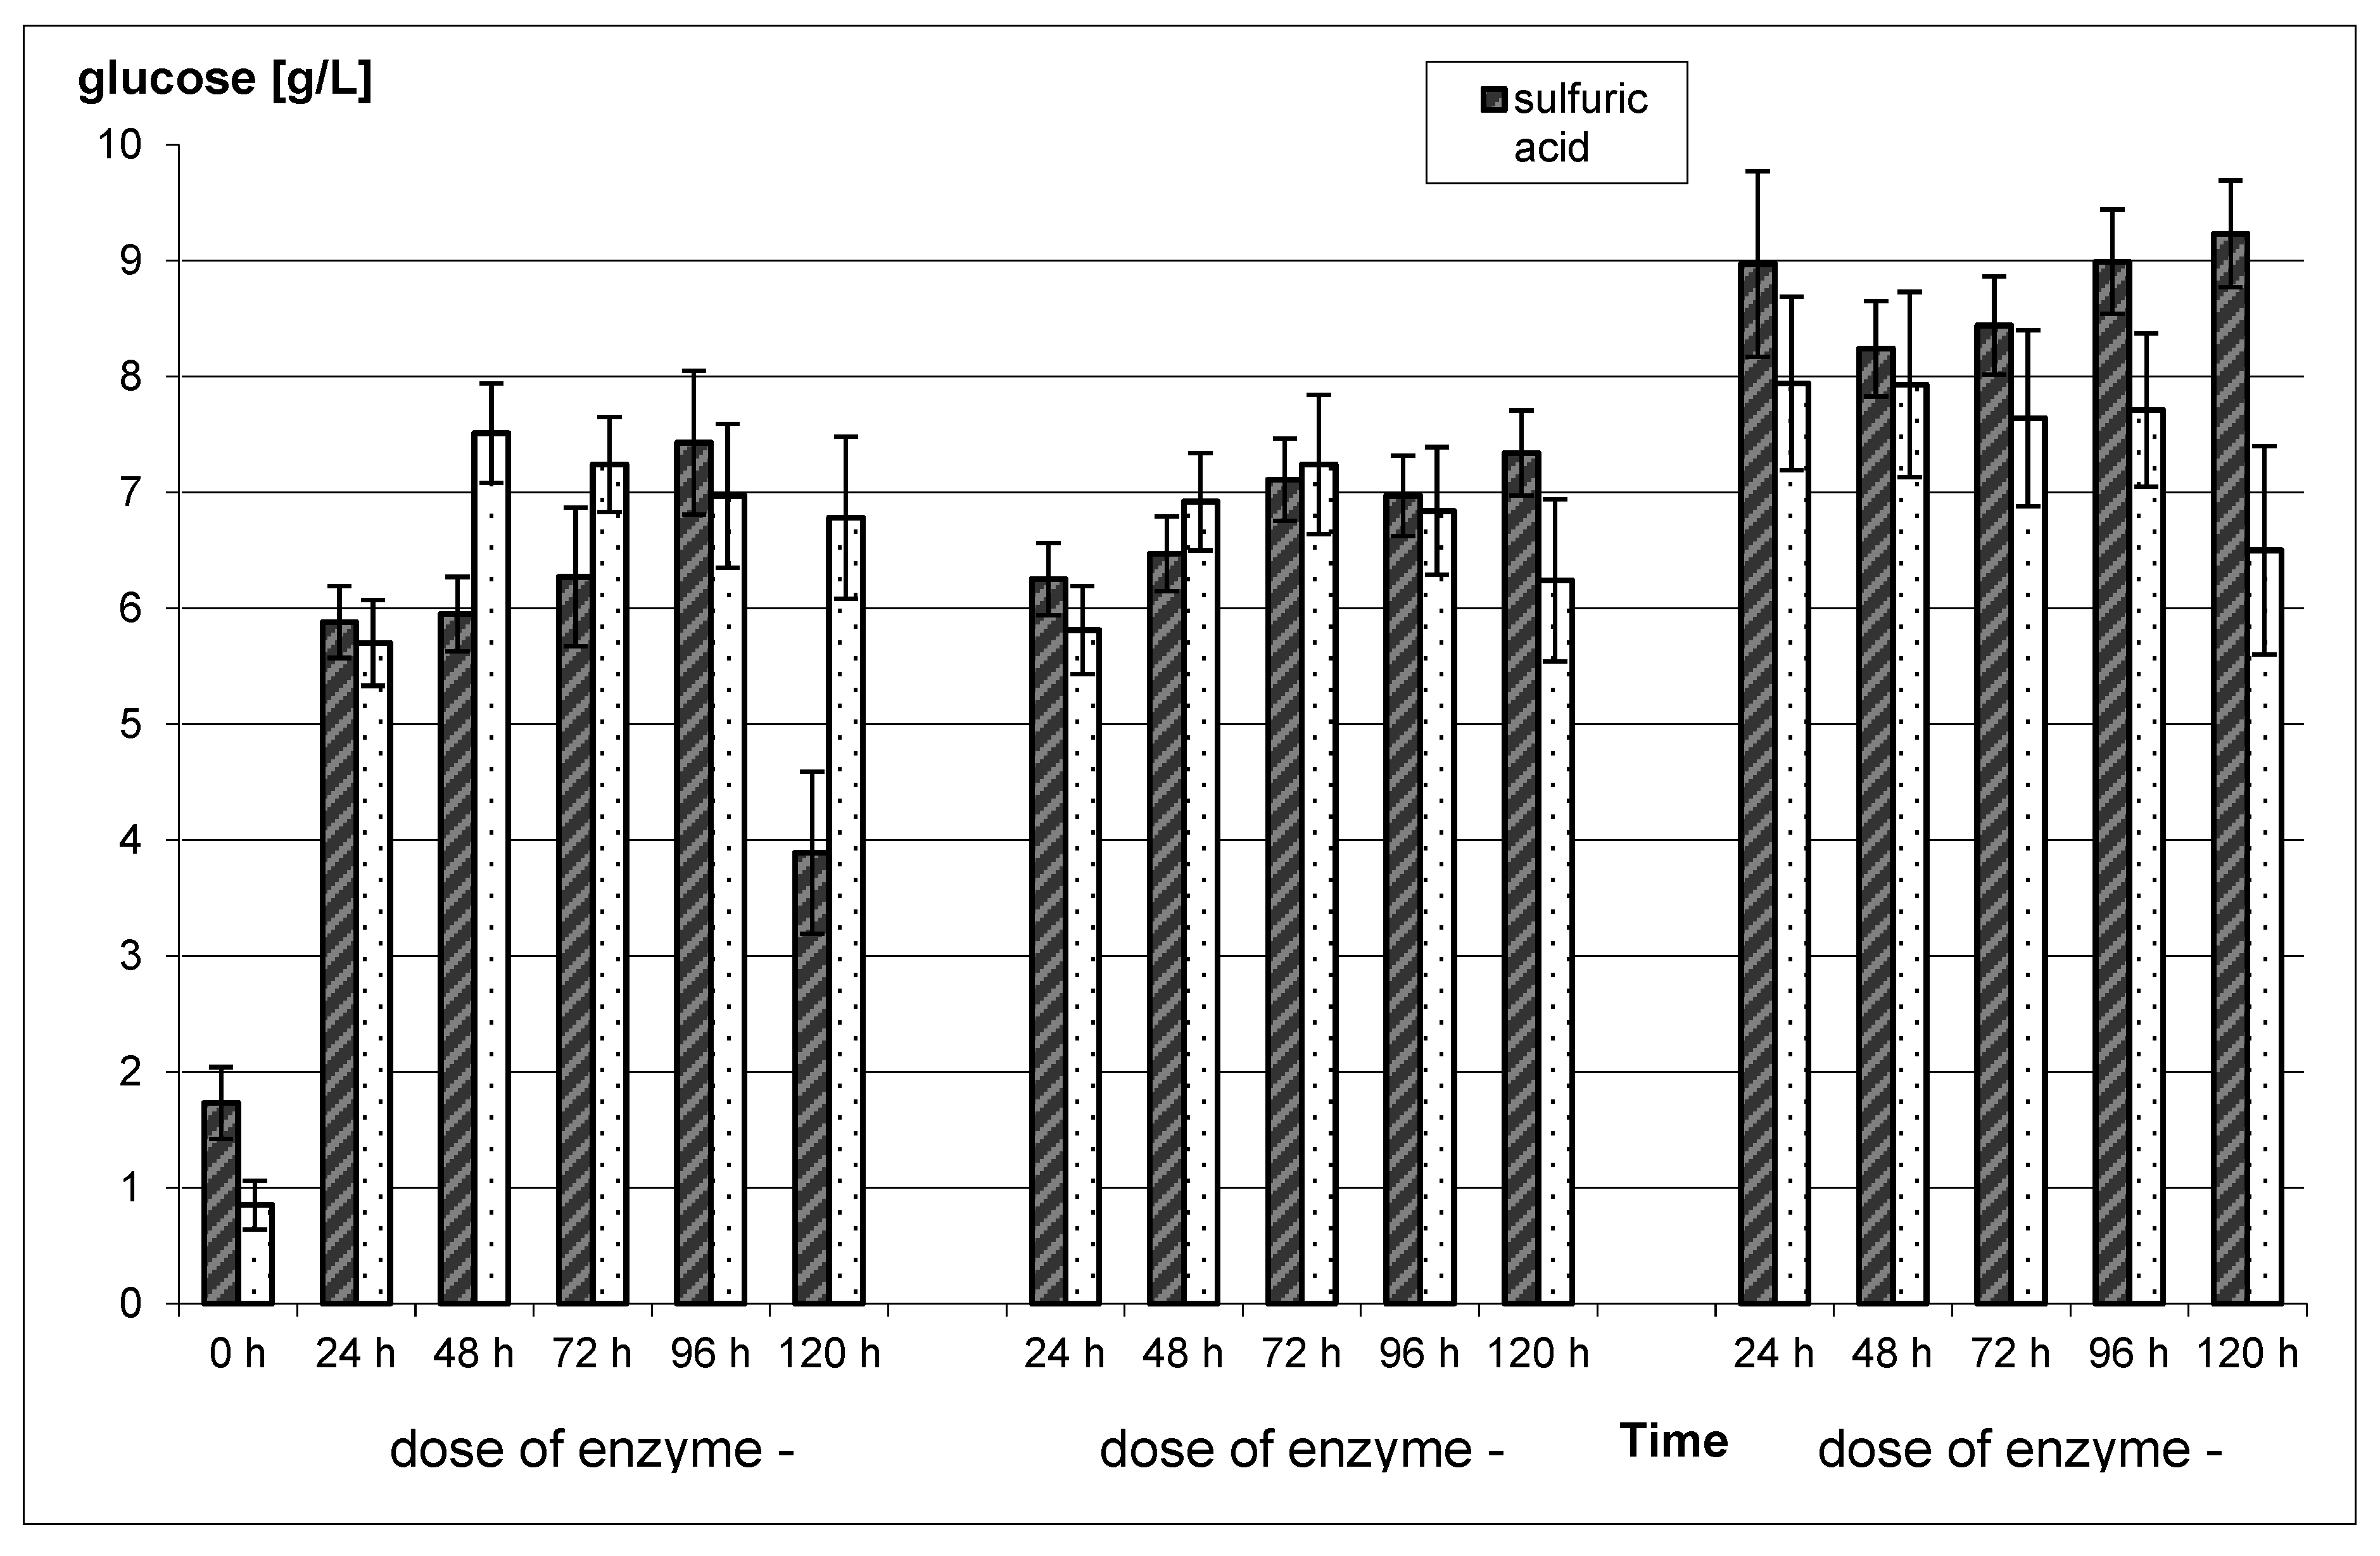
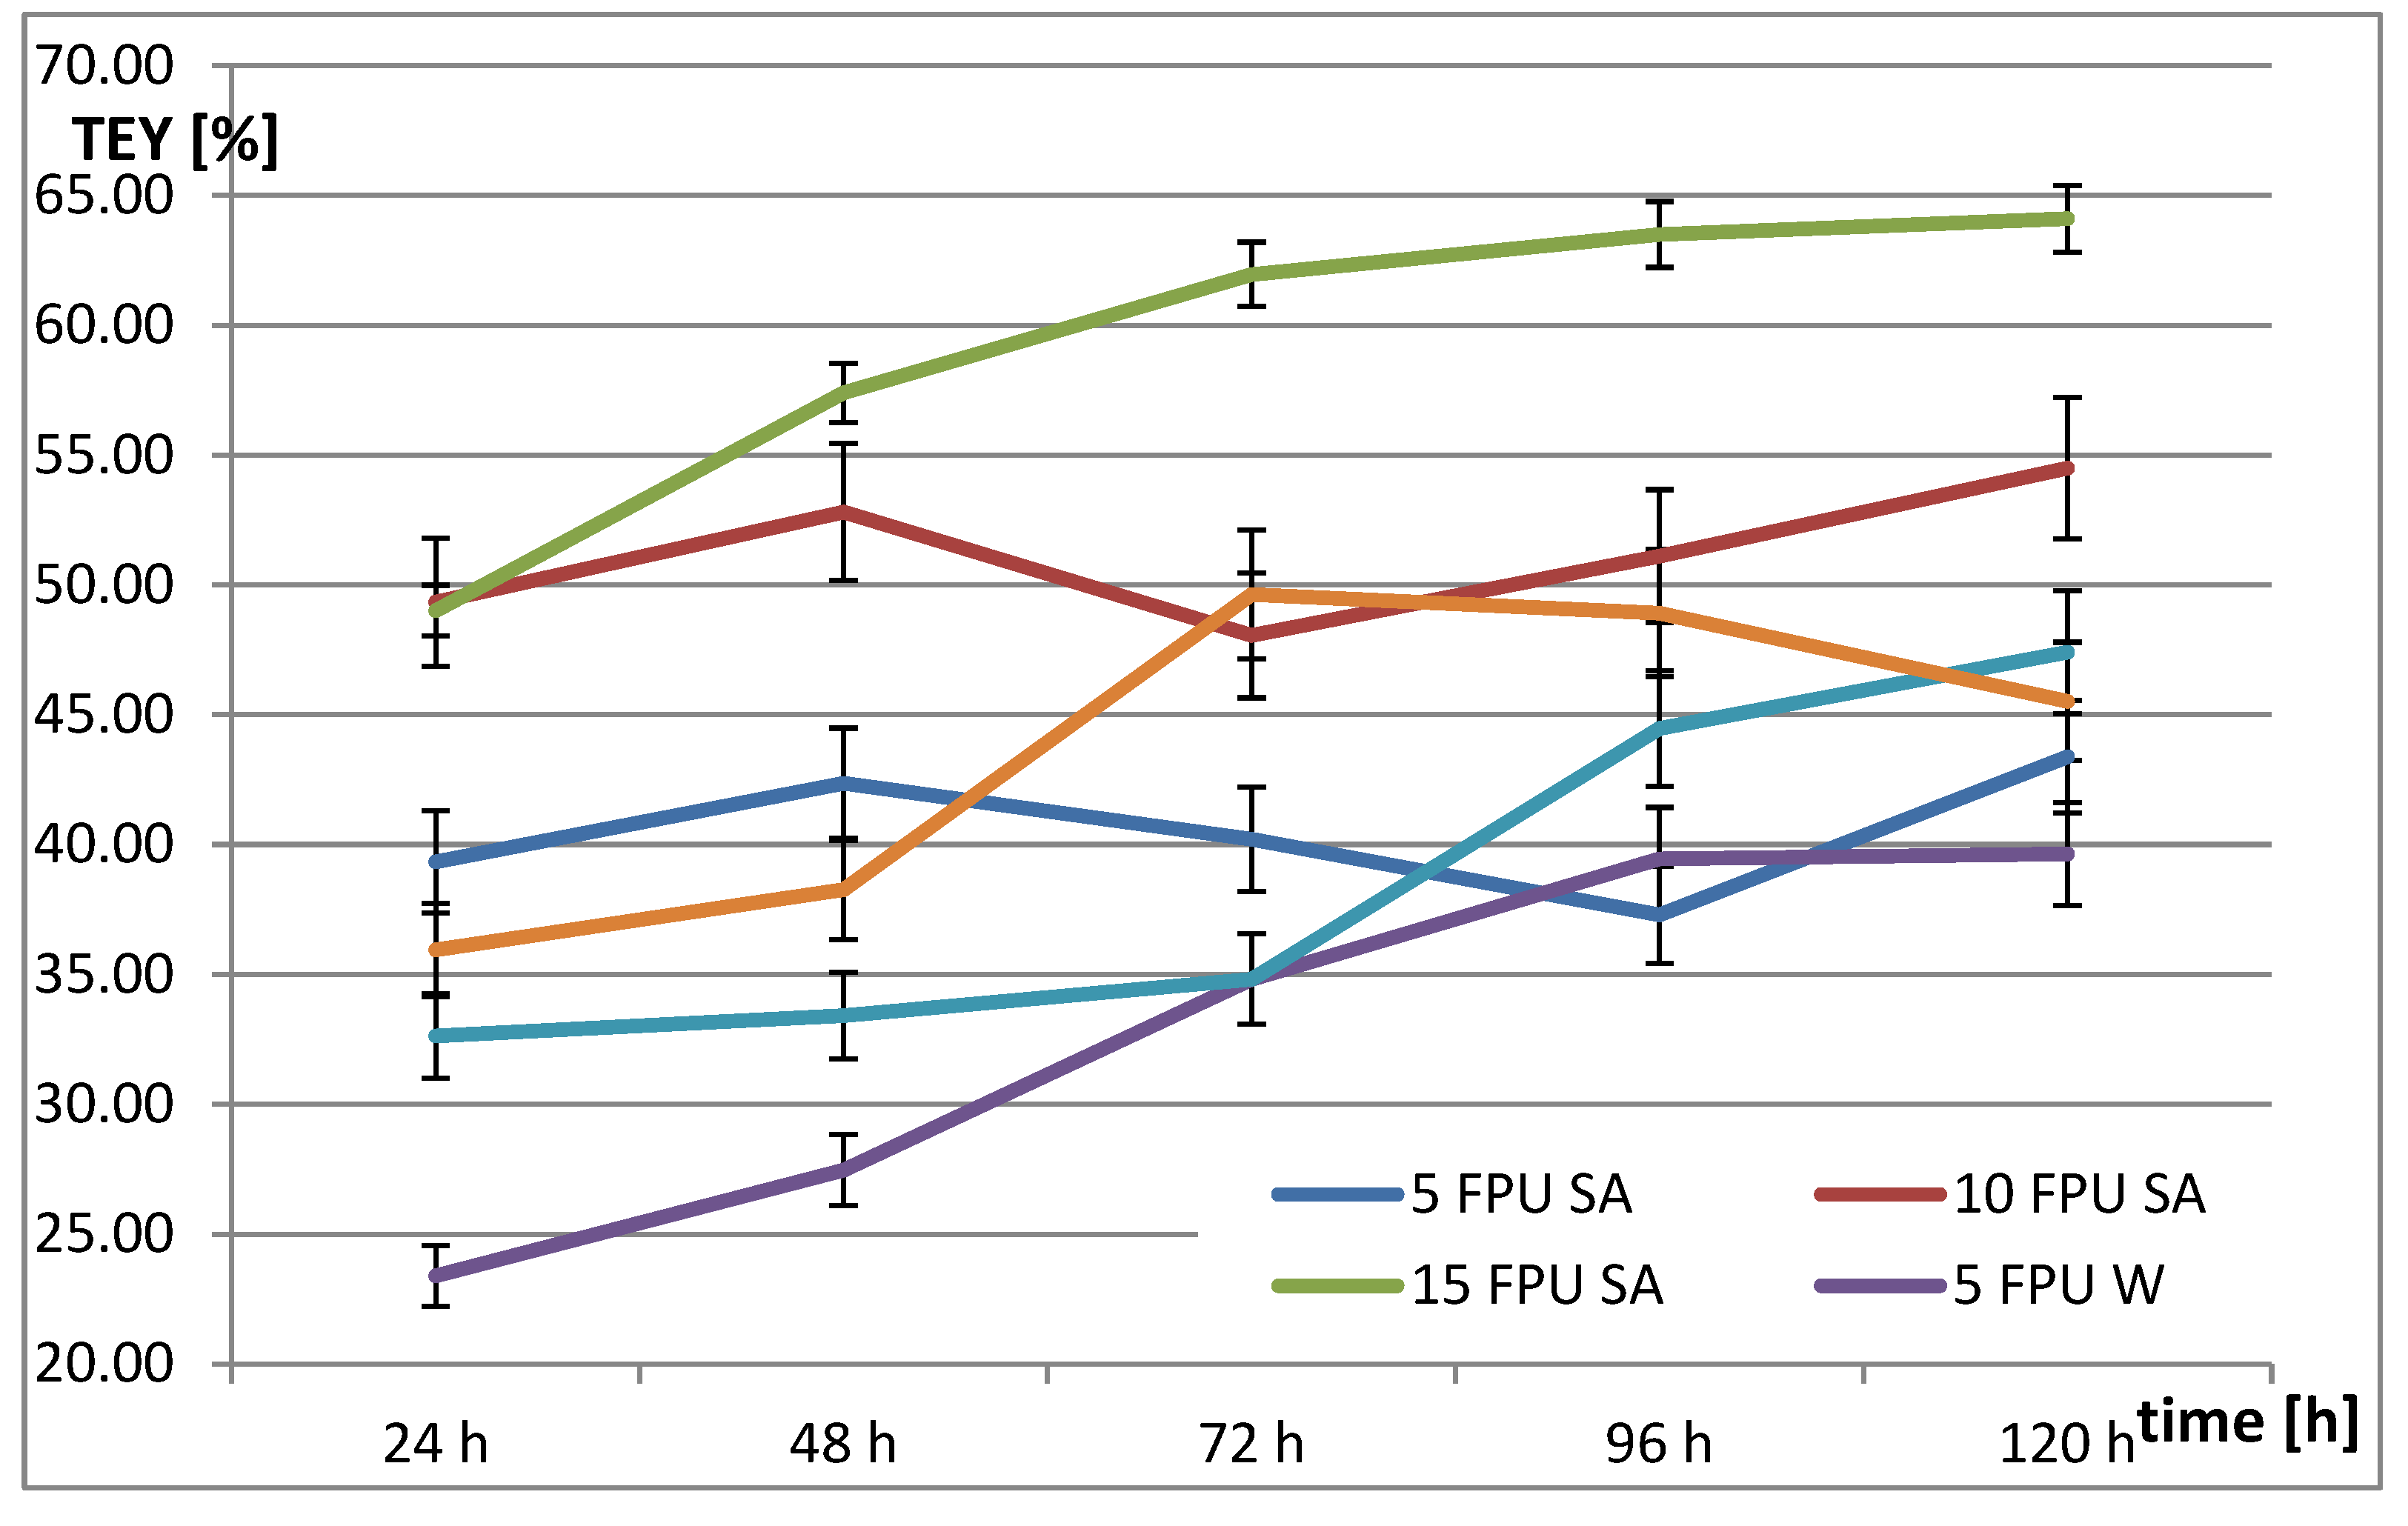
2.5.1. Enzymatic Hydrolysis
2.5.2. Ethanol Fermentation
2.6. Batch Test
2.6.1. Methane Production
2.6.2. Hydrogen Production
2.7. Economic Evaluation of the Conversion of Straw From Secale Cereale L. to Biofuels
3. Materials and Methods
3.1. Substrate and Inoculum
3.2. Chemical Pretreatment
3.2.1. Sulfuric Acid Pretreatment
3.2.2. Sulfuric Acid Pretreatment for Alcoholic Fermentation
3.3. Batch Test
3.3.1. For Methane Production
3.3.2. For Hydrogen Production
Preparation of Feedstock
Fermentative Hydrogen Production
3.4. Ethanol Fermentation
3.5. Characterization of Untreated and Pretreated Rye Straw
3.5.1. Scanning Electron Micrograph (SEM)
3.5.2. Fourier Transform Infrared Spectroscopy (FTIR) Analysis
3.5.3. XRD Analysis
3.6. Analytical Methods
3.7. Statistical Analysis
4. Conclusions
Author Contributions
Funding
Conflicts of Interest
References
- Santos, S.C.; Rosa, P.R.F.; Sakamoto, I.K.; Varesche, M.B.A.; Silva, E.L. Continuous thermophilic hydrogen production and microbial community analysis from anaerobic digestion of diluted sugar cane stillage. Int. J. Hydrogen Energ. 2014, 39, 9000–9011. [Google Scholar] [CrossRef]
- Wicher, E.; Seifert, K.; Zagrodnik, R.; Pietrzyk, B.; Laniecki, M. Hydrogen gas production from distillery wastewater by dark fermentation. Int. J. Hydrog. Energ. 2013, 38, 7767–7773. [Google Scholar] [CrossRef]
- Abraham, A.; Mathew, A.K.; Sindhu, R.; Pandey, A.; Binod, P. Potential of rice straw for bio-refining: An overview. Bioresour. Technol. 2016, 251, 29–36. [Google Scholar] [CrossRef] [PubMed]
- Aditiya, H.B.; Sing, K.P.; Hanif, M.; Mahlia, T.M.I. Effect of acid pretreatment on enzymatic hydrolysis in Bioethanol production from rice straw. Intern. J. Technol. 2015, 1, 3–10. [Google Scholar] [CrossRef]
- Domański, J.; Marchut-Mikołajczyk, O.; Polewczyk, A.; Januszewicz, B. Ozonolysis of straw from Secale cereale L. for anaerobic digestion. Bioresour. Technol. 2017, 245, 394–400. [Google Scholar] [CrossRef] [PubMed]
- Jiang, Y.; Xin, F.; Lu, J.; Dong, W.; Zhang, W.; Zhang, M.; Wua, H.; Maa, J.; Jiang, M. State of the art review of biofuels production from lignocellulose by thermophilic bacteria. Bioresour. Technol. 2017, 245, 1498–1506. [Google Scholar] [CrossRef] [PubMed]
- Paudel, S.R.; Banjara, S.P.; Choi, O.K.; Park, K.Y.; Kim, Y.M.; Lee, J.W. Pretreatment of agricultural biomass for anaerobic digestion: Current state and challenges. Bioresour. Technol. 2017, 245, 1194–1205. [Google Scholar] [CrossRef]
- Petersson, A.; Thomsen, M.H.; Hauggaard-Nielsen, H.; Thomsen, A.B. Potential bioethanol and biogas production using lignocellulosic biomass from winter rye, oilseed rape and faba bean. Biomass Bioenerg. 2007, 31, 812–819. [Google Scholar] [CrossRef]
- Smuga-Kogut, M.; Zgórska, K.; Kogut, T.; Kukiełka, K.; Wojdalski, J.; Kupczyk, A.; Dróżdż, B.; Wielewska, I. The use of ionic liquid pretreatment of rye straw for bioethanol production. Fuel 2017, 191, 266–274. [Google Scholar] [CrossRef]
- Sun, Y.; Cheng, J.J. Dilute acid pretreatment of rye straw and bermudagrass for ethanol production. Bioresour. Technol. 2005, 96, 1599–1606. [Google Scholar] [CrossRef]
- Dar, R.A.; Dar, E.A.; Kaur, A.; Phutelac, U.G. Sweet sorghum-a promising alternative feedstock for biofuel production. Renew. Sust. Energ. Rev 2018, 82, 4070–4090. [Google Scholar] [CrossRef]
- Ceballos, S.J.; Yu, C.; Claypool, J.T.; Singer, S.W.; Simmons, B.A.; Thelen, M.P.; Simmons, C.W.; VanderGheynst, J.S. Development and characterization of a thermophilic, lignin degrading microbiota. Process. Biotech 2017, 63, 193–203. [Google Scholar] [CrossRef]
- Park, Y.C.; Kim, J.S. Comparison of various alkaline pretreatment methods of lignocellulosic biomass. Energy 2012, 47, 31–35. [Google Scholar] [CrossRef]
- EUROSTAT. 2018. Available online: http://ec.europa.eu/eurostat/web/agriculture/data/database (accessed on 10 January 2020).
- Domański, J.; Borowski, S.; Marchut-Mikołajczyk, O.; Kubacki, P. Pretreatment of rye straw with aqueous ammonia for conversion to fermentable sugars as a potential substrates in biotechnological processes. Biomass Bioenerg. 2016, 91, 91–97. [Google Scholar] [CrossRef]
- Garcia-Cubero, M.T.; Gonzalez-Benito, G.; Indacoechea, I.; Coca, M.; Bolado, S. Effect of ozonolysis pretreatment on enzymatic digestibility of wheat and rye straw. Bioresour. Technol. 2009, 100, 1608–1613. [Google Scholar] [CrossRef] [PubMed]
- Varnaite, R.; Raudoniene, V. Enzymatic lignin degradation in rye straw by micromycetes. Inter. Biodeter. Biodegr. 2005, 56, 192–195. [Google Scholar] [CrossRef]
- Perez-Cantu, L.; Schreiber, A.; Schütt, F.; Saake, B.; Kirsch, C.; Smirnova, I. Comparison of pretreatment methods for rye straw in the second generation biorefinery: Effect on cellulose, hemicellulose and lignin recovery. Bioresour. Technol. 2013, 142, 428–435. [Google Scholar] [CrossRef]
- Guerra-Rodriguez, E.; Portilla-Rivera, O.M.; Jarquin-Enriquez, L.; Ramirez, J.A.; Vazquez, M. Acid hydrolysis of wheat straw: A kinetic study. Biomass Bioenerg. 2012, 36, 355–364. [Google Scholar] [CrossRef]
- Nishimura, Y.; Yokogawa, D.; Irle, S. Theoretical study of cellobiose hydrolysis to glucose in ionic liquids. Chem. Phys. Lett. 2014, 603, 7–13. [Google Scholar] [CrossRef]
- Dziekońska-Kubczak, U.; Berłowska, J.; Dziugan, P.; Patelski, P.; Balcerek, M.; Pielech-Przybylska, K.; Czyżowska, A.; Domański, J. Comparison of steam explosion, dilute acid, and alkali pretreatments on enzymatic saccharification and fermentation of hardwood sawdust. BioResources 2018, 13, 6970–6984. [Google Scholar] [CrossRef]
- Narendranath, N.V.; Thomas, K.C.; Ingledew, W.M. Effects of acetic acid and lactic acid on the growth of Saccharomyces cerevisiae in a minimal medium. J. Ind. Microbiol. Biot. 2001, 26, 171–177. [Google Scholar] [CrossRef] [PubMed]
- Ghaffar, S.H.; Mizi, F. Structural analysis for lignin characteristics in biomass straw. Biomass Bioenerg. 2013, 57, 264–279. [Google Scholar] [CrossRef]
- Zheng, Q.; Zhou, T.; Wang, Y.; Cao, X.; Wu, S.; Zhao, M.; Wang, H.; Xu, M.; Zheng, B.; Zheng, J.; et al. Pretreatment of wheat straw leads to structural changes and improved enzymatic hydrolysis. Sci. Rep. 2018, 8, 1321. [Google Scholar] [CrossRef] [PubMed]
- Haripriya, R.; Selvaraj, C.; Naveenraj, D.; Kirubakaran, S.A.; Muthukumar, V.; Thirumalaivasan, P. Pretreatment of cellulosic waste materials. Eur. J. Biotech. Biosci. 2014, 2, 4–13. [Google Scholar]
- Sun, X.F.; Xu, F.; Sun, R.C.; Fowler, P.; Baird, M.S. Characteristics of degraded cellulose obtained from steam-exploded wheat straw. Carbohyd. Res. 2005, 340, 97–106. [Google Scholar] [CrossRef]
- Cui, L.; Liu, Z.; Si, C.; Hui, L.; Kang, N.; Zhao, T. Influence of steam explosion pretreatment on the composition and structure of wheat straw. BioResouces 2012, 7, 4202–4213. [Google Scholar]
- Jonoobi, M.; Niska, K.O.; Harun, J.; Misra, M. Chemical composition, crystallinity, and thermal degradation of bleached and unbleached kenaf bast (Hibiscus cannabinus) pulp and nanofibers. BioResources 2009, 4, 626–639. [Google Scholar]
- Rajput, A.A.; Visvanathanb, C. Effect of thermal pretreatment on chemical composition, physical structure and biogas production kinetics of wheat straw. J. Environ. Manage. 2018. [Google Scholar] [CrossRef]
- Yan, X.; Wang, Z.; Zhang, K.; Si, M.; Liu, M.; Chai, L.; Liu, X.; Shi, Y. Bacteria-enhanced dilute acid pretreatment of lignocellulosic biomass. Bioresour. Technol. 2017. [Google Scholar] [CrossRef]
- Zhao, Z.; Chen, X.; Ali, M.F.; Abdeltawab, A.A.; Yakoutc, S.M.; Yua, G. Pretreatment of wheat straw using basic ethanolamine-based deep eutectic solvents for improving enzymatic hydrolysis. Bioresour. Technol 2018. [Google Scholar] [CrossRef]
- Zhang, H.; Zhang, P.; Ye, J.; Wu, Y.; Liu, J.; Fang, W.; Xu, D.; Wang, B.; Yan, L.; Zeng, G. Comparison of various pretreatments for ethanol production enhancement from solid residue after rumen fluid digestion of rice straw. Bioresour. Technol. 2018. [Google Scholar] [CrossRef]
- Ponnusamya, V.K.; Nguyenc, D.D.; Dharmarajad, J.; Shobanae, S.; Banuf, J.R.; Sarataleg, R.G.; Soon Woong Changc, S.W.; Kumarh, G. A review on lignin structure, pretreatments, fermentation reactions and biorefinery potential. Bioresour. Technol. 2019, 271, 462–472. [Google Scholar] [CrossRef] [PubMed]
- Garay-Arroyo, A.; Covarrubias, A.A.; Clark, I.; Nino, I.; Gosset, G.; Martinez, A. Response to different environmental stress conditions of industrial and laboratory Saccharomyces cerevisiae strains. Appl. Microbiol. Biotechnol 2004, 63, 734–741. [Google Scholar] [CrossRef] [PubMed]
- Robak, K.; Balcerek, M.; Dziekońska-Kubczak, U.; Dziugan, P. Effect of dilute acid pretreatment on the saccharification and fermentation of rye straw. Biotechnol. Progr. 2019. [Google Scholar] [CrossRef] [PubMed]
- Haroun, B.M.; Nakhla, G.; Hafez, H.; Nasr, F.A. Impact of furfural on biohydrogen production from glucose and xylose in continuous-flow systems. Renew. Energ. 2016, 93, 302–311. [Google Scholar] [CrossRef]
- Lee, D.J.; Show, K.Y.; Su, A. Dark fermentation on biohydrogen production: Pure culture. Bioresour. Technol. 2011, 102, 8393–8402. [Google Scholar] [CrossRef] [PubMed]
- AGROFAKT. Available online: https://www.agrofakt.pl/kalkulacja-kosztow-uprawy-zyta-porownanie-obliczen (accessed on 15 November 2019).
- Cieciura-Włoch, W.; Binczarski, M.; Tomaszewska, J.; Borowski, S.; Domański, J.; Dziugan, P.; Witońska, I. The use of acidic hydrolysates after furfural production from sugar waste biomass as a fermentation medium in the biotechnological production of hydrogen. Energies 2019, 12, 3222. [Google Scholar] [CrossRef]
- Głąb, L.; Sowiński, J.; Chmielewska, J.; Prask, H.; Fugol, M.; Szlachta, J. Comparison of the energy efficiency of methane and ethanol production from sweet sorghum (Sorghum bicolor (L.) Moench) with a variety of feedstock management technologies. Biomass Bioenerg 2019, 129, 105332. [Google Scholar] [CrossRef]
- Kumar, D.; Murthy, G.S. Impact of pretreatment and downstream processing technologies on economics and energy in cellulosic ethanol production. Biotechnol. Biofuels 2011, 4, 27. [Google Scholar] [CrossRef]
- Gomes, D.; Gama, M.; Domingues, L. Determinants on an efficient cellulase recycling process for the production of bioethanol from recycled paper sludge under high solid loadings. Biotechnol. Biofuels 2018, 11, 111. [Google Scholar] [CrossRef]
- Borowski, S.; Kucner, M. Co-diegestion of sawage sludge and dewatered residues from enzymatic hydrolysis of sugar beet pulp. J. Air Waste Manag. Asoos. 2015. [Google Scholar] [CrossRef] [PubMed]
- Cieciura-Włoch, W.; Borowski, S. Biohydrogen production from wastes of plant and animal origin via dark fermentation. J. Env. Eng. Landsc. 2019, 27, 101–113. [Google Scholar] [CrossRef]
- Tsapekos, P.; Kougias, P.G.; Treu, L.; Campanaro, S.; Angelidaki, I. Process performance and comparative metagenomic analysis during co-digestion of manure and lignocellulosic biomass for biogas production. Appl. Energ. 2017, 185, 126–135. [Google Scholar] [CrossRef]
- Dziekońska-Kubczak, U.; Berłowska, J.; Dziugan, P.; Patelski, P.; Pielech-Przybylska, K.; Balcerek, M. Nitric Acid Pretreatment of Jerusalem Artichoke Stalks for Enzymatic Saccharification and Bioethanol Production. Energies 2018, 11, 2153. [Google Scholar] [CrossRef]
- Segal, L.; Creely, J.J.; Martin, A.E.; Conrad, C.M. An empirical method for estimating the degree of cristallinity of native cellulose using the X-Ray diffractometer. Text. Res. J. 1959, 29, 786–794. [Google Scholar] [CrossRef]
- Rice, E.W.; Baird, R.B.; Eaton, A.D.; Clescer, L.S. (Eds.) Methods for the Examination of Water and Wastewate, 22nd ed.; American Public Health Association (APHA), American Water Works Association (AWWA) and Water Environment Federation (WEF), APHA: Washington, DC, USA, 2012. [Google Scholar]
- Balcerek, M.; Pielech-Przyblska, K.; Dziekońska-Kubczak, U.; Patelski, P.; Strąk, E. Fermentation Results and Chemical Composition of Agricultural Distillates Obtained from Rye and Barley Grains and the Corresponding Malts as a Source of Amylolytic Enzymes and Starch. Molecules 2016, 21, 1320. [Google Scholar] [CrossRef]
- Ziemiński, K.; Kowalska-Wentel, M. Effect of enzymatic pretreatment on anaerobic co-digestion of sugar beet pulp silage and vinasse. Bioresour. Technol. 2015, 180, 274–280. [Google Scholar] [CrossRef]
Sample Availability: Samples of the compounds are not available from the authors. |


| TS [g/kg] | VS [g/kg] | Glucose [g/L] | Xylose [g/L] | Arabinose [g/L] | Cellobiose [g/L] | Formic Acid [g/L] | Acetic acid [g/L] | Furfural [g/L] | |
|---|---|---|---|---|---|---|---|---|---|
| Pretreatment Temperature 121 °C Pretreatment Time 1 h | |||||||||
| H2O | 159.65 ± 5.32 a,b | 153.78 ± 1.84 a,b | 0.12 ± 0.00 a,b,c,d | 1.91 ± 0.41 a,b,c,d | 0.02 ± 0.00 a,b,c,d | 0.027 ± 0.001 a,b,c,d | 0.13 ± 0.004 a,b | 0.23 ± 0.01 a,b,c,d | 0.003 ± 0.000 a,b,c,d |
| 1% H2SO4 | 123.53 ± 0.63 c | 119.74 ± 1.43 a,c | 1.37 ± 0.02 a,f | 14.76 ± 0.59 a | 2.31 ± 0.01 a | 0.815 ± 0.017 a,e,f | 0.12 ± 0.007 c,d | 1.61 ± 0.06 a | 0.099 ± 0.006 a,e,f,g |
| 2% H2SO4 | 122.68 ± 3.32 a,d | 118.42 ± 6.53 b,d | 1.76 ± 0.04 b,g | 15.56 ± 0.43 b,e | 2.11 ± 0.08 b | 0.652 ± 0.021 b,g,h | 0.17 ± 0.004 e | 1.63 ± 0.08 b | 0.253 ± 0.012 b,e,h,i |
| 5% H2SO4 | 132.85 ± 9.17 e | 128.56 ± 8.89 e | 2.32 ± 0.09 c,e,h | 14.83 ± 0.61 c | 2.12 ± 0.03 c | 0.281 ± 0.009 c,e,g | 0.31 ± 0.011 a,c,f | 2.03 ± 0.11 c | 0.908 ± 0.051 c,f,h,j |
| 10% H2SO4 | 171.96 ± 7.09 b,c,d,e | 168.37 ± 6.81 c,d,e | 3.76 ± 0.11 d,f,g,h | 12.88 ± 1.01 d,e | 2.27 ± 0.07 d | 0.144 ± 0.011 d,f,h | 0.88 ± 0.012 b,d,e,f | 2.50 ± 0.16 | 1.655 ± 0.0814 d,g,i,j |
| Pretreatment Temperature 121 °C Pretreatment Time 2 h | |||||||||
| H2O | 153.22± 11.73 a,b | 148.57 ± 11.48 a,b | 0.26 ± 0.01 a,b,c,d | 2.47 ± 0.32 a,b,c,d | 0.14 ± 0.01 a,b,c,d | 0.034 ± 0.003 a,b,c | 0.13 ± 0.002 a,b | 0.21 ± 0.02 a,b,c,d | 0.004 ± 0.000 a,b,c,d |
| 1% H2SO4 | 109.43± 8.9 c | 104.35 ± 8.58 c | 1.88 ± 0.02 a,e,f | 17.17 ± 1.12 a,e,f | 2.49 ± 0.26 a | 0.732 ± 0.029 a,d,e,f | 0.16 ± 0.006 c,d | 2.17 ± 0.11 a | 0.282 ± 0.012 a,e,f,g |
| 2% H2SO4 | 101.47± 2.79 a,d | 96.46 ± 3.11 a,d | 2.13 ± 0.06 b,g | 17.52 ± 1.34 b,g,h | 2.44 ± 1.81 b | 0.500 ± 0.037 b,d,g,h | 0.21 ± 0.005 e | 2.24 ± 0.09 b | 0.618 ± 0.033 b,e,h,i |
| 5% H2SO4 | 104.66 ± 0.28 b,e | 100.24 ± 0.43 b,e | 2.53 ± 0.11 c,h | 12.27 ± 0.87 c,e,g | 1.92 ± 0.98 c | 0.244 ± 0.014 c,gi | 0.44 ± 0.007 a,c | 2.27 ± 0.13 c | 1.066 ± 0.039 c,f,h,j |
| 10% H2SO4 | 169.24 ± 7.25 c,d,e | 164.06 ± 6.19 c,d,e | 5.33 ± 0.36 d,f,g,h | 9.04 ± 0.64 d,f,h | 1.92 ± 0.26 d | 0.018 ± 0.002 f,h,i | 1.16 ± 0.016 b,d,e | 2.61 ± 0.11 d | 2.174 ± 0.111 d,g,I,j |
| Parameter | Unit | 10 g Rye Straw, 100 mL H2O | 10 g Rye Straw, 100 mL 1% H2SO4 | 10 g Rye Straw, 100 mL 2% H2SO4 | 10 g Rye Straw, 100 mL 5% H2SO4 | 10 g Rye Straw, 100 mL 10% H2SO4 |
|---|---|---|---|---|---|---|
| Pretreatment Temperature 121°CPretreatment Time 1 h | ||||||
| Mass of substrate | g | 27.34 | 22.84 | 30.19 | 17.89 | 13.01 |
| Substrate VS | g/kg | 69.82 | 83.56 | 63.24 | 106.69 | 146.82 |
| Mass of inoculum | g | 500 | 500 | 500 | 500 | 500 |
| Inoculum VS | g/kg | 14.68 ± 0.15 | 14.68 ± 0.15 | 14.68 ± 0.15 | 14.68 ± 0.15 | 14.68 ± 0.15 |
| SGP | dm3/kg VS | 340.4 ± 18.5 a,b,c | 482.1 ± 3.7 d,e | 354. 9 ± 16.7 d,f,g | 437.5 ± 37.0 b,f,h | 594.6 ± 15.6 c,e,g,h |
| SMP | dm3/kg VS | 107.21 ± 21.1 a,b,c,d | 235.77 ± 8.9 a,e | 243.88 ± 19.7 b,f | 253.71 ± 21.8 c,g | 347.42 ± 16.1 d,e,f,g |
| SHP | dm3/kg VS | 10.11 ±1.4 a,b,c,d | 91.24 ± 4.7 a,e | 131.99 ± 5.7 b,e,f,g | 45.58 ± 4.6 c,d,f | 41.24 ± 7. 1d,e,g |
| Pretreatment Temperature 121°CPretreatment Time 2 h | ||||||
| Mass of substrate | g | 25.2 | 29.6 | 32.4 | 24.8 | 12.8 |
| Substrate VS | g/kg | 83.96 | 71.91 | 65.53 | 85.28 | 168.22 |
| Mass of inoculum | g | 500 | 500 | 500 | 500 | 500 |
| Inoculum VS | g/kg | 14.68 ± 0.15 | 14.68 ± 0.15 | 14.68 ± 0.15 | 14.68 ± 0.15 | 14.68 ± 0.15 |
| SGP | dm3/kg VS | 248.15 ± 10.2 a,b | 441.7 ± 23.1 a,c,d | 312.3 ± 41.6 c | 214.7 ± 31.8 d | 476.6 ± 47.8 b,c |
| SMP | dm3/kg VS | 99.82 ± 8.9 a,b,c | 189.94 ± 21.7 a,d | 155.99 ±16.8 b,c,f | 105.8 ± 11.4 d,f | 195.39 ± 21.4 c |
| SHP | dm3/kg VS | 12.15 ± 2.4 a,b,c,d | 134.71 ± 12.8 a,e,f | 105.81 ± 9.1 b,g,h | 60.53 ± 6.3 c,e,g | 48.51 ± 8.9 d,f,h |
© 2020 by the authors. Licensee MDPI, Basel, Switzerland. This article is an open access article distributed under the terms and conditions of the Creative Commons Attribution (CC BY) license (http://creativecommons.org/licenses/by/4.0/).
Share and Cite
Domański, J.; Marchut-Mikołajczyk, O.; Cieciura-Włoch, W.; Patelski, P.; Dziekońska-Kubczak, U.; Januszewicz, B.; Zhang, B.; Dziugan, P. Production of Methane, Hydrogen and Ethanol from Secale cereale L. Straw Pretreated with Sulfuric Acid. Molecules 2020, 25, 1013. https://doi.org/10.3390/molecules25041013
Domański J, Marchut-Mikołajczyk O, Cieciura-Włoch W, Patelski P, Dziekońska-Kubczak U, Januszewicz B, Zhang B, Dziugan P. Production of Methane, Hydrogen and Ethanol from Secale cereale L. Straw Pretreated with Sulfuric Acid. Molecules. 2020; 25(4):1013. https://doi.org/10.3390/molecules25041013
Chicago/Turabian StyleDomański, Jarosław, Olga Marchut-Mikołajczyk, Weronika Cieciura-Włoch, Piotr Patelski, Urszula Dziekońska-Kubczak, Bartłomiej Januszewicz, Bolin Zhang, and Piotr Dziugan. 2020. "Production of Methane, Hydrogen and Ethanol from Secale cereale L. Straw Pretreated with Sulfuric Acid" Molecules 25, no. 4: 1013. https://doi.org/10.3390/molecules25041013
APA StyleDomański, J., Marchut-Mikołajczyk, O., Cieciura-Włoch, W., Patelski, P., Dziekońska-Kubczak, U., Januszewicz, B., Zhang, B., & Dziugan, P. (2020). Production of Methane, Hydrogen and Ethanol from Secale cereale L. Straw Pretreated with Sulfuric Acid. Molecules, 25(4), 1013. https://doi.org/10.3390/molecules25041013