Article

Cellulose Dissolution in Mixtures of Ionic Liquids and Dimethyl Sulfoxide: A Quantitative Assessment of the Relative Importance of Temperature and Composition of the Binary Solvent

by
Marcella T. Dignani
,
Thaís A. Bioni
,
Thiago R. L. C. Paixão
and
Omar A. El Seoud
*
Institute of Chemistry, The University of São Paulo, 748 Prof. Lineu Prestes Av., São Paulo 05508-000, Brazil
*
Author to whom correspondence should be addressed.
Molecules 2020, 25(24), 5975; https://doi.org/10.3390/molecules25245975
Submission received: 3 November 2020 / Revised: 5 December 2020 / Accepted: 11 December 2020 / Published: 17 December 2020

Abstract

:
We studied the dissolution of microcrystalline cellulose (MCC) in binary mixtures of dimethyl sulfoxide (DMSO) and the ionic liquids: allylbenzyldimethylammonium acetate; 1-(2-methoxyethyl)-3-methylimidazolium acetate; 1,8-diazabicyclo [5.4.0]undec-7-ene-8-ium acetate; tetramethylguanidinium acetate. Using chemometrics, we determined the dependence of the mass fraction (in %) of dissolved cellulose (MCC-m%) on the temperature, T = 40, 60, and 80 °C, and the mole fraction of DMSO, χDMSO = 0.4, 0.6, and 0.8. We derived equations that quantified the dependence of MCC-m% on T and χDMSO. Cellulose dissolution increased as a function of increasing both variables; the contribution of χDMSO was larger than that of T in some cases. Solvent empirical polarity was qualitatively employed to rationalize the cellulose dissolution efficiency of the solvent. Using the solvatochromic probe 2,6-dichloro-4-(2,4,6-triphenylpyridinium-1-yl)phenolate (WB), we calculated the empirical polarity ET(WB) of cellobiose (a model for MCC) in ionic liquid (IL)–DMSO mixtures. The ET(WB) correlated perfectly with T (fixed χDMSO) and with χDMSO (fixed T). These results show that there is ground for using medium empirical polarity to assess cellulose dissolution efficiency. We calculated values of MCC-m% under conditions other than those employed to generate the statistical model and determined the corresponding MCC-m% experimentally. The excellent agreement between both values shows the robustness of the statistical model and the usefulness of our approach to predict cellulose dissolution, thus saving time, labor, and material.

Graphical Abstract

1. Introduction

The need to increase the use of cellulose (Cel) from sources other than cotton, in particular from wood, has resulted in increased interest in optimizing the efficiency of solvents for the physical dissolution of Cel, i.e., without the formation of covalent bonds [1,2,3,4].
Ionic solvents, in particular ionic liquids (ILs) based on imidazole, quaternary ammonium- and phosphonium electrolytes, and salts of superbases (e.g., 1,5-diazabicyclo [4.3.0]non-5-ene (DBN) and 1,8-diazabicyclo[5.4.0]undec-7-ene (DBU)), these ILs have been employed both pure and as binary mixtures with dipolar aprotic molecular solvents [5]. A central issue in these studies was to maximize the concentration of dissolved Cel. Binary mixtures (BMs) of ILs with molecular solvents are frequently used as cellulose solvents. In addition to a better mass/heat transfer due to the lower viscosity, many dissolve more Cel than their precursor ILs [6,7]. Because of its efficiency in Cel swelling [8] and high dipole moment and relative permittivity, dimethyl sulfoxide (DMSO) is most extensively employed as a co-solvent for ILs.
For simplicity, we used the following definitions/acronyms in the subsequent discussion: microcrystalline cellulose (MCC) to represent Cel, mass fraction of dissolved MCC (MCC-m%; see Equation (1)), and mole fraction of dissolved MCC (MCC-χ; see Equation (2); AGU = anhydroglucose unit). For brevity, we limited our discussion to MCC-m%. As we will show below, the use of MCC-m% or MCC-χ leads to identical conclusions.
MCC-m% = [mass of dissolved MCC/(mass of dissolved MCC + mass of ionic liquid + mass of DMSO)] × 100
MCC-χ = [number of moles of dissolved AGU/(number of moles of dissolved AGU + number of moles of IL + number of moles of DMSO)]
The usual procedure for optimizing the dissolution of Cel in a solvent is to change one experimental variable (or factor) at a time, e.g., temperature or composition of the BM. If needed, the first factor is fixed at its value that resulted in the maximum MCC-m%, and the other factor (e.g., BM composition) is then varied until a new maximum MCC-m% is reached [7,9,10,11,12,13]. Although useful, this approach does not guarantee a real MCC-m% maximum for both variables. Equally important, however, this one-at-a-time approach gives no indication about the relative importance to Cel dissolution of the experimental variables. Therefore, chemometrics should be used, where both factors are varied simultaneously in a random manner [14].
Using a recently constructed equipment that ensures reproducible Cel dissolution data and a recommended dissolution protocol [15], we employed chemometrics to optimize MCC-m% for biopolymer dissolution in binary mixtures of dimethyl sulfoxide (DMSO) with the following ionic liquids: allylbenzyldimethylammonium acetate (AlBzMe2NAcO); 1-(2-methoxyethyl)-3-methylimidazolium acetate (C3OMeImAcO), 1,8-diazabicyclo[5.4.0]undec-7-ene-8-ium acetate (DBUHAcO), and tetramethylguanidinium acetate (TMGHAcO) (Figure 1).
The experimental variables studied were the dissolution temperature (T = 40, 60, and 80 °C) and the DMSO mole fraction (χDMSO = 0.4, 0.6, and 0.8). We obtained equations that correlate MCC-m% with T and χDMSO. These indicated that increasing the values of both factors favor MCC dissolution; the latter variable is more important in some cases.
Many authors used solvent empirical polarity (vide infra) to qualitatively rationalize the effects of pure solvents and BMs on Cel dissolution [6,16,17]. Therefore, we used the solvatochromic probe 2,6-dichloro-4-(2,4,6-triphenylpyridinium-1-yl)phenolate (WB) and cellobiose as a model for MCC and calculated the empirical polarity, ET(WB), of the disaccharide/IL–DMSO solutions. We found perfect second-order polynomial correlations between ET(WB) and T (at fixed χDMSO) and between ET(WB) and χDMSO (at fixed T). Thus, there is theoretical and experimental ground for using the empirical polarity of a medium to explain its efficiency as a Cel solvent.
The generated statistical equations reproduce satisfactorily MCC dissolution data at T and χDMSO values other than those employed to create the statistical model. This agreement shows the robustness of the chemometric approach used. Equally important, however, is that the model permits the prediction of biopolymer dissolution, saving time, labor, and material.

2. Materials and Methods

2.1. Materials

The reagents used were purchased from Sigma–Aldrich or Merck. The MCC, Avicel PH 101 (viscosity-average degree of polymerization = 155 ± 3, Ref. [18] was purchased from FMC. Before use, the MCC was dried for 2 h at 70 °C under reduced pressure.

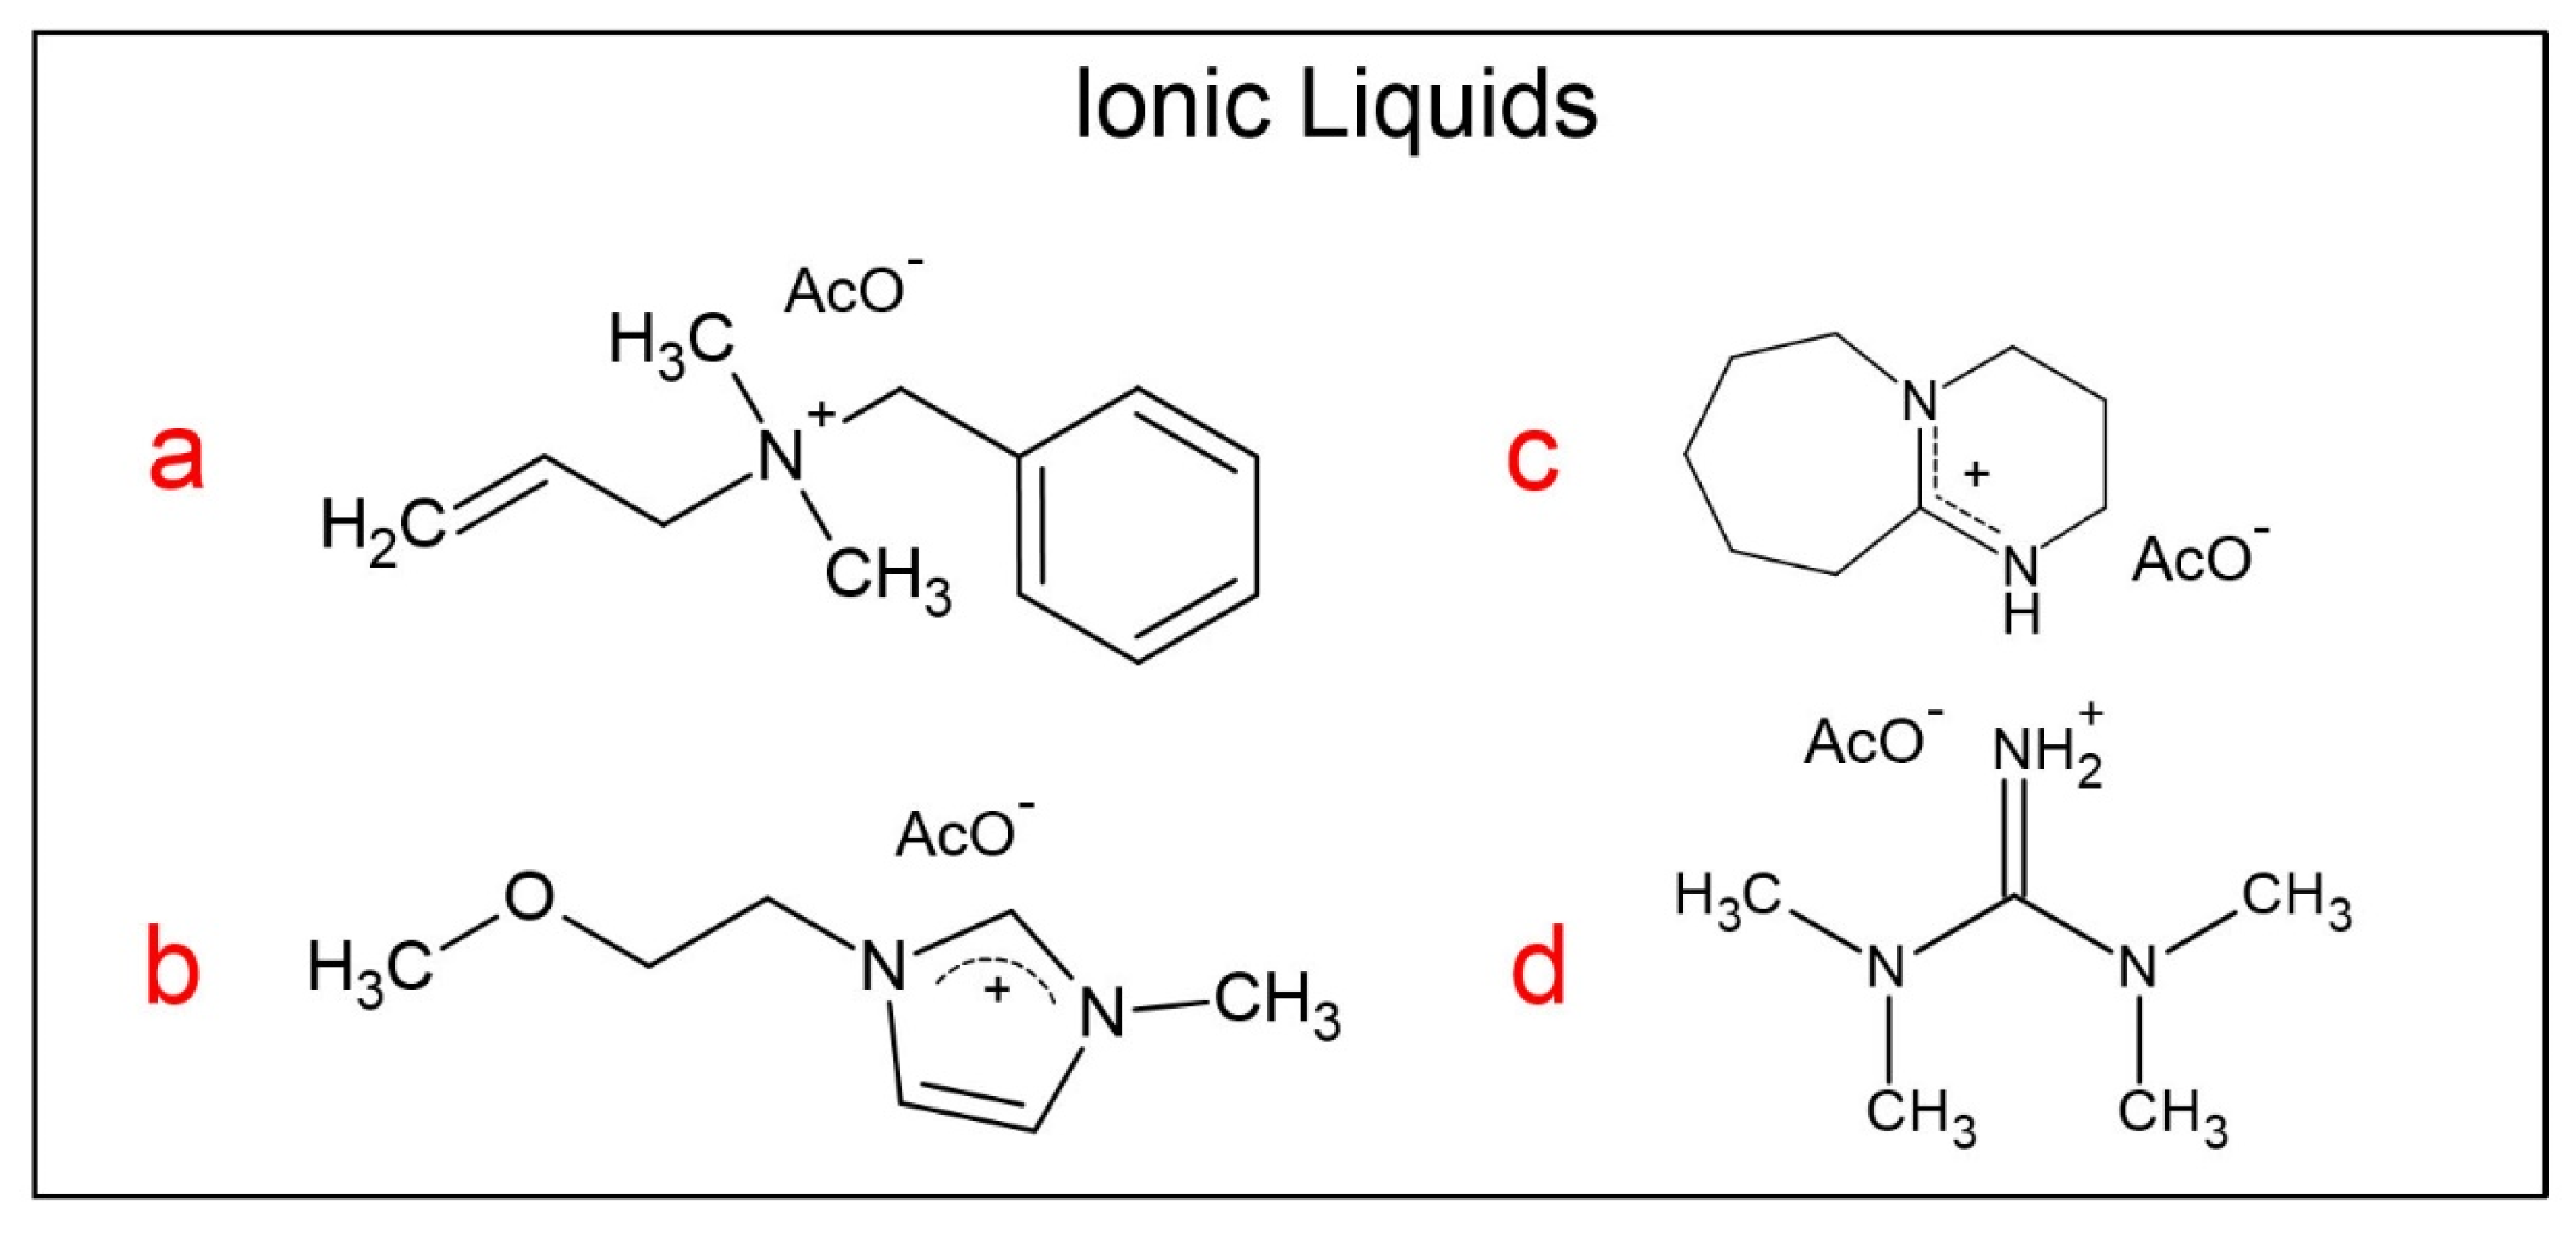
2.2. Synthesis of the Ionic Liquids

The DBUHAcO and TMGHAcO were synthesized according to the literature, [17] by mixing equimolar quantities of standardized solutions of the superbase (DBU and/or TMG) with acetic acid in acetonitrile (MeCN), followed by stirring for 2 h at room temperature and removal of MeCN.
The AlBzMe2NAcO and C3OMeImAcO were synthesized as given elsewhere [19,20,21]. N-Benzyl-N,N-dimethylamine was reacted with allyl bromide in MeCN. After solvent removal, the produced allylbenzyldimethylammonium bromide was purified by suspension in cold ethyl acetate (3 times; vigorous agitation), followed by removal of the latter. The obtained bromide was transformed into the corresponding acetate by ion exchange on a macroporous resin in the acetate form (Amberlite IRN 78, 1.20 equivalent acetate ions/L resin), using methanol as eluent, followed by removal of the latter. N-Methylimidazole was reacted with 1-chloro-2-methoxyethane in MeCN under pressure (10 atm, 6 h, 85 °C), followed by removal of MeCN and purification by agitation with ethyl acetate, vide supra. The produced 1-(2-methoxyethyl)-3-methylimidazolium chloride was transformed into C3OMeImAcO using ion exchange, as given for AlBzMe2NAcO.
The synthesized ILs were dried under reduced pressure, in the presence of P4O10. We analyzed the purity of these products by 1H NMR spectroscopy (Varian Inova model YH300 spectrometer; 300 MHz for 1H; CDCl3 solvent). Each IL gave the expected spectrum (See Supplementary Materials Figure S1).

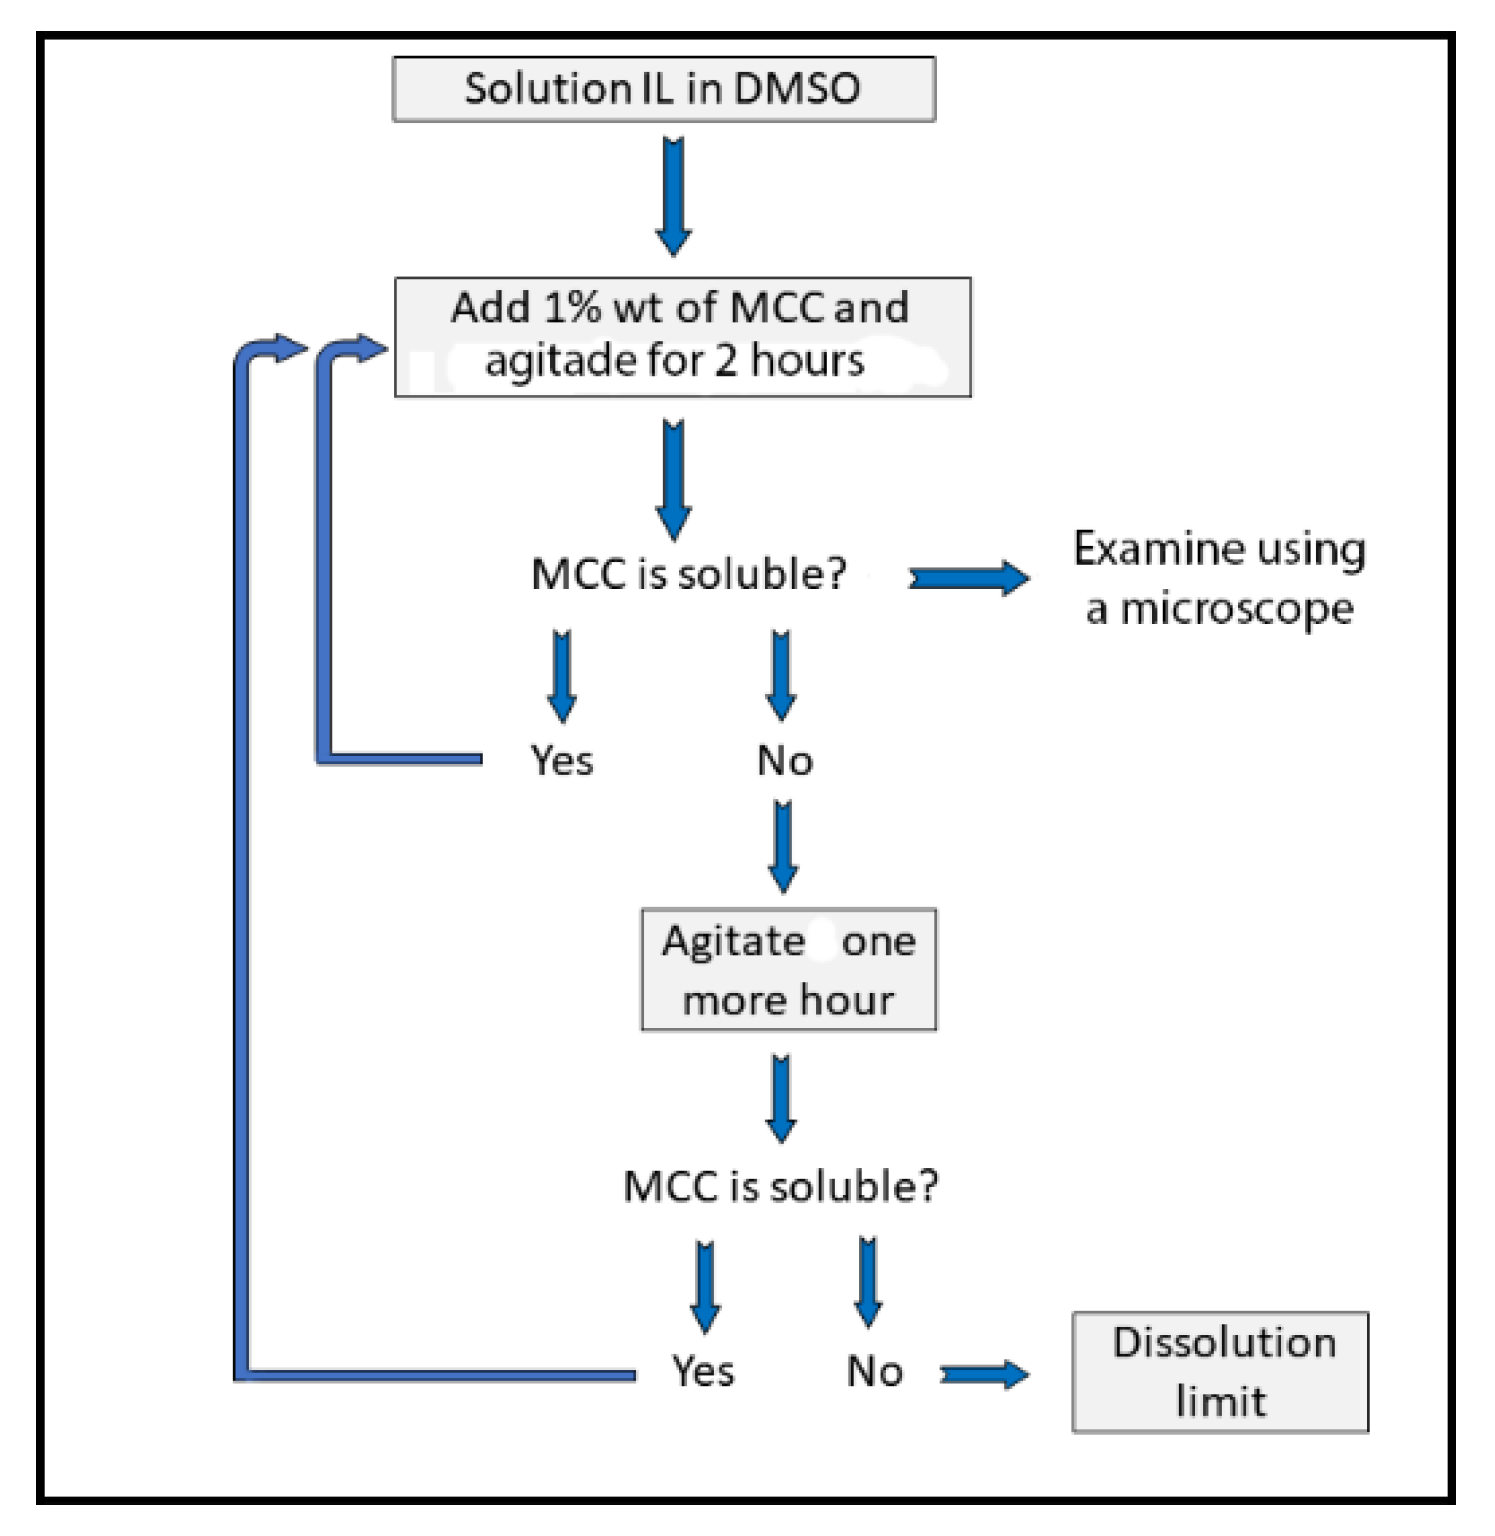
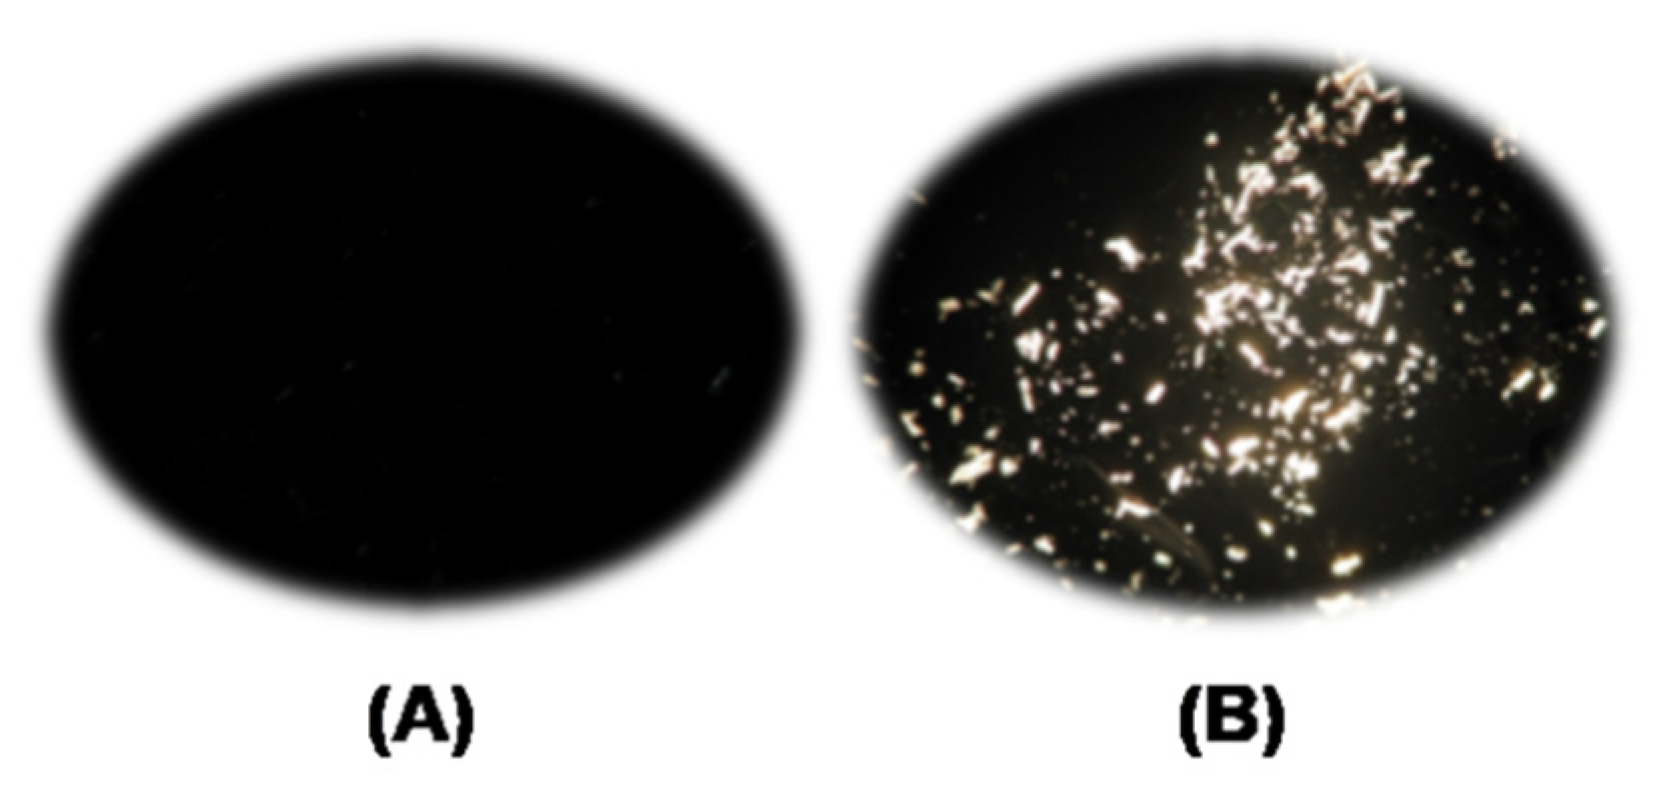
2.3. Determination of the Concentration Dissolved Cellulose in IL–DMSO

Figure 2 shows the equipment employed for the MCC dissolution; its parts are explained in the corresponding legend. The dissolution experiments were carried out as follows (see the flow chart of Figure 3): Known masses of the IL–DMSO BM with the desired χDMSO (approximately 3 g) and MCC (approximately 10–30 mg) were quickly weighted into a threaded glass tube. The latter was attached to the mechanical stirrer and then introduced into a thermostated polymethacrylate water bath already set at the desired temperature (Isotemp 730 heating unit, Fisher Scientific; Aumax model N1540 digital thermometer, bath temperature constant within ±0.2 °C). The suspension was agitated at a constant speed (300 rpm, measured with a digital laser tachometer, model 2234C+, Signsmeter). The MCC dissolution was judged visually, without opening the glass tube, under 12× magnifying glass provided with an LED light. The final decision (on MCC dissolution) was reached with the aid of a microscope (Nikon, Tokyo, Japan, Eclipse 2000 microscope with cross polarization). Complete cellulose dissolution was evidenced by observing a clear (i.e., dark) view, see Figure 4A. If complete dissolution was not observed after 2 h of agitation (Figure 4B), the suspension was agitated further for an additional hour. We considered that MCC maximum dissolution was reached when the biopolymer remained undissolved after 3 h from the last solid addition.

2.4. Calculation of the Empirical Solution Polarity, ET(WB)

We used Equation (3) to calculate the solution empirical polarity using WB as a solvatochromic probe [22]:
ET(WB), kcal/mole = 28591.5/λmax, nm
where λmax is the wavelength of the solvatochromic peak, and ET(WB) is the corresponding empirical polarity. Solutions of MCC in IL–DMSO scatter visible light, especially at high biopolymer concentrations. Therefore, we used cellobiose (CB) as a model for Cel [19,23,24] and prepared solutions that contained CB concentration (CB-m%) equivalent to (MCC-m%). We pipetted 50 μL of the WB stock solution in acetone (1 × 10³ mol L−1) into glass vials and removed the solvent under reduced pressure in the presence of P4O10. To each vial we added 1 mL of the appropriate CB-m%/IL–DMSO solution, dissolved the solid probe (vortex agitation), and transferred the resulting clear solution to a 1 cm path length semi-micro quartz cell with a PTFE stopper. We recorded each spectrum twice at a resolution of 0.2 nm, at 30, 40, 50, and 60 °C using a Shimadzu UV-2550 UV-Vis spectrophotometer provided with a digital thermometer (model 4000A, Yellow Springs Instruments, Yero Springs, OH, USA). We calculated the value of λmax from the first derivative of the spectrum. The value of ET(WB) at 80 °C was calculated by extrapolation of the ET(WB) versus T curve.

2.5. Statistical Design of the Cellulose Dissolution Experiment

Design of experiments (DOE) [25,26] is a systematic method to determine the relationship between experimental variables or factors affecting the output of a process. This method is used to find cause-and-effect relationships [14]. To perform DOE, we used the Statistica Software (version 13.0, Dell, Austin, TX, USA). The order of design points was randomized to reduce the effect of unpredicted variables (vide infra); the total number of experiments for each MCC/IL–DMSO was 16. A quadratic model was fitted to the dissolution data, see Section 3 (Results and Discussion). Response surfaces (vide infra) were generated by the response surface methodology (RSM) as implemented in the Statistica software.

3. Results and Discussion

Design of the Cellulose Dissolution Experiments

As shown in Section 2, we used one cellulose sample (MCC) and carried out the dissolution experiment at a fixed stirring rate. Therefore, the only experimental variables were T and χDMSO. Each variable had three values or levels. According to DOE, the minimum number of experiments is 9 (i.e., equal to the number of levels(number of variables) = 32). In order to increase the robustness of the model, we repeated the central point (T = 60 °C and χDMSO = 0.6) three more times and repeated the minimum and maximum levels (T = 40, 80 °C; χDMSO = 0.4, 0.8) one more time, giving 16 experiments for each IL–DMSO BM (9 + 3 + (2 × 2)).
It is customary to denote the low, intermediate, and high values of factor levels by −1, 0, and +1, respectively. For example, we designated 40, 60, and 80 °C by −1, 0, and 1. Table S1 shows the randomized order of experiments using this designation as generated by the software employed. Table 1 shows the experimentally determined dependence of MCC-m% and MCC-χ on T and χDMSO. In Table 1, we list in footer (d) the empirical polarity ET(WB) of the mixtures (CB + IL + DMSO) at different temperatures and DMSO mole fractions.
As there were two experimental variables, we expected that a quadratic model should fit our data [14] as given by Equation (4) for the present case:
MCC-m% or χMCC = Constant + a1 T + a2 χDMSO + a3 T2 + a4DMSO)2 + a5 (Tx χDMSO)
where a1, a2, etc., are regression coefficients. Note that whereas the terms in T and χDMSO are related directly to the variables studied, the quadratic and “cross” terms (i.e., T2, (DMSO)2, and Tx χDMSO) are required for a better statistical fit of the model to the data. In other words, the term a4DMSO)2 does not necessarily mean that Cel dissolution occurs by the dimer of DMSO.
Based on this quadratic model, we constructed the corresponding Pareto charts for the four IL–DMSO BMs [27]. In Figure 5, the bars extending past the vertical (red) line indicate values reaching statistical significance (p = 0.05). Thus, both experimental variables were statistically relevant to Cel dissolution; both have comparable relevance, in agreement with previously published data on cellulose dissolution (vide supra).
We used the data in Table 1 to generate two important pieces of information, namely, the response surfaces [28] and regression equations that correlate cellulose dissolution with the experimental variables. Figure 6 shows the responses of MCC dissolution to T and χDMSO for the investigated IL–DMSO BMs. All of the color-coded response surfaces show that Cel dissolution increased as a function of increasing the temperature, and their maximum values (at the same T) were approximately 0.6 (χDMSO). The response surfaces of Figure 6 are in agreement with the abovementioned data on the efficiency of Cel dissolution in IL–DMSO BMs, namely, as a function of increasing T. The Cel-m% shows a “bell-shaped” curve (increase → maximum → decrease) as a function of increasing the concentration of DMSO in the BM. This (bell-shaped) behavior is related to competition for the solvation of the AGU hydroxyl groups by ions of the IL versus DMSO. Thus, the initial dilution of the IL with DMSO increased the dissociation of the ionic solvent, leading to efficient IL–Cel interactions (both hydrogen-bonding and hydrophobic interactions) and enhanced biopolymer dissolution. The competition between both solvent components for the hydroxyl groups of the AGU increased, however, on further dilution with DMSO, leading to a decrease in MCC-m%. The reason is that DMSO, unlike the IL, causes swelling but not dissolution of cellulose [29,30,31].
Additionally, we calculated the regression equations, shown in Table 2, that quantify, for the first time, this dependence.
Regarding Table 2, we have the following comments:
  • In order to compare the regression coefficients directly, the values of T and χDMSO were reduced, so that they varied between 0 and 1, before being subjected to the regression analysis;
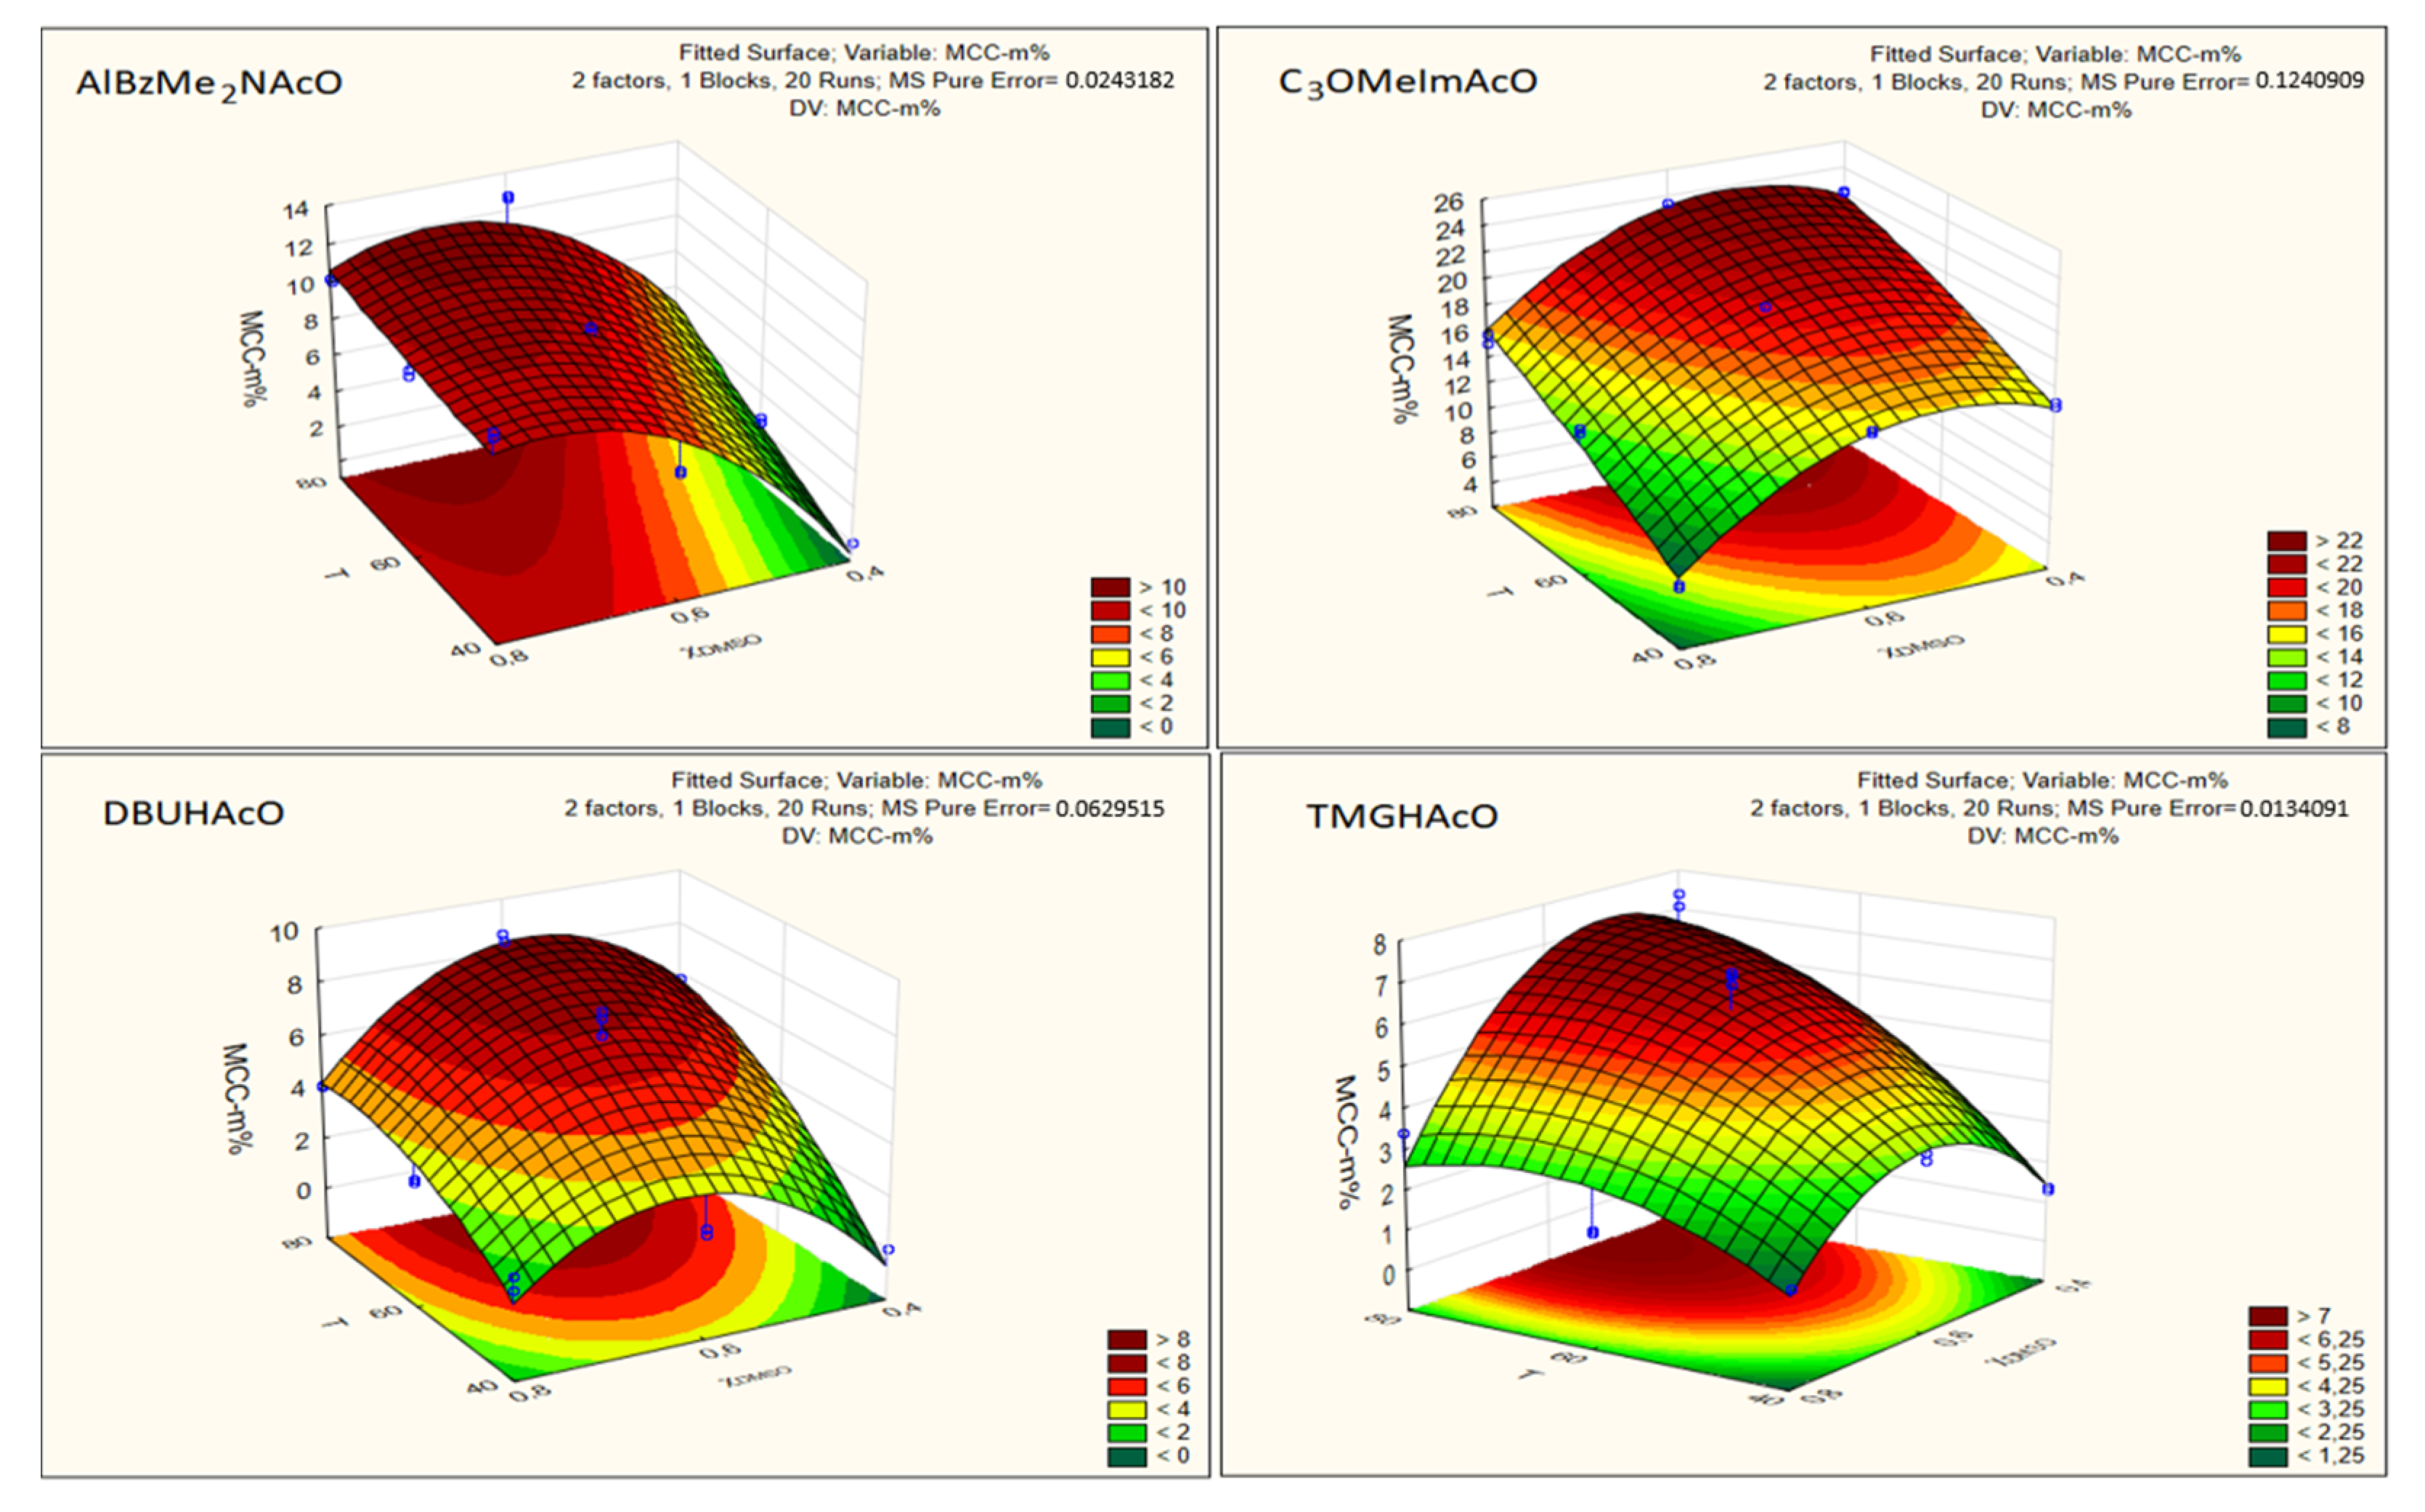
  • The magnitudes of the regression coefficients indicate the susceptibility/response of the phenomenon studied (i.e., Cel dissolution) to the experimental variables. In addition to expressing the concentration of dissolved Cel as MCC-m%, we also report our data as MCC-χ. The latter scale is more fundamental because differences in the molar masses of mixture components (Cel, CB, IL, co-solvent) do not affect the numerical value of the component. Additionally, the mole fraction scale permits calculation of the number of IL and DMSO molecules required to dissolve Cel. For example, maximum MCC dissolution was observed at 80 °C and χDMSO approximately 0.6 (Figure 6). Under these conditions, the molar ratios IL:DMSO per AGU were: AlBzMe2NAcO, 3.1:4.7; C3OMeImAcO, 1.7:2.5; DBUHAcO, 5.4:8.1, TMGHAcO, 9.7:14.9. Thus, the most efficient solvent system was that based on imidazole because it required smaller numbers of IL and DMSO molecules to dissolve Cel. We recommend that the mole fraction scale should be employed to compare the efficiency of different Cel solvents;
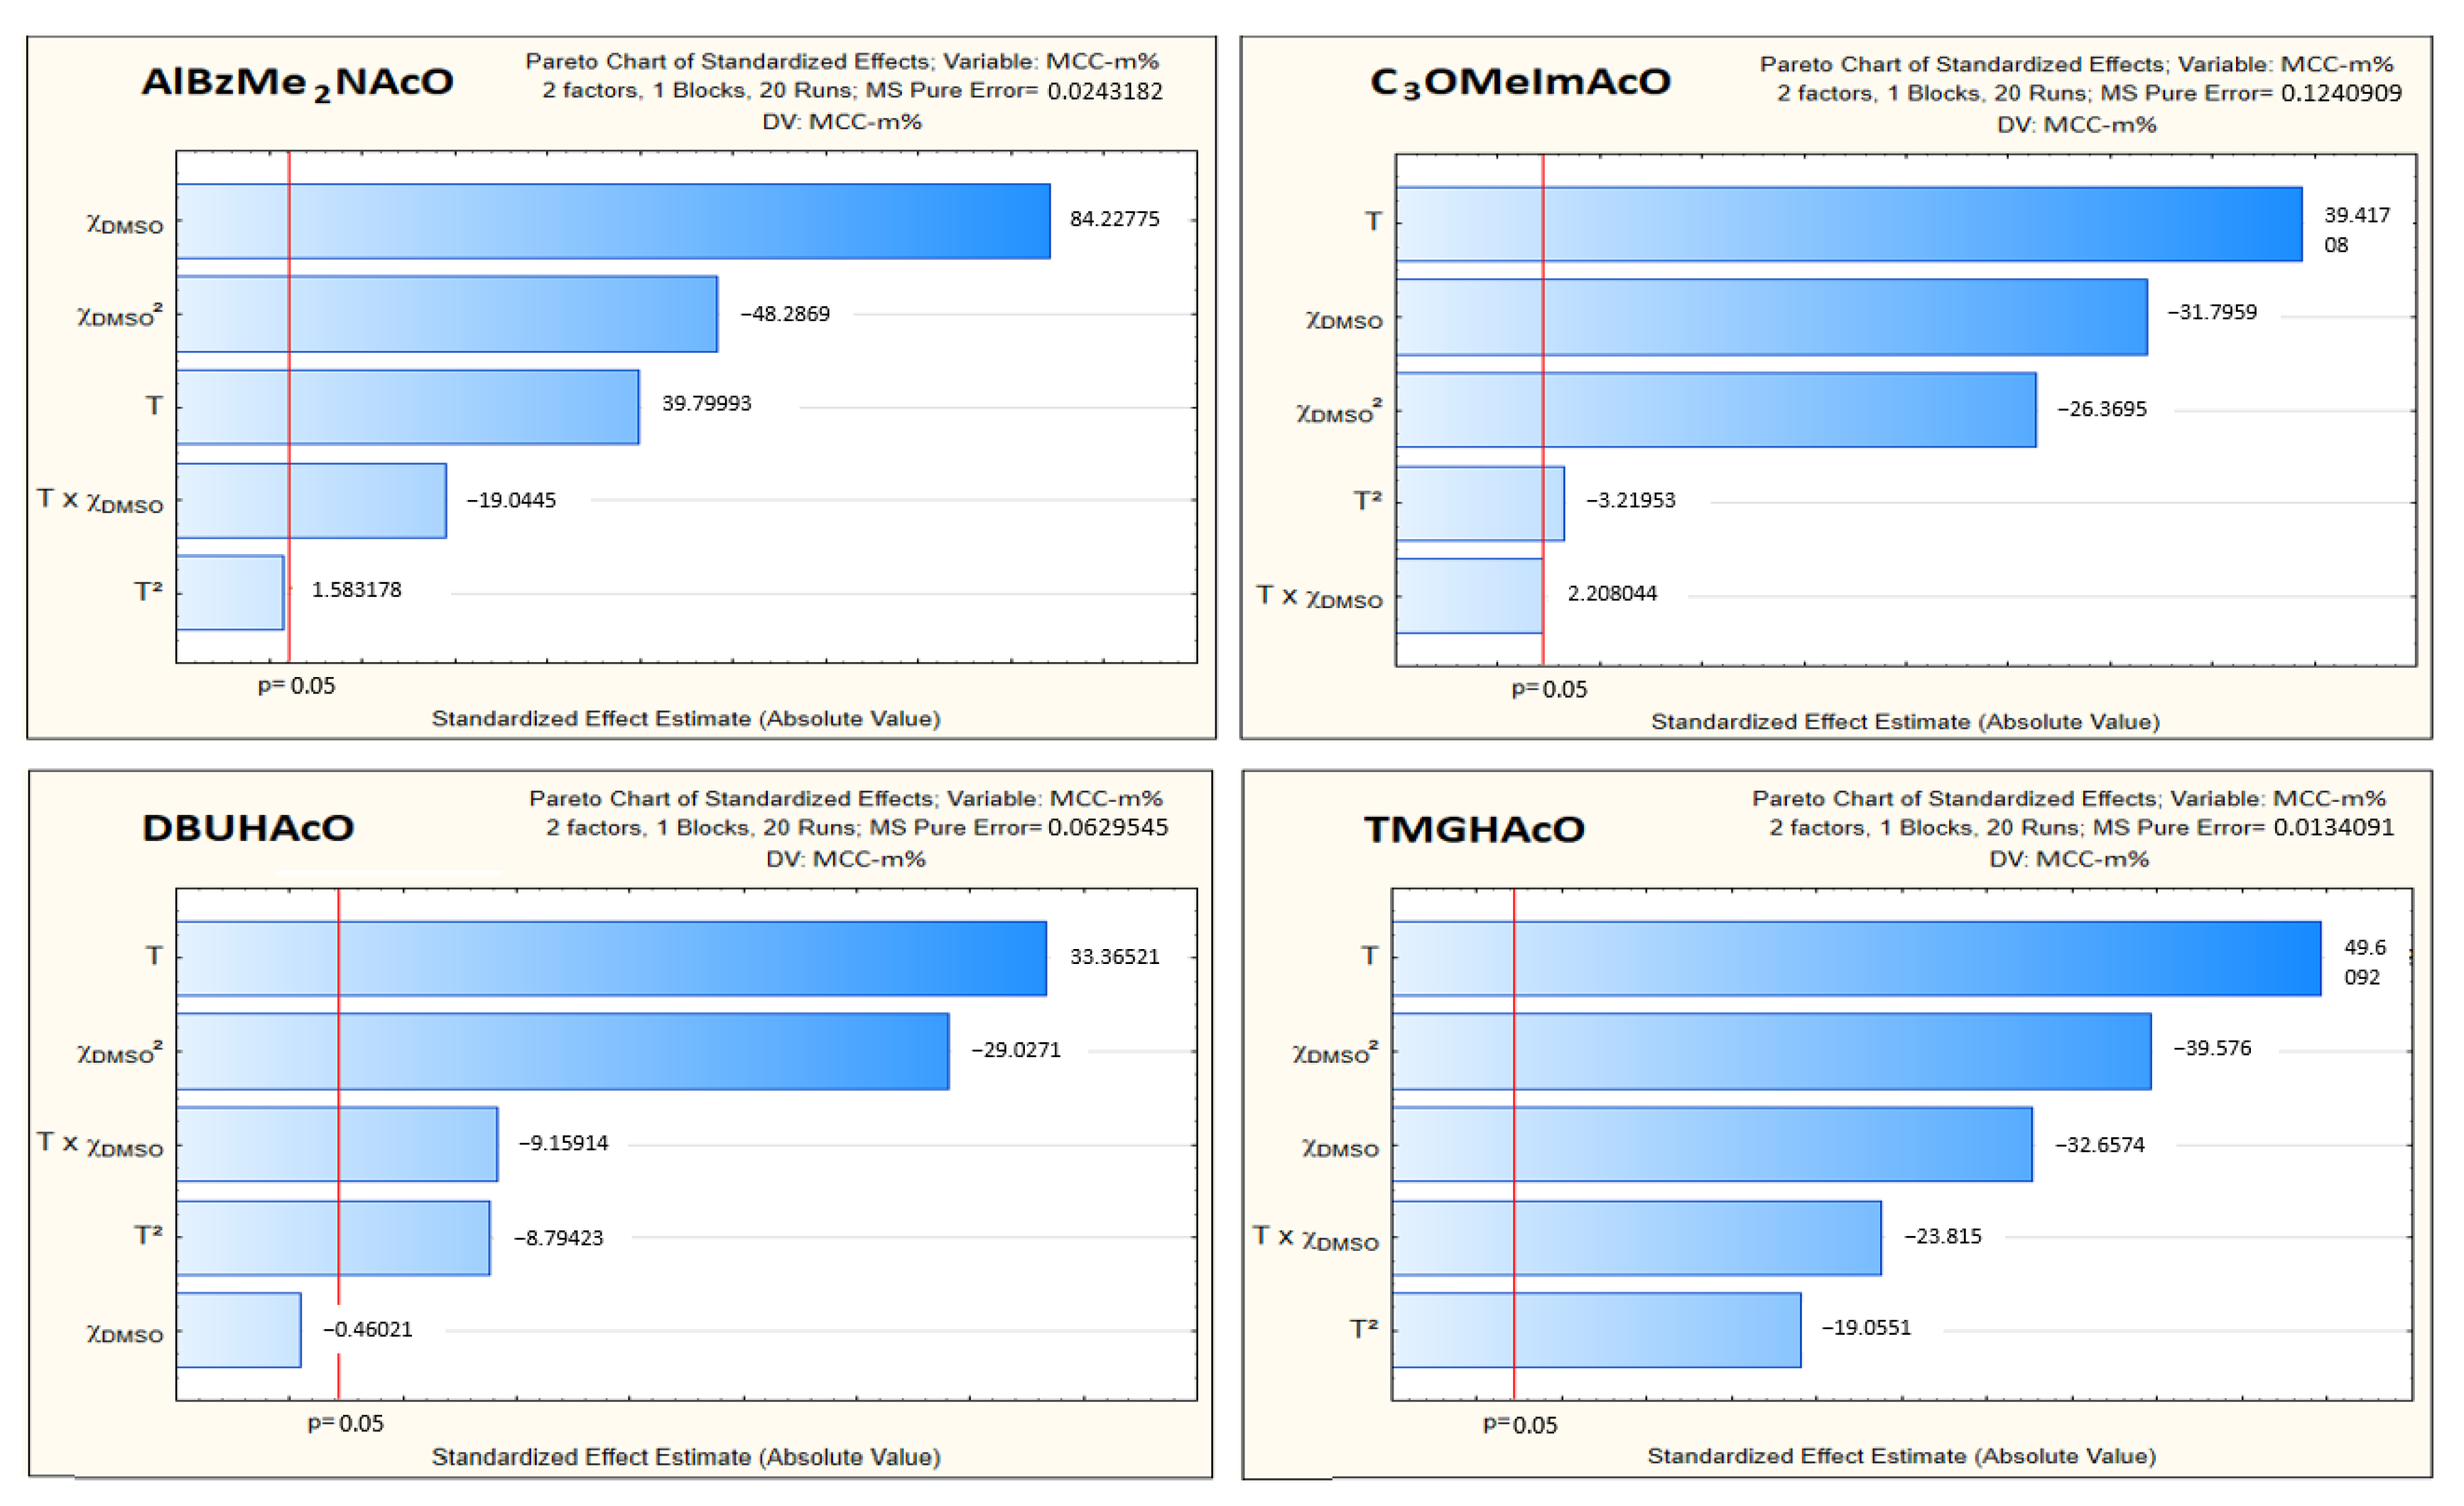
  • As argued above, we concentrated on the regression coefficient of the second (T) and the fourth (χDMSO) terms of the equations listed in Table 2. These showed that both variables had comparable effects on MCC dissolution, at least in the range studied, in agreement with Pareto’s chart (Figure 5) and the abovementioned data in the literature where only one variable at a time was changed. Although the two concentration scales (i.e., MCC-m% and MCC-χ) resulted in different values of regression coefficients, the trends were qualitatively similar;
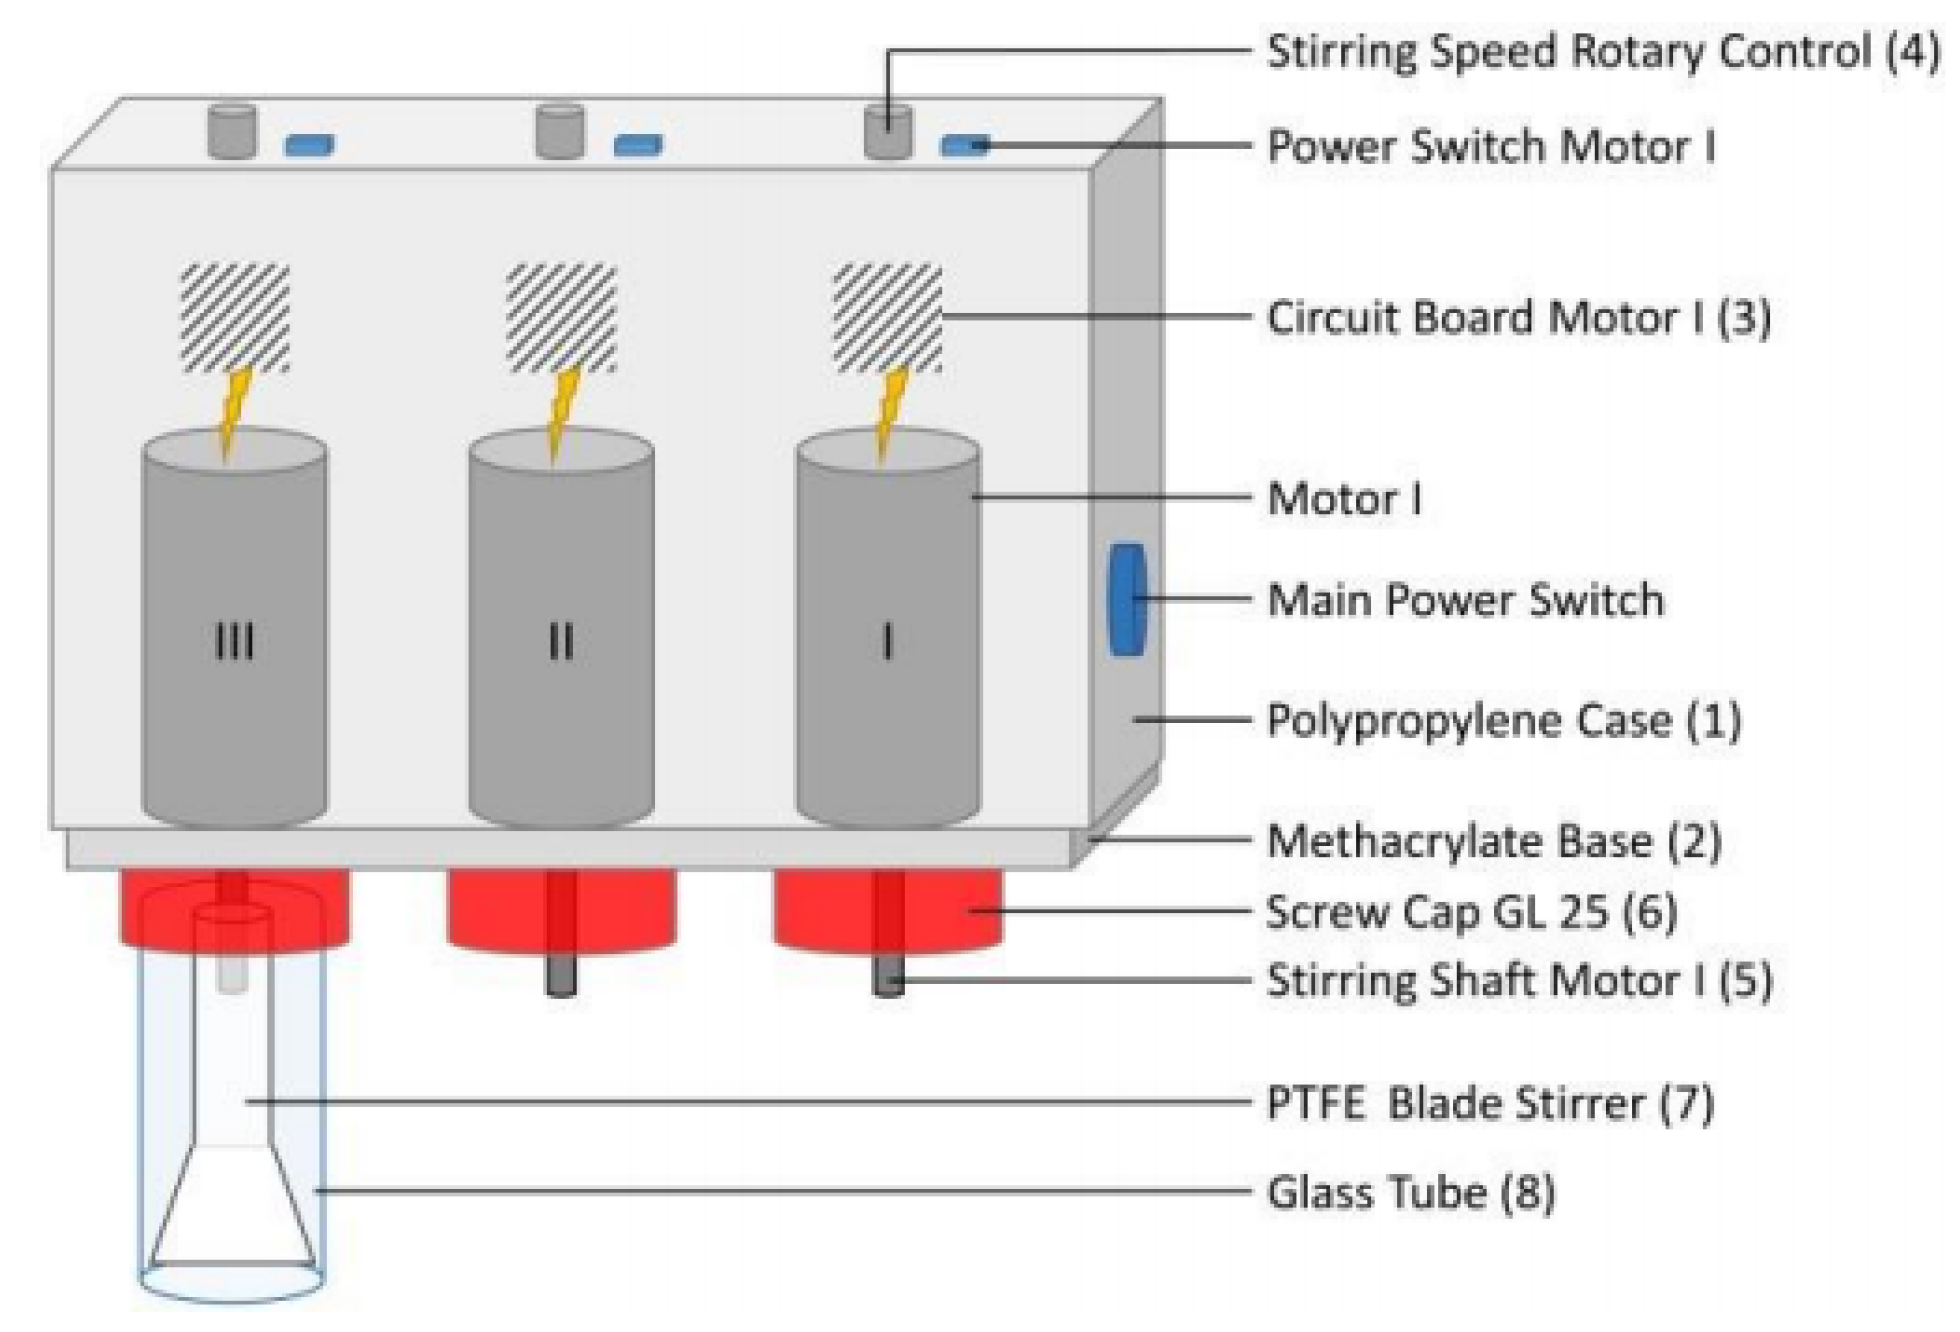
  • The excellent calculated correlation coefficients (R2) were satisfactory and show the importance of using dedicated dissolution equipment and a consistent dissolution protocol, and both ensure reproducible results as argued elsewhere [15];
  • Regarding the aprotic ILs, C3OMeImAcO showed a larger decrease of MCC-m% than AlBzMe2AcO as a function of increasing χDMSO, from 0.6 to 0.8. As discussed elsewhere [21], the oxygen atom of the C3O- moiety is a Lewis base, capable of forming intramolecular hydrogen bonds with C2-H of the imidazolium ring, in addition to intermolecular bonds with the hydroxyl groups of the AGU. It is possible that the efficiency of intermolecular hydrogen bonding is impaired at higher T due to the concomitant large increase of entropy;
  • To test the robustness of these correlations, we calculated MCC-m% under conditions other than those employed to generate the statistical models, and also determined the concentration of dissolved MCC experimentally. Table 3 shows the excellent agreement between the predicted and experimental values with the difference ranging between 0.7% and 6.2%. Entry 4 is interesting because the temperature employed was outside the T range investigated.
  • Many authors used solvatochromic parameters to assess the efficiency of Cel solvents. In this regard we note:
    We used ET(WB) because values of λmax of the corresponding solvatochromic peak showed a much larger dependence on the experimental conditions than other probes employed for calculation of, for example, Lewis basicity (SB; S = solvent). Consider the following values of Δλmax of WB that we observed for CB/TMGHAcO-DMSO on changing χDMSO from 0.4 → 0.8: 10 nm (T = 40 °C) and 16.7 nm (T = 60 °C). The corresponding Δλmax for N,N-dimethyl-4-nitroaniline (one of the homomorphic pair employed to calculate SB) were 0.1 nm (T = 40 °C) and 0.6 nm (T = 60 °C). In the present case, therefore, WB is much more sensitive to changes in the experimental variables than other solvatochromic probes that are used to calculate specific Cel-solvent interactions. Note that empirical solvent polarity is related to the parameters that describe the specific solute–solvent interactions by Equation (5) [22,23,24,25,26,27,28,29,30,31,32]:
    ET(probe) = ET(probe)0 + a SA + b SB + d SD + p SP
    where SB is as defined before; SA, SD, and SP refer to Lewis acidity, dipolarity, and polarizability, respectively. That is, the dependence of ET(probe) on the experimental variables reflects collectively the dependence (on the same variables) of hydrogen bonding (as given by SA and SB) and the hydrophobic interactions (related to SP). These two mechanisms of Cel–solvent interactions are central to dissolution of the biopolymer [33,34].
    ET(probe) is, however, a dependent variable, i.e., its value is determined by T and χDMSO. Indeed, correlations of the values of ET(WB) listed in the footer of Table 1(d) with T at fixed χDMSO and with χDMSO at fixed T (correlations not listed) show perfect second-order polynomials with R2 = 1. Therefore, it is possible, in principle, to use ET(WB) instead of T or χDMSO in Table 2, because the medium empirical polarity is strongly correlated with the independent variables studied. The relevant point, however, is that there is theoretical and experimental ground for using ET(probe) to assess the efficiency of cellulose solvents.

4. Conclusions

Optimization of the physical dissolution of cellulose is important for its applications. The approach of one-at-a-time variation of the experimental variables does not guarantee reaching a true dissolution maximum. Equally important, however, it gives no indication about the relative importance (to Cel dissolution) of the experimental variables. That is, chemometrics should be employed as shown here for the first time. Using a specially constructed mechanical stirrer and an established dissolution protocol that ensures reproducibility of the results, we investigated the effects of temperature and BM composition on MCC dissolution. Dimethyl sulfoxide was used as a co-solvent for aprotic AlBzMe2AcO and C3OMeImAcO and protic DBUHAcO and TMGHAcO ILs. Both IL types have potential industrial application in cellulose regeneration/recycling. Using factorial design with repetitions of the central and peripherical points, we carried out 16 experiments for each IL–DMSO mixture and used a quadratic model to fit the MCC dissolution data. The Pareto plots indicated that both experimental variables were important, and the response surface showed that maximum MCC dissolution occurred at 80 °C and a χDMSO of approximately 0.6. The robustness of the statistical model was evidenced by the high correlation coefficients and by the small differences between predicted (by the model) and experimentally determined MCC-m%. Thus, use of chemometrics allows quantification of the relative importance of the experimental variables. Equally important, however, this use saves time, labor, and material.

Supplementary Materials

The following are available online. Figure S1: 1H NMR spectra of the ionic liquids synthesized. All spectra (Varian Inova model YH300 spectrometer; 300 MHz for 1H; all ILs were dissolved in CDCl3). The spectra are for allylbenzyldimethylammonium acetate (AlBzMe2NAcO), A; 1-(2-methoxyethyl)-3-methylimidazolium acetate (C3OMeImAcO), B; 1,8-diazabicyclo[5.4.0]undec-7-ene-8-ium acetate (DBUHAcO), C; and tetramethylguanidinium acetate (TMGHAcO), D; Table S1 Experimental factorial planning 32, and experiment repetitions.

Author Contributions

All authors contributed to the work reported herein. All authors have read and agreed to the published version of the manuscript.

Funding

O.A.E.S. and T.R.L.C.P. thank FAPESP (São Paulo State Research Foundation) for financial support (grants 2014/22136-4, 2018/08782-1 and 2019/16491-0, respectively) and CNPq (National Council for Research) for research grants (306108/2019-4 and 305605/2017-8, respectively). M.T.D. thanks FAPESP for an undergraduate research fellowship (grant 2019/02928-7). T.A.B. thanks CAPES (Federal Agency for Graduate Studies) for a PhD fellowship (grant 88882.328217/2019-01; code 001).

Conflicts of Interest

The authors declare no conflict of interest.

List of Abbreviations and Acronyms

AGUAnhydroglucose unit
AlBzMe2NAcOAllylbenzyldimethylammonium acetate
BMBinary mixture of solvents
CBCellobiose
CelCellulose
DBUAHcO1,8-Diazabicyclo[5.4.0]undec-7-ene-8-ium acetate
DMSODimethyl sulfoxide
ILIonic liquid
MCCMicrocrystalline cellulose
TMGHAcOTetramethylguanidinium acetate
ET(WB)Empirical polarity of the medium in kcal/mole, calculated from the UV-Vis spectra of the solvatochromic probe 2,6-dichloro-4-(2,4,6-triphenylpyridinium-1-yl)phenolate (WB)
SALewis acidity of the medium
SBLewis basicity of the medium
SDMedium dipolarity
SPMedium polarizability
C3OMeImAcO1-(2-methoxyethyl)-3-methylimidazolium acetate

References

  1. Zhang, J.; Wu, J.; Yu, J.; Zhang, X.; He, J.; Zhang, J. Application of ionic liquids for dissolving cellulose and fabricating cellulose-based materials: State of the art and future trends. Mater. Chem. Front. 2017, 1, 1273–1290. [Google Scholar] [CrossRef]
  2. Hermanutz, F.; Vocht, M.P.; Panzier, N.; Buchmeiser, M.R. Processing of Cellulose Using Ionic Liquids. Macromol. Mater. Eng. 2018, 302. [Google Scholar] [CrossRef] [Green Version]
  3. Reyes, G.; Aguayo, M.G.; Fernández-Pérez, A.; Pääkkönen, T.; Gacitúa, W.; Rojas, O.J. Dissolution and Hydrolysis of Bleached Kraft Pulp Using Ionic Liquids. Polymers 2019, 11, 673. [Google Scholar] [CrossRef] [PubMed]
  4. El Seoud, O.A.; Kostag, M.; Jedvert, K.; Malek, N.I. Cellulose Regeneration and Chemical Recycling: Closing the “Cellulose Gap” Using Environmentally Benign Solvents. Macromol. Mater. Eng. 2020, 305. [Google Scholar] [CrossRef]
  5. Kostag, M.; Gericke, M.; Heinze, T.; El Seoud, O.A. Twenty-five years of cellulose chemistry: Innovations in the dissolution of the biopolymer and its transformation into esters and ethers. Cellulose 2019, 26, 139–184. [Google Scholar] [CrossRef]
  6. El Seoud, O.A.; Koschella, A.; Fidale, L.C.; Dorn, A.S.; Heinze, T. Applications of Ionic Liquids in Carbohydrate Chemistry: A Window of Opportunities. Biomacromolecules 2007, 8, 2629–2647. [Google Scholar] [CrossRef]
  7. Heinze, T.; El Seoud, O.A.; Koschella, A. Cellulose Activation and Dissolution. In Cellulose Derivatives; Springer: Cham, Switzerland, 2018; pp. 173–257. ISBN 978-3-319-73168-1. [Google Scholar]
  8. Fidale, L.C.; Ruiz, N.; Heinze, T.; El Seoud, O.A. Cellulose Swelling by Aprotic and Protic Solvents: What are the Similarities and Differences? Macromol. Chem. Phys. 2008, 209, 1240–1254. [Google Scholar] [CrossRef]
  9. Gericke, M.; Fardim, P.; Heinze, T. Ionic Liquids—Promising but Challenging Solvents for Homogeneous Derivatization of Cellulose. Molecule 2012, 17, 7458–7502. [Google Scholar] [CrossRef] [Green Version]
  10. Huang, Y.-B.; Xin, P.-P.; Li, J.-X.; Shao, Y.-Y.; Huang, C.; Pan, H. Room-Temperature Dissolution and Mechanistic Investigation of Cellulose in a Tetra-Butylammonium Acetate/Dimethyl Sulfoxide System. ACS Sustain. Chem. Eng. 2016, 4, 2286–2294. [Google Scholar] [CrossRef]
  11. Idström, A.; Gentile, L.; Gubitosi, M.; Olsson, C.; Stenqvist, B.; Lund, M.; Bergquist, K.-E.; Olsson, U.; Köhnke, T.; Bialik, E. On the dissolution of cellulose in tetrabutylammonium acetate/dimethyl sulfoxide: A frustrated solvent. Cellulose 2017, 24, 3645–3657. [Google Scholar] [CrossRef]
  12. Kostag, M.; Jedvert, K.; Achtel, C.; Heinze, T.; El Seoud, O.A. Recent Advances in Solvents for the Dissolution, Shaping and Derivatization of Cellulose: Quaternary Ammonium Electrolytes and their Solutions in Water and Molecular Solvents. Molecules 2018, 23, 511. [Google Scholar] [CrossRef] [Green Version]
  13. Kostag, M.; Pires, P.A.R.; El Seoud, O.A. Dependence of cellulose dissolution in quaternary ammonium acetates/DMSO on the molecular structure of the electrolyte: Use of solvatochromism, micro-calorimetry, and molecular dynamics simulations. Cellulose 2020, 27, 3565–3580. [Google Scholar] [CrossRef]
  14. Montgomery, D.C. Design and Analysis of Experiments, 8th ed.; Wiley: Hoboken, NJ, USA, 2013; pp. 233, 394, 478. ISBN 978-1118-14692-7. [Google Scholar]
  15. Kostag, M.; Dignani, M.T.; Lourenço, M.C.; Bioni, T.D.A.; El Seoud, O.A. Assessing cellulose dissolution efficiency in solvent systems based on a robust experimental quantification protocol and enthalpy data. Holzforschung 2019, 73, 1103–1112. [Google Scholar] [CrossRef]
  16. Hauru, L.K.J.; Hummel, M.; King, A.W.T.; Kilpeläinen, I.; Sixta, H. Role of Solvent Parameters in the Regeneration of Cellulose from Ionic Liquid Solutions. Biomacromolecules 2012, 13, 2896–2905. [Google Scholar] [CrossRef] [PubMed]
  17. Parviainen, A.; King, A.; Mutikainen, I.; Hummel, M.; Selg, C.; Hauru, L.K.J.; Sixta, H.; Kilpeläinen, I. Predicting Cellulose Solvating Capabilities of Acid-Base Conjugate Ionic Liquids. ChemSusChem 2013, 6, 2161–2169. [Google Scholar] [CrossRef]
  18. NBR ISO 5351:2012. Brazilian Association of Technical Norms (ABNT). In Pulps—Determination of Limiting Viscosity Number in Cupri-Ethylenediamine (CED) Solution; Brazilian Standards: Rio de Janeiro, Brazil, 2012.
  19. Kostag, M.; El Seoud, O.A. Dependence of cellulose dissolution in quaternary ammonium-based ionic liquids/DMSO on the molecular structure of the electrolyte. Carbohydr. Polym. 2019, 205, 524–532. [Google Scholar] [CrossRef]
  20. El Seoud, O.A.; Da Silva, V.C.; Possidonio, S.; Casarano, R.; Arêas, E.P.G.; Gimenes, P. Microwave-Assisted Derivatization of Cellulose, 2—The Surprising Effect of the Structure of Ionic Liquids on the Dissolution and Acylation of the Biopolymer. Macromol. Chem. Phys. 2011, 212, 2541–2550. [Google Scholar] [CrossRef]
  21. De Jesus, J.C.; Pires, P.A.R.; Mustafa, R.; Riaz, N.; El Seoud, O.A. Experimental and theoretical studies on solvation in aqueous solutions of ionic liquids carrying different side chains: The n-butyl-group versus the methoxyethyl group. RSC Adv. 2017, 7, 15952–15963. [Google Scholar] [CrossRef] [Green Version]
  22. Reichardt, C.; Welton, T. Solvents and Solvent Effects in Organic Chemistry, 4th ed.; Updated and Enlarged Edition; Wiley: Hoboken, NJ, USA, 2010; pp. 425–508. ISBN 978-3-527-32473-6. [Google Scholar]
  23. De Oliveira, H.F.N.; Rinaldi, R. Understanding Cellulose Dissolution: Energetics of Interactions of Ionic Liquids and Cellobiose Revealed by Solution Microcalorimetry. ChemSusChem 2015, 8, 1577–1584. [Google Scholar] [CrossRef]
  24. Lan, G.; Zhang, C.; Lu, B.; Yu, K.; Liu, J.; Kang, H.; Liu, R.; Lan, G. Cellobiose as a model compound for cellulose to study the interactions in cellulose/lithium chloride/N-methyl-2-pyrrolidone systems. Cellulose 2017, 24, 1621–1629. [Google Scholar] [CrossRef]
  25. Weissman, S.A.; Anderson, N.G. Design of Experiments (DoE) and Process Optimization. A Review of Recent Publications. Org. Process. Res. Dev. 2015, 19, 1605–1633. [Google Scholar] [CrossRef]
  26. Lendrem, D.; Owen, M.; Godbert, S. DOE (Design of Experiments) in Development Chemistry: Potential Obstacles. Org. Process. Res. Dev. 2001, 5, 324–327. [Google Scholar] [CrossRef]
  27. Bei, D.; Marszalek, J.M.; Youan, B.-B.C. Formulation of Dacarbazine-loaded Cubosomes—Part II: Influence of Process Parameters. AAPS PharmSciTech 2009, 10, 1040–1047. [Google Scholar] [CrossRef] [PubMed] [Green Version]
  28. Khuri, A.I.; Cornell, J.A. Response Surfaces: Designs and Analyses, 2nd ed.; CRC Press: Boca Raton, FL, USA, 1996; pp. 1, 107. ISBN 9780367401252. [Google Scholar]
  29. Minnick, D.L.; Flores, R.A.; DeStefano, M.R.; Scurto, A.M. Cellulose Solubility in Ionic Liquid Mixtures: Temperature, Cosolvent, and Antisolvent Effects. J. Phys. Chem. B 2016, 120, 7906–7919. [Google Scholar] [CrossRef] [PubMed]
  30. Tomimatsu, Y.; Suetsugu, H.; Yoshimura, Y.; Shimizu, A. The solubility of cellulose in binary mixtures of ionic liquids and dimethyl sulfoxide: Influence of the anion. J. Mol. Liq. 2019, 278, 120–126. [Google Scholar] [CrossRef]
  31. El Seoud, O.A.; Kostag, M.; Jedvert, K.; Malek, N.I. Cellulose in Ionic Liquids and Alkaline Solutions: Advances in the Mechanisms of Biopolymer Dissolution and Regeneration. Polymers 2019, 11, 1917. [Google Scholar] [CrossRef] [Green Version]
  32. Catalán, J. Toward a Generalized Treatment of the Solvent Effect Based on Four Empirical Scales: Dipolarity (SdP, a New Scale), Polarizability (SP), Acidity (SA), and Basicity (SB) of the Medium. J. Phys. Chem. B 2009, 113, 5951–5960. [Google Scholar] [CrossRef]
  33. Lindman, B.; Karlström, G.; Stigsson, L. On the mechanism of dissolution of cellulose. J. Mol. Liq. 2010, 156, 76–81. [Google Scholar] [CrossRef]
  34. Lindman, B.; Medronho, B.; Alves, L.; Costa, C.; Edlund, H.; Norgren, M. The relevance of structural features of cellulose and its interactions to dissolution, regeneration, gelation and plasticization phenomena. Phys. Chem. Chem. Phys. 2017, 19, 23704–23718. [Google Scholar] [CrossRef] [Green Version]
Figure 1. Molecular structures of the ionic liquids (ILs) employed, including: (a) allylbenzyldimethylammonium acetate (AlBzMe2NAcO); (b) 1-(2-methoxyethyl)-3-methylimidazolium acetate (C3OMeImAcO); (c) 1,8-diazabicyclo[5.4.0]undec-7-ene-8-ium acetate (DBUHAcO); (d) tetramethylguanidinium acetate (TMGHAcO).
Molecules 25 05975 g001
Figure 2. Schematic representation of the equipment employed for the quantification of cellulose dissolution. The equipment parts included: mini-motors with controlled rotation speed connected to a PTFE blade through a screw cap. Dissolution occurs in a glass tube equipped with a thread. The glass tubes are immersed in a controlled temperature water bath [15].
Molecules 25 05975 g002
Figure 3. Flow chart for the steps of the cellulose dissolution experiment. Microcrystalline cellulose, (MCC); dimethyl sulfoxide, (DMSO).
Molecules 25 05975 g003
Figure 4. View of MCC dissolution using a polarized-light microscope: (A) complete and (B) partial cellulose dissolution.
Molecules 25 05975 g004
Figure 5. Pareto charts for the relative importance to cellulose dissolution of the temperature (T) and the mole fraction of DMSO (χDMSO). The analysis was carried out by applying a quadratic model to MCC-m% dissolution data.
Molecules 25 05975 g005
Figure 6. Response–surface plots for the dependence of the mass fraction of dissolved Cel (MCC-m%) on T and (χDMSO). The color codes (green → yellow → red → deep red) indicate the increase of MCC-m% as a function of increasing the experimental variable.
Molecules 25 05975 g006
Table 1. Dependence of the dissolution of microcrystalline cellulose (MCC) in IL/DMSO binary mixtures on the molecular structure of the IL, the temperature, and the mole fraction of DMSO in the starting binary solvent a.
AlBzMe2NAcOC3OMeImAcODBUHAcOTMGHAcO
Temperature (°C)χDMSOMCC-m% bMCC-χ bMCC-m% bMCC-χ bMCC-m% bMCC-χ bMCC-m% bMCC-χ b
400.40.0 c,d0.0 14.5 c,d13.70.0 c,d0.0 1.3 c,d1.1
400.40.0 c0.0 c14.813.80.0 c0.0 c1.41.1
600.42.62.518.016.93.22.94.53.8
800.44.04.322.020.85.85.47.46.3
800.44.34.522.221.05.55.07.16.0
400.66.25.515.312.42.21.73.42.4
600.69.38.219.916.27.55.96.95.1
600.69.68.419.015.47.66.16.74.9
600.69.58.519.916.37.66.16.95.1
600.69.68.419.015.47.96.27.05.1
800.612.811.323.519.48.76.95.43.9
400.810.37.27.04.51.91.21.40.8
400.810.07.06.74.31.40.91.40.8
600.89.36.413.08.72.91.81.91.1
800.810.27.115.010.14.12.73.42.0
800.810.07.215.810.64.02.63.42.0
a Abbreviations: AlBzMe2NAcO, allylbenzyldimethylammonium acetate; C3OMeImAcO, 1-(2-methoxyethyl)-3-methylimidazolium acetate; DBUAHcO, 1,8-diazabicyclo[5.4.0]undec-7-ene-8-ium acetate; TMGAHcO, tetramethylguanidinium acetate; DMSO, dimethyl sulfoxide; IL, ionic liquid; MCC, microcrystalline cellulose. b MCC-m% is the percentage mass fraction of dissolved cellulose = (cellulose mass/(cellulose mass + mass of (LI+DMSO)) × 100. MCC-χ is the mole fraction of dissolved cellulose, calculated as hydroglucose units = (number of AGU moles/(number of AGU moles + number of IL moles + number of DMSO moles)). Based on the results of the central points for which we had more data points, we calculated the uncertainty from: ((MCC-m%)maximum − (MCC-m%)minimum/(MCC-m%)maximum ) × 100. The following are the uncertainties calculated: 3%, AlBzMe2NAcO; 4.5%, C3OMeImAcO; 5%, DBUHAcO; 4.3%, TMGHAcO. c In this experiment, MCC did not dissolve completely after the first biopolymer addition, after 3 h. d The following calculated values of the medium empirical polarity (cellobiose + IL + DMSO) and ET(WB) are listed in the following order: ionic liquid, temperature, and ET(WB) in kcal/mol for χDMSO = 0.4, 0.6, and 0.8, respectively. AlBzMe2NAcO: 40 °C, 57.2, 56.8, 56.4; 60 °C, 56.4, 56.0, 55.5; 80 °C, 55.1, 54.8, 54.4. C3OMeImAcO: 40 °C, 59.9, 59.0, 57.4; 60 °C, 58.2, 57.5, 56.3; 80 °C, 55.2, 54.5, 53.3. DBUHAcO: 40 °C, 57.7, 57.5, 57.2; 60 °C, 56.7, 56.4, 55.8; 80 °C, 55.0, 54.8, 54.5. TMGHAcO: 40 °C, 58.4, 58.2, 57.5; 60 °C, 58.2, 57.8, 57.2; 80 °C, 57.8, 57.3, 56.8.
Table 2. Regression equations for the dependence of the concentration of dissolved cellulose on the temperature (T) and the mole fraction of DMSO (χDMSO).
Dependence of MCC-m% on T and χDMSO
EntryIonic Liquid R2 a
1AlBzMe2AcOMCC-m% = −0.59 + 5.23 T + 0.46 T2 + 23.63 (χDMSO) − 13.94 (χDMSO)2 − 4.20 T × (χDMSO)0.946
2C3OMeImAcOMCC-m% = 14.38 + 9.57 T − 2.10 T2 + 10.18 (χDMSO) − 17.20 (χDMSO)2 + 1.10 T × (χDMSO)0.986
3DBUHAcOMCC-m% = −0.65 + 10.54 T − 4.08 T2 + 15.04 (χDMSO) − 13.49 (χDMSO)2 − 3.25 T × (χDMSO)0.936
4TMGHAcOMCC-m% = +1.43 + 9.35 T − 4.09 T2 + 8.25 (χDMSO) − 8.49 (χDMSO)2 − 3.90 T × (χDMSO)0.883
Dependence of MCC-χ on T and χDMSO
EntryIonic Liquid R2 a
5AlBzMe2AcOMCC-χ = −0.45 + 5.33 T + 0.30 T2 + 21.78 (χDMSO) − 15.05 (χDMSO)2 − 4.46 T × (χDMSO)0.944
6C3OMeImAcOMCC-χ = 13.51 + 8.39 T − 1.14 T2 + 4.36 (χDMSO) − 13.14 (χDMSO)2 + 1.20 T × (χDMSO)0.992
7DBUHAcOMCC-χ = −0.43 + 8.48 T − 2.70 T2 + 12.23 (χDMSO) − 10.80 (χDMSO)2 −4.20 T × (χDMSO)0.933
8TMGHAcOMCC-χ = +1.18 + 7.82 T − 3.29 T2 + 5.19 (χDMSO) − 5.69 (χDMSO)2 − 3.80 T × (χDMSO)0.903
aR2 is the regression correlation coefficient.
Table 3. Comparison of predicted and experimental cellulose dissolution data a.
EntryIonic LiquidVariable Employed(WT%) Calculated(WT%) ExperimentalΔwt%
1AlBzMe2NAcO60 °C/0.70 χDMSO10.410.0−4.0
2AlBzMe2NAcO55 °C/0.50 χDMSO6.15.8−5.1
3C3OMeImAcO70 °C/0.80 χDMSO14.214.1−0.7
4C3OMeImAcO35 °C/0.30 χDMSO10.511.04.5
5DBUHAcO55 °C/0.70 χDMSO5.55.85.2
6DBUHAcO70 °C/0.50 χDMSO7.37.52.7
7TMGHAcO55 °C/0.50 χDMSO5.55.2−5.8
8TMGHAcO80 °C/0.70 χDMSO5.14.8−6.2
a MCC was used in all experiments. Δwt% = ((Experimental MCC-m% − predicted MCC-m%)/Experimental MCC-m%) × 100.
Sample Availability: Samples of the compounds are not available from the authors.
Publisher’s Note: MDPI stays neutral with regard to jurisdictional claims in published maps and institutional affiliations.

