Article

Quality Evaluation of Gastrodia Elata Tubers Based on HPLC Fingerprint Analyses and Quantitative Analysis of Multi-Components by Single Marker

1
Faculty of Life Science and Technology, Kunming University of Science and Technology, Kunming 650500, China
2
School of Pharmacy, China Pharmaceutical University, Nanjing 210009, China
3
Yunnan Key Laboratory of Panax notoginseng, Kunming University of Science and Technology, Kunming 650500, China
4
Institute of Biology Leiden, Leiden University, 2333BE Leiden, The Netherlands
*
Author to whom correspondence should be addressed.
These authors contributed equally to this work.
Molecules 2019, 24(8), 1521; https://doi.org/10.3390/molecules24081521
Submission received: 24 February 2019 / Revised: 13 April 2019 / Accepted: 15 April 2019 / Published: 17 April 2019

Abstract

:
Gastrodia elata (G. elata) tuber is a valuable herbal medicine used to treat many diseases. The procedure of establishing a reasonable and feasible quality assessment method for G. elata tuber is important to ensure its clinical safety and efficacy. In this research, an effective and comprehensive evaluation method for assessing the quality of G. elata has been developed, based on the analysis of high performance liquid chromatography (HPLC) fingerprint, combined with the quantitative analysis of multi-components by single marker (QAMS) method. The contents of the seven components, including gastrodin, p-hydroxybenzyl alcohol, p-hydroxy benzaldehyde, parishin A, parishin B, parishin C, and parishin E were determined, simultaneously, using gastrodin as the reference standard. The results demonstrated that there was no significant difference between the QAMS method and the traditional external standard method (ESM) (p > 0.05, RSD < 4.79%), suggesting that QAMS was a reliable and convenient method for the content determination of multiple components, especially when there is a shortage of reference substances. In conclusion, this strategy could be beneficial for simplifying the processes in the quality control of G. elata tuber and giving references to promote the quality standards of herbal medicines.

1. Introduction

Gastrodia elata (G. elata) Blume is a traditional medicinal herb that has been used in oriental countries, for centuries, to treat general paralysis, headaches, dizziness, rheumatism, convulsion, and epilepsy [1,2]. Modern pharmacological studies have demonstrated that the extracts of G. elata tuber and some compounds that originate from it, possesses wide-reaching biological activities, including anti-tumor, anti-virus, memory-improving, anti-oxidation, and anti-aging actions [3,4,5]. Nowadays, it is also widely used as a sub-material in food and Chinese Patent Medicines (CPM) [6], and this herbal medicine is also listed as one of the functional foods approved by the Ministry of Health in China [7,8]. As the wild G. elata is not sufficient enough for commercial large-scale exploitation, its artificial cultivation in medicine has become essential, to meet the increasing requirement of markers [6]. Due to their high medicinal value, G. elata tubers have been cultivated and produced in many areas of Asia, like China and Korea, which could lead to great differences in quality and, possibly, could lead to differences in the following clinical efficacies. Many studies have indicated that the efficacy and quality of herbal medicines are somewhat different depending on the cultivation soil and climate, based on the geographic origin, even when coming from the same species [9,10]. Therefore, a reasonable and effective method for the quality evaluation of G. elata tuber, plays an important role in its medication safety.
Gastrodin and its aglycone (p-hydroxybenzyl alcohol) are major components of the G. elata tuber, which are also markers for the quality control of this herbal medicine [11]. However, over 81 compounds from G. elata tuber have been currently isolated and identified. Along with the above two marker components, others like p-hydroxy benzaldehyde, parishin A, parishin B, parishin C, parishin E, and so on have also been reported to be correlated with the bioeffects of the G. elata tuber [12,13]. Accordingly, a qualitative analysis and quantification of one or two compounds, could be insufficient for a complete profile of the chemical characterization of the G. elata tuber, due to its complex compositions. In recent years, the chromatographic fingerprint analysis has been accepted as a strategy for the quality assessment of herbal medicines and preparations by the US Food and Drug Administration [14], State Food and Drug Administration of China [15], and the European Medicines Agency [16]. Since the fingerprint is characterized by more chemical information, the method is often used for the origin identification, species authentication, and quality control for herbal medicines, by observing the presence or absence of a limited number of peaks in the chromatographic fingerprints [17,18]. Therefore, the fingerprint analysis of high performance liquid chromatography (HPLC) was developed for the qualitative analysis of G. elata tuber.
A single standard to determine multiple components, also known as the quantitative analysis of multi-components by single marker (QAMS) [19], is a novel method designed for the quality evaluation of herbal medicines and related products [20]. Researchers have used QAMS to determine three components in Fructus Evodiae, simultaneously, by using rutaecarpine as the internal reference compound to calculate the relative correction factor of evodin and evodiamine [21]. To make up for the limitations of the fingerprint which cannot be quantified accurately, a QAMS method using berberine as the standard, was developed and validated for a simultaneous quantitative analysis of fourteen components [22]. This strategy could not only reduce the cost of the experiment and time of detection but could also be independent of the availability of all target ingredients [19]. Thus, the QAMS method was applied for a quantitative analysis of G. elata tuber.
This study aimed to establish a reliable and practical method, realizing both qualitative and quantitative analyses for G. elata tuber, via HPLC fingerprinting, combined with QAMS. The differences and similarities of the HPLC fingerprints were visually compared, using a hierarchical cluster analysis (HCA) and similarity analysis. The contents of seven major active constituents were accurately determined by both the QAMS method and external standard method (ESM), through which we hoped to offer a suitable and efficient approach for assessing the quality of G. elata tuber.

2. Results and Discussion

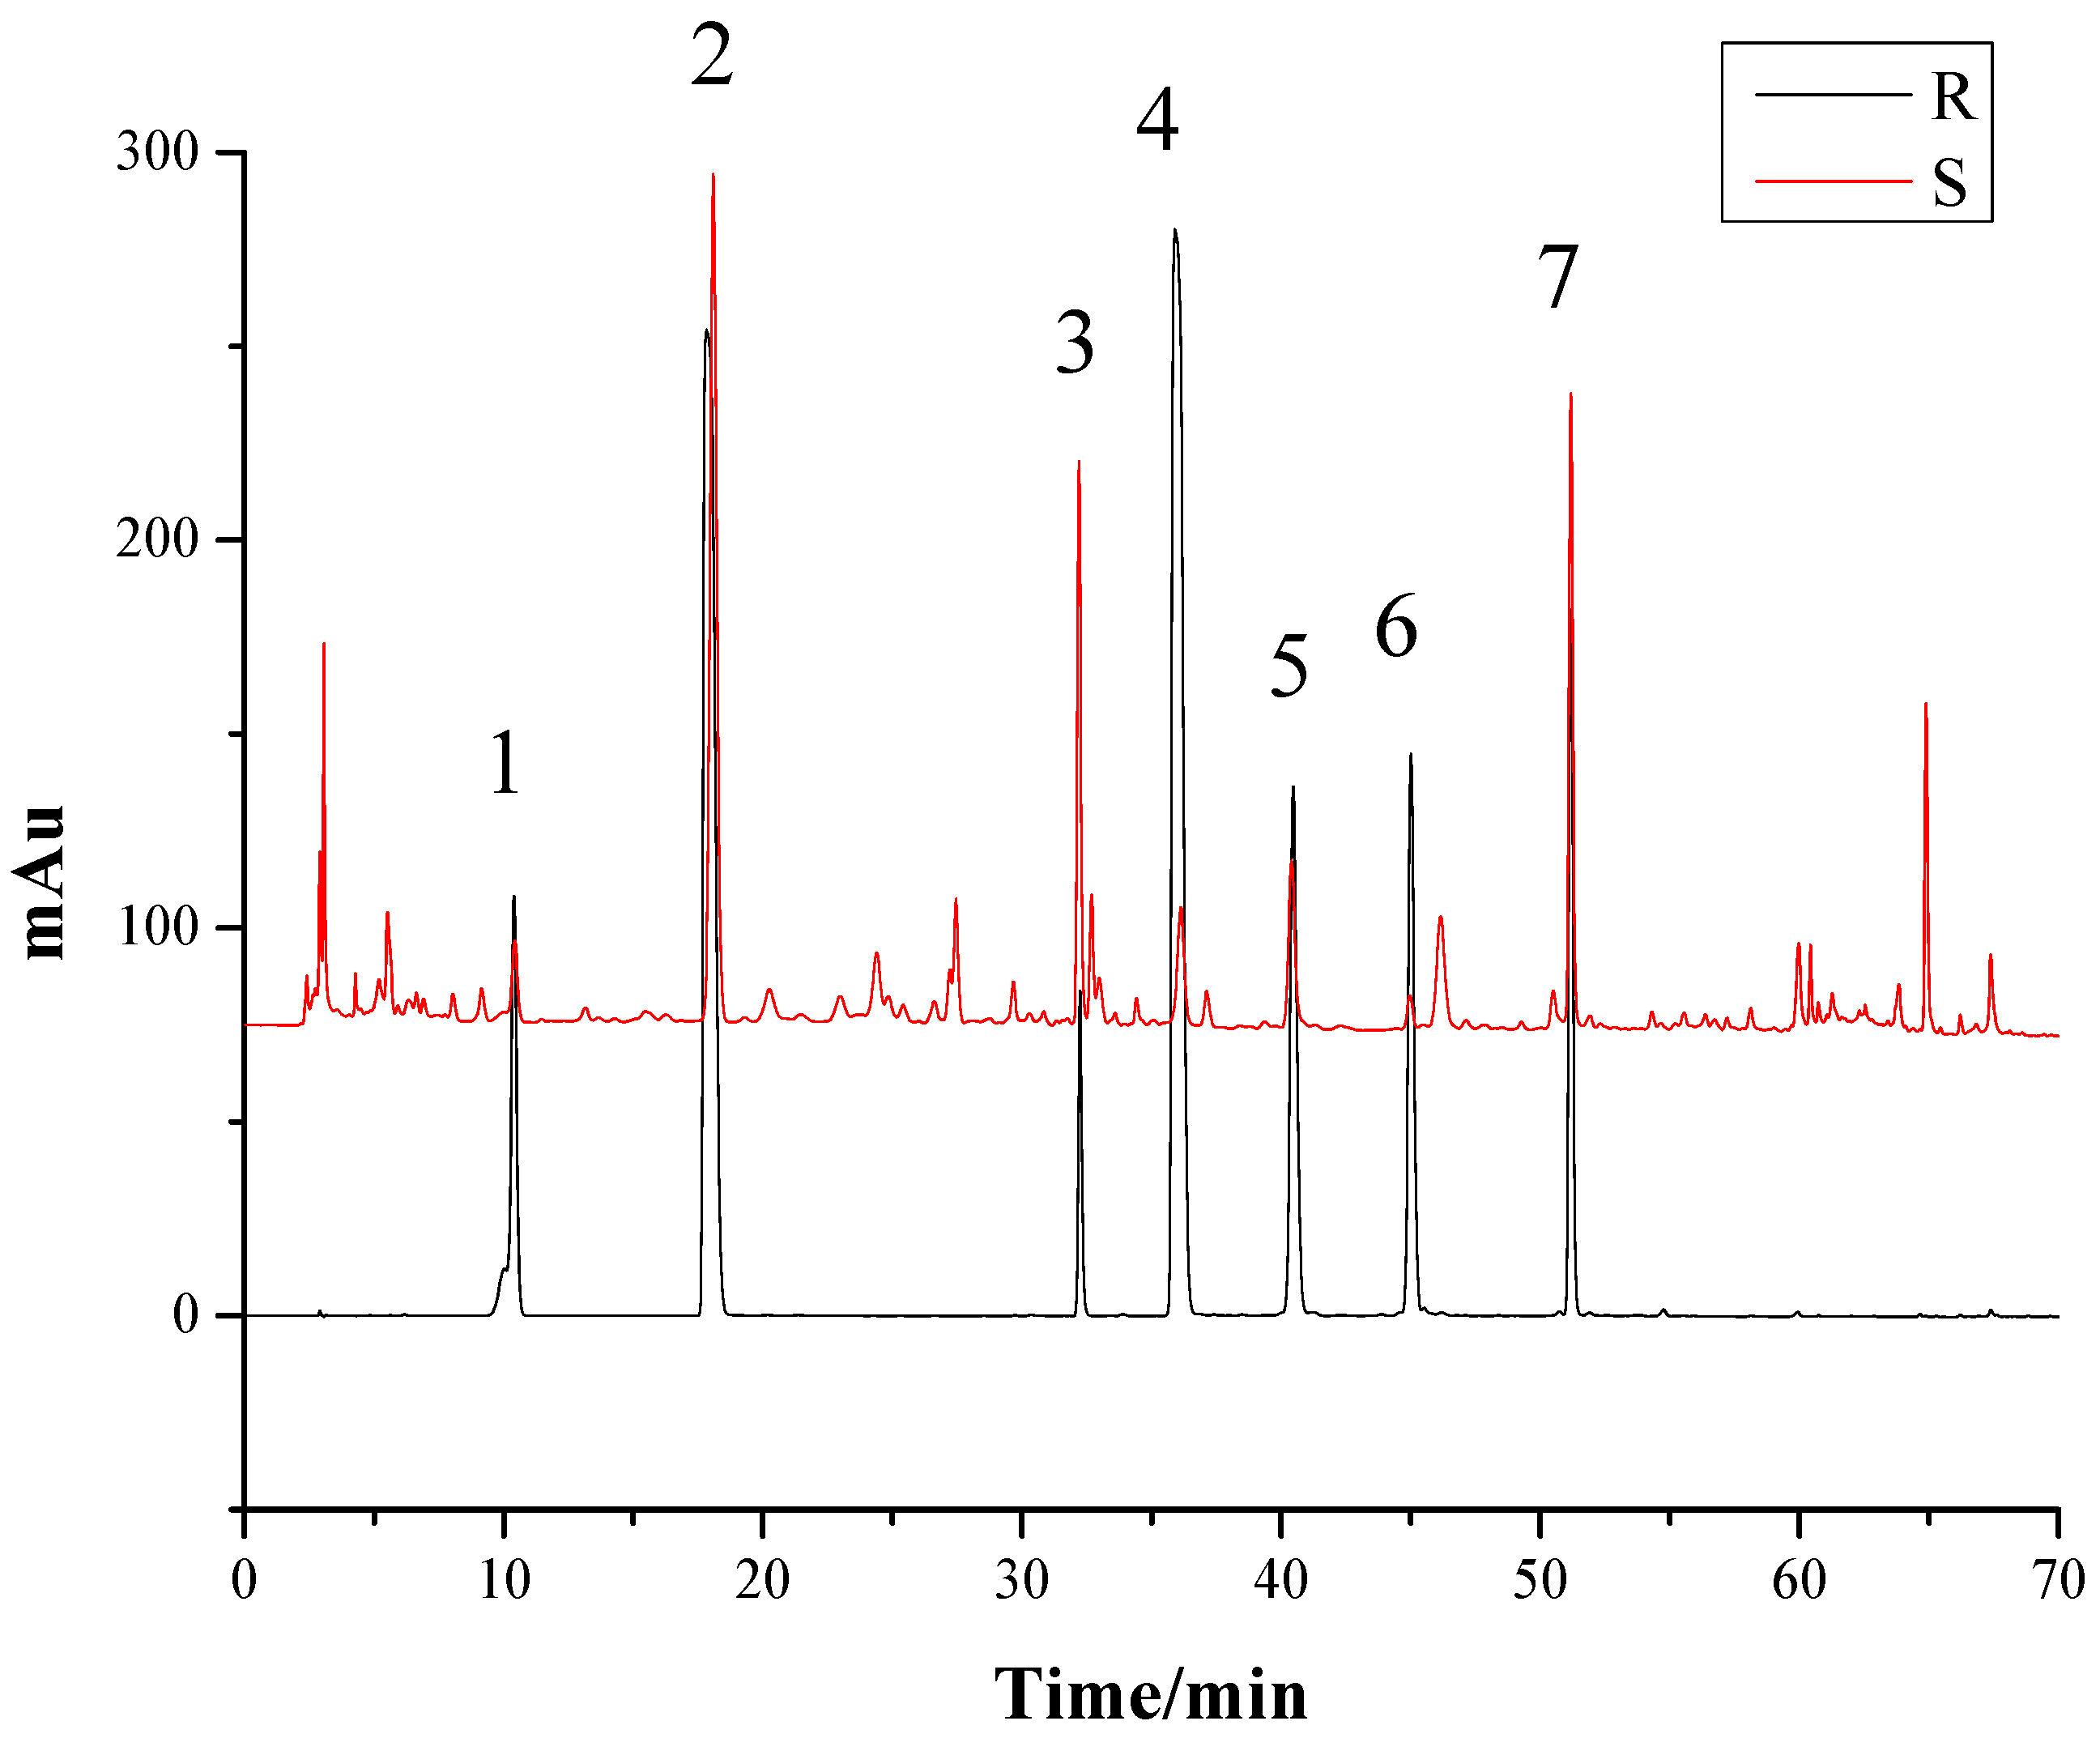
2.1. Optimization of the Chromatographic Conditions

As the components of G. elata tuber are very intricate, it is critical to optimize the chromatographic conditions, including favorable mobile phase systems, gradient elution systems, and the detection wavelength, to obtain an efficient separation of the target components. Lei [23] indicated that the HPLC fingerprints of G. elata tubers were the most informative, while the UV wavelength was 220 nm from HPLC-DAD-3D spectrum of G. elata tuber. So in this case, we chose the UV wavelength of 220 nm, to determinate the selected components. We chose acetonitrile-water containing 0.1% phosphoric acid system. The samples were dissolved in 60% methanol and ultrasound, for 60 min. We optimized the gradient elution system as Section 3.5, and 35 °C was selected as the proper temperature for analysis, while the flow rate was set at 1.0 mL/min. The S1 sample of G. elata tuber and the mixed standards containing seven reference substances were analyzed to obtain the HPLC fingerprints (Figure 1) under the conditions of Section 3.5, producing sharp and symmetrical chromatographic peak shapes, good separation, and preventing the peak tailing.
According to the retention time of each peak in the chromatogram [24], the peaks of 1, 2, 3, 4, 5, 6, and 7 were identified to be gastrodin, p-hydroxybenzyl alcohol, parishin E, p-hydroxy benzaldehyde, parishin B, parishin C, and parishin A. The separation degree of each peak was greater than 1.5, in the present HPLC system, indicating the peaks were well-separated, under the chromatographic conditions.

2.2. Method Validation

2.2.1. Linearity

The mixed reference solution containing all the reference substances was diluted in series, with 60% methanol, to obtain six different concentrations for the seven reference curves. The linearity of each analyte was assessed by plotting its calibration curve with different concentrations and the corresponding peak areas. The results were shown in Table 1. The high correlation coefficient values indicated that there was a good correlation between the concentration and peak area of the seven compounds, at a relatively wide range of concentrations. The correlation coefficient of more than 0.9990, indicated a satisfactory linearity. The calibration curve could be utilized for the quantitative analysis in the given concentration range. The standard solution of the individual analyte was diluted gradually, to determine its Limit of Detection (LOD) and Limit of Quantity (LOQ) with signal-to-noise ratio of 3:1 and 10:1, respectively. LOD and LOQ values for the analytes are also listed in Table 1.

2.2.2. Precision, Stability, Repeatability, and Accuracy

The precision was evaluated according to the assay of S1, in which the solution was analyzed for six times in a day, to evaluate the intra-day precision, and was analyzed on three consecutive days, to evaluate the inter-day precision. Calculating the RSDs of each chromatographic peak, the results showed that the RSDs of gastrodin, p-hydroxybenzyl alcohol, parishin E, p-hydroxy benzaldehyde, parishin B, parishin C, and parishin A were 1.93%, 1.10%, 1.29%, 2.30%, 2.03%, 2.63%, and 0.89% (n = 6), respectively, indicating that the precision of the method was good.
The stability was tested with the S1 solution that was stored at room temperature (25 ± 5 °C) and analyzed at 0, 2, 4, 6, 8, 12, and 24 h, to calculate the RSDs. The results showed that the RSDs of gastrodin, p-hydroxybenzyl alcohol, parishin E, p-hydroxy benzaldehyde, parishin B, parishin C, and parishin A were 1.15%, 2.04%, 1.51%, 2.37%, 2.10%, 1.12%, and 2.25%, respectively, suggesting that the method was stable within 24 h.
In the repeatability test, six duplicates of S1 were extracted and analyzed, according to the sample preparation procedure, and the HPLC method. The RSDs of the peak areas were calculated. The results showed that the RSDs of gastrodin, p-hydroxybenzyl alcohol, parishin E, p-hydroxy benzaldehyde, parishin B, parishin C, and parishin A were 1.25%, 2.15%, 1.60%, 1.81%, 1.72%, 1.84%, and 1.60% (n = 6), respectively, indicating that the repeatability of the method was good.
In the accuracy test, certain amounts of the seven analytes’ standards were added to the G. elata tuber samples (S1), with the six replicates. Then, these seven mixed samples were treated, as in the method described above. Recovery rate was used as the evaluation index and calculated as Recovery rate (%) = (Found amount − Known amount) × 100%/Added amount. The RSD of the accuracy values of the seven components are shown in Table 2, respectively.
The HPLC method was validated in terms of precision, repeatability, stability, and accuracy, as shown in Table 2. The RSD of the precision values of the seven components were less than 2.63%. RSD values for the stability and the repeatability were less than 2.37% and 2.15%, respectively. The recovery rates of the analytes ranged from 91.80% to 98.05%, with the RSD values being lower than 2.90%. All results indicated that the developed method was stable, accurate, and repeatable. This established HPLC method could be applied for a simultaneous determination of gastrodin, p-hydroxybenzyl alcohol, parishin E, p-hydroxy benzaldehyde, parishin B, parishin C, and parishin A, in the G. elata tuber samples.

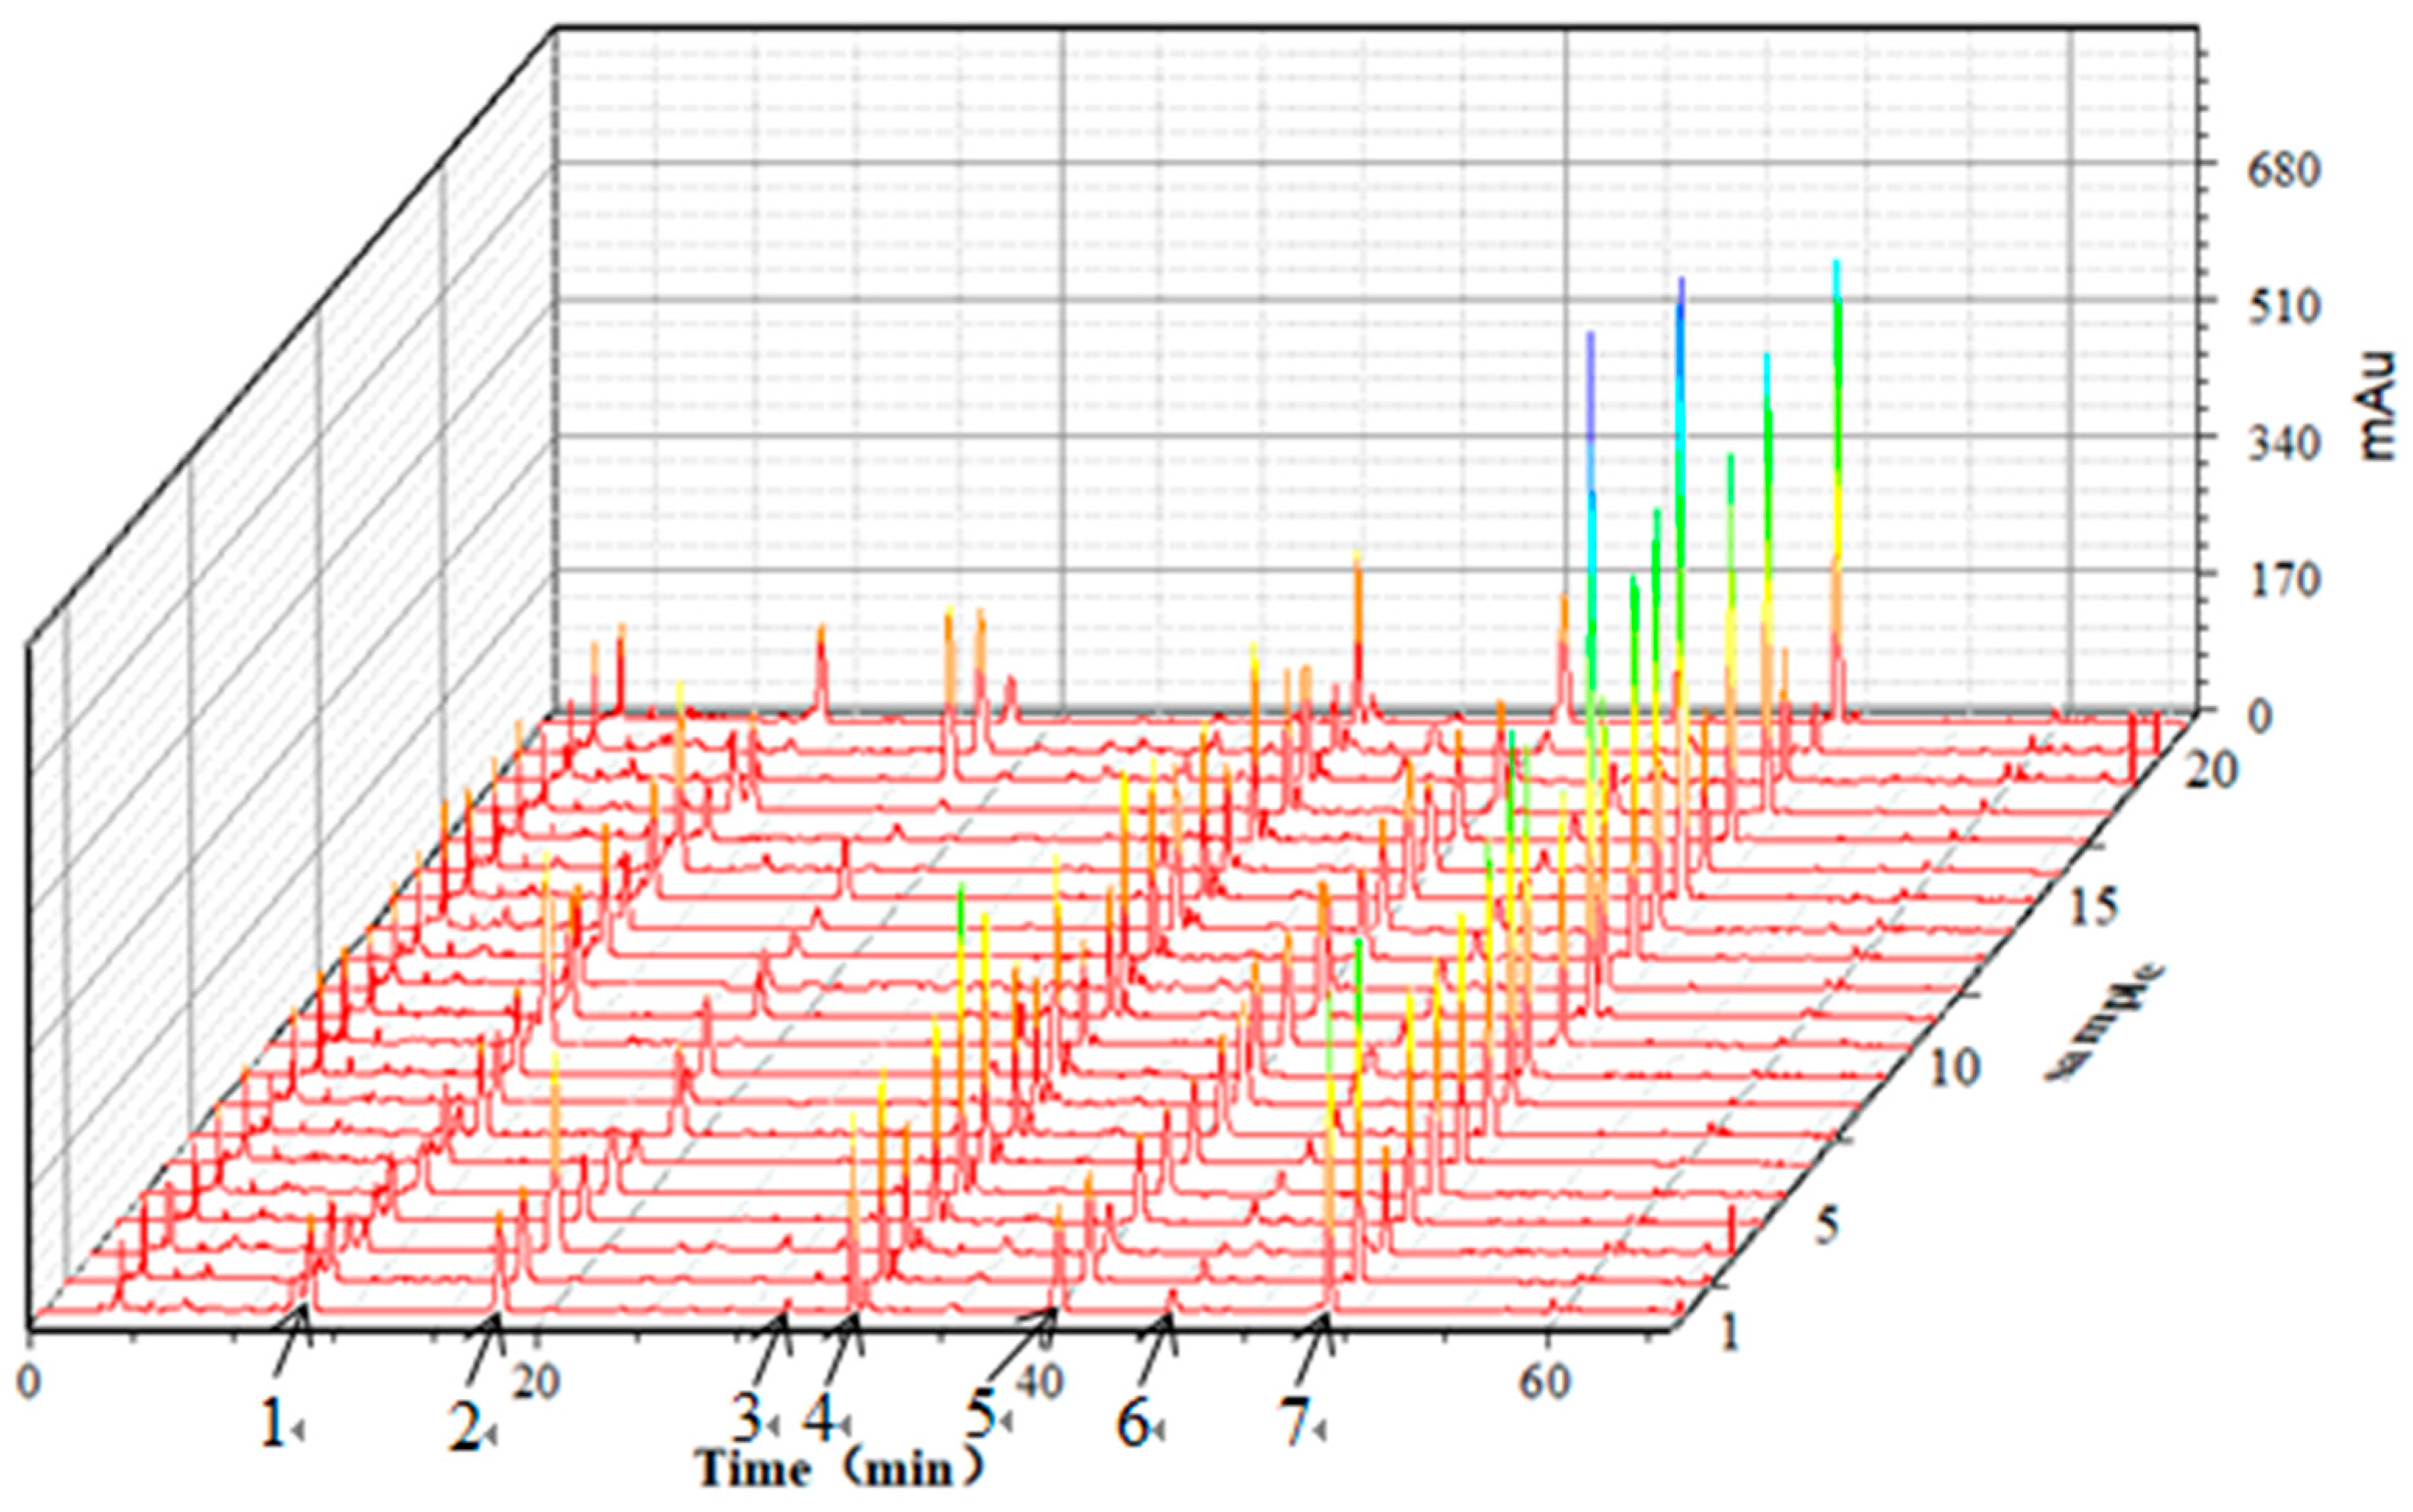
2.3. HPLC Fingerprints Analysis

The 21 batches of G. elata tuber samples from the different producing areas were prepared according to Section 3.3, and 10 μL of S1 sample solution was injected into the HPLC system according to the chromatographic conditions in Section 3.5, to obtain the fingerprints. The retention time was the horizontal axis and the peak area was the vertical axis; the 3D fingerprints of the 21 batches of G. elata tuber samples were established by the software Origin 9.0, as shown in Figure 2.
According to Figure 2, the seven peaks with stable and better shape were determined to be the major ones for the HPLC fingerprints of G. elata tubers. The peak areas of the seven peaks are shown in Table 3. The variance coefficients of the peak area were greater than 32.2 percent, indicating that the content of each marker component varied greatly from place to place.

2.4. Similarity Analysis

According to the data of HPLC fingerprints in Figure 2, the similarity of HPLC fingerprints from the different producing regions were evaluated using the Similarity Evaluation System for chromatographic fingerprint of traditional Chinese medicines (TCM) (Version 2012), with correlation coefficient (median) on behalf of the similarity of HPLC fingerprints. We utilized the average correlation coefficient method of 21 batches of the samples for the multipoint correction, and the time window width was set to 0.5 [25], while the establishment of a common model was to generate a control fingerprints of the G. elata tuber. Compared with the reference fingerprint chromatogram (R), the similarities of the 21 batches of samples were higher than 0.96, indicating that the batch-to-batch consistency was good. The results suggested that those samples of G. elata tuber had a similar chemical composition, and the samples were collected from the same genus, even though they were from different producing countries or were produced under different processing conditions (Table 4). Therefore, the developed fingerprint by HPLC could be used as a practical tool for the qualitative identification of the G. elata tuber.

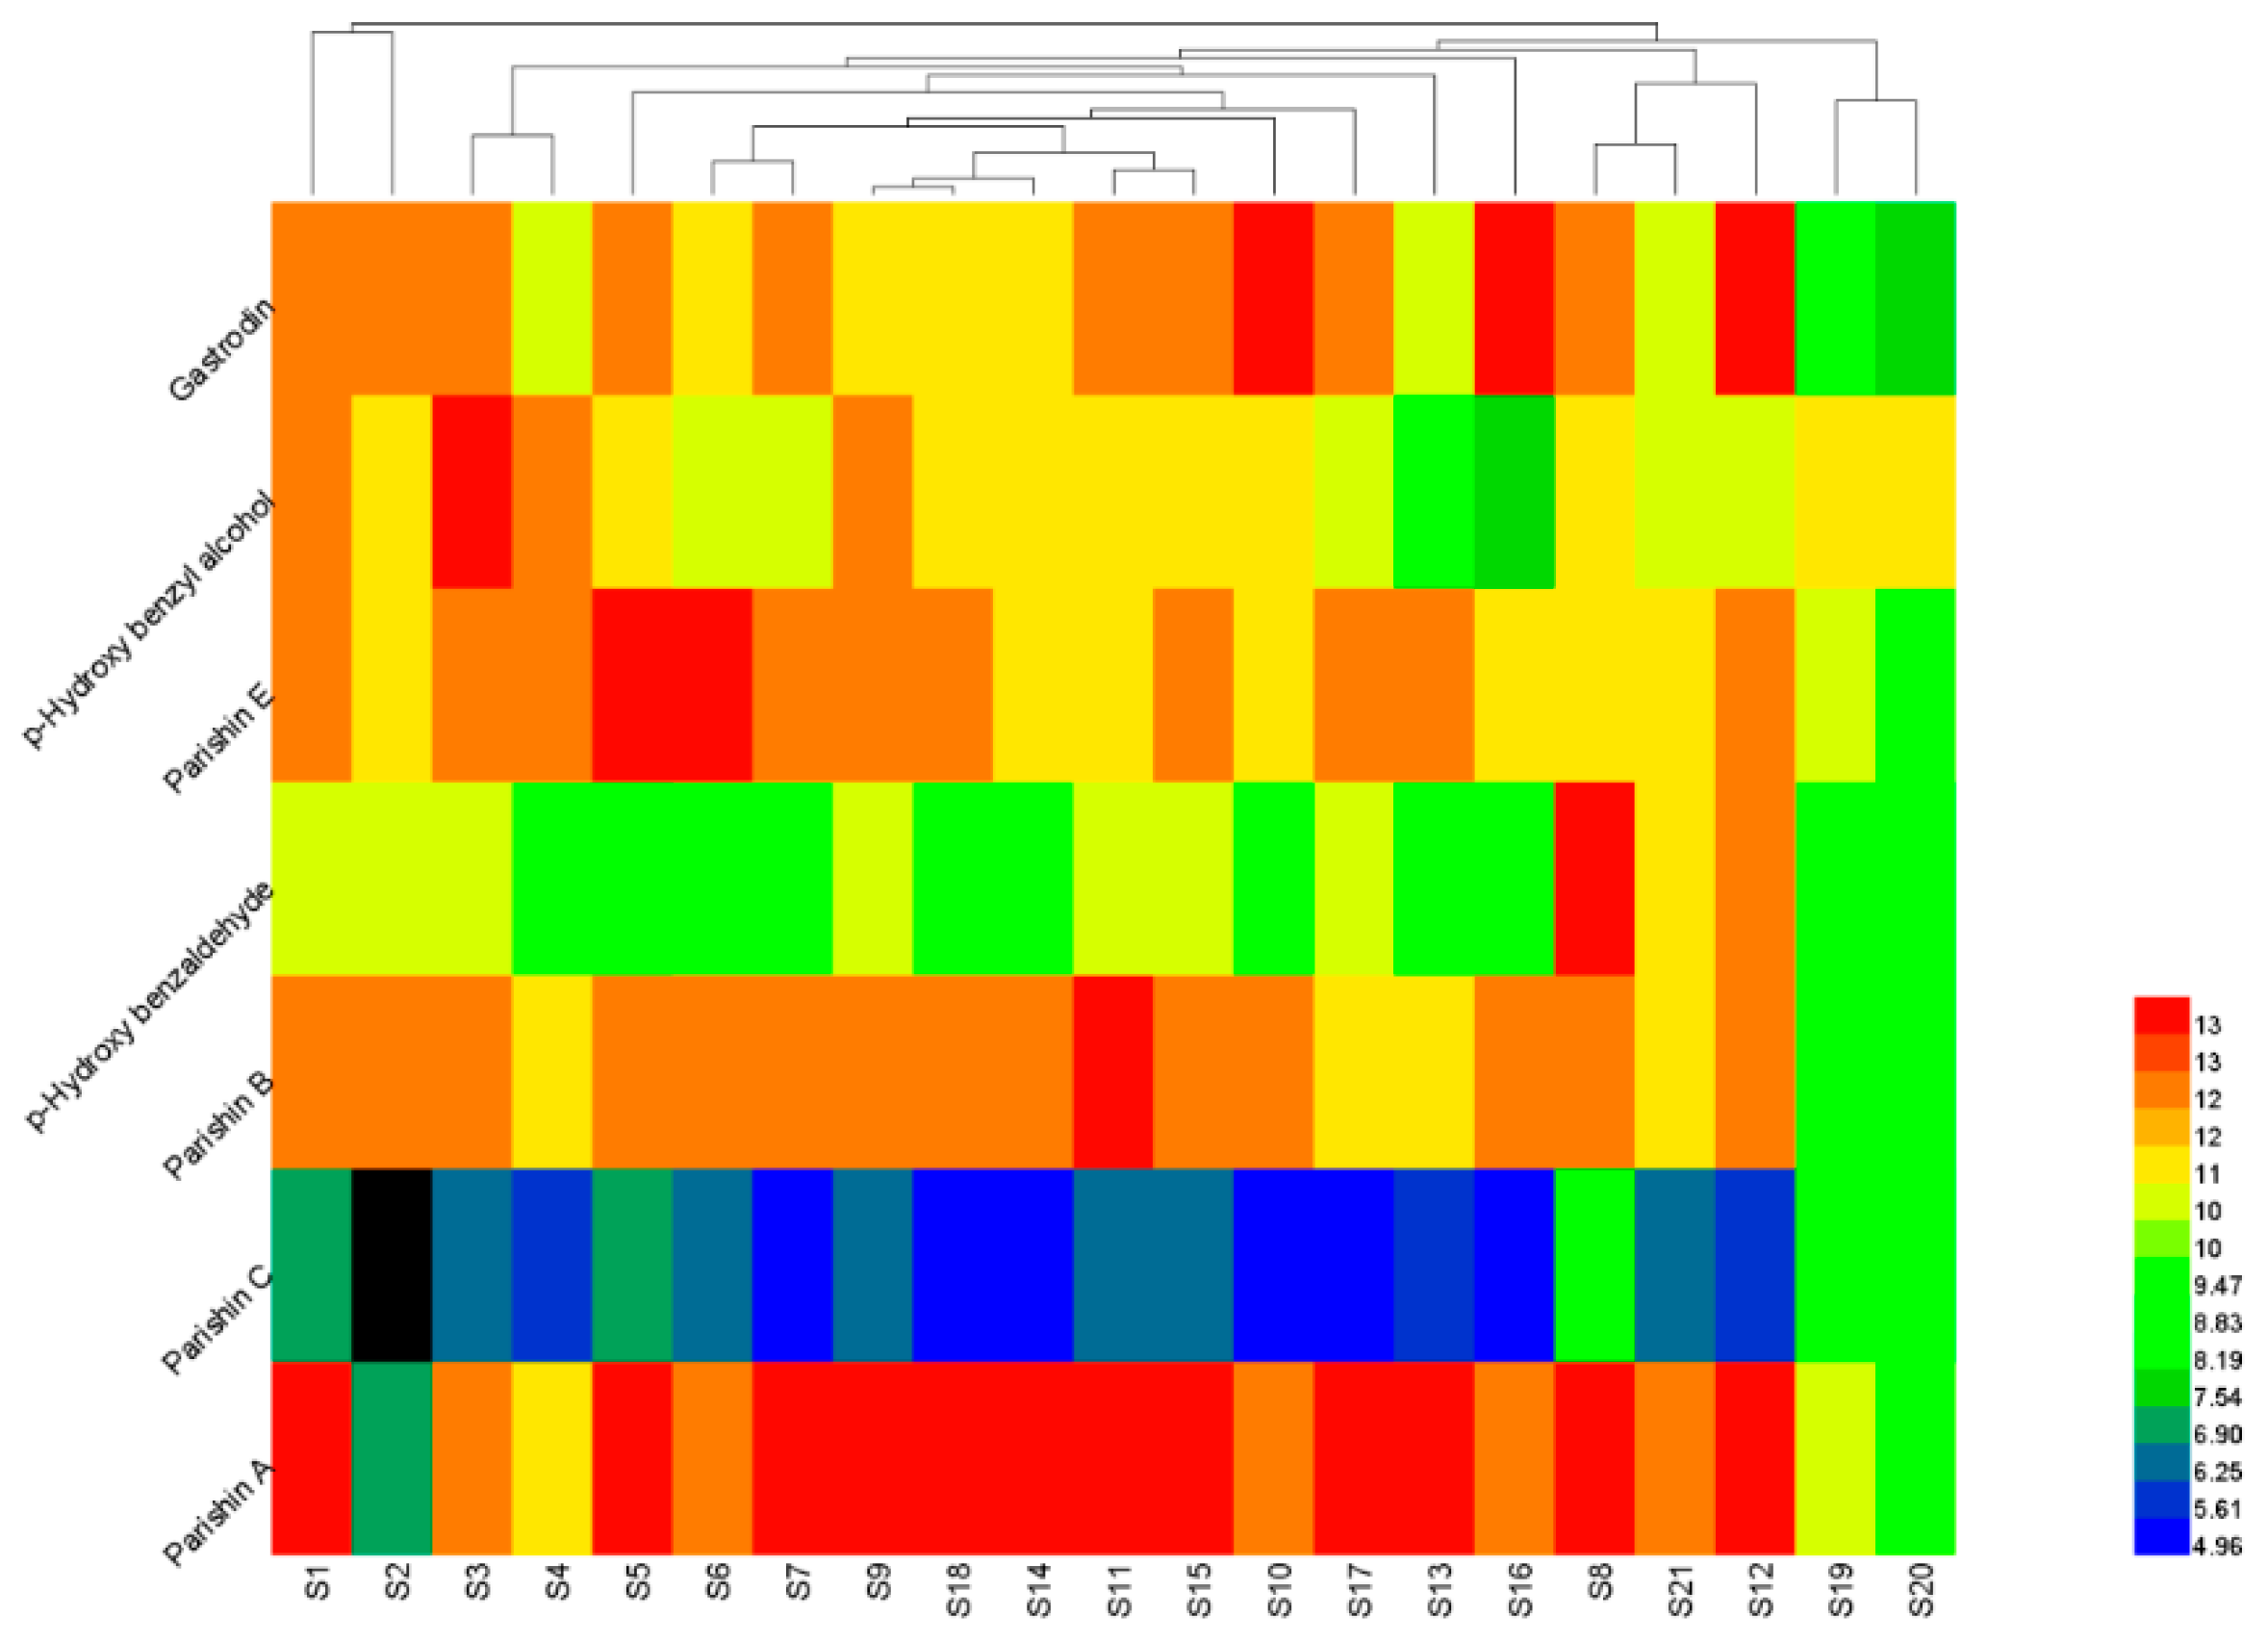
2.5. Hierarchical Cluster Analysis (HCA)

Using the peak areas of the seven compounds from the 21 G. elata tuber samples as the clustering variable, the HCA of the standardized data was performed with the heat map software of Heml 1.0. The graph in Figure 3 illustrated that the samples could be categorized into three groups. Group 1 contained S1 and S2 from Zhaotong, Yunnan in China; Group 2 contained S19 and S20 tubers from South Korea; and Group 3 contained the rest of samples. From the result, the samples from the same producing area were not always classified into the same group. For example, Zhaotong has been considered as the Daodi production area (area which produces authentic and superior medicinal materials) of the G. elata tuber in China. However, samples 1 to 6 from Zhaotong, showed different levels and ratios of chemical components, which could be due to the variations in harvesting time, planting patterns, dying methods, and other factors. Additionally, the preliminary processing method also contributes to the differences in the chemical composition. For instance, G. elata tubers and slices from South Korea were classified into different categories. Therefore, it is insufficient to determine the quality of the G. elata tubers by only their producing areas or any other single factor. Although the HCA could be used to classify the G. elata tubers on the basis of the peak areas of the seven components, it was hard to tell which group had a better quality. Therefore, other methods for the quantitative analysis of G. elata tubers should be developed, to reflect the quality difference.

2.6. Quantitative Analysis of Multiple Components by Single Marker

Theoretically, the quantity (mass or concentration) of an analyte is in direct proportion of the detector response. Then, in multi-component quantitation, a typical botanical compound (readily available) might be selected as an internal standard and the relative correction factor (RCF) of this marker, and the other components can be calculated.

2.6.1. Calculation of RCFs

It is of vital importance to select a proper internal referring standard for the accurate assay of multiple components in TCM. The component chosen as the internal referring substance should be stable, easily obtainable, and have relatively clear pharmacologic effects related to the clinical efficacy of the herbal medicine [26]. In this work, the gastrodin was used as an internal referring substance for its easy availability, lower cost, moderate retention value, and good stability.
In order to simultaneously determine the contents of the seven components in the G. elata tuber, by using the QAMS method, the relative correction factors (RCFs, fx) were first determined, according to the ratio of the peak areas and the ratio of the concentration between the gastrodin and other compounds, as described in Section 3.6. We calculated the RCFs of six components (shown in Table 5).

2.6.2. Results from the QAMS Method

After preparing the sample solutions of G. elata tubers, they were injected into the HPLC system to obtain the peak areas. The contents of seven compounds were calculated, according to the calibration curves. Those scattered in the vicinity of the lowest concentration point on the standard curve were determined with a one point ESM. Meanwhile, the contents of the seven components of the G. elata tuber calculated according to QAMS method, are shown in Table 6.
The validated traditional ESM and QAMS method were employed to test the 21 batches of G. elata tuber samples from the different producing areas, which were based on the principle of the linear relationship between a detector response and the levels of components within certain concentration ranges. The validation of the QAMS method might be implemented, based on t-test, correlation coefficient [27], RSD [28], and relative error [29], through a comparison with an external standard. Correlation coefficient, as a statistical parameter, ranging from 0 (no correlation) to 1 (complete correlation), reflecting the closeness of two variables, is often used in similarity assessments of traditional Chinese medicine fingerprints [30]. As shown in Table 7, Correlation coefficients of the assay results obtained from the two methods were calculated here; all coefficients were found to be >0.998. The data showed that the results of the two methods were highly correlated. Then, a t-test was performed for the calculated results, by the QAMS method, and the on detected results, by an external standard method. p-values of gastrodin, p-hydroxy benzyl alcohol, parishin E, p-hydroxy benzaldehyde, parishin B, parishin C and parishin A, were all >0.05. The relative error and RSD values were all lower than 5%. Above all, the results indicated that there was no significant difference between the data from the QAMS and the ESM method, indicating that the present QAMS method was reliable for the simultaneous quantification of the seven components of the G. elata tuber.
The results from the QAMS determination of the 21 batches of G. elata tuber samples showed the mean contents of 3.5275 mg·g-1, 0.9060 mg·g−1, and 0.3398 mg·g−1 for gastrodin, p-hydroxy benzyl alcohol, and p-hydroxy benzaldehyde; and 3.6511 mg·g−1, 9.5303 mg·g−1, 2.7901 mg·g−1, and 0.1766 mg·g−1 for the parishin E, parishin A, parishin B, and parishin C, respectively (Table 4). It was obvious that parishin A is one of the most abundant components in G. elata tuber, thus, is well-deserved as a reference substance and index for quality assessment and control of the G. elata tuber. Obvious inter-batch content variations could be found for all these components with the mean ranging from 0.1766 mg·g−1 to 9.5303 mg·g−1; these seven components in total averaged 20.7031 mg·g−1 in the G. elata tuber, for the 21 batches of samples. The data in Table 4 shows differences among various samples. To show the clear classification of the G. elata tuber samples, the QAMS method with chemometrics analysis was performed in the subsequent analyses.
Meanwhile, the results (Table 6) illustrated that there were remarkable differences in the contents of the seven components, in G. elata tubers from different regions, which could be attributed to the variations of genetics, plant origins, environmental factors, drying process, storage conditions, and so on. It was obvious that gastrodin is one of the most abundant components in G. elata tuber. Combined with its activities related to the efficacies of G. elata tuber [31], gastrodin is well-deserved as a reference substance and index for quality assessment and control of G. elata tuber.
In the Chinese Pharmacopoeia of 2015 edition, gastrodin and p-hydroxy benzyl alcohol are determined as the marker components for the quality control and evaluation of G. elata tuber. Despite their close correlation with the efficacies of G. elata tuber, gastrodin can transform to p-hydroxybenzyl alcohol, which is the aglycone and metabolite of gastrodin [32]. Fresh G. elata tubers have to be processed before being traded as materia medica in the market. During the steaming process, the change trend of the gastrodin content was often contrary to the one of p-hydroxybenzyl alcohol. When the content of gastrodin was increased, the content of p-hydroxybenzyl alcohol was generally decreased, and vice versa. Additionally, different processing methods will result in different variation of the contents of the two components. Choi et al. [33] applied drying methods of freeze drying, hot air, infrared ray, and steaming, to process G. elata tuber. The results showed that after steaming, the content of gastrodin in G. elata tuber processed by freeze drying was decreased, whereas, the content of p-hydroxybenzyl alcohol was increased. However, tubers processed by hot-air and infrared ray drying showed the opposite results. Such transformations between gastrodin and p-hydroxybenzyl alcohol might be due to the deglycosylation or glycosylation, during the processing. Since the herbal medicine in the global market is often processed or dried by different methods, which results in the fluctuation in the content of single component, it is relatively stable and more comprehensive to reflect on the quality of G. elata tuber by monitoring multiple components, instead of a single one.

3. Materials and Methods

3.1. Plant Material

Samples of G. elata tuber from different producing areas were collected, as shown in Table 8.

3.2. Chemicals

The reference standards of gastrodin (no. B21243, purity HPLC ≥ 98%), p-hydroxybenzyl alcohol (no. B20326, purity HPLC ≥ 98%), p-hydroxy benzaldehyde (no. B20327, purity HPLC ≥ 99%), parishin A (no. BP1063, purity HPLC ≥ 98%), parishin B (no. BP1064, purity HPLC ≥ 98%), parishin C (no. B20913, purity HPLC ≥ 98%), parishin E (no. BP1648, purity HPLC ≥ 98%) were purchased from Sichuan Victory Biological Technology Co., Ltd. (Sichuan, China), and their structures are shown in Figure 4 and Figure 5. Methyl alcohol was purchased from the Tianjin Fengchuan Chemical Reagent Technology Co. Ltd. Acetonitrile (HPLC grade) was purchased from Sigma-Aldrich, Inc. (St. Louis, MO, USA). Phosphoric acid was purchased from the Tianjin JinDongTianZheng Precision Chemical Reagent Factory. Ultrapure water was generated with an UPT-I-20T ultrapure water system (Yunnan Ultrapure Technology, Inc., Yunnan, China). All other chemicals used were of analytical grade.

3.3. Preparation of the Sample Solution

The 21 batches of dried G. elata tubers from different producing areas were crushed by a Wiggling high-speed Chinese medicine shredder, then powdered and sieved through a 40-mesh sieve. The sample solution of G. elata tuber was precisely absorbed (2.0 mg) and immersed in 25 mL volumetric flask, with 60% methanol. Additional 60% methanol was added to compensate for the weight loss after ultrasonic extraction for 60 min, and shaking it well. All solutions were filtered through 0.22 μm filter membranes, before being precisely injected into the HPLC system.

3.4. Reference Solution Preparation

The reference solution of G. elata tuber was prepared by accurately dissolving weighed samples of each compound in 60% methanol, making a mixture of 0.8 mg/mL of parishin A, 0.9 mg/mL of parishin B, 0.5 mg/mL of parishin E, 1.5 mg/mL of p-hydroxy benzaldehyde, 3.4 mg/mL of p-hydroxybenzyl alcohol, 0.9 mg/mL of gastrodin, 1.3 mg/mL of parishin C, mixed evenly. All the standard solutions were stored in a refrigerator at 4 °C, before use.

3.5. Chromatographic Procedures

The HPLC analysis of the G. elata tuber were done on an Agilent 1260 series system (Agilent Technologies, Santa Clara, CA, USA) consisting of a G1311B pump, a G4212B DAD detector, and a G1329B auto-sampler. The YMC-Tyiart C18 column (250 × 4.6 mm, 5 µm) was adopted for the analysis. The mobile phase consisted of A (0.1% phosphate solution) and B (acetonitrile). The gradient mode was as follows: 3–5% B for 0–11 min; 5% B for 11–18 min; 5–14% B for 18–31 min; 14% B for 31–38 min; 14–20% B for 38–48min; 20–24% B for 48–55 min; 24–80% B for 55–75 min; 80–100% B for 75–80 min; 100% B for 80–95 min; 100–70% B for 95–100 min; 70–50% B for 100–105 min; 50–30% B for 105–110 min; 30–3% B for 110–115 min; 3% B for 115–130 min. The flow rate was set at 1.0 mL/min. The detection wavelength was 220 nm. The column temperature was set at 35 °C and sample volume was 10 µL.

3.6. Theory of the QAMS Method

Methods for calculating the RCFs have been previously reported [24,37]. First, gastrodin was selected as the internal standard, and a multipoint method (Equation (1)) was used to calculate the relative correction factors (RCF) for p-hydroxy benzaldehyde, p-hydroxybenzyl alcohol, parishin A, parishin B, parishin E, and parishin C. Then the content of the measured component was calculated according to Equation (2) [38].
The RCFs were calculated using the calibration curves as follows:
f k / s = a k a s
The content of the measured component was calculated as follows:
C k = A k ( A s × f k / s )
where, as is the ratio of the slope of internal standard reference calibration equations; ak is the ratio of the slope of measured component calibration equations; Ak is the peak area of the measured component; and As is the peak area of the internal standard reference [37].
The content of the multi-marker components measured by QAMS was compared with results from ESM, to validate the methods of QAMS.

3.7. Data Analysis

We used the ESM and QAMS to calculate the seven components in 21 batches of G. elata tuber, to verify the feasibility of QAMS. At the same time, HCA was performed using the heat map software of Heml 1.0, to further investigate the difference among the G. elata tuber samples. The data were analyzed and evaluated by the Similarity Evaluation System for the chromatographic fingerprint of TCM (Version 2012), to evaluate similarities of the chromatographic profiles of the G. elata tuber.

4. Conclusions

In this study, the quality assessment method of G. elata tubers were established using QAMS methods, in combination with HPLC fingerprints analyses. The G. elata tubers from different areas were analyzed by HPLC fingerprints and the contents of the seven components in G. elata tuber samples was determined by the QAMS method. On the basis of these results, the quality of G. elata tubers could be quantified and better identified comprehensively by HCA of synthesis and similarity analysis. HPLC fingerprint analyses, combined with the QAMS methods, could be a powerful and reliable way to provide both qualitative insight and quantitative data for comprehensive quality assessment of the complex multi-component systems. QAMS combined with the HPLC fingerprint might offer a holistic phytochemical profile of botanicals, along with similarity analysis and HCA of synthesis, and the quality of G. elata tubers would be evaluated and better and more comprehensively identified. Moreover, in subsequent analyses, it is also necessary to combine the chemical analysis, biological evaluation, pharmacological activity, and other methods to evaluate the quality of G. elata tubers for better studying the clinical effect.

Author Contributions

Y.X. supervised the project and designed the experimental works; Y.L. performed the chemical analyses and wrote the paper; Y.Z., Z.Z., Y.H., and X.C. contributed to sample process and data analyses; Y.X. revised the paper. All authors read and approved the final manuscript.

Funding

This research was funded by Applied Basic Research Key Project of Yunnan (2017ZF005 and 2017ZF001).

Conflicts of Interest

The authors declare no conflict of interest.

Abbreviations

The following abbreviations have been used in this manuscript.
HPLCHigh performance liquid chromatography
QAMSQualitative and quantitative analysis of multi-component by single marker
ESMExternal standard method
RSDRelative standard deviation
HCAHierarchical cluster analysis
TCMTraditional Chinese medicine
RCFRelative correction factor

References

  1. Zhan, H.D.; Zhou, H.Y.; Sui, Y.P.; Du, X.L.; Wang, W.H.; Dai, L.; Sui, F.; Huo, H.R.; Jiang, T.L. The rhizome of Gastrodia elata Blume–An ethnopharmacological review. J. Ethnopharmacol. 2016, 189, 361–385. [Google Scholar] [CrossRef] [PubMed]
  2. Li, Z.F.; Wang, Y.W.; Ouyang, H.; Lu, Y.; Qiu, Y.; Feng, Y.L.; Jiang, H.L.; Zhou, X.; Yang, S.L. A novel dereplication strategy for the identification of two new trace compounds in the extract of Gastrodia elata using UHPLC/Q-TOF-MS/MS. J. Chromatogr. B 2015, 988, 45–52. [Google Scholar] [CrossRef] [PubMed]
  3. Hu, M.; Yan, H.; Fu, Y.; Jiang, Y.; Yao, W.; Yu, S.; Zhang, L.; Wu, Q.; Ding, A.; Shan, M. Optimal extraction study of gastrodin-type components from Gastrodia Elata tubers by response surface design with integrated phytochemical and bioactivity evaluation. Molecules 2019, 24, 547. [Google Scholar] [CrossRef] [PubMed]
  4. Heo, J.C.; Woo, S.U.; Son, M.; Park, J.Y.; Choi, W.S.; Chang, K.T.; Kim, S.U.; Yoon, E.K.; Shin, S.H.; Lee, S.H. Anti-tumor activity of Gastrodia elata Blume is closely associated with a GTP-Ras-dependent pathway. Oncol. Rep. 2007, 18, 849–853. [Google Scholar] [CrossRef]
  5. Hu, Y.H.; Li, C.Y.; Shen, W. Gastrodin alleviates memory deficits and reduces neuropathology in a mouse model of Alzheimer’s disease. Neuropathology 2014, 34, 370–377. [Google Scholar] [CrossRef] [PubMed]
  6. Zuo, Y.; Deng, X.; Wu, Q. Discrimination of gastrodia elata from different geographical origin for quality evaluation using newly-build near infrared spectrum coupled with multivariate analysis. Molecules 2018, 23, 1088. [Google Scholar] [CrossRef]
  7. Zhao, Y.; Kang, Z.J.; Zhou, X.; Yang, S.L. An edible medicinal plant-Gastrodia elata Bl. J. Guizhou Norm. Univ. 2013, 31, 9–12. [Google Scholar]
  8. Kang, C.; Lai, C.J.; Zhao, D.; Zhou, T.; Liu, D.H.; Lv, C.; Wang, S.; Kang, L.; Yang, J.; Zhan, Z.L.; et al. A practical protocol for comprehensive evaluation of sulfur-fumigation of Gastrodia Rhizoma using metabolome and health risk assessment analysis. J. Hazard. Mater. 2017, 340, 221–230. [Google Scholar] [CrossRef] [PubMed]
  9. Zervakis, G.I.; Koutrotsios, G.; Katsaris, P. Composted versus raw olive mill waste as substrates for the production of medicinal mushrooms: An assessment of selected cultivation and quality parameters. Biomed. Res. Int. 2013, 2013, 546830. [Google Scholar] [CrossRef]
  10. Chen, W.C.; Lai, Y.S.; Lu, K.H.; Lin, S.H.; Liao, L.Y.; Ho, C.T.; Sheen, L.Y. Method development and validation for the high-performance liquid chromatography assay of gastrodin in water extracts from different sources of Gastrodia elata Blume. J. Food Drug Anal. 2015, 23, 803–810. [Google Scholar] [CrossRef] [PubMed]
  11. Chinese Pharmacopoeia Commission. Pharmacopoeia of the People’s Republic of China. Part I; Chinese Medical Science and Technology Press: Beijing, China, 2015. [Google Scholar]
  12. Ojemann, L.M.; Nelson, W.L.; Shin, D.S.; Rowe, A.O.; Buchanan, R. Tian ma, an ancient Chinese herb, offers new options for the treatment of epilepsy and other conditions. Epilepsy Behav. 2006, 8, 376–383. [Google Scholar] [CrossRef] [PubMed]
  13. Xie, M.; Sha, M.; Zhai, Q.C.; Yu, H.; Guo, L.; Wei, Y.Q.; Li, Y. Research Progress on Parishins from Gastrodia Elata. Guangdong Chem. Ind. 2016, 22, 93–95. [Google Scholar]
  14. FDA. Guidance for Industry-Botanical Drug Products; U. S. Food and Drug Administration: Silver Spring, MD, USA, 2004.
  15. SFDA. Technical Requirements for Studying Fingerprint of Traditional Chinese Medicine Injections (Draft); Drug Administration Bureau of China: Beijing, China, 2000.
  16. EMEA. Guidance on Quality of Herbal Medicinal Products/Traditional Herbal Medicinal Products; European Medicines Agency: London, UK, 2006.
  17. Cui, L.L.; Zhang, Y.; Shao, W.; Gao, D. Analysis of the HPLC fingerprint and QAMS from Pyrrosia species. Ind. Crop. Prod. 2016, 85, 29–37. [Google Scholar] [CrossRef]
  18. Schaneberg, B.T.; Crockett, S.; Khan, I.A. The role of chemical fingerprinting: Application to Ephedra. Phytochemistry 2003, 62, 911–918. [Google Scholar] [CrossRef]
  19. Bauer, R. Quality criteria and phytopharmaceuticals: Can acceptable drug standards be achieved? Drug Inf. J. 1998, 31, 101–110. [Google Scholar] [CrossRef]
  20. Wang, X.; Tan, Y.; Wang, D.J.; Qing, D.S.; Yao, L.C.; Li, L.Y.; Luo, W.Z. Application and advance of QAMS in quality control of traditional Chinese medicines. Chin. Tradit. Pat. Med. 2016, 38, 395–402. [Google Scholar]
  21. Li, D.W.; Zhu, M.; Shao, Y.D.; Shen, Z.; Weng, C.C.; Yan, W.D. Determination and quality evaluation of green tea extracts through qualitative and quantitative analysis of multi-components by single marker (QAMS). Food Chem. 2016, 197, 1112–1120. [Google Scholar] [CrossRef]
  22. Song, Y.; Wang, Z.; Zhu, J.; Yan, L.; Zhang, Q.; Gong, M.; Wang, W. Assay of evodin, evodiamine and rutaecarpine in Fructus Evodiae by QAMS. Zhongguo Zhong Yao Za Zhi 2009, 34, 2781–2785. [Google Scholar] [PubMed]
  23. Lei, Y.C. Authenticity Identification and Quality Assessment of Gastrodia tuber (Tianma) Based on Chemical Characteristics; Chengdu University of TCM: Chengdu, China, 2015; p. 5. [Google Scholar]
  24. Gao, X.Y.; Jiang, Y.; Lu, J.Q.; Tu, P.F. One single standard substance for the determination of multiple anthraquinone derivatives in rhubarb using high-performance liquid chromatography-diode array detection. J. Chromatogr. A 2009, 1216, 2118–2123. [Google Scholar] [CrossRef]
  25. Peng, Y.; Dong, M.H.; Zou, J.; Liu, Z.H. Analysis of the HPLC Fingerprint and QAMS for Sanhuang Gypsum Sou. J. Anal. Methods Chem. 2018. [Google Scholar] [CrossRef]
  26. Wang, N.; Li, Z.Y.; Zheng, X.L.; Li, Q.; Yang, X.; Xu, H. Quality Assessment of Kumu Injection, a Traditional Chinese Medicine Preparation, Using HPLC Combined with Chemometric Methods and Qualitative and Quantitative Analysis of Multiple Alkaloids by Single Marker. Molecules 2018, 23, 856. [Google Scholar] [CrossRef] [PubMed]
  27. He, B.; Liu, Y.; Tian, J.; Li, C.H.; Yang, S.Y. Study on quality control of Houttuynia Cordata, a tradtional Chinese medicine by fingerprint combined with quantitative analysis of multi-components by single marker. China J. Chin. Mater. Med. 2013, 38, 2682–2689. [Google Scholar]
  28. Ding, L.Y.; Zhou, L.; Wang, L.N.; Guo, Y.H.; Wang, H. Multi-components quantitation by one marker for simultaneous content determination of four components in Psoralea corylifolia. Chin. J. Exp. Tradit. Med Formulae 2013, 19, 152–154. [Google Scholar]
  29. Dou, Z.H.; Qiao, J.; Bian, L.; Hou, J.Y.; Mao, C.F.; Chen, Z.X.; Shi, Z. Combinational quality control method of Rhei Radix et Rhizoma based on fingerprint and QAMS. J. Chin. Pharm. Sci. 2015, 50, 442–448. [Google Scholar]
  30. Yan, D.M.; Chang, Y.X.; Kang, L.Y.; Gao, X.M. Quality evaluation and regional analysis of Psoraleae Fructus by HPLC-DAD-MS/MS plus chemometrics. Chin. Herb. Med. 2010, 2, 216–223. [Google Scholar]
  31. Chen, W.H.; Luo, D. Research Development on Pharmacological Action in Gastrodia elata blume and Gastrodia Elata Polysaccharide. China J. Drug Eval. 2013, 30, 132–141. [Google Scholar]
  32. Lu, G.W.; Zou, Y.J.; Mo, Q.Z. Kinetic aspects of absorption, distribution, metabolism and excretion of ~3H-gastrodin in rats. Yao Xue Xue Bao 1985, 20, 167–172. [Google Scholar] [PubMed]
  33. Choi, S.R.; Jang, I.; Kim, C.S.; You, D.H.; Kim, J.Y.; Kim, Y.G.; Ahn, Y.S.; Kim, J.M.; Kim, Y.S.; Seo, K.W. Changes of components and quality in gastrodiae rhizoma by different dry methods. Korean J. Med. Crop Sci. 2011, 19, 354–361. [Google Scholar] [CrossRef]
  34. KPC Pharmaceuticals, Inc. The Invention Relates to Gastrodin Compound, Preparation Method, Preparation and Application. CN107056853A, 2017. [Google Scholar]
  35. Wang, W.Y. Study on Solubility of p-Hydroxybenzaldehyde, m-Hydroxybenzaldehyde and Their Mixture in Supercritical Carbon Dioxide; Beijing University of Chemical Technology: Beijing, China, 2014. [Google Scholar]
  36. Wang, W.J. Study on the Aerobic Oxidation of o/p-Cresol to o/p-Hydroxybenzaldehyde Catalyzed by Metallopoprhyrinns; Beijing University of Chemical Technology: Beijing, China, 2013. [Google Scholar]
  37. Hou, J.J.; Wu, W.Y.; Da, J.; Yao, S.; Long, H.L.; Yang, Z.; Cai, L.Y.; Yang, M.; Liu, X.; Jiang, B.H.; et al. Ruggedness and robustness of conversion factors in method of simultaneous determination of multi-components with single reference standard. J. Chromatogr. A 2011, 1218, 5618–5627. [Google Scholar] [CrossRef]
  38. Huang, J.; Yin, L.; Dong, L.; Quan, H.F.; Chen, R.; Hua, S.Y.; Ma, J.H.; Guo, D.Y.; Fu, X.Y. Quality evaluation for Radix Astragali based on fingerprint, indicative components selection and QAMS. Biomed. Chromatogr. 2018, 32, e4343. [Google Scholar] [CrossRef]
Sample Availability: Samples of the compounds are available from the authors.
Figure 1. The HPLC fingerprints of the Gastrodia elata tuber sample and the mixed standards. R: The mixed standards; S: The G. elata tuber sample. 1—Gastrodin; 2—p-Hydroxy benzyl alcohol; 3—Parishin E; 4—p-Hydroxy benzaldehyde; 5—Parishin B; 6—Parishin C; 7—Parishin A.
Molecules 24 01521 g001
Figure 2. HPLC fingerprints of the 21 batches of G. elata tuber samples. 1—Gastrodin; 2—p-Hydroxy benzyl alcohol; 3—Parishin E; 4—p-Hydroxy benzaldehyde; 5—Parishin B; 6—Parishin C; 7—Parishin A.
Molecules 24 01521 g002
Figure 3. Clustering analysis graph of the 21 G. elata tuber samples.
Molecules 24 01521 g003
Figure 4. The structures of some compounds in the G. elata tuber. (a) Gastrodin [34], (b) p-hydroxy benzaldehyde [35], and (c) p-hydroxybenzyl alcohol [36].
Molecules 24 01521 g004
Figure 5. The structures of parishins in the G. elata tuber. The structure of parishins [13]: RA. parishin A, RB. parishin B, RC. parishin C, RE. parishin E.
Molecules 24 01521 g005aMolecules 24 01521 g005b
Table 1. The regression equations, Limit of Detection (LODs) and Limit of Quantity (LOQs) of seven components.
AnalytesRegression EquationsLinear Ranges (mg/mL)R2LOD (mg/mL)LOQ (mg/mL)
GastrodinY = 18634X − 264.071.906~6.4830.99970.0420.139
p-Hydroxybenzyl alcoholY = 39300X + 42.9550.075~1.7730.99950.0010.003
Parishin EY = 14141X + 142.932.273~7.0520.99970.0370.122
p-Hydroxy benzaldehydeY = 52536X + 7.91740.079~2.5881.00000.0010.005
Parishin BY = 20791X + 6.77461.450~5.1901.00000.0040.015
Parishin CY = 31240X − 335.240.286~0.3560.99970.0050.015
Parishin AY = 11769X − 100.830.181~19.3010.99950.0200.070
Table 2. RSD of precision, stability, repeatability and accuracy for determination of seven components.
AnalytePrecisionStabilityRepeatabilityAccuracy
RSD (%)RSD (%)RSD (%)RSD (%)Mean (%)RSD (%)
Gastrodin1.931.151.2592.05%2.02%
p-Hydroxybenzyl alcohol1.102.042.1595.78%1.09%
Parishin E1.291.511.6098.05%2.90%
p-Hydroxy benzaldehyde2.302.371.8192.44%0.25%
Parishin B2.032.101.7293.33%1.32%
Parishin C2.631.121.8492.91%2.10%
Parishin A0.892.251.6091.80%1.36%
Table 3. The information and peak areas of the seven characteristic peaks in HPLC fingerprints of G. elata tubers.
No.Peak Area of Seven Characteristic Peaks
Gastrodinp-Hydroxy Benzyl AlcoholParishin Ep-Hydroxy BenzaldehydeParishin BParishin CParishin A
S11797.12249.52337.8217.42263.6420.74340.3
S21470.22144.32523.4227.62526.6462.24561.9
S3623.84536.41528.4301.71017280.31487.8
S41325.11516.11412.1116.71906.9402.83150
S51659.32123.31991.3111.92141.7383.44006.4
S611611463.73734.3108.11867.1390.23167.6
S71492.8663.82991.685.81818.7392.53473.5
S81470.9823.81573.2127.12231.8546.35104.3
S918981876.62572.7822629.1595.94430.8
S103816.6136.21316.2110.12663.3441.93383.6
S112353.9970.81563.7131.93073.4789.59224.6
S1217948302577.245.72141.8101.13845.8
S132344.5572.42363.157.62039.1499.25019.1
S141369.4427.81961.641.92408.9622.15512.4
S152177.51270.22076.656.63133.4791.28184.9
S163322.1108.11240.973.11935.1357.82127.8
S171081.8322.82365104.72363.6500.75062.6
S181893.7270.91719.478.32475.68236072.7
S19380.44012.71414.3617.3781.5136.41789.1
S20300.93287.7878.9564479.5102.3687.1
S212175.11076.82057.2143.72826.494.76278.5
C.V. (%) 149.785.233.396.532.250.147.9
1 C.V. (%) = δ/µ × 100, δ—The standard deviation of peak area and µ—The average value of each peak area.
Table 4. Similarity of the G. elata tuber samples.
No.SimilarityNo.SimilarityNo.SimilarityNo.Similarity
S10.983S70.970S130.988S190.990
S20.987S80.988S140.982S200.988
S30.983S90.989S150.979S210.988
S40.975S100.982S160.989R1.000
S50.983S110.987S170.980
S60.975S120.990S180.964
Table 5. Relative correction factor (RCF) values of six components of the G. elata tuber.
InstrumentChromatogram ColumnRCF Values
Agilent 1260YMC-Tyiart C18 (250 × 4.6 mm, 5 μm)fP-hydroxy benzyl alcohol/gastrodin2.1090
fparishin E/gastrodin0.7589
fP-hydroxy benzaldehyde/gastrodin2.8194
fparishin B/gastrodin1.1156
fparishin C/gastrodin1.6771
fparishin A/gastrodin0.6316
Table 6. Contents of the seven components in G. elata tubes determined by the external standard method (ESM) and the quantitative analysis of multi-components by single marker (QAMS) methods (mg·g-1) 1.
No.Gastrodinp-Hydroxy Benzyl AlcoholParishin Ep-Hydroxy BenzaldehydeParishin BParishin CParishin ATotal
ESMQAMSESMQAMSESMQAMSESMQAMSESMQAMSESMQAMS
S15.23 ± 0.161.77 ± 0.051.82 ± 0.055.14 ± 0.015.35 ± 0.030.24 ± 0.010.25 ± 0.063.54 ± 0.143.60 ± 0.050.18 ± 0.000.19 ± 0.0111.58 ± 0.4511.71 ± 0.4927.68
S24.51 ± 0.381.61 ± 0.081.64 ± 0.062.27 ± 0.142.38 ± 0.080.24 ± 0.010.25 ± 0.013.43 ± 0.213.47 ± 0.010.13 ± 0.000.14 ± 0.000.18 ± 0.000.00 ± 0.0012.38
S32.44 ± 0.281.07 ± 0.081.09 ± 0.104.82 ± 0.255.00 ± 0.040.26 ± 0.010.26 ± 0.022.84 ± 0.102.88 ± 0.040.16 ± 0.020.16 ± 0.028.33 ± 0.318.32 ± 0.1119.91
S41.35 ± 0.023.36 ± 0.123.39 ± 0.082.62 ± 0.062.62 ± 0.230.23 ± 0.010.24 ± 0.041.45 ± 0.041.46 ± 0.090.16 ± 0.000.16 ± 0.104.23 ± 0.124.10 ± 0.3113.41
S53.41 ± 0.381.55 ± 0.101.58 ± 0.072.31 ± 0.222.36 ± 0.100.12 ± 0.020.13 ± 0.012.49 ± 0.122.51 ± 0.110.20 ± 0.000.20 ± 0.018.94 ± 0.638.92 ± 0.2919.03
S61.91 ± 0.121.03 ± 0.071.06 ± 0.107.05 ± 0.137.26 ± 0.230.23 ± 0.020.24 ± 0.052.69 ± 0.032.73 ± 0.170.17 ± 0.000.17 ± 0.027.64 ± 0.317.63 ± 0.6120.72
S73.12 ± 0.010.51 ± 0.000.531 ± 0.006.02 ± 0.146.20 ± 0.090.21 ± 0.010.21 ± 0.002.71 ± 0.022.73 ± 0.010.15 ± 0.000.16 ± 0.008.87 ± 0.028.86 ± 0.0821.58
S83.06 ± 0.100.62 ± 0.010.64 ± 0.013.00 ± 0.183.13 ± 0.172.59 ± 0.022.60 ± 0.053.25 ± 0.153.27 ± 0.010.15 ± 0.010.14 ± 0.0412.77 ± 0.5812.75 ± 0.5425.44
S92.85 ± 0.371.22 ± 0.181.24 ± 0.204.54 ± 0.034.69 ± 0.060.28 ± 0.010.28 ± 0.013.61 ± 0.063.63 ± 0.150.17 ± 0.010.16 ± 0.0510.78 ± 0.1510.77 ± 0.0823.44
S105.89 ± 0.220.10 ± 0.010.10 ± 0.013.37 ± 0.243.52 ± 0.230.11 ± 0.010.11 ± 0.063.84 ± 0.133.91 ± 0.050.15 ± 0.020.16 ± 0.007.90 ± 0.677.91 ± 0.6321.36
S114.74 ± 0.370.69 ± 0.080.71 ± 0.083.40 ± 0.223.55 ± 0.220.26 ± 0.020.26 ± 0.045.191 ± 0.095.23 ± 0.020.18 ± 0.010.19 ± 0.0026.70 ± 0.4626.93 ± 0.5441.15
S127.10 ± 0.270.65 ± 0.040.66 ± 0.014.88 ± 0.235.04 ± 0.110.08 ± 0.120.08 ± 0.023.03 ± 0.163.18 ± 0.010.15 ± 0.020.15 ± 0.009.43 ± 0.549.80 ± 0.1025.32
S134.03 ± 0.030.37 ± 0.010.39 ± 0.013.69 ± 0.113.86 ± 0.110.16 ± 0.010.17 ± 0.022.37 ± 0.062.41 ± 0.060.15 ± 0.000.15 ± 0.0010.27 ± 0.2410.33 ± 0.2421.04
S142.59 ± 0.030.19 ± 0.160.20 ± 0.002.97 ± 0.083.10 ± 0.070.20 ± 0.000.21 ± 0.022.88 ± 0.062.90 ± 0.050.15 ± 0.010.15 ± 0.0011.61 ± 0.3711.58 ± 0.3320.59
S154.29 ± 0.150.92 ± 0.040.94 ± 0.043.76 ± 0.163.90 ± 0.160.31 ± 0.020.31 ± 0.074.27 ± 0.174.30 ± 0.100.13 ± 0.000.14 ± 0.0019.30 ± 0.8319.42 ± 0.8432.98
S166.48 ± 0.210.08 ± 0.000.08 ± 0.002.35 ± 0.112.41 ± 0.130.11 ± 0.000.11 ± 0.052.75 ± 0.112.78 ± 0.040.15 ± 0.010.15 ± 0.015.24 ± 0.155.16 ± 0.2017.15
S175.09 ± 0.390.13 ± 0.220.13 ± 0.264.20 ± 0.054.39 ± 0.050.24 ± 0.000.25 ± 0.071.54 ± 0.171.56 ± 0.080.15 ± 0.010.14 ± 0.0111.65 ± 0.2211.77 ± 0.2323.01
S183.71 ± 0.050.20 ± 0.010.20 ± 0.014.22 ± 0.094.41 ± 0.130.20 ± 0.000.20 ± 0.043.47 ± 0.083.52 ± 0.030.15 ± 0.000.16 ± 0.0114.60 ± 0.2114.76 ± 0.2426.54
S190.42 ± 0.011.23 ± 0.021.26 ± 0.021.10 ± 0.011.14 ± 0.010.18 ± 0.010.18 ± 0.000.46 ± 0.010.47 ± 0.010.38 ± 0.010.39 ± 0.041.99 ± 0.061.98 ± 0.055.76
S200.36 ± 0.021.01 ± 0.011.04 ± 0.010.64 ± 0.000.65 ± 0.000.12 ± 0.000.11 ± 0.000.28 ± 0.000.29 ± 0.000.30 ± 0.010.30 ± 0.030.83 ± 0.090.82 ± 0.003.52
S211.50 ± 0.140.33 ± 0.000.34 ± 0.001.70 ± 0.401.71 ± 0.040.68 ± 0.020.69 ± 0.011.75 ± 0.021.78 ± 0.010.17 ± 0.000.16 ± 0.016.62 ± 0.036.61 ± 0.0312.75
Mean3.53 0.91 3.65 0.34 2.79 0.18 9.5320.70
1 ESM—external standard method, and its content was determined by the calibration equation method; QAMS—quantitative analysis multi-components by single marker, and its content was determined by RCFs; RSD—relative standard deviation; Total—the sum of the six alkaloid contents in each batch.
Table 7. The relative error, RSD, correlation coefficient, and p values of the contents from the ESM and the QAMS 1.
No.p-Hydroxy Benzyl AlcoholParishin Ep-Hydroxy BenzaldehydeParishin BParishin CParishin A
Relative ErrorRSDRelative ErrorRSDRelative ErrorRSDRelative ErrorRSDRelative ErrorRSDRelative ErrorRSD
S12.38%1.70%4.04%2.92%2.39%1.71%1.76%1.25%1.47%1.05%1.15%0.82%
S21.78%1.27%4.56%3.30%1.72%1.23%1.10%0.78%1.55%1.11%0.00%0.00%
S32.38%1.70%3.72%2.68%1.94%1.39%1.37%0.97%1.56%1.11%0.02%0.10%
S40.72%0.51%0.10%0.07%1.11%0.79%0.60%0.43%0.94%0.67%0.18%2.13%
S51.52%1.08%2.13%1.52%2.14%1.53%0.90%0.64%1.11%0.79%0.03%0.18%
S62.50%1.79%2.95%2.12%2.01%1.44%1.38%0.98%0.66%0.47%0.01%0.07%
S73.39%2.43%2.84%2.03%1.70%1.21%0.97%0.69%3.09%2.22%0.02%0.12%
S82.38%1.70%4.27%3.08%0.32%0.23%0.37%0.26%3.81%2.74%0.02%0.09%
S91.65%1.17%3.18%2.29%1.17%0.83%0.60%0.43%0.74%0.52%0.02%0.10%
S101.29%0.92%4.24%3.06%2.81%2.01%1.59%1.13%3.05%2.19%0.21%0.15%
S112.57%1.84%4.20%3.03%1.38%0.98%0.74%0.53%4.84%3.51%0.88%0.62%
S120.77%0.54%3.22%2.32%3.59%2.59%4.72%3.42%0.31%0.22%3.81%2.75%
S134.77%3.45%4.54%3.29%2.41%1.73%1.48%1.05%0.90%0.64%0.61%0.43%
S144.79%3.47%4.31%3.12%1.15%0.82%0.39%0.27%0.66%0.47%0.27%0.19%
S151.95%1.39%3.72%2.68%1.10%0.78%0.59%0.42%4.61%3.34%0.61%0.44%
S164.71%3.41%2.10%1.50%2.69%1.93%1.15%0.82%0.39%0.28%1.44%1.02%
S170.76%0.54%4.31%3.12%2.23%1.60%1.61%1.15%3.77%2.72%0.99%0.70%
S180.35%0.25%4.31%3.11%2.23%1.59%1.43%1.02%4.95%3.59%1.14%0.81%
S192.54%1.82%3.76%2.71%2.50%1.79%2.33%1.67%0.94%0.67%0.38%0.27%
S203.25%2.33%1.43%1.02%3.59%2.59%3.34%2.40%0.07%0.05%1.13%0.80%
S212.53%1.81%0.70%0.50%1.75%1.24%1.70%1.21%2.10%1.50%0.20%0.14%
Correlation coefficient0.999 **0.999 **0.999 **1.000 **0.998 **0.999 **
p values0.9400.8020.9780.9230.9600.986
1 RSD—relative standard deviation; p values—the paired t-test results; ESM—external standard method, and its content was determined by the calibration equation method; QAMS—quantitative analysis multi-components by single marker, and its content was determined by RCFs; ** p < 0.01.
Table 8. The information of G. elata tubers from different producing areas.
No.SampleProducing AreasNo.SampleProducing Areas
S1G. elata tubersZhaotong, Yunnan, ChinaS12G. elata tubersEnshi, Hubei, China
S2G. elata tubersZhaotong, Yunnan, ChinaS13G. elata tubersYichang, Hubei, China
S3G. elata tubersZhaotong, Yunnan, ChinaS14G. elata tubersHanzhong, Shanxi, China
S4G. elata tubersZhaotong, Yunnan, ChinaS15G. elata tubersQinling, Shanxi, China
S5G. elata tubersZhaotong, Yunnan, ChinaS16G. elata tubersQinchuan, Sichuang, China
S6G. elata tubersZhaotong, Yunnan, ChinaS17G. elata tubersLongnan, Gansu, China
S7G. elata tubersLijiang, Yunnan, ChinaS18G. elata tubersAnhui, China
S8G. elata tubersBijie, Guizhou, ChinaS19G. elata tubersMoju, South Korea
S9G. elata tubersZhengyuan, Guizhou, ChinaS20G. elata tubersChun chuan, South Korea
S10G. elata tubersQiandongnan, Guizhou, ChinaS21G. elata tuber slicesYingyang, South Korea
S11G. elata tubersBijie, Guizhou, China

