Multiple Instances QoS Routing in RPL: Application to Smart Grids †


 and
and
Abstract
1. Introduction
2. Related Work
2.1. RPL Protocol Overview
2.2. RPL Proposed Metrics and Modifications
2.3. Why Multiple Instances?
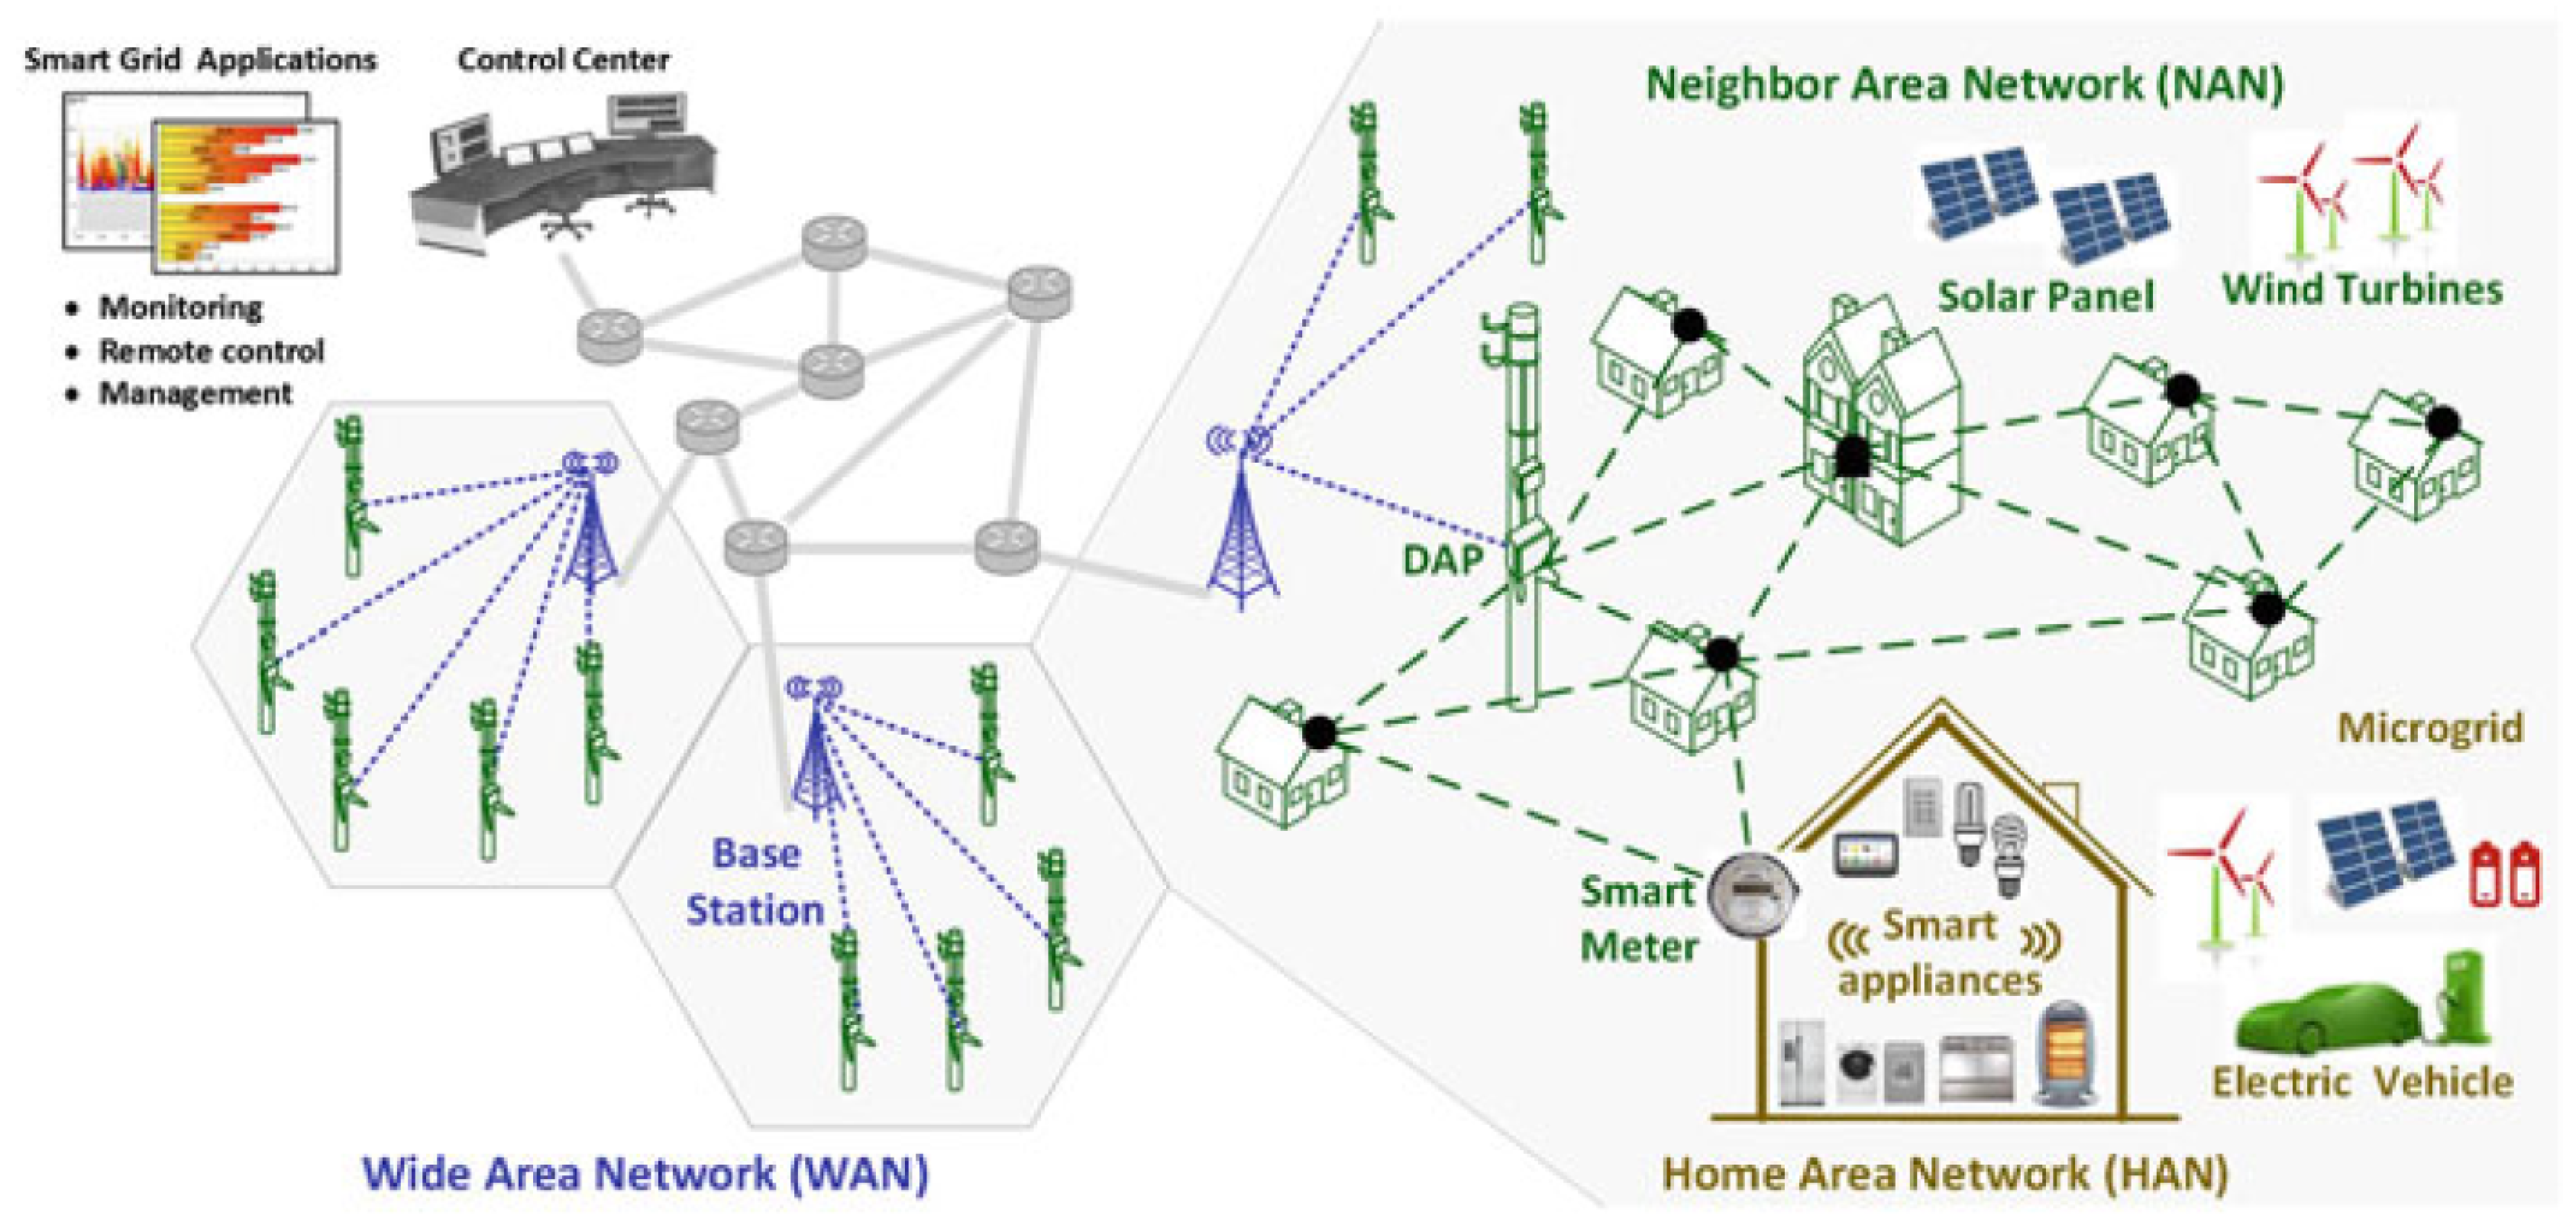
- Advanced Metering infrastructure (AMI) consists of an integrated system of smart meters for measuring, collecting, analyzing and communicating energy consumption of smart appliances. Enabling two-way communication between utilities and customers and providing a number of important functions that were not previously possible or had to be performed manually, such as the ability to automatically and remotely measure electricity use, connect and disconnect to a service, identify and isolate outages, and monitor voltage.
- Demand Side Management (DSM) consists of a set of interconnected and flexible programs which grants customers a greater role in shifting their own demand for electricity during peak periods, and reducing their overall energy consumption. DSM comprises two principal activities:
- -
- Demand Response (DR) or load shifting which aims to transfer customer load during periods of high demand to off-peak periods. The grid operator or other stakeholders influence the customers behavior mostly by monetary incentives, allowing them to participate in the energy market competition by changing their energy consumption approach instead of being passively exposed to fixed prices, which results in profits for both, the companies and the end-users.
- -
- Energy efficiency and conservation programs which allow customers to save energy while receiving the same level of end service, such as when they replace an old electric appliance with a more energy efficient model.
- Distribution Automation (DA) is defined as the ability of taking an automated decision to make fault detection, more efficient isolation and restoration in a grid by remotely monitoring, controlling, manipulating and coordinating distribution, improving then the reliability accross the grid. DA offers new functionalities, incorporate alarming and automated feeder switching, which in turn will help reduce the frequency and duration of customer outages. Substation automation is achieved through Supervisory Control and Data Acquisition (SCADA) systems which are able to make these automated decisions in real time by running algorithms based on the data they receive and orchestrate adjustments to optimize voltages and self-heal any failure issues.
- Distributed Energy Resources (DERs) such as photo voltaic cells, wind turbines and energy storage points present one of the main benefits in a SG. These DERs will be able to supply particular areas with electricity when they are isolated from the main power grid due to failure conditions or system and equipment failures. Moreover, these DERs foster the shift from a centralized power system towards a more decentralized system by contributing to the evolution of local grid areas served by one or more distribution substations and supported by high penetrations of DERs called microgrids.
- Electric transport via electric vehicles (PEV: Plug-in Electric Vehicles) or hybrid electric vehicles (PHEV: Plug-in Hybrid Electric Vehicles) aims to improve or even replace traditional transport by reducing emissions produced by fossil fuels. For that, an electric vehicle uses one or more electric motors that are powered by a rechargeable electric accumulator. SGs can better manage vehicle charging so that rather than increasing peak loads, the charging can be carried out more strategically, when for example electricity demand is low or when the production of renewable electricity is high. In the long run, SGs can use electric vehicles as batteries to store renewable and other sources of electricity for later use.
3. Proposed Solution
3.1. Objective Function
3.2. QoS Factors in
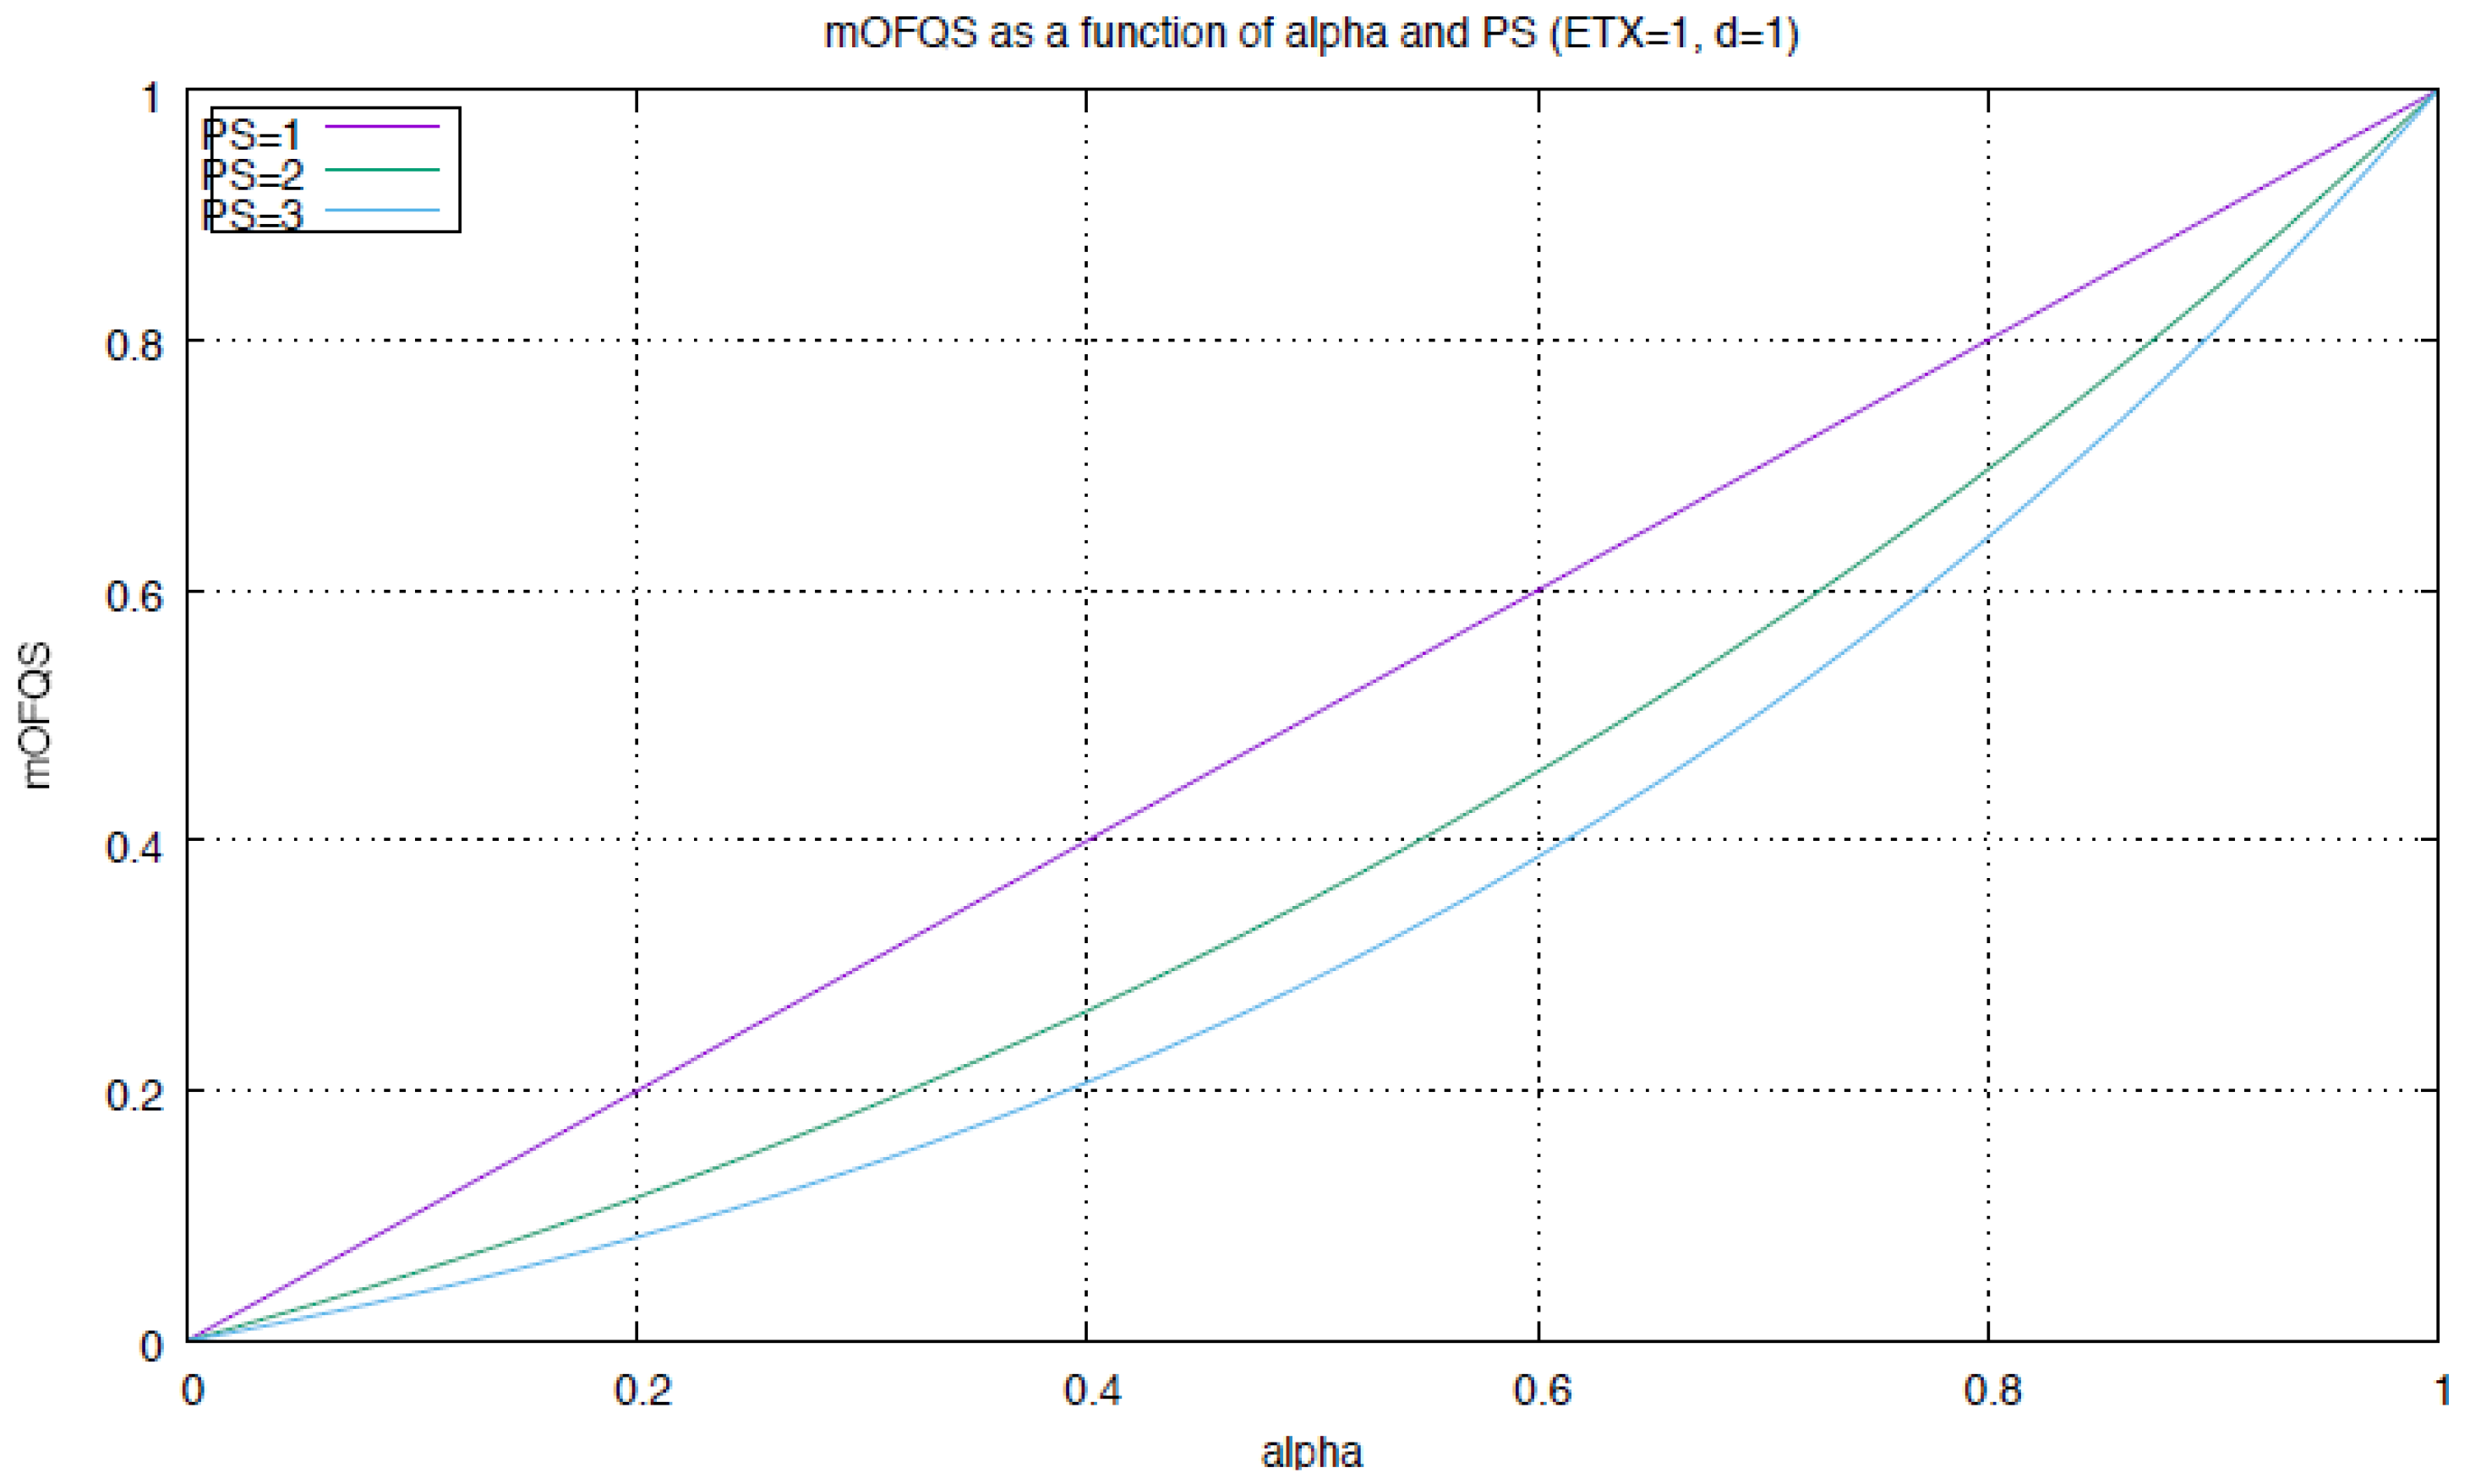
- = 3: Full battery state (ranging between 100% and 80%) or main powered
- = 2: Normal battery state (ranging between 80% and 30%)
- = 1: Critical battery state (less then 30%)
3.3. mOFQS Metric
3.4. Instances Classification
- Instance 1: critical traffic with an authorized delay ranging between 1 and 30 s and a reliability of >99.5% packets received with = 0.9 and = 0.1
- Instance 2: non-critical traffic with an authorized delay of days and a reliability of >98% packets received with = 0.1 and = 0.9
- Instance 3: periodic traffic with an authorized delay ranging between 5 min and 4 h and a reliability of >98% packets received with = 0.3 and = 0.7
4. Experiment Setup
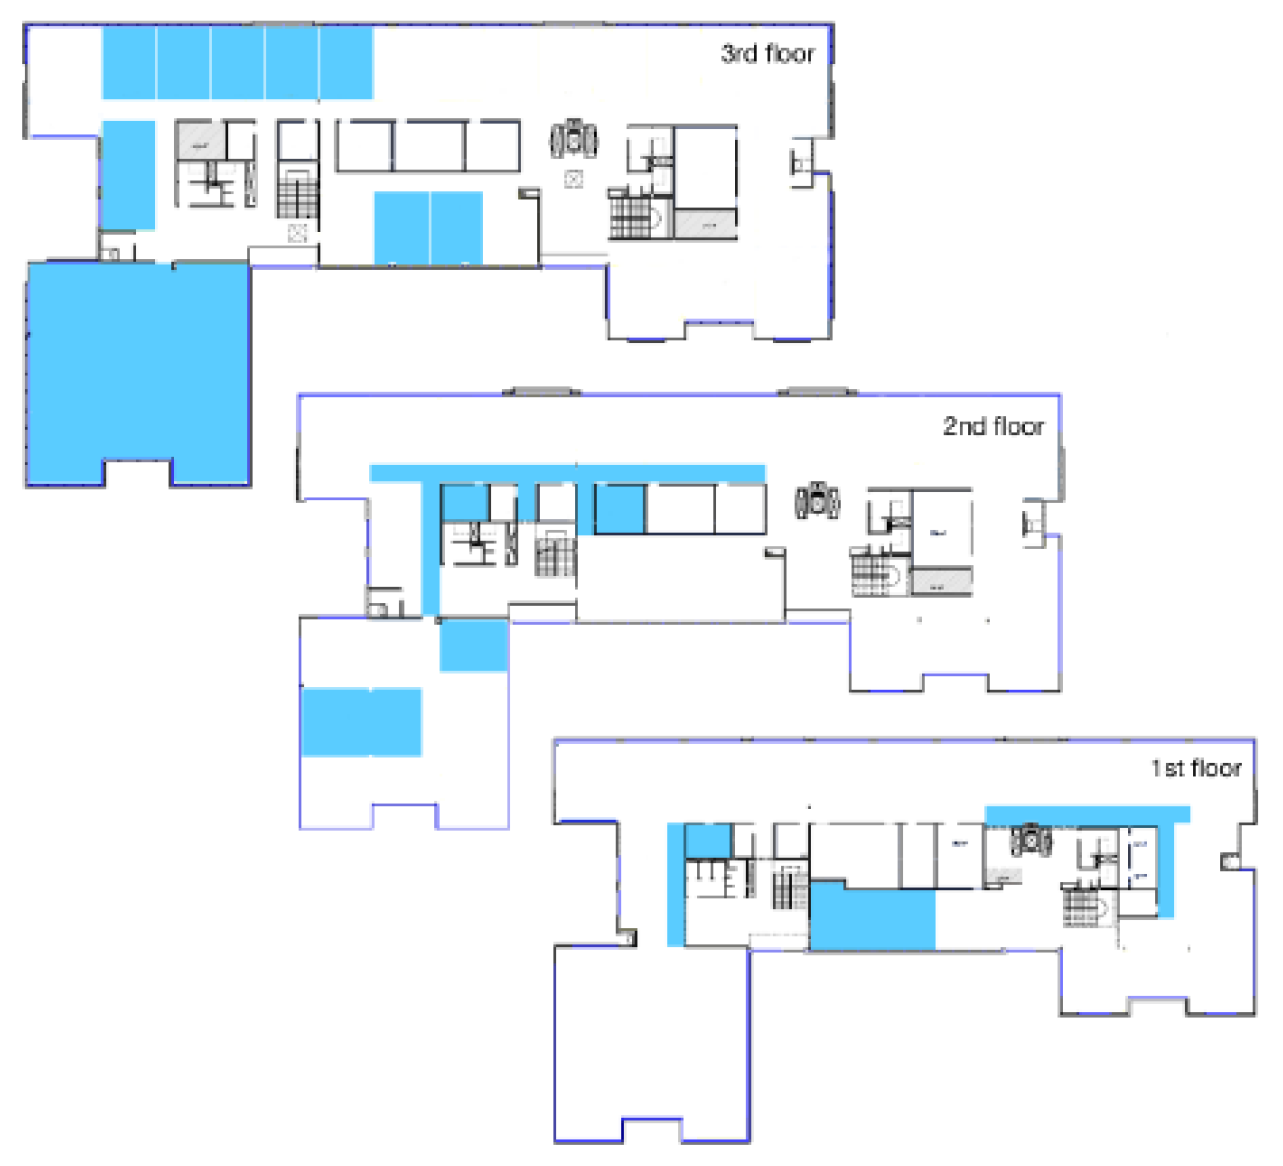
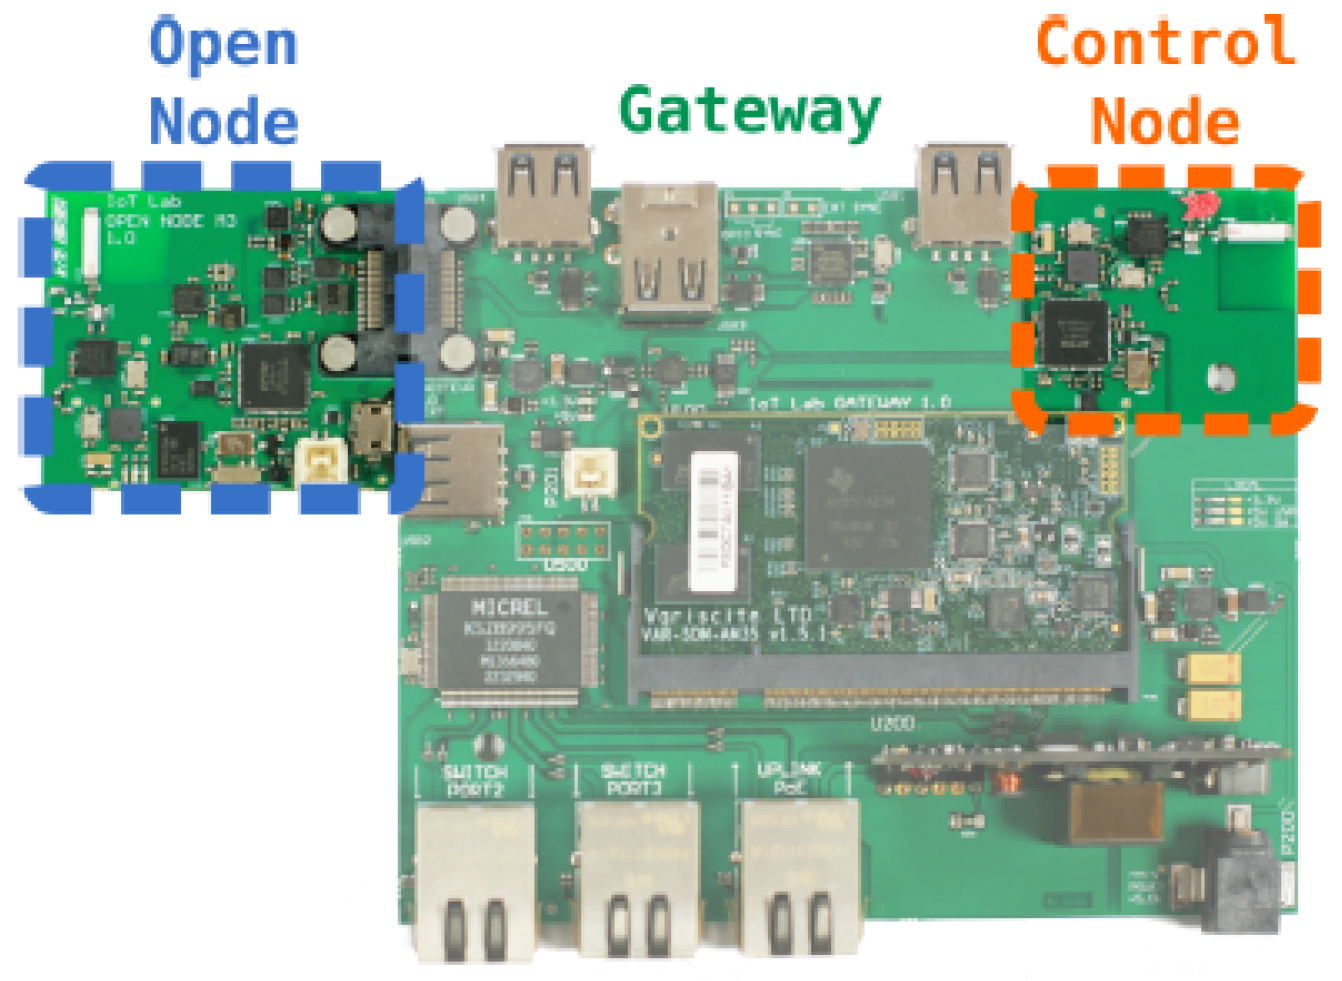
4.1. FIT IoT-LAB Testbed
4.2. Battery Level Measurement
- the gateway that is responsible for flashing the open node and connecting it to the testbed’s infrastructure
- the open node that runs the experiment firmware
- the control node that runs radio sniffing and consumption measurement
4.3. Network Setup
5. Performance Evaluation
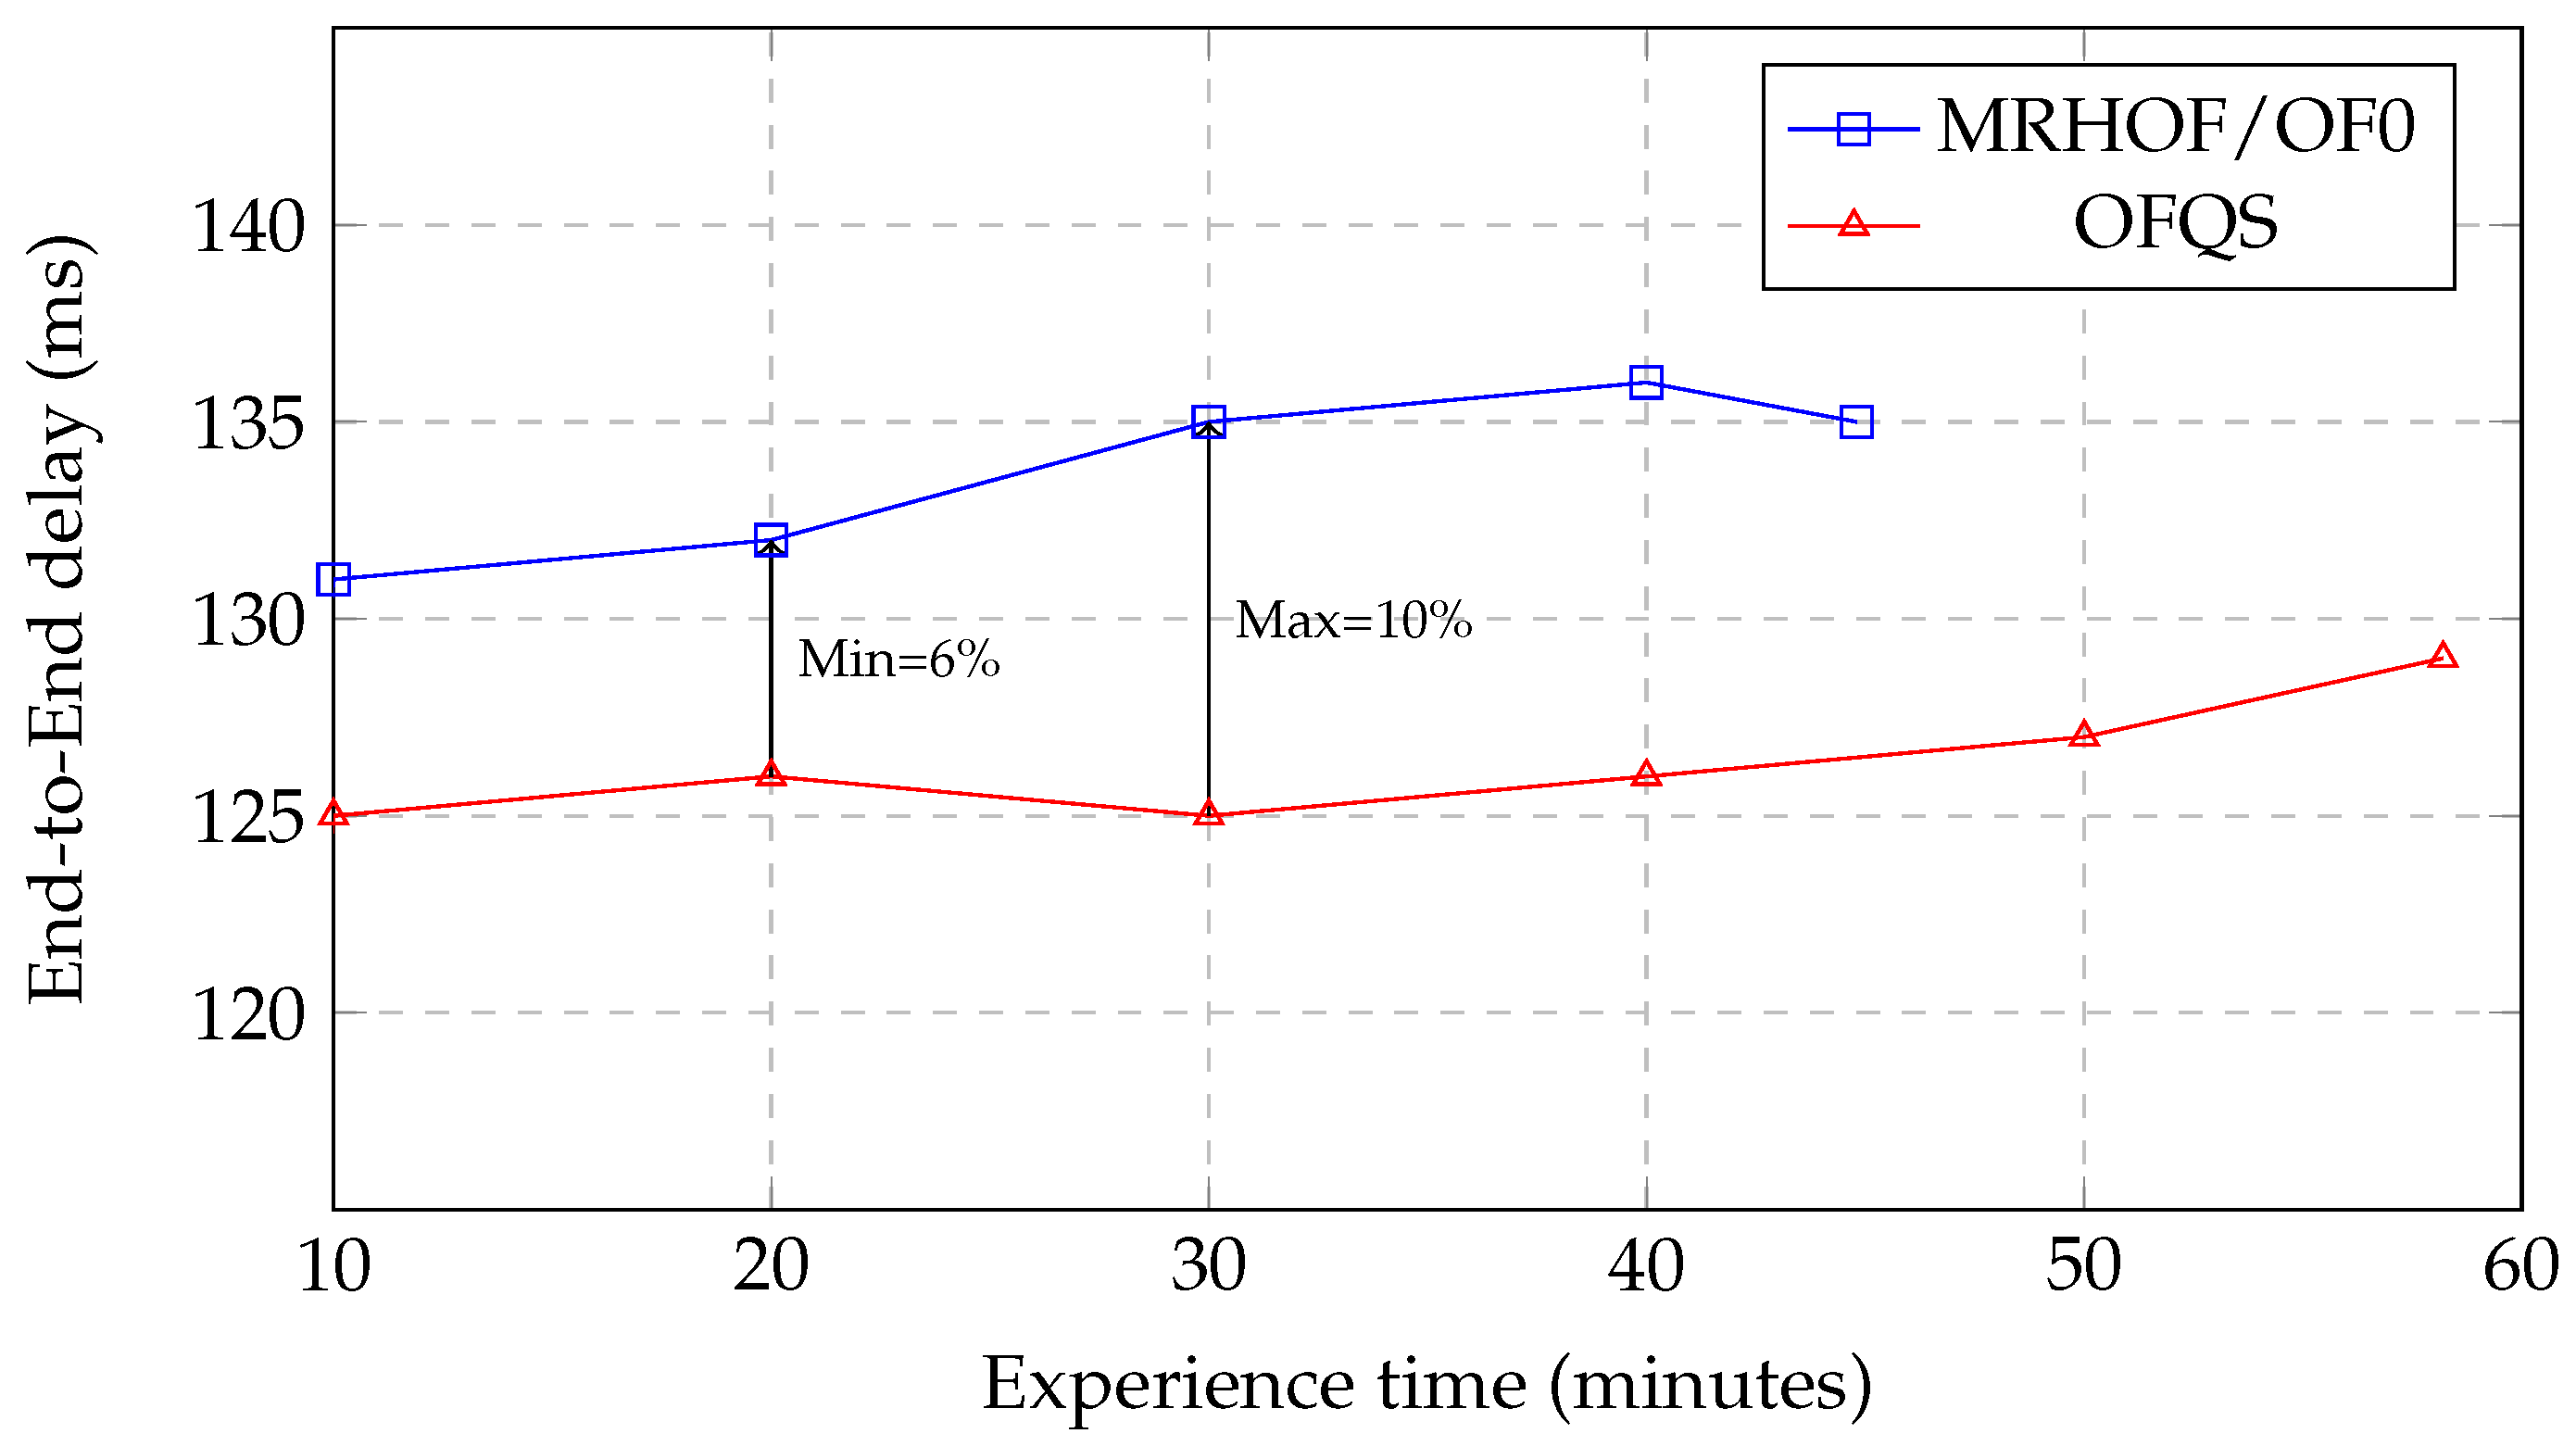
5.1. End-to-End Delay
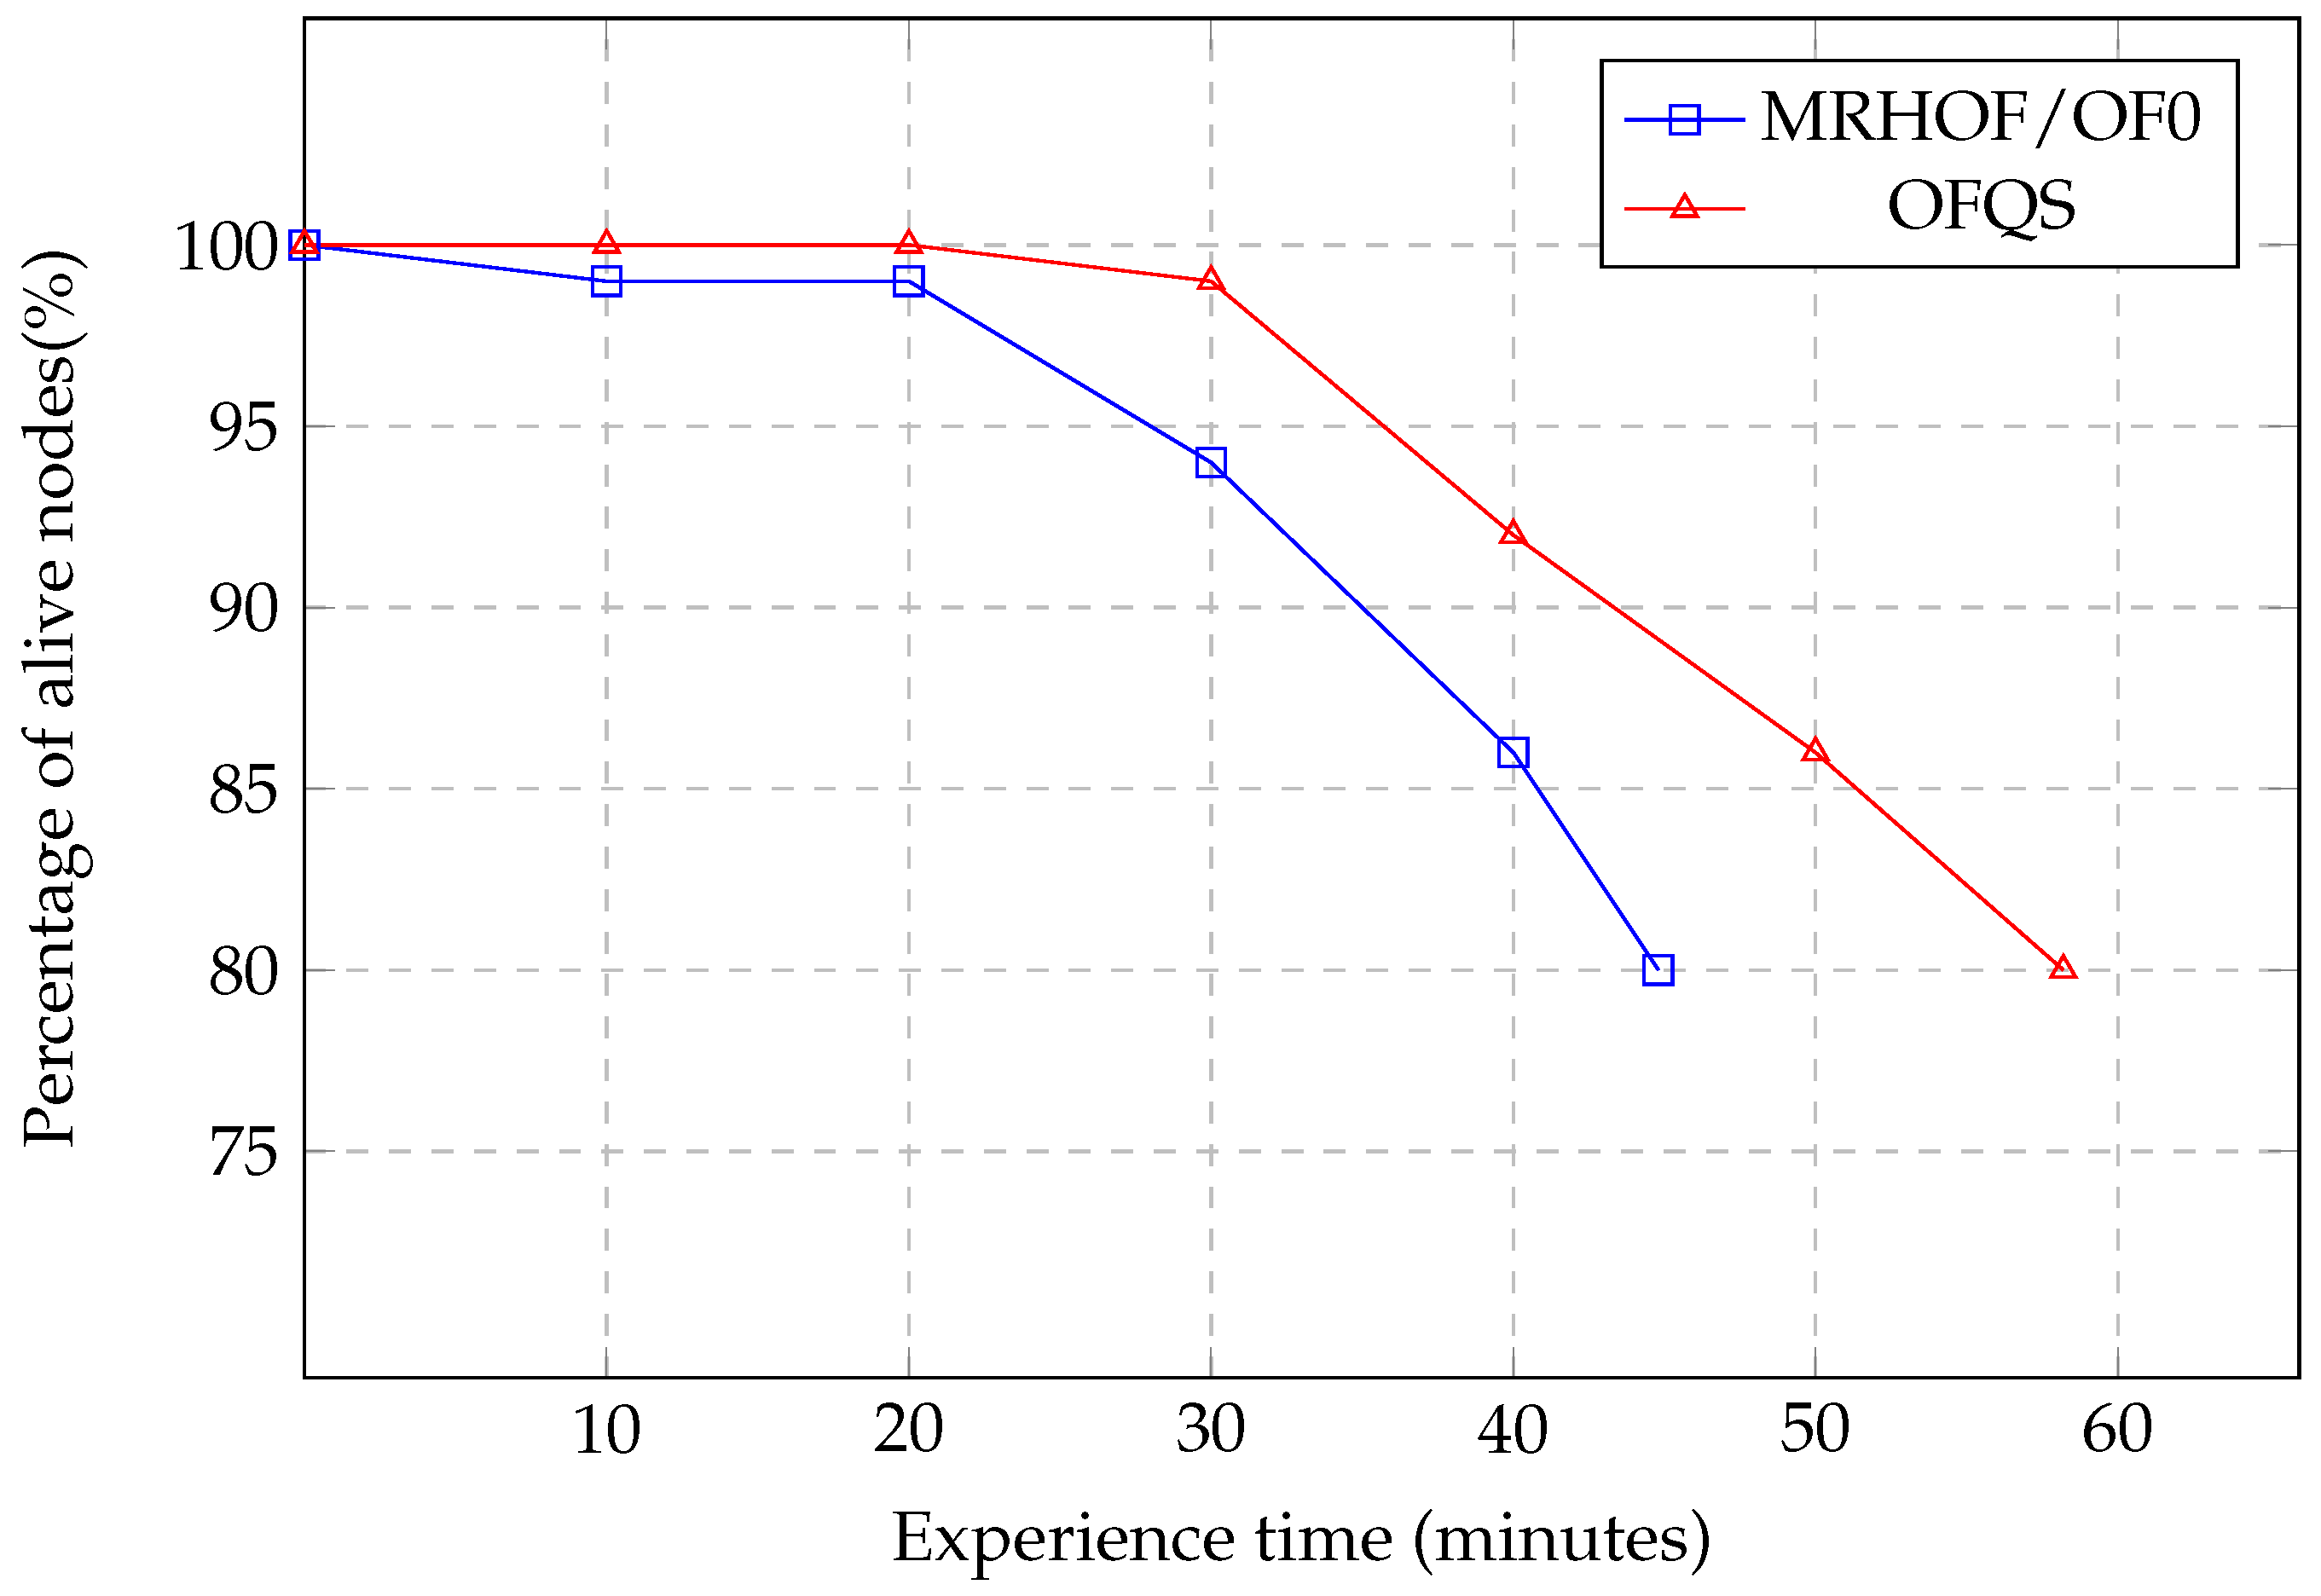
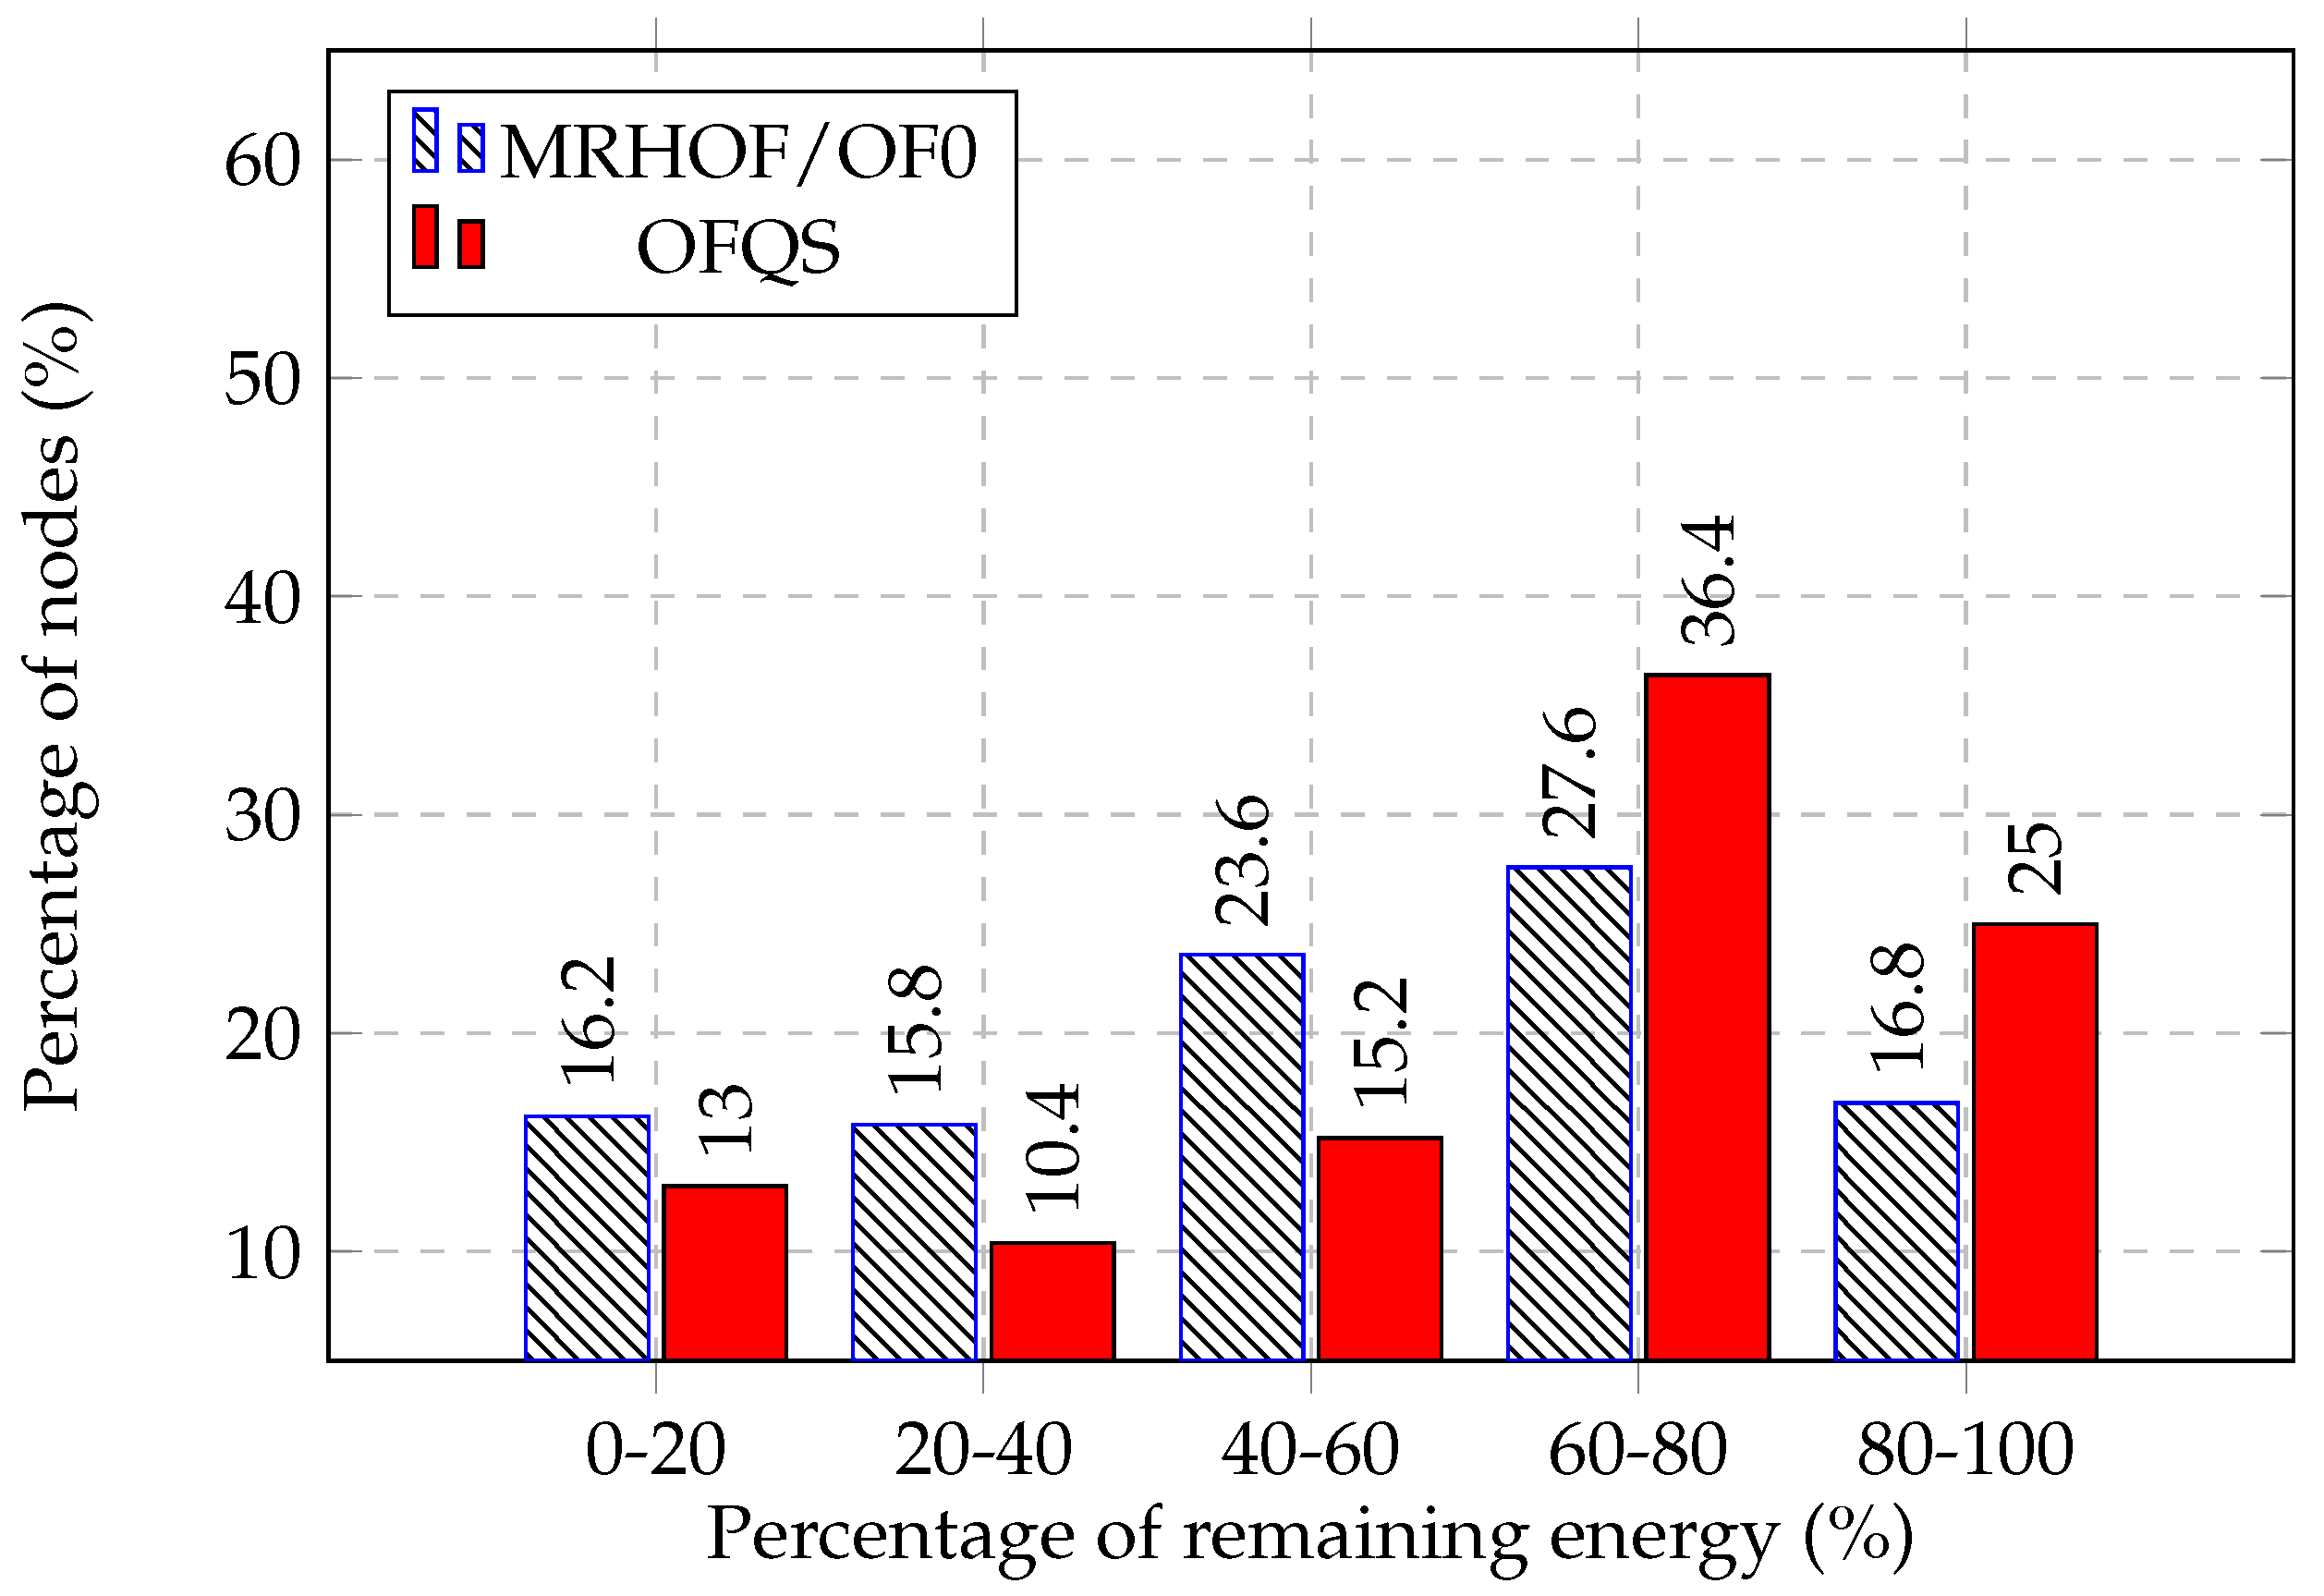
5.2. Network Lifetime and Load Balancing
5.3. Packet Delivery Ratio
6. Discussion
7. Conclusions
Author Contributions
Funding
Conflicts of Interest
References
- Bouhafs, F.; Mackay, M.; Merabti, M. Links to the future: Communication requirements and challenges in the smart grid. IEEE Power Energy Mag. 2012, 10, 24–32. [Google Scholar] [CrossRef]
- Gungor, V.C.; Lu, B.; Hancke, G.P. Opportunities and challenges of wireless sensor networks in smart grid. IEEE Trans. Ind. Electron. 2010, 57, 3557–3564. [Google Scholar] [CrossRef]
- BKW. Smart Grid Taxonomy. A System View From a Grid Operator’s Perspective, version 2.0 beta; BKW: Bern, Switzerland, 2015. [Google Scholar]
- Davito, B.; Tai, H.; Uhlaner, R. The smart grid and the promise of demand-side management. McKinsey Smart Grid 2010, 3, 8–44. [Google Scholar]
- Rekik, M. Routage GéOgraphique Multi-Chemin Basé Sur L’Intelligence D’Essaim Pour RéSeaux de Capteurs Et D’Actionneurs Sans Fil: Application Aux Smart Grids. Ph.D. Thesis, Université Lille 1, Villeneuve-d’Ascq, France, 2016. [Google Scholar]
- Suljanovic, N.; Borovina, D.; Zajc, M.; Smajic, J.; Mujcic, A. Requirements for communication infrastructure in smart grids. In Proceedings of the Energy Conference (ENERGYCON), Dubrovnik, Croatia, 13–16 May 2014. [Google Scholar]
- Winter, T.; Thuber, P.; Brandt, A.; Hui, J.; Kelsey, R.; Levis, P.; Pister, K.; Struik, R.; Vasseur, J.P.; Alexander, R. RPL: IPv6 Routing Protocol for Low-Power and Lossy Networks; RFC, Ed.; RFC 6550; IETF Secretariat: Fremont, CA, USA, 2012. [Google Scholar]
- Wang, D.; Tao, Z.; Zhang, J.; Abouzeid, A. RPL-based routing for advanced metering infrastructure in smart grid. In Proceedings of the 2010 IEEE International Conference on Communications Workshops, Capetown, South Africa, 23–27 May 2010. [Google Scholar]
- Rajalingham, G.; Gao, Y.; Ho, Q.D.; Le-Ngoc, T. Quality of service differentiation for smart grid neighbor area networks through multiple RPL instances. In Proceedings of the Symposium on QoS and Security for Wireless and Mobile Networks, Montreal, QC, Canada, 21–26 September 2014; pp. 17–24. [Google Scholar]
- Ancillotti, E.; Bruno, R.; Conti, M. The role of the RPL routing protocol for smart grid communications. IEEE Commun. Mag. 2013, 51, 75–83. [Google Scholar] [CrossRef]
- Cam-Winget, N.; Hui, J.; Popa, D. Applicability Statement for the Routing Protocol for Low-Power and Lossy Networks (RPL) in Advanced Metering Infrastructure (AMI) Networks; RFC, Ed.; Technical Report; IETF Secretariat: Fremont, CA, USA, 2017. [Google Scholar]
- Ki-Hyung, K.; Park, S.D.; Montenegro, G.; Yoo, S.; Kushalnagar, N. 6LoWPAN Ad Hoc On-Demand Distance Vector Routing (LOAD); Internet-Draft Draft-Daniel-6lowpan-Load-Adhoc-Routing-03; IETF Secretariat: Fremont, CA, USA, 2007. [Google Scholar]
- Ho, Q.D.; Gao, Y.; Rajalingham, G.; Le-Ngoc, T. Wireless Communications Networks for the Smart Grid; Springer: New York, NY, USA, 2014; Volume 2. [Google Scholar]
- Budka, K.C.; Deshpande, J.G.; Doumi, T.L.; Madden, M.; Mew, T. Communication network architecture and design principles for smart grids. Bell Labs Tech. J. 2010, 15, 205–227. [Google Scholar] [CrossRef]
- Gnawali, O.; Levis, P. The Minimum Rank with Hysteresis Objective Function; RFC, Ed.; RFC 6719; IETF Secretariat: Fremont, CA, USA, 2012. [Google Scholar]
- Thubert, P. Objective Function Zero for the Routing Protocol for Low-Power and Lossy Networks (RPL); RFC 6552; IETF Secretariat: Fremont, CA, USA, 2012. [Google Scholar]
- De Couto, D.S.; Aguayo, D.; Bicket, J.; Morris, R. A high-throughput path metric for multi-hop wireless routing. Wirel. Netw. 2005, 11, 419–434. [Google Scholar] [CrossRef]
- Ancillotti, E.; Bruno, R.; Conti, M. RPL Routing Protocol in Advanced Metering Infrastructures: An Analysis of the Unreliability Problems. In Proceedings of the Sustainable Internet and ICT for Sustainability (SustainIT), Pisa, Italy, 4–5 October 2012; pp. 1–10. [Google Scholar]
- Kim, H.S.; Paek, J.; Bahk, S. QU-RPL: Queue utilization based RPL for load balancing in large scale industrial applications. In Proceedings of the 12th International Conference on Sensing, Communication, and Networking (SECON), Seattle, WA, USA, 22–25 June 2015. [Google Scholar]
- Cam-Winget, N.; Hui, J.; Popa, D. Applicability Statement for the Routing Protocol for Low Power and Lossy Networks (RPL) in AMI Networks; Interne T-Draft. Draft-Ietf-Roll-Applicability-Ami-13; IETF: Fremont, CA, USA, 2016. [Google Scholar]
- Vasseur, J.P.; Kim, M.; Pister, K.; Dejean, N.; Barthel, D. Routing Metrics Used for Path Calculation in Low-Power and Lossy Networks; Internet-Draft. Draft-Ietf-Roll-Routing-Metrics-19; IETF: Fremont, CA, USA, 2012. [Google Scholar]
- Kamgueu, P.O.; Nataf, E.; Ndié, T.D.; Festor, O. Energy-Based Routing Metric for RPL; Research Report; Inria: Le Chesnay, France, 2013. [Google Scholar]
- Khallef, W.; Molnar, M.; Benslimane, A.; Durand, S. Multiple constrained QoS routing with RPL. In Proceedings of the IEEE International Conference on Communications (ICC), Paris, France, 21–25 May 2017; pp. 1–6. [Google Scholar]
- Di Marco, P.; Fischione, C.; Athanasiou, G.; Mekikis, P.V. MAC-aware routing metrics for low power and lossy networks. In Proceedings of the IEEE INFOCOM, Turin, Italy, 14–19 April 2013. [Google Scholar]
- Yang, S.; Baek, Y.; Kim, J.; Cho, K.; Han, K. A routing metric for load balance in wireless mesh networks. In Proceedings of the International Conference on Advanced Communication Technology (ICACT), Phoenix Park, Korea, 15–18 February 2009; pp. 1560–1565. [Google Scholar]
- Draves, R.; Padhye, J.; Zill, B. Routing in multi-radio, multi-hop wireless mesh networks. In Proceedings of the 10th Annual International Conference on Mobile Computing and Networking, Philadelphia, PA, USA, 26 September–1 October 2004; pp. 114–128. [Google Scholar]
- Capone, S.; Brama, R.; Accettura, N.; Striccoli, D.; Boggia, G. An Energy Efficient and Reliable Composite Metric for RPL Organized Networks. In Proceedings of the International Conference on Embedded and Ubiquitous Computing (EUC), Milano, Italy, 26–28 August 2014. [Google Scholar]
- Gaddour, O.; Koubâa, A.; Baccour, N.; Abid, M. OF-FL: QoS-aware fuzzy logic objective function for the RPL routing protocol. In Proceedings of the International Symposium on Modeling and Optimization in Mobile, Ad Hoc, and Wireless Networks (WiOpt), Hammamet, Tunisia, 12–16 May 2014. [Google Scholar]
- Kamgueu, P.O.; Nataf, E.; Djotio, T.N. On design and deployment of fuzzy-based metric for routing in low-power and lossy networks. In Proceedings of the Local Computer Networks Conference Workshops (LCN Workshops), Clearwater Beach, FL, USA, 26–29 October 2015. [Google Scholar]
- Harshavardhana, T.; Vineeth, B.; Anand, S.; Hegde, M. Power control and cross-layer design of RPL objective function for low power and lossy networks. In Proceedings of the 10th International Conference on Communication Systems & Networks (COMSNETS), Bengaluru, India, 3–7 January 2018; pp. 214–219. [Google Scholar]
- Karkazis, P.; Leligou, H.C.; Sarakis, L.; Zahariadis, T.; Trakadas, P.; Velivassaki, T.H.; Capsalis, C. Design of primary and composite routing metrics for RPL-compliant wireless sensor networks. In Proceedings of the International Conference on Telecommunications and Multimedia (TEMU), Chania, Greece, 30 July–1 August 2012. [Google Scholar]
- Long, N.T.; Uwase, M.P.; Tiberghien, J.; Steenhaut, K. QoS-aware cross-layer mechanism for multiple instances RPL. In Proceedings of the International Conference on Advanced Technologies for Communications (ATC), Ho Chi Minh City, Vietnam, 16–18 October 2013; pp. 44–49. [Google Scholar]
- Banh, M.; Mac, H.; Nguyen, N.; Phung, K.H.; Thanh, N.H.; Steenhaut, K. Performance evaluation of multiple RPL routing tree instances for Internet of Things applications. In Proceedings of the International Conference on Advanced Technologies for Communications (ATC), Ho Chi Minh City, Vietnam, 14–16 October 2015; pp. 206–211. [Google Scholar]
- DoE, U. Advanced Metering Infrastructure and Customer Systems. 2016. Available online: https://www.energy.gov/sites/prod/files/2016/12/f34/AMI%20Summary%20Report_09-26-16.pdf (accessed on 9 July 2018).
- Radak, J.; Mitton, N.; Simplot-Ryl, D. Using Battery Level as Metric for Graph Planarization. In Proceedings of the International Conference on Ad Hoc Networks and Wireless (AdHocNow), Paderborn, Germany, 18–20 July 2011; pp. 58–71. [Google Scholar]
- Adjih, C.; Baccelli, E.; Fleury, E.; Harter, G.; Mitton, N.; Noel, T.; Pissard-Gibollet, R.; Saint-Marcel, F.; Schreiner, G.; Vandaele, J.; et al. FIT IoT-LAB: A large scale open experimental IoT testbed. In Proceedings of the IEEE 2nd World Forum on Internet of Things (WF-IoT), Milan, Italy, 14–16 December 2015; pp. 459–464. [Google Scholar] [CrossRef]
- Fleury, E.; Mitton, N.; Noel, T.; Adjih, C. FIT IoT-LAB: The largest iot open experimental testbed. ERCIM News, 2015. [Google Scholar]
- Rohner, C.; Feeney, L.M.; Gunningberg, P. Evaluating battery models in wireless sensor networks. In Proceedings of the International Conference on Wired/Wireless Internet Communication, St. Petersburg, Russia, 5–7 June 2013; pp. 29–42. [Google Scholar]
- Park, C.; Lahiri, K.; Raghunathan, A. Battery discharge characteristics of wireless sensor nodes: An experimental analysis. In Proceedings of the 2nd Annual IEEE Communications Society Conference on Sensor and Ad Hoc Communications and Networks (SECON), Santa Clara, CA, USA, 26–29 September 2005; pp. 430–440. [Google Scholar]
- Jeremy Dubrulle Master Thesis. Available online: https://jeremydubrulle.com/master_thesis.pdf (accessed on 15 June 2018).
- Nassar, J.; Gouvy, N.; Mitton, N. Towards Multi-instances QoS Efficient RPL for Smart Grids. In Proceedings of the 14th ACM International Symposium on Performance Evaluation of Wireless Ad Hoc, Sensor, and Ubiquitous Networks (PE-WASUN), Miami, FL, USA, 21–25 November 2017. [Google Scholar]


| Data Traffic | Maximum Allowed Delay | Reliability |
|---|---|---|
| DA-Data related to the protection of the distribution network | <3 s | >99.5% |
| DERs (Distributed Energy Resources)—Data related to the protection of the distribution network | <4 s | <99.5 % |
| Critical traffic of: DA, DSM, AMI, DERs | <5 s | >99.5% |
| Electric transport | <10 s | >98% |
| Non critical traffic of DSM & AMI | <15 s | >98% |
| Non critical traffic of DA & AMI | <30 s | >98% |
| Network configuration traffic, normal AMI traffic | <5 min | >98% |
| Normal AMI traffic | <4 h | >98% |
| Network configuration traffic | <Hours/Days | >98% |
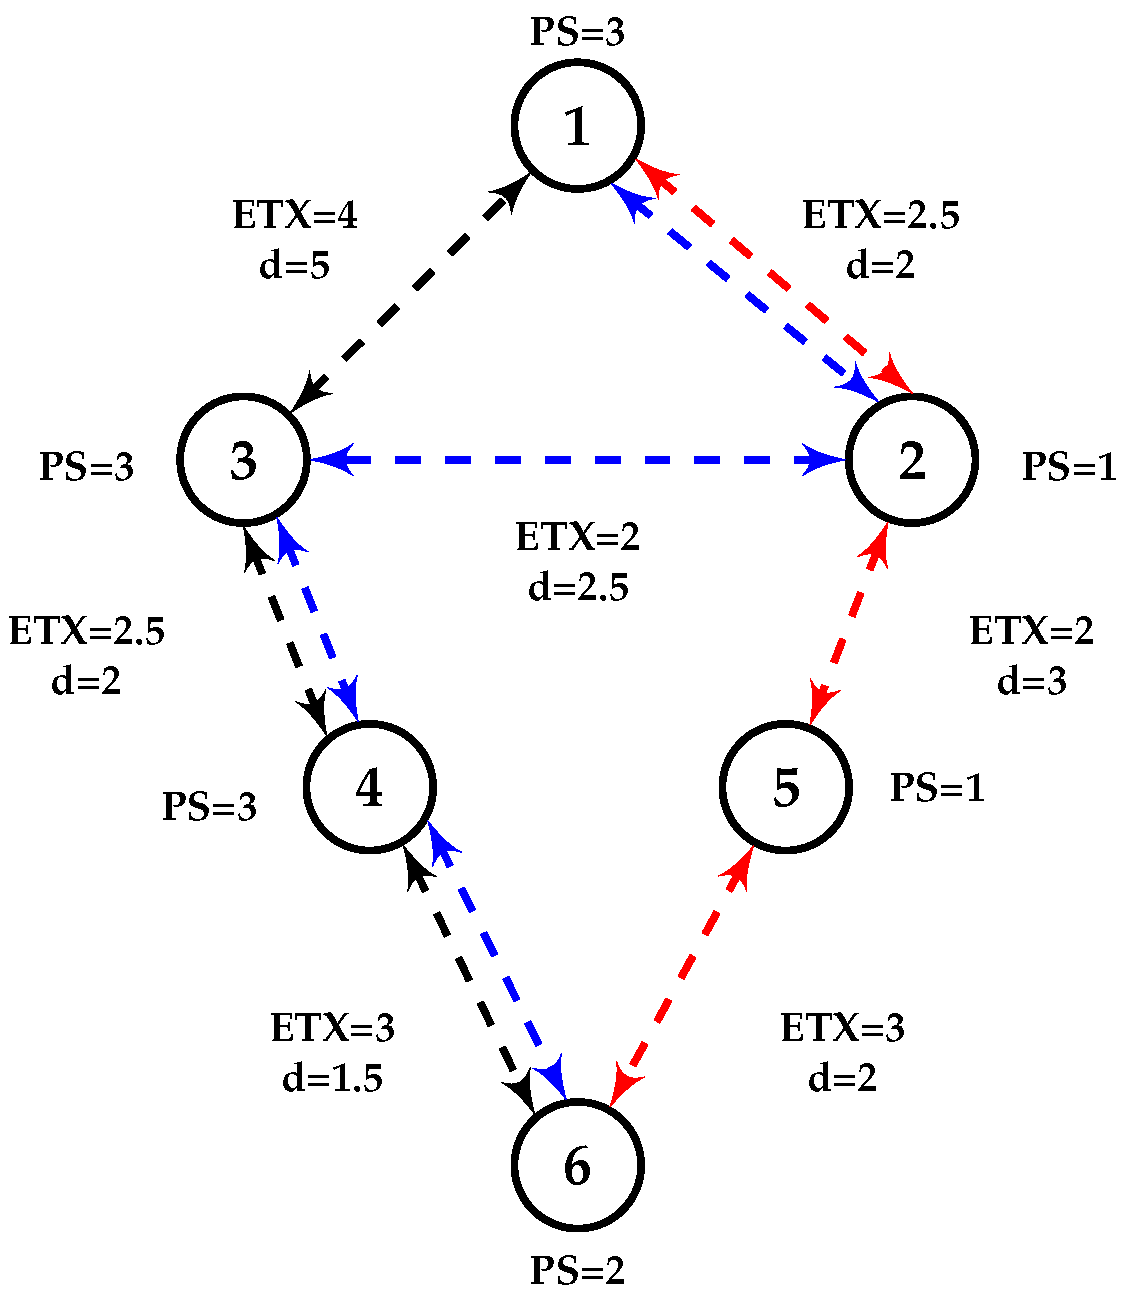
| Paths | |||
|---|---|---|---|
| Path 1 | Path 2 | Path 3 | |
| Metrics | 6->5->2->1 | 6->4->3->1 | 6->4->3->2->1 |
| Instance 1 | 7.5 | 9.5 | 10 |
| Instance 2 | - | - | - |
| Instance 1 | 7.5 | 9.5 | 10 |
| Instance 2 | 3 | 3 | 4 |
| Instance 1 | 14.9 | 23.9 | 16.3 |
| = 0.9 = 0.1 | |||
| Instance 2 | 1.4 | 1.2 | 1.1 |
| = 0.1 = 0.9 | |||
| Parameters | Values |
|---|---|
| OS | Contiki master version |
| Testbed | FIT IOT-LAB |
| Communication protocols | CSMA, RDC contikimac, IEEE 802.15.4, ContikiRPL, IPv6 |
| OF | 1-OFQS with 2 instances |
| 2-MRHOF (ETX) & OF0 (HC) | |
| Number of nodes | 67 clients and 1 server |
| Sensors | M3 |
| Microcontroller Unit | ARM Cortex M3, 32-bits, 72 MHz, 64 kB RAM |
| Maximum packet size | 30 kb |
| Sending interval | 1 packet every 1 to 60 s |
© 2018 by the authors. Licensee MDPI, Basel, Switzerland. This article is an open access article distributed under the terms and conditions of the Creative Commons Attribution (CC BY) license (http://creativecommons.org/licenses/by/4.0/).
Share and Cite
Nassar, J.; Berthomé, M.; Dubrulle, J.; Gouvy, N.; Mitton, N.; Quoitin, B. Multiple Instances QoS Routing in RPL: Application to Smart Grids. Sensors 2018, 18, 2472. https://doi.org/10.3390/s18082472
Nassar J, Berthomé M, Dubrulle J, Gouvy N, Mitton N, Quoitin B. Multiple Instances QoS Routing in RPL: Application to Smart Grids. Sensors. 2018; 18(8):2472. https://doi.org/10.3390/s18082472
Chicago/Turabian StyleNassar, Jad, Matthieu Berthomé, Jérémy Dubrulle, Nicolas Gouvy, Nathalie Mitton, and Bruno Quoitin. 2018. "Multiple Instances QoS Routing in RPL: Application to Smart Grids" Sensors 18, no. 8: 2472. https://doi.org/10.3390/s18082472
APA StyleNassar, J., Berthomé, M., Dubrulle, J., Gouvy, N., Mitton, N., & Quoitin, B. (2018). Multiple Instances QoS Routing in RPL: Application to Smart Grids. Sensors, 18(8), 2472. https://doi.org/10.3390/s18082472