Assistive Handlebar Based on Tactile Sensors: Control Inputs and Human Factors


Abstract
1. Introduction
2. Background
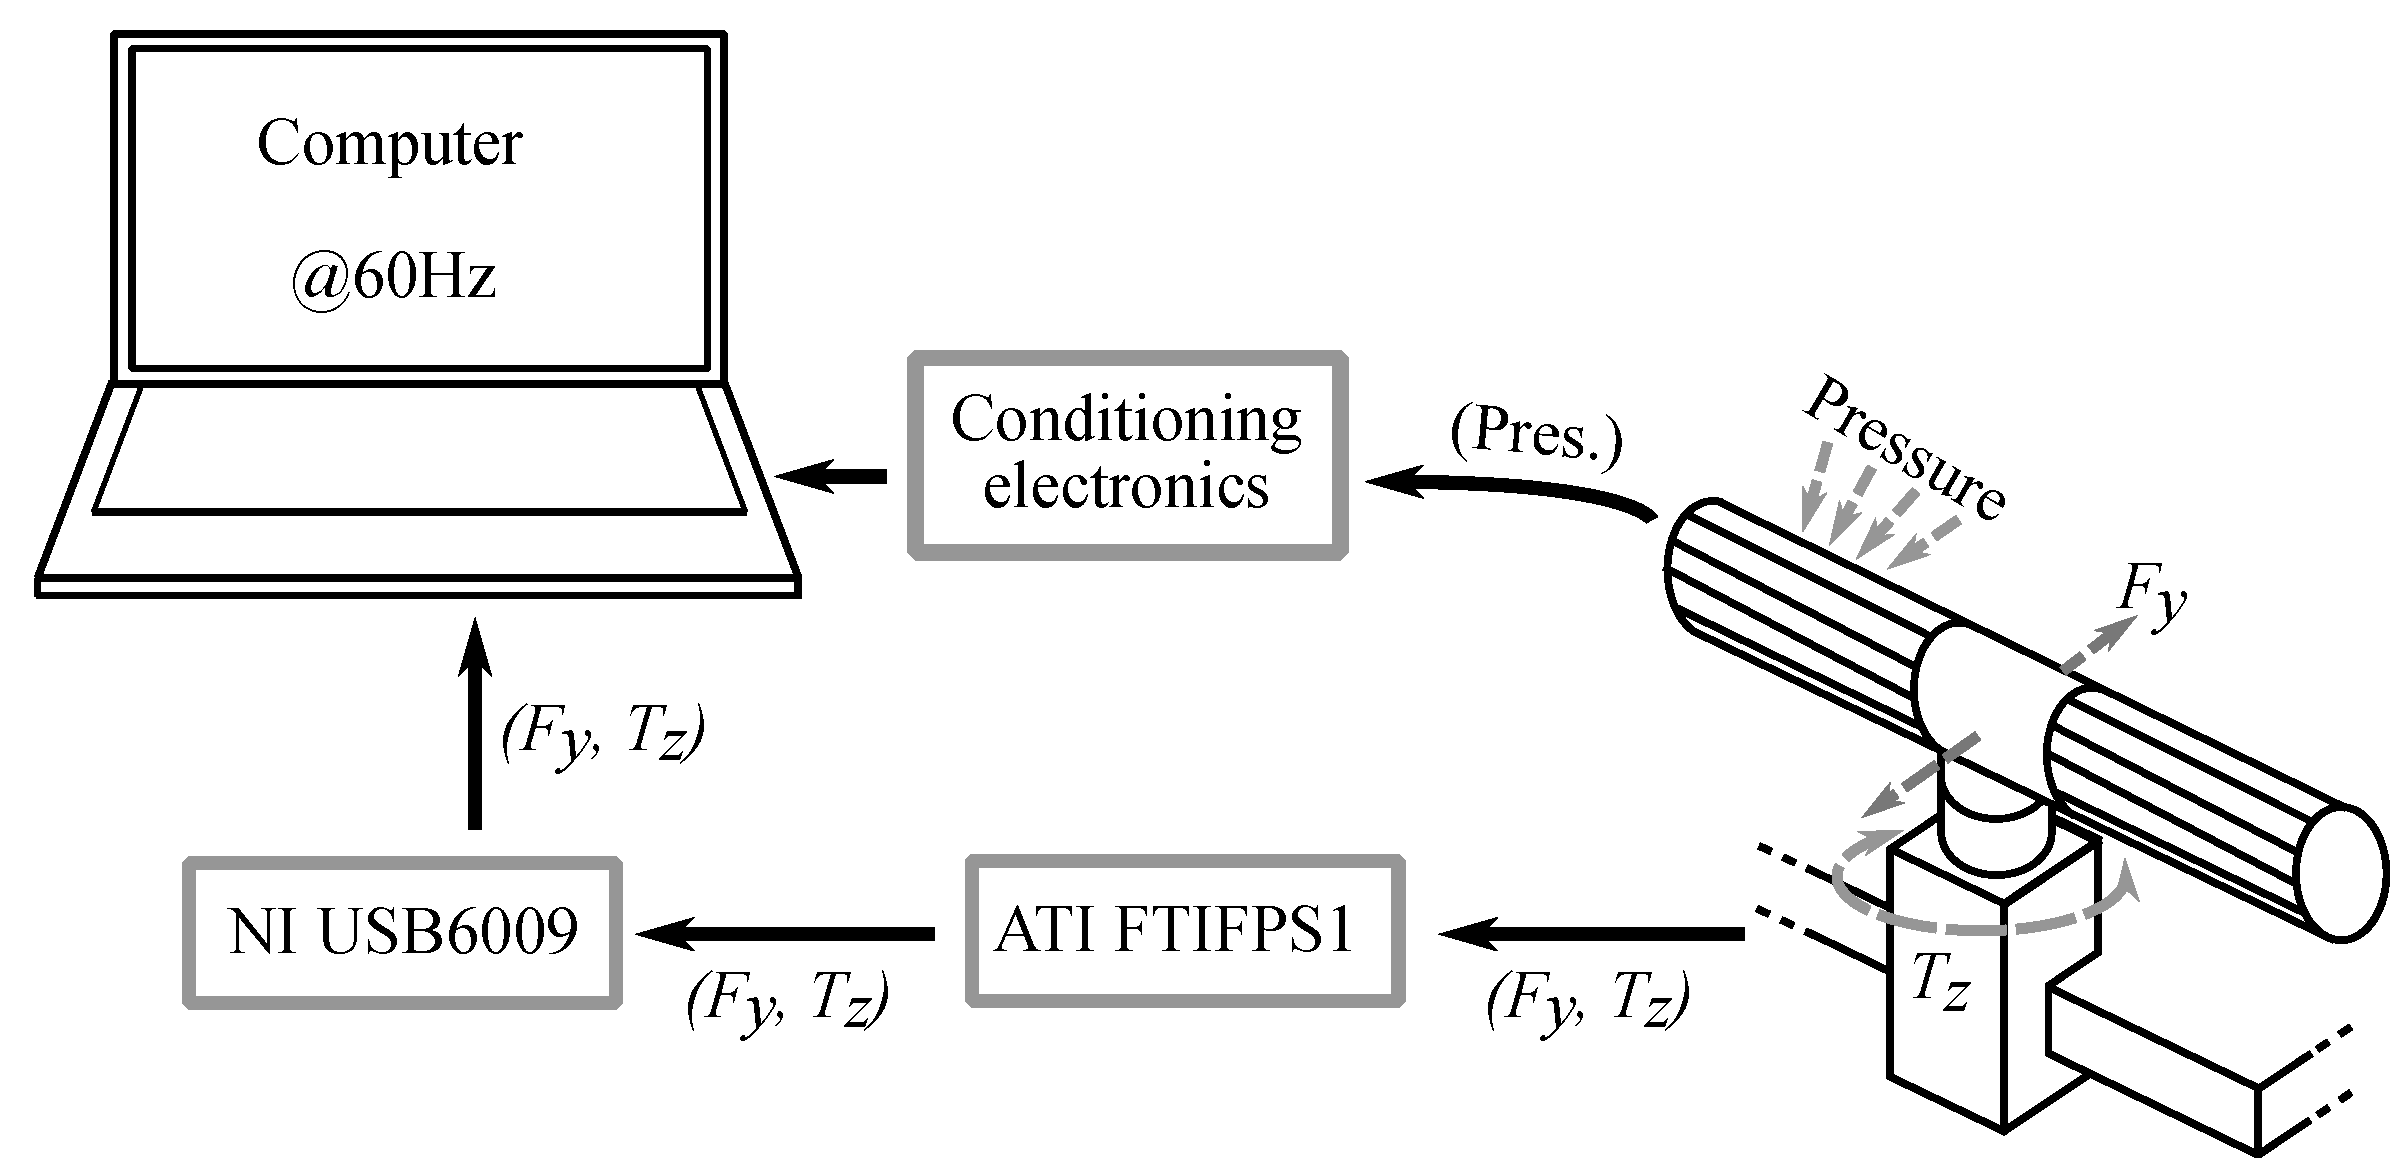
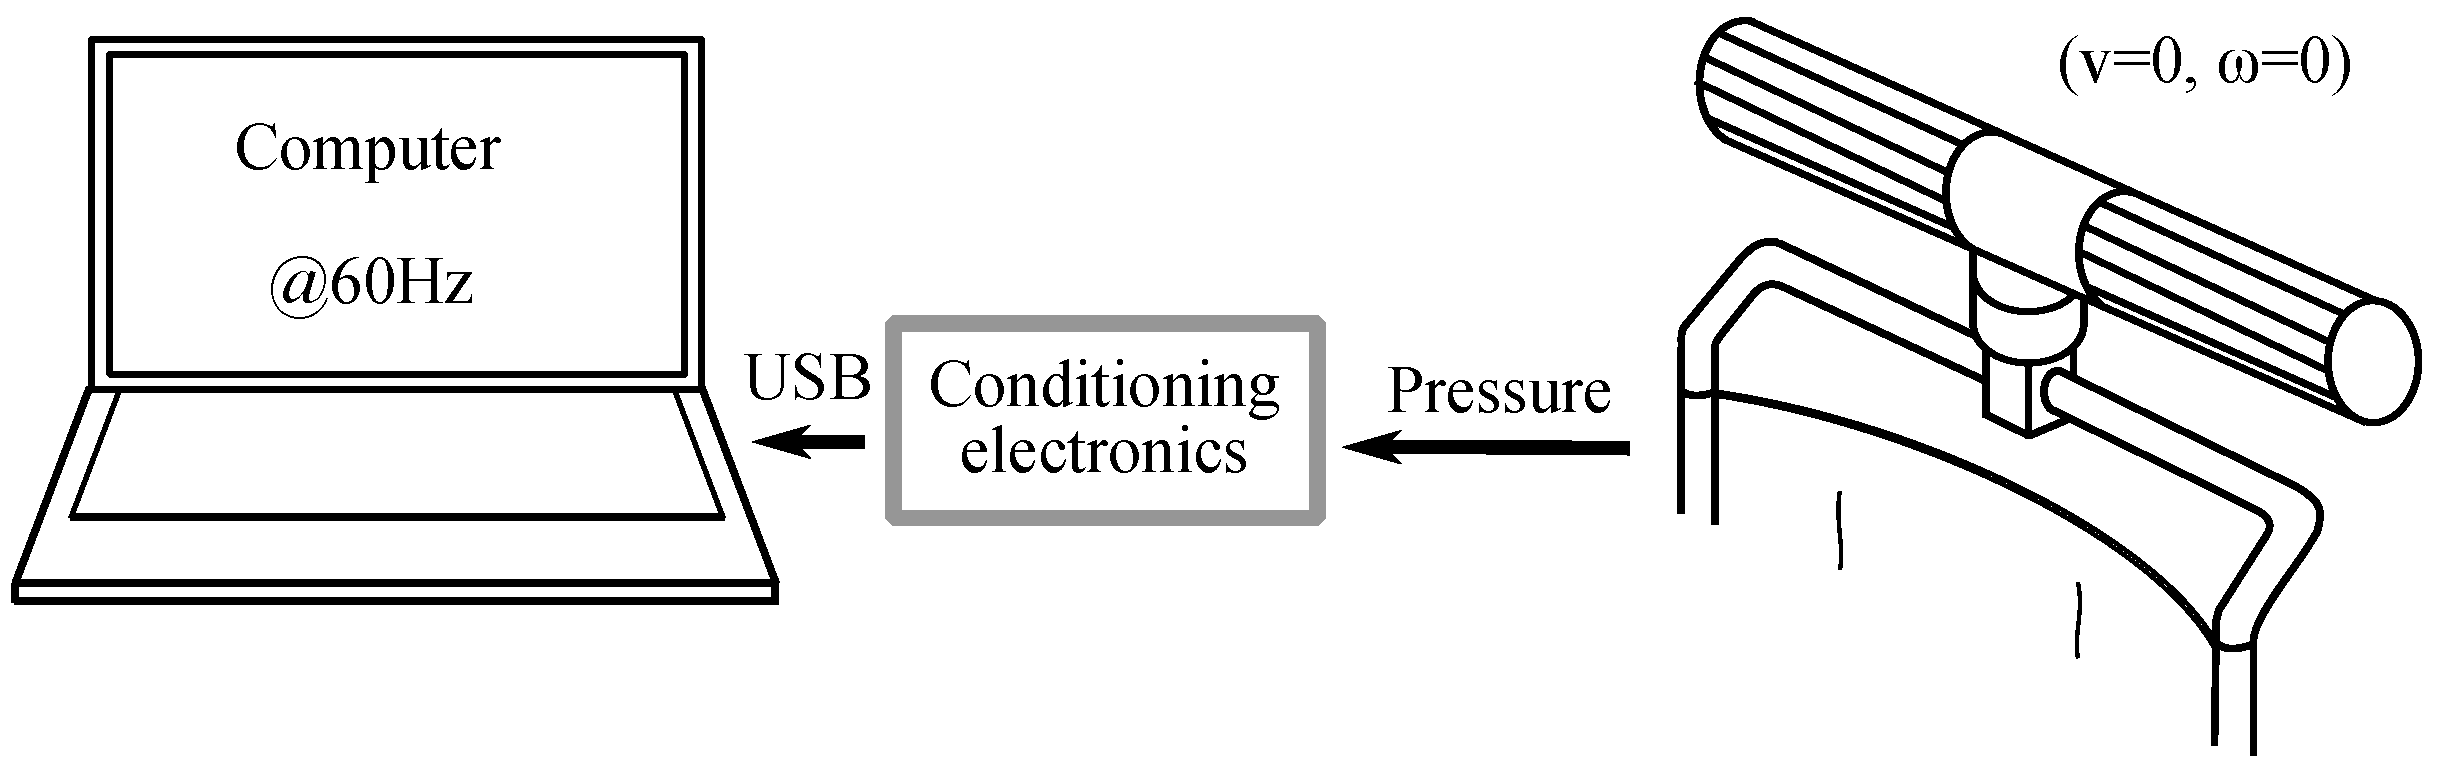
3. Experimental Setup and Parameters of Interest
- EA: Experiment aimed to identify -based control inputs capable of predicting the user intention.
- EB: Experiment aimed to analyze the influence of the gripping force on the control inputs when grasping the handlebar.
- EC: Experiment carried out with the purpose of studying how the tactel configuration inside the tactile array affects the proposed control inputs.
- ED: Experiment conducted to study the grasping process in terms of evolution. Some aspects as the impact of the user height or the gripping force on this process are also studied.
4. Tactile Control Inputs Based on Force/Torque and Pressure Analysis
4.1. Methods
4.2. Results and Discussion
5. Study of the Gripping Force Influence
5.1. Grip Force Impact on the Link between Force and Torque Involved in Driving and the Parameters Obtained by the Tactile Handlebar
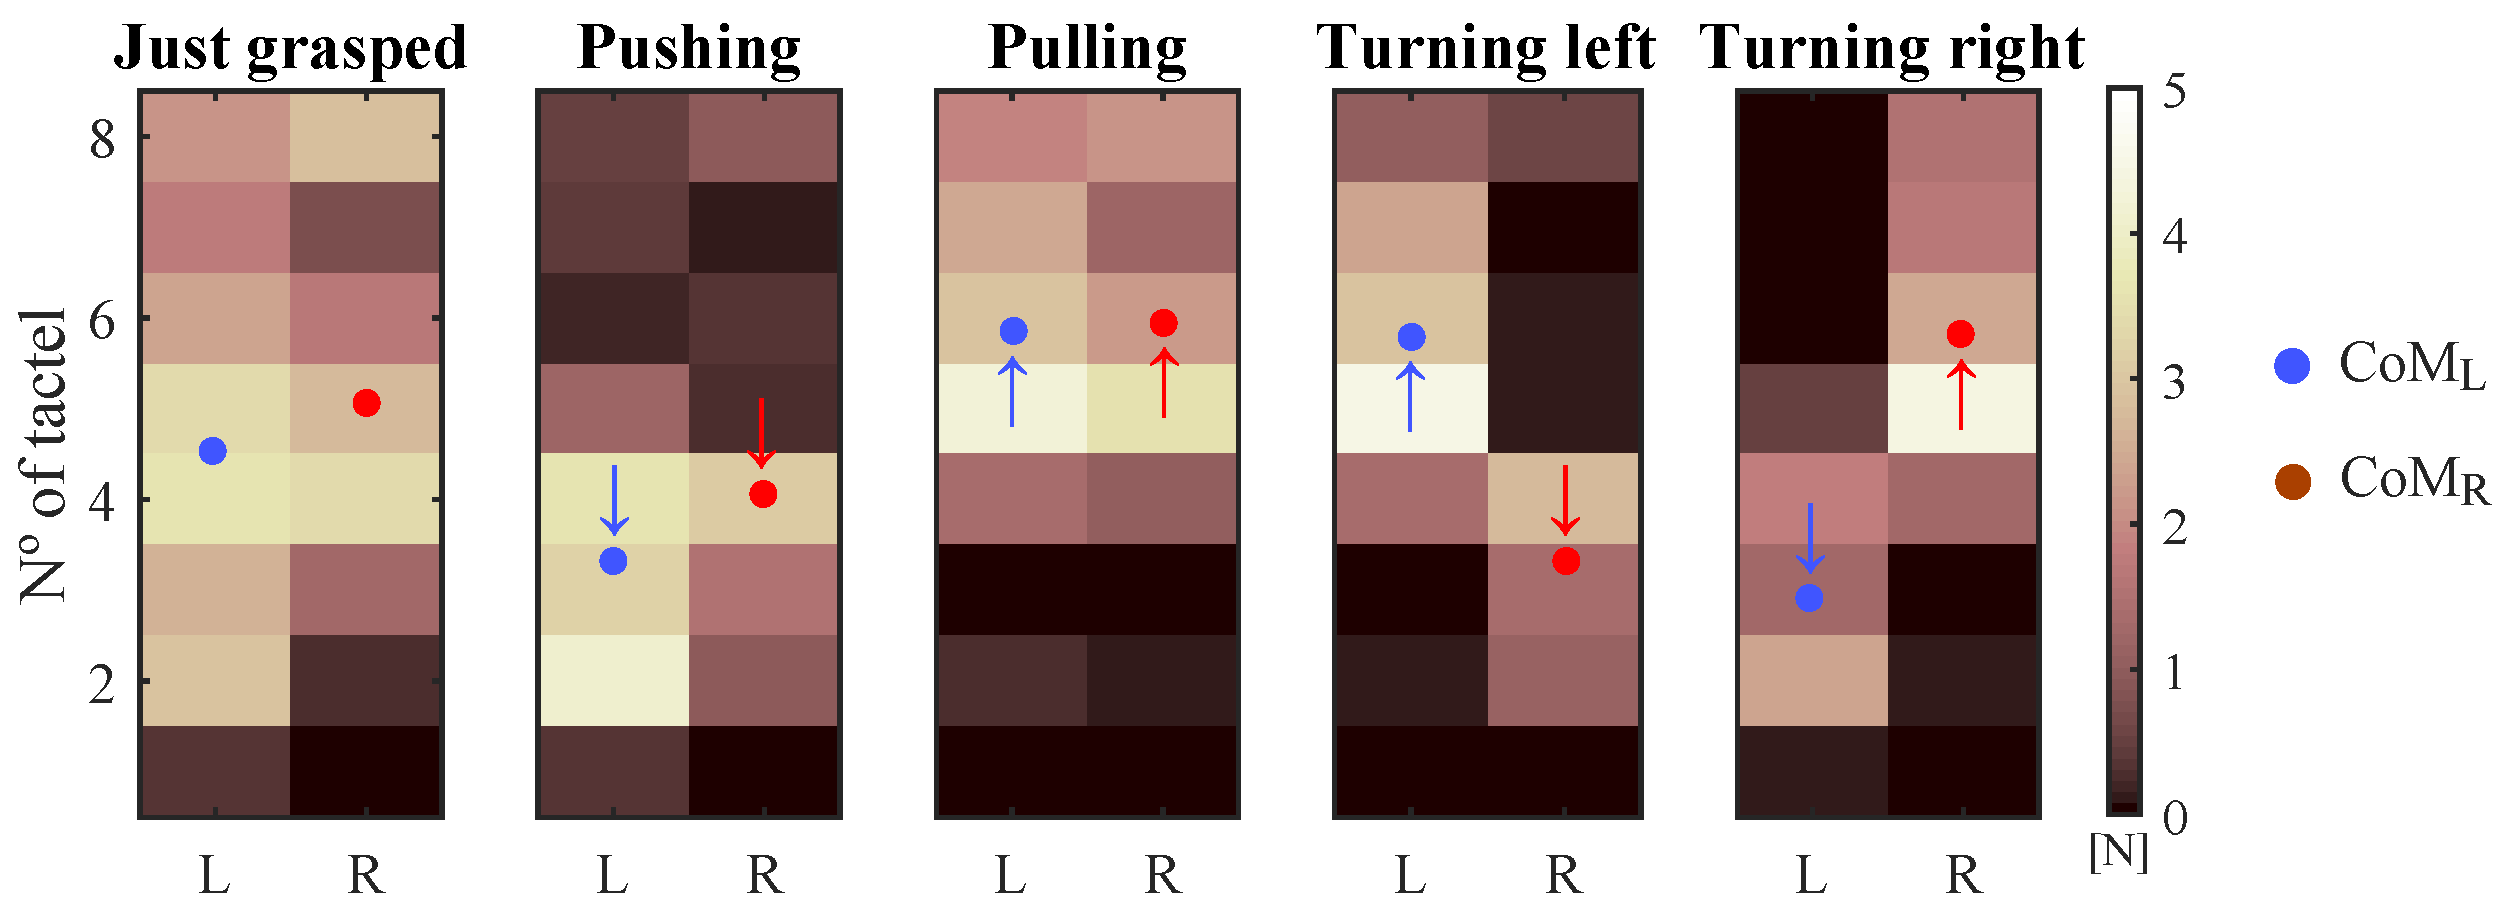
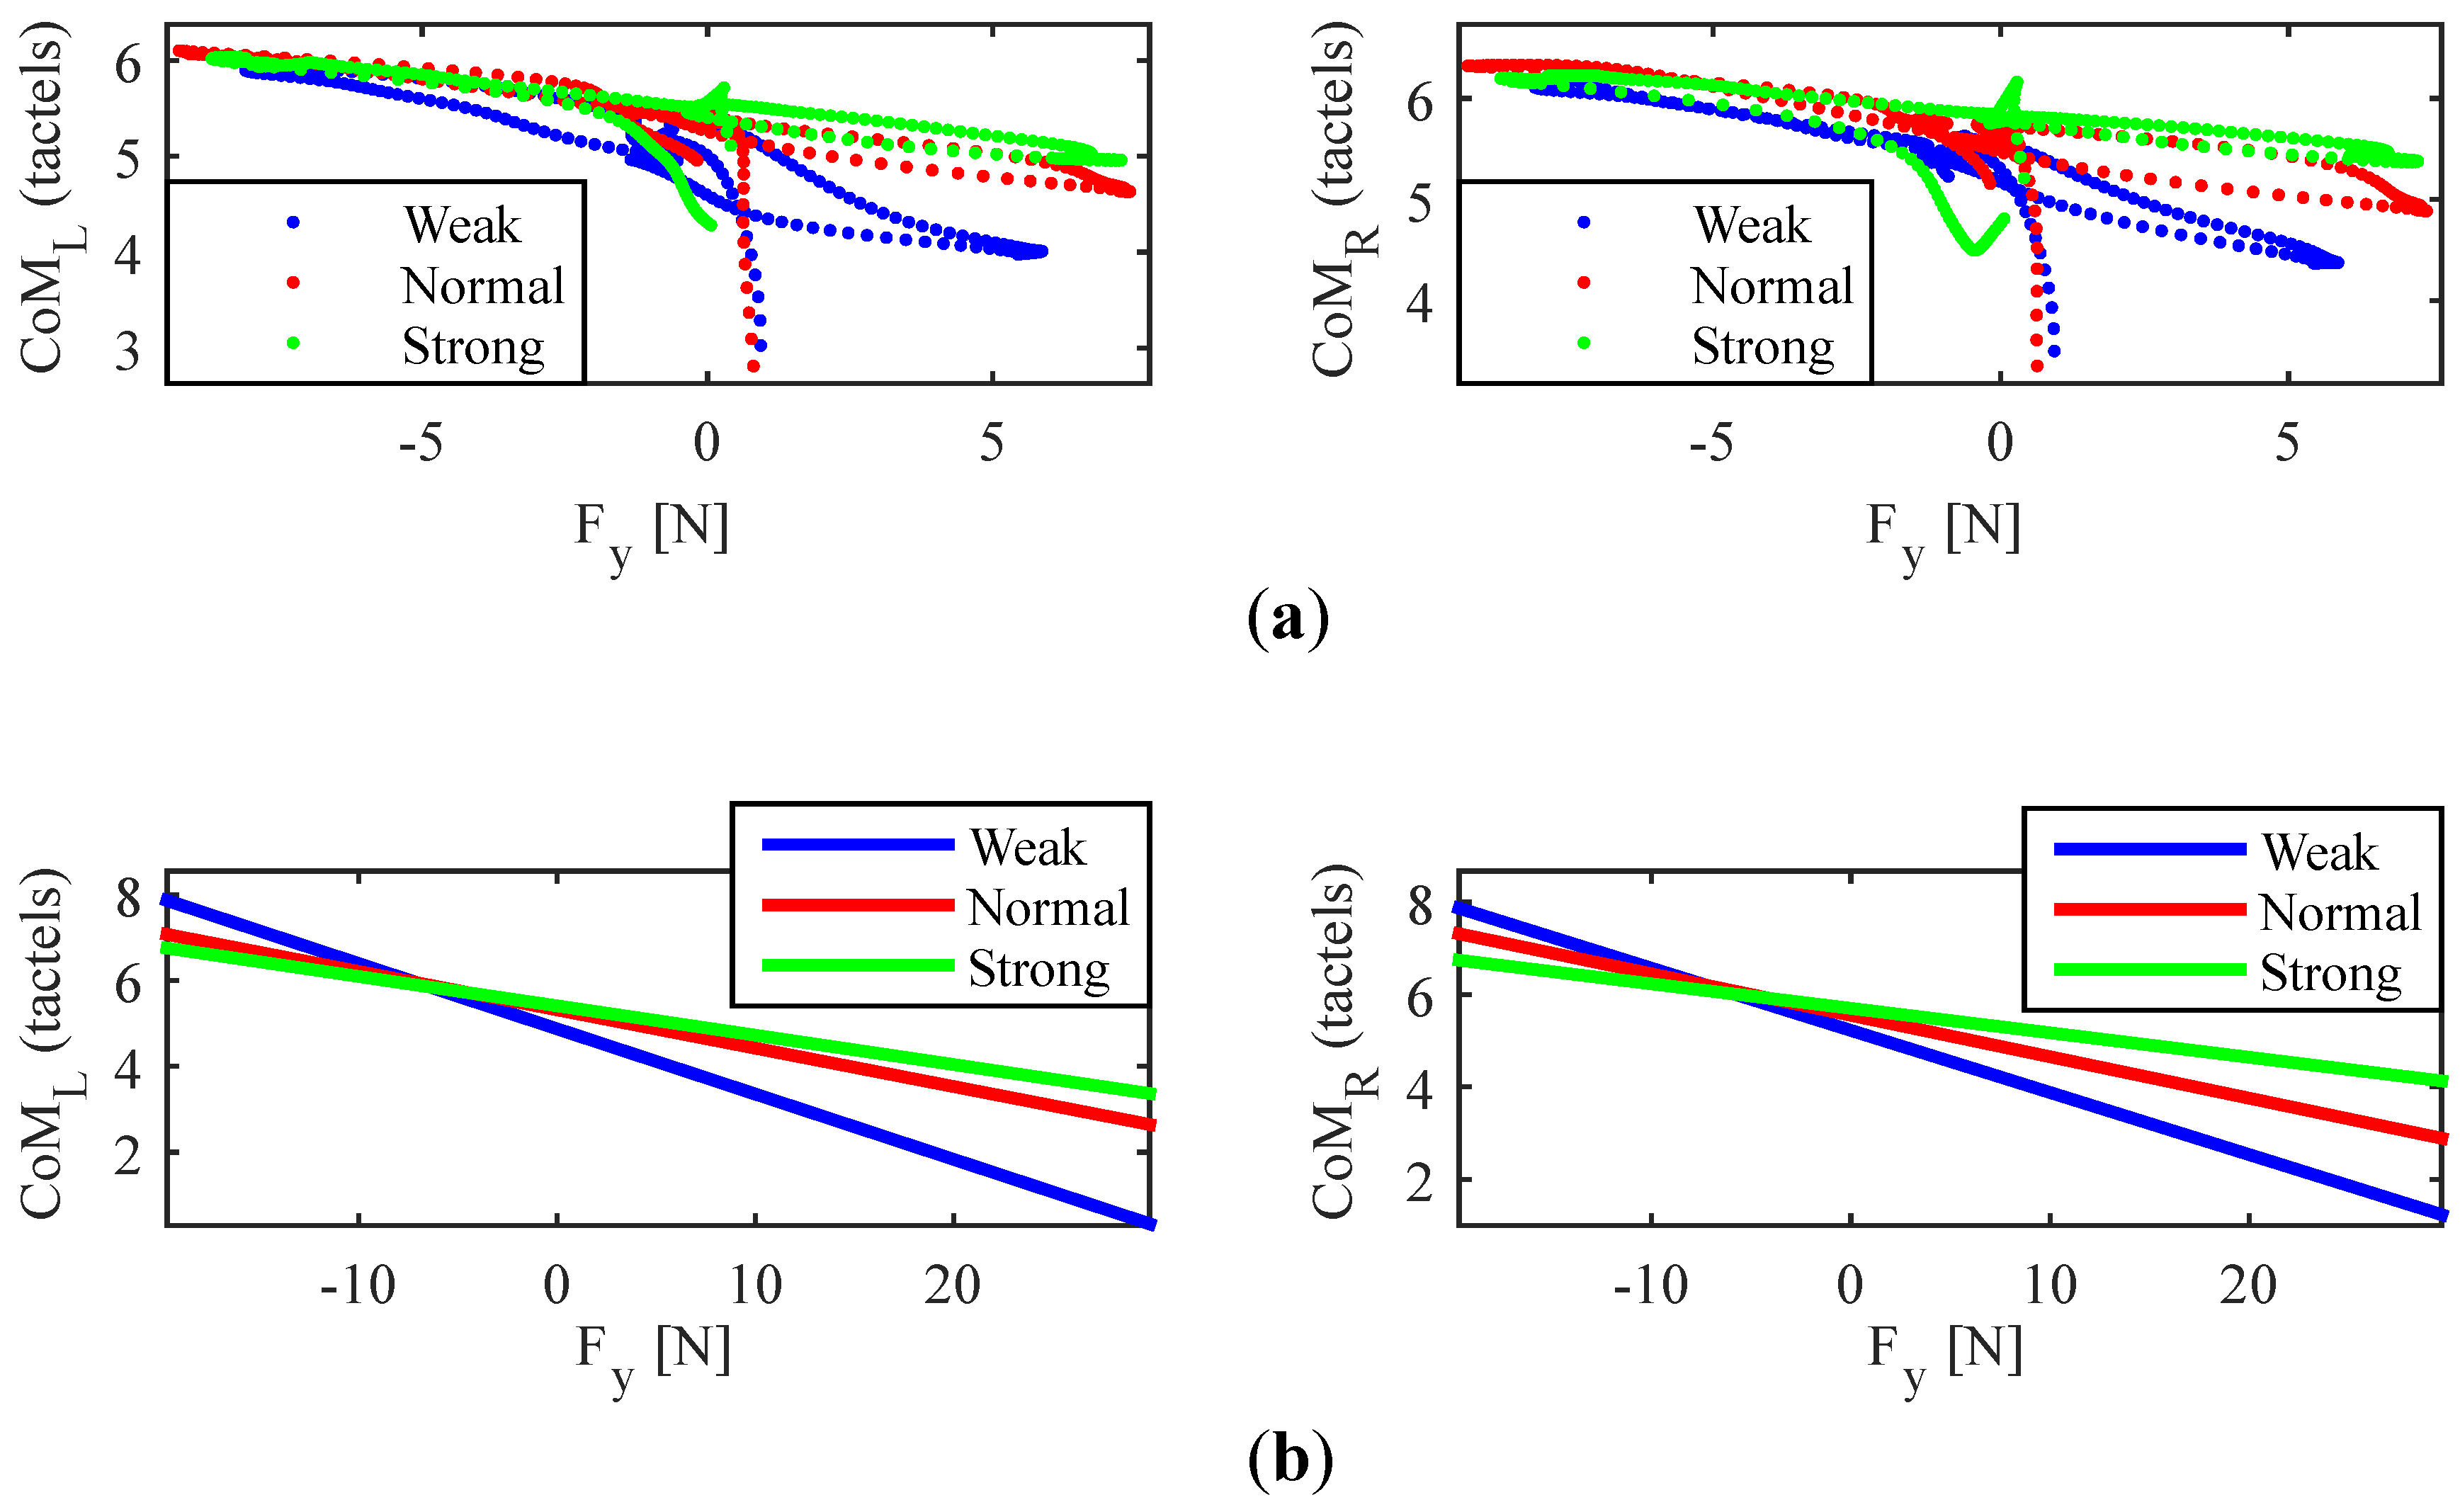
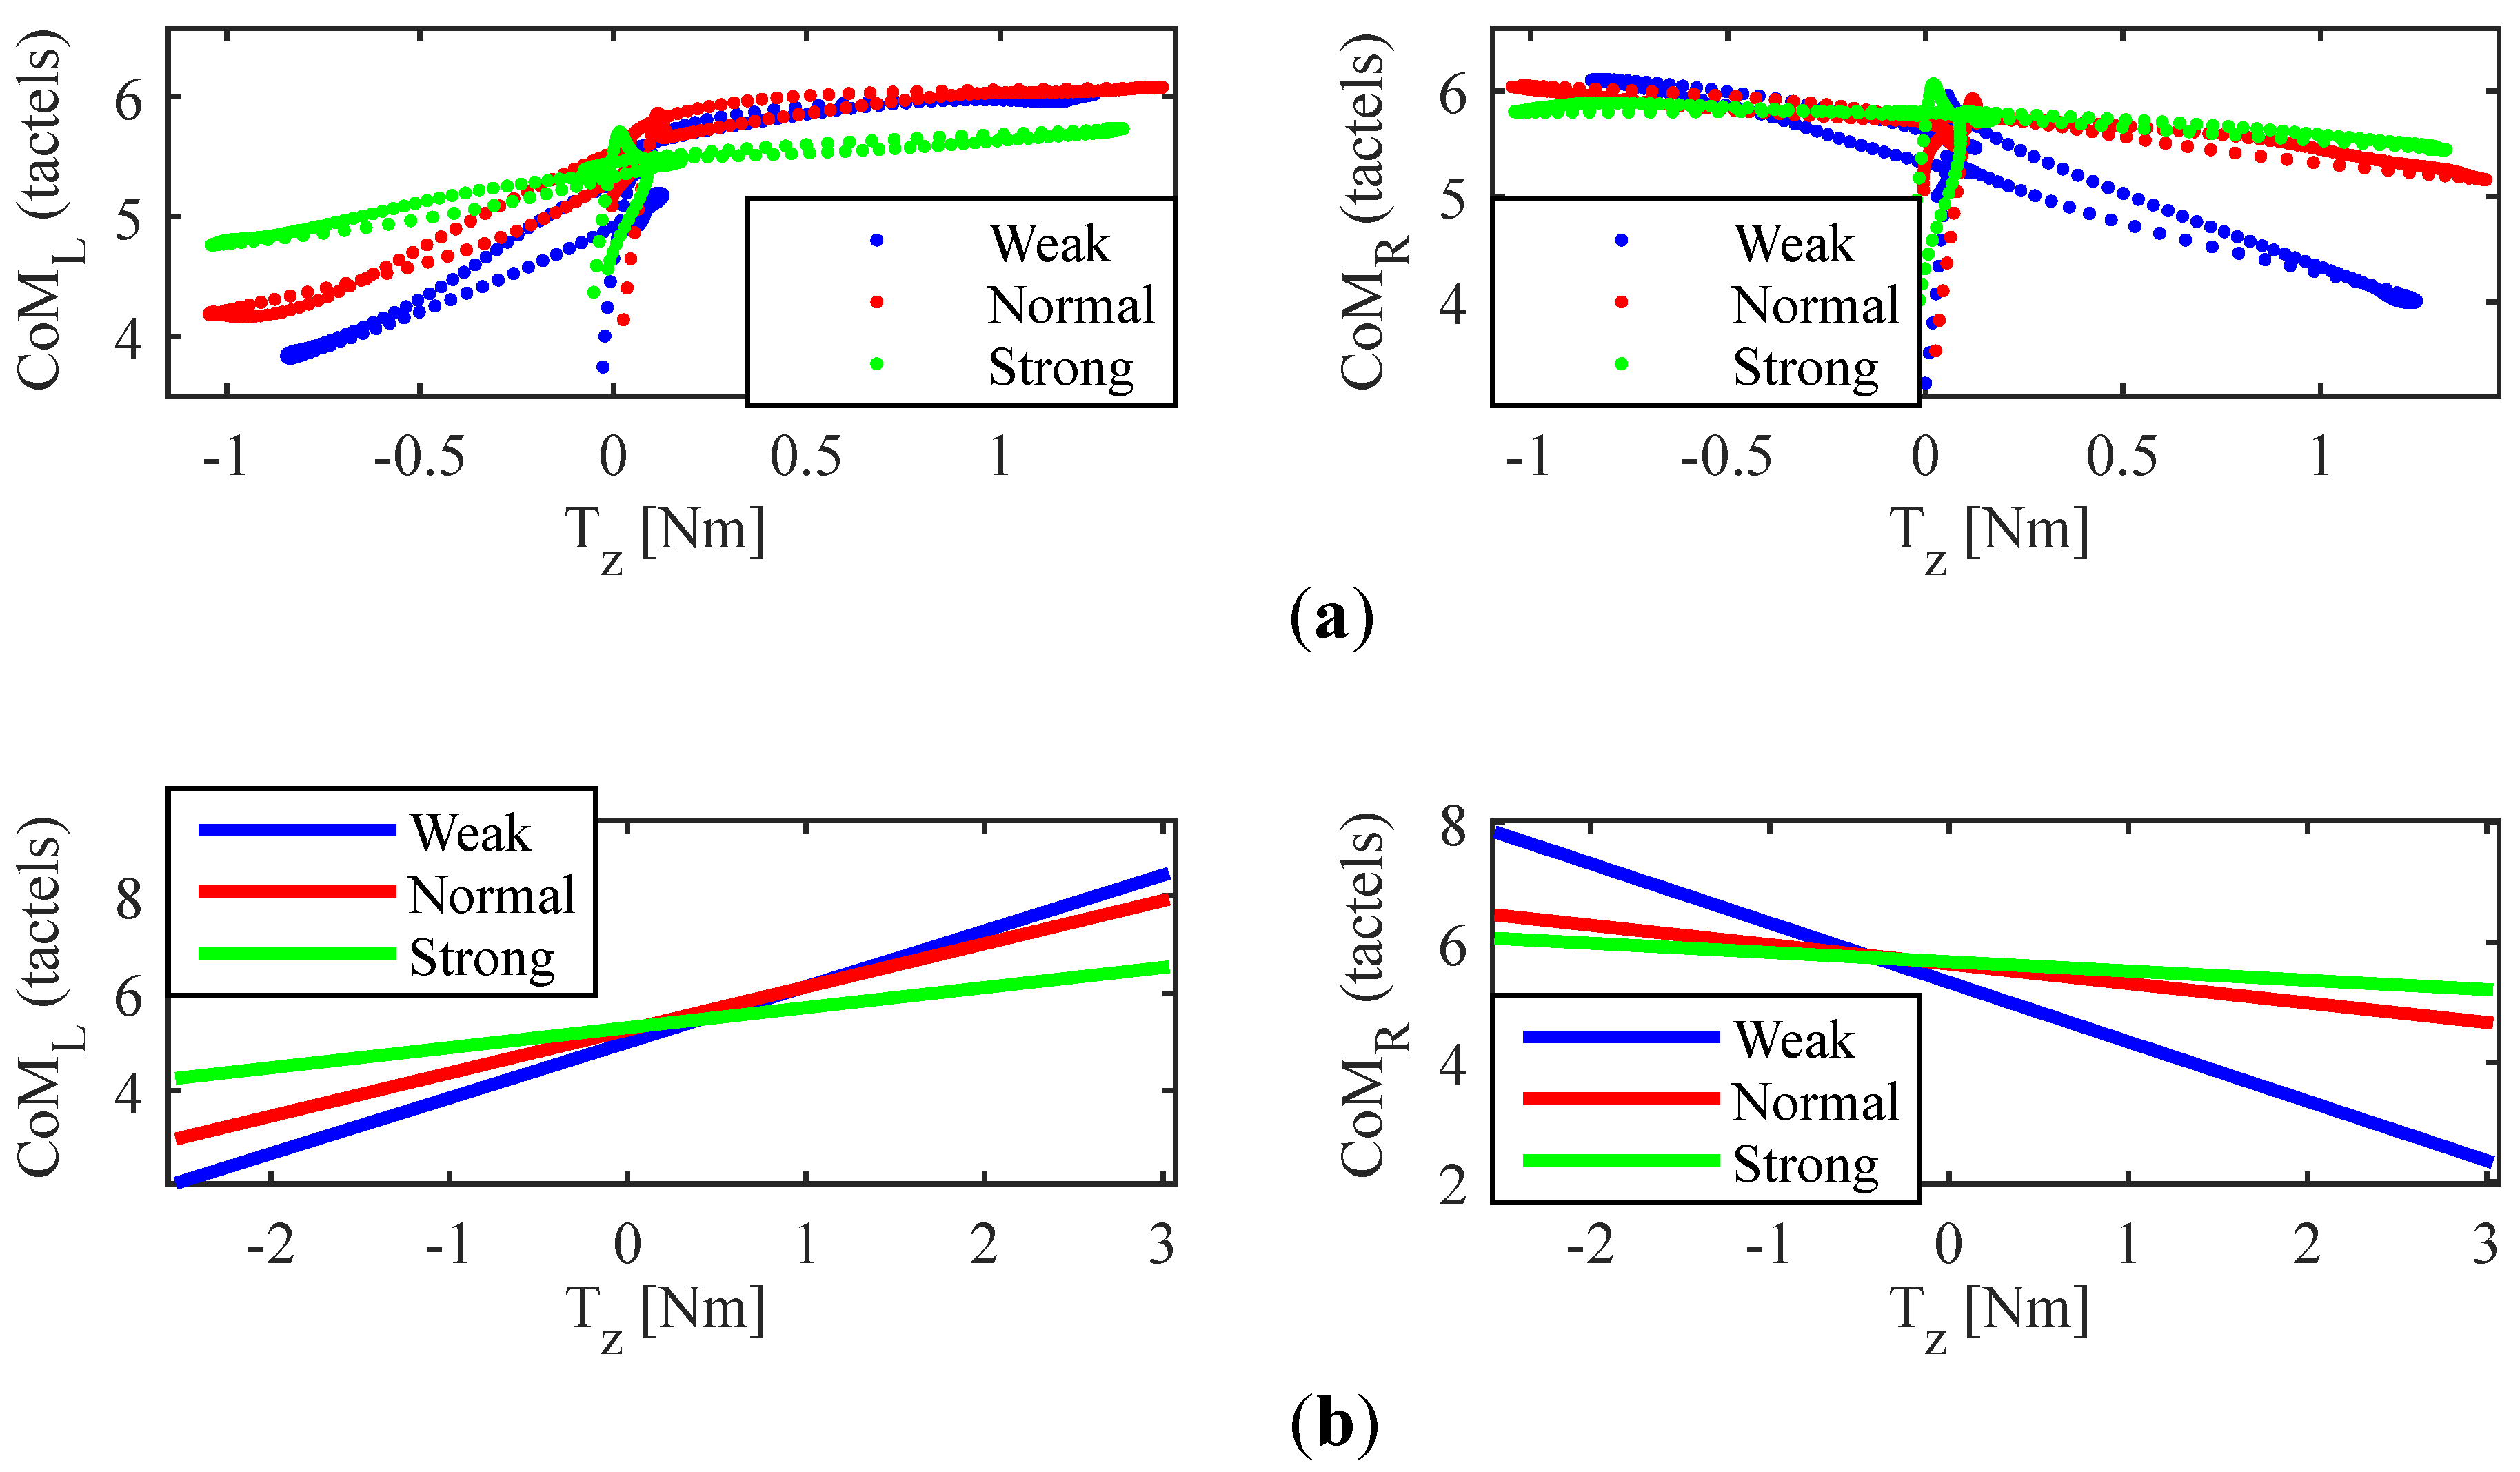
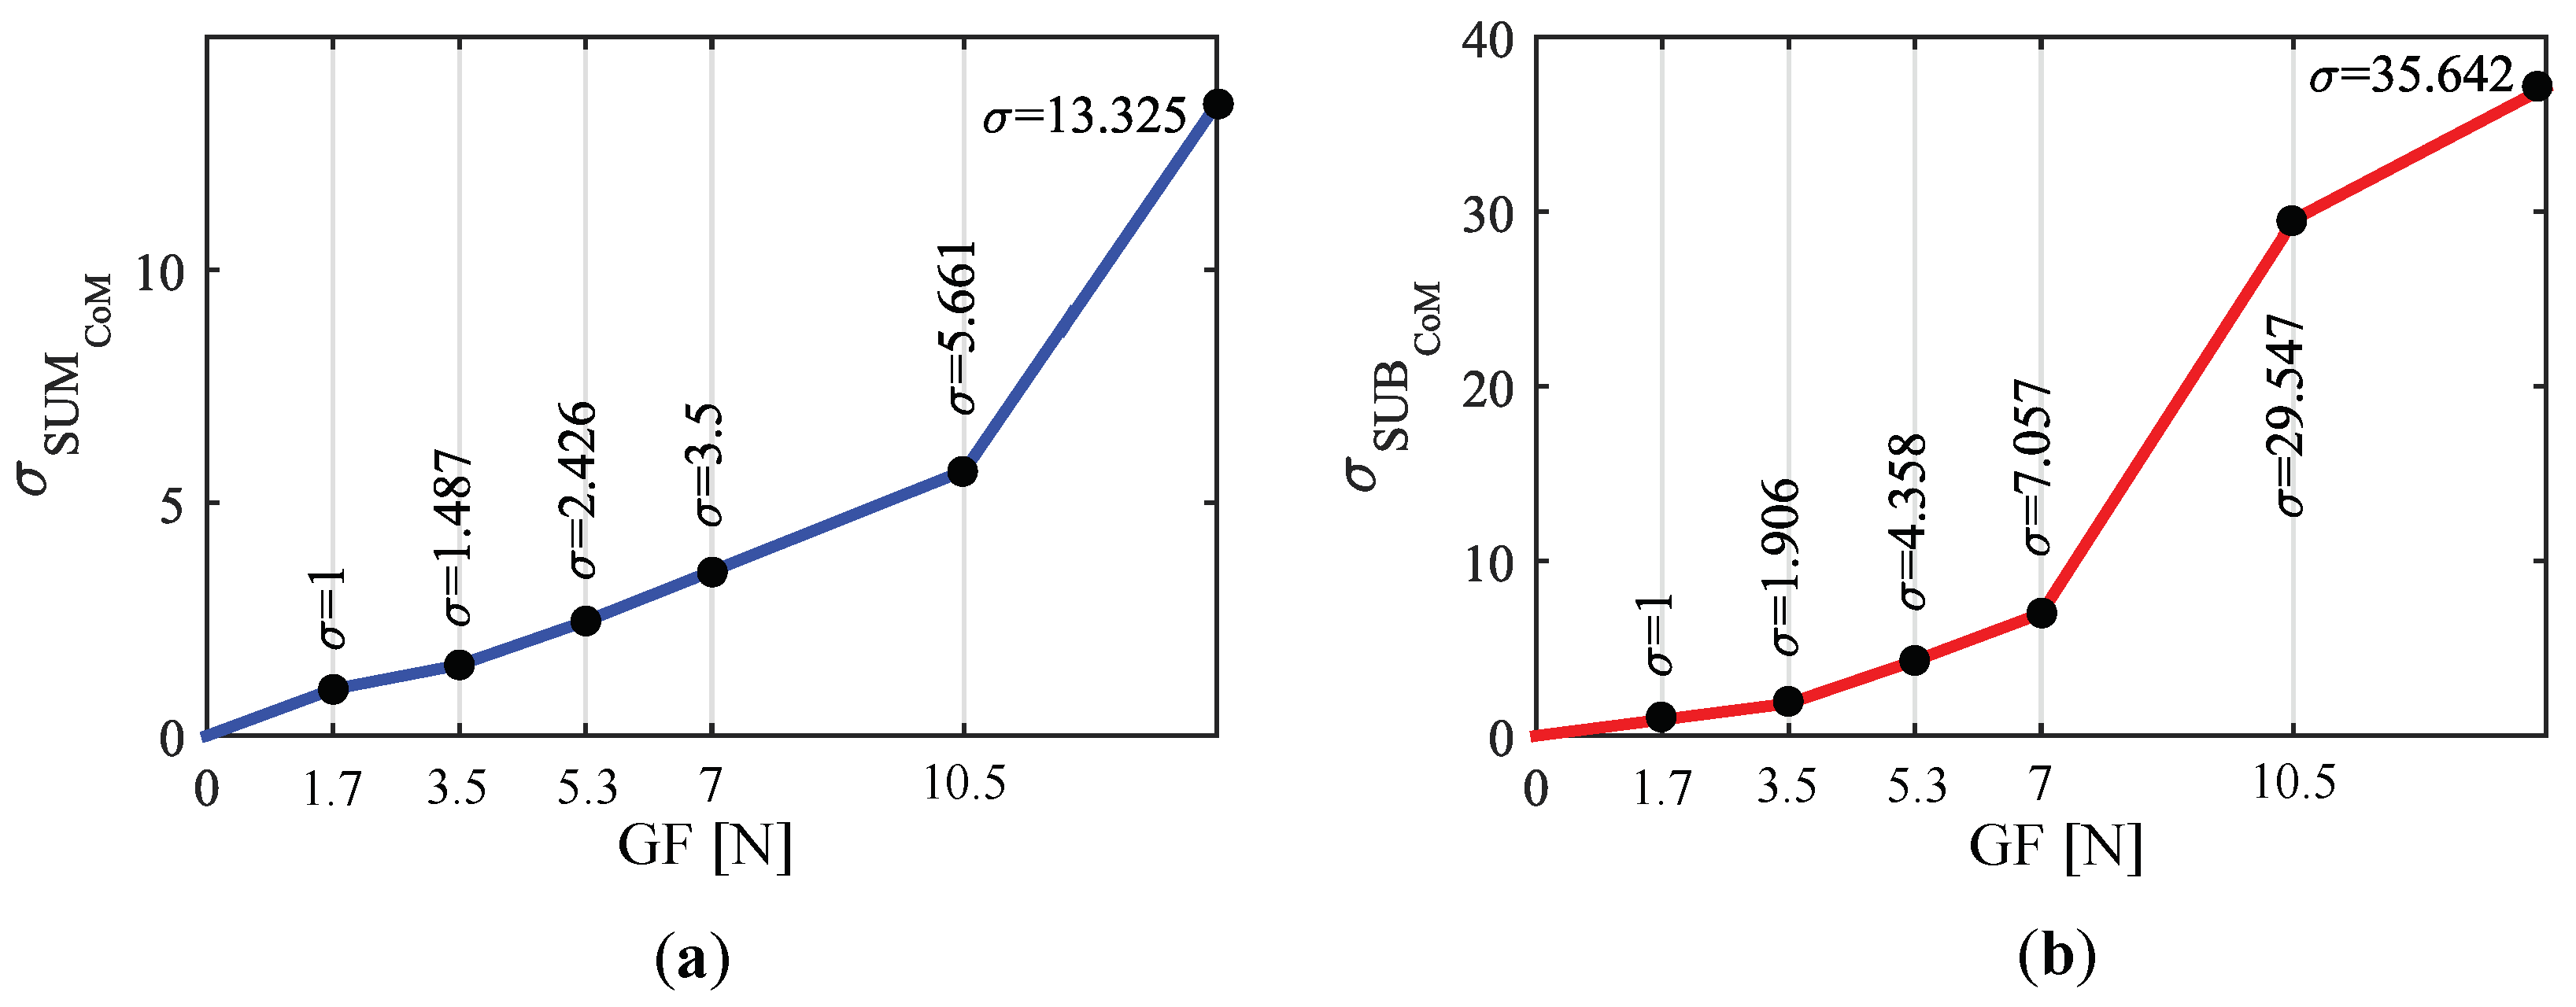
5.2. Grip Force Impact on the Excursion of the Centers of Mass
5.2.1. Methods
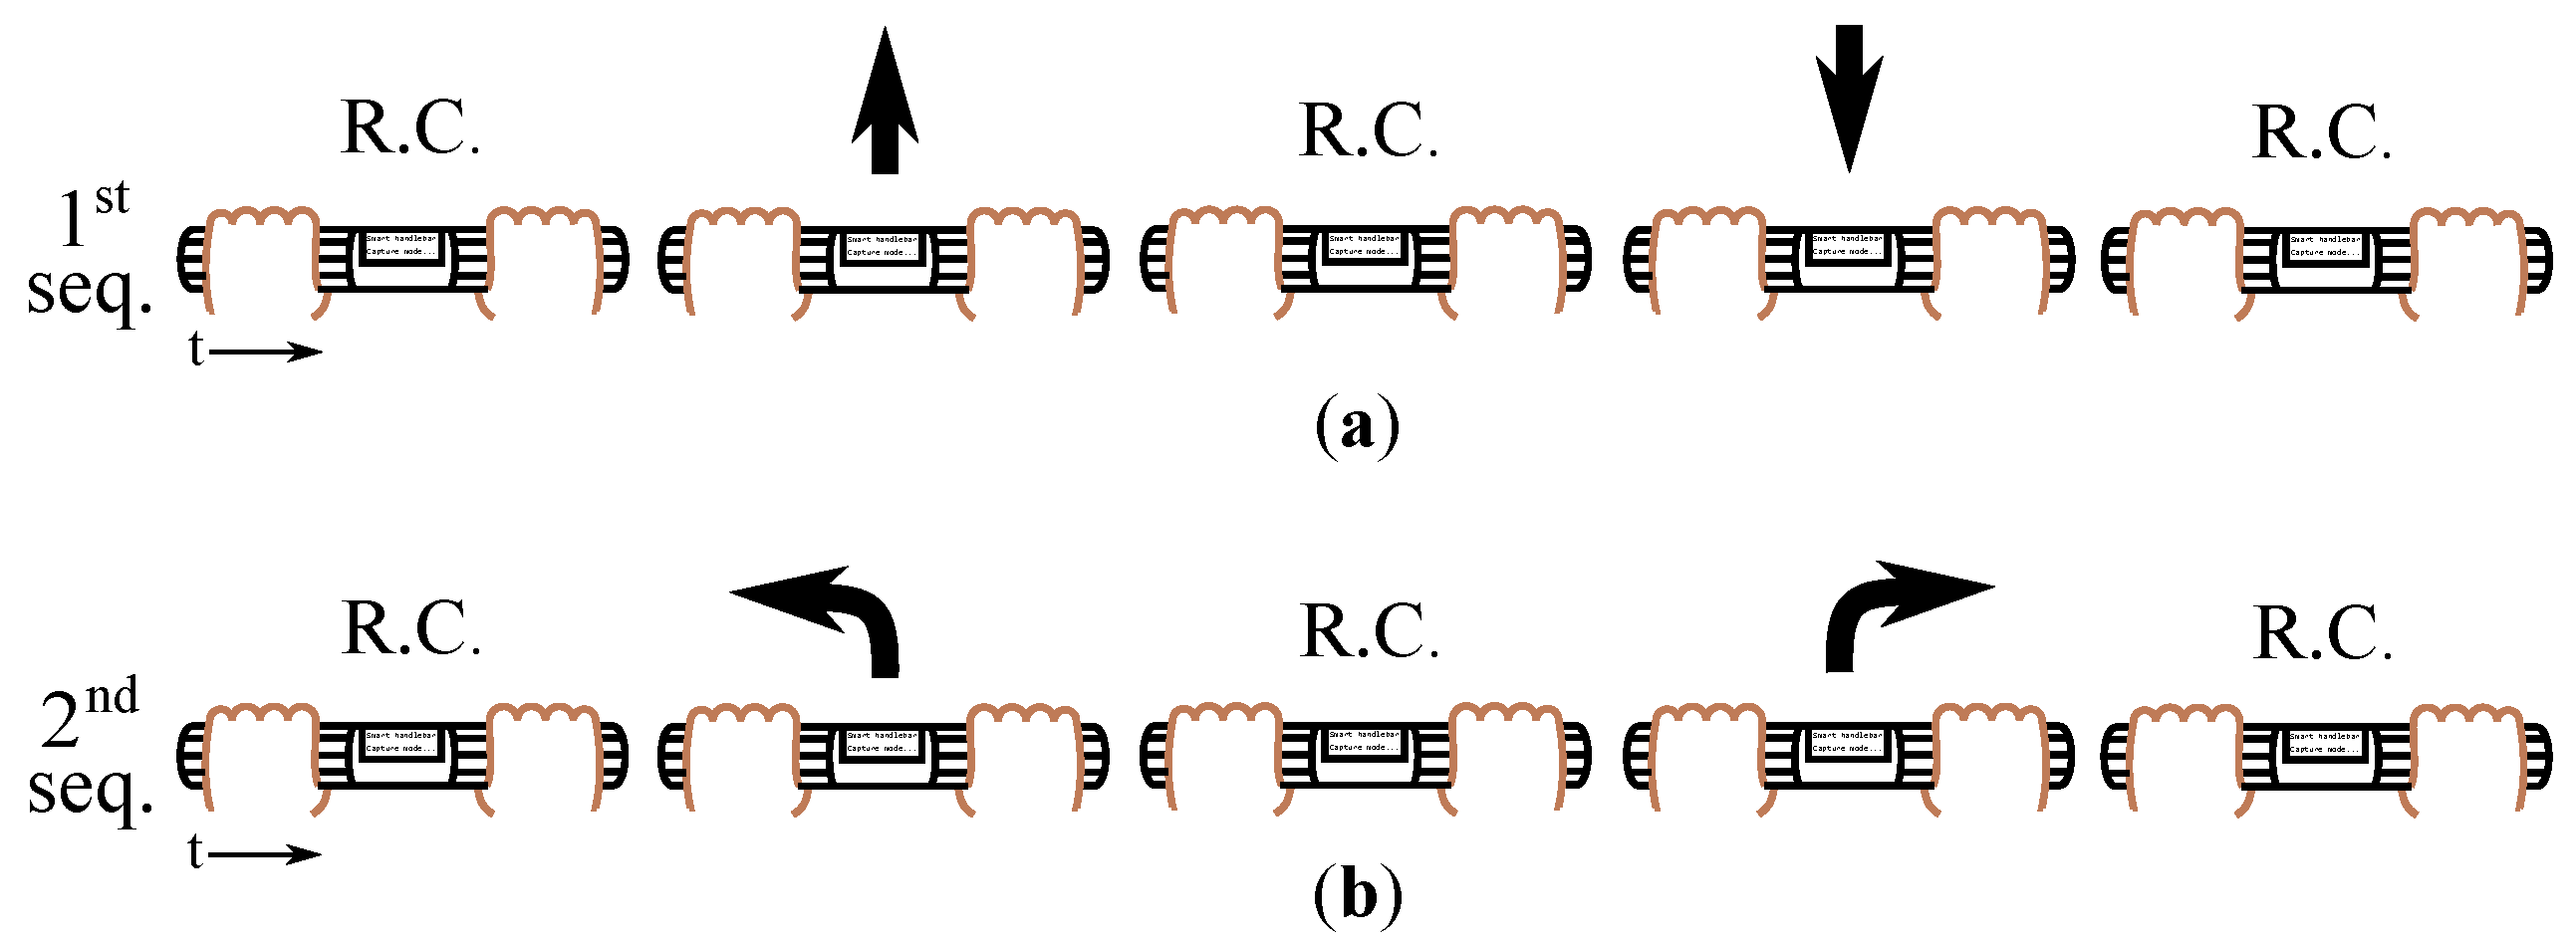
- (1)
- Rest condition (it consists in just keeping the handles grasped without exerting intentionally forces) (R.C.)pushrest conditionpullrest condition. They had to keep the current condition (push, rest or pull) at least for one second before changing to the next state. After this first test, they were asked to carry out a new sequence:
- (2)
- Rest conditionleft turnrest conditionright turnrest condition.
5.2.2. Results and Discussion
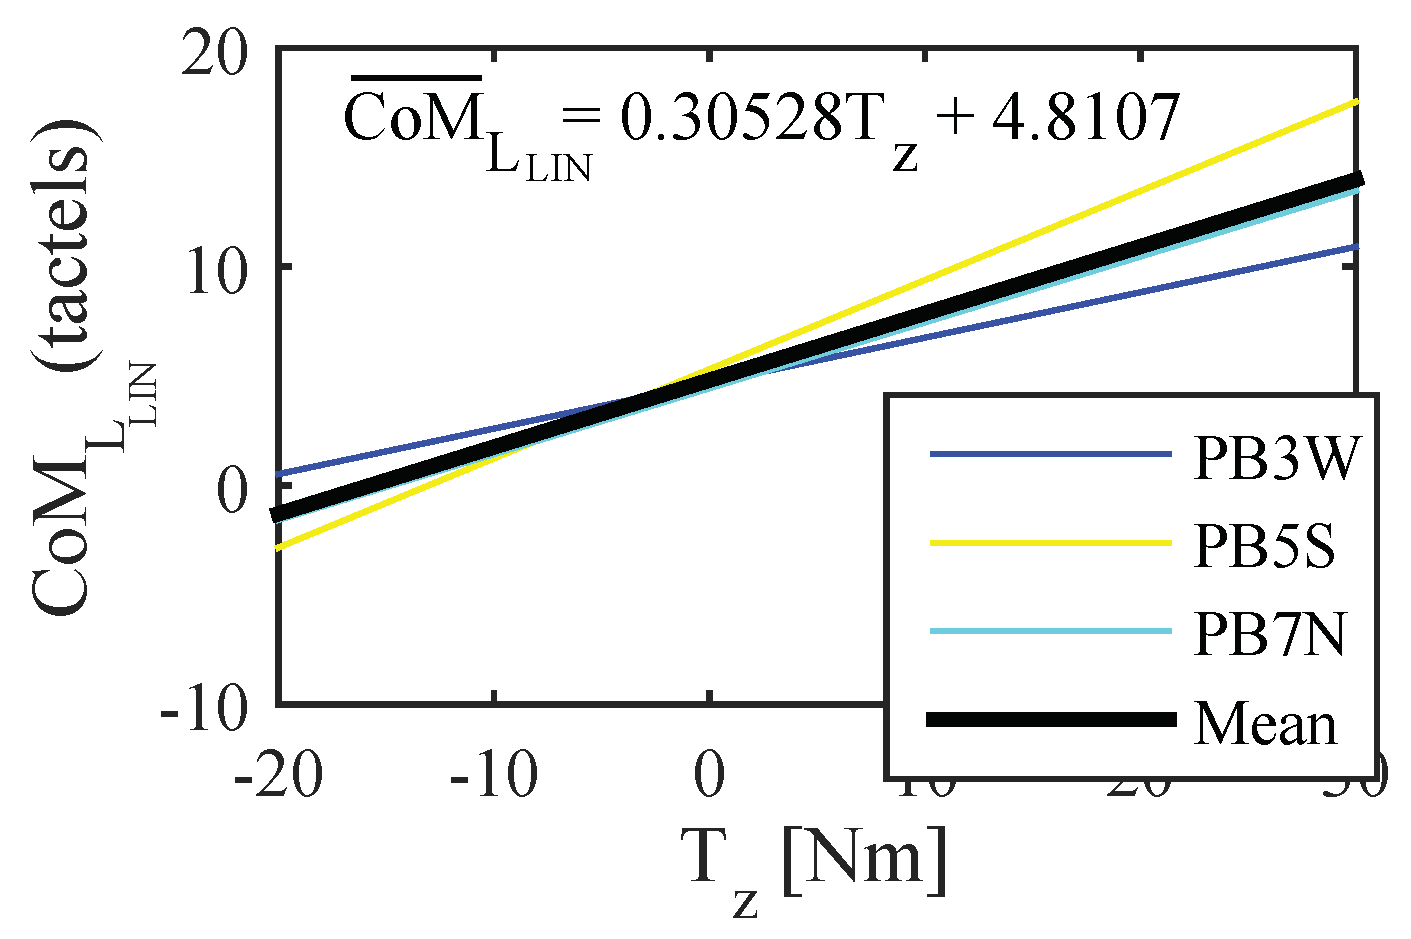
5.2.3. Correction of the Gripping Force Impact on CoMs Excursion
| N | Number of tests inside the group () for which is calculated |
| i | Each of tests of the group for which is calculated |
| X | Signal that varies in the group for which the function is computed: Fy for and Tz for |
| S | Sequence the test i belongs to: PP for the tests in and T for those in |
| H | Tactile handle for which the parameter is calculated: L and R (left or right) |
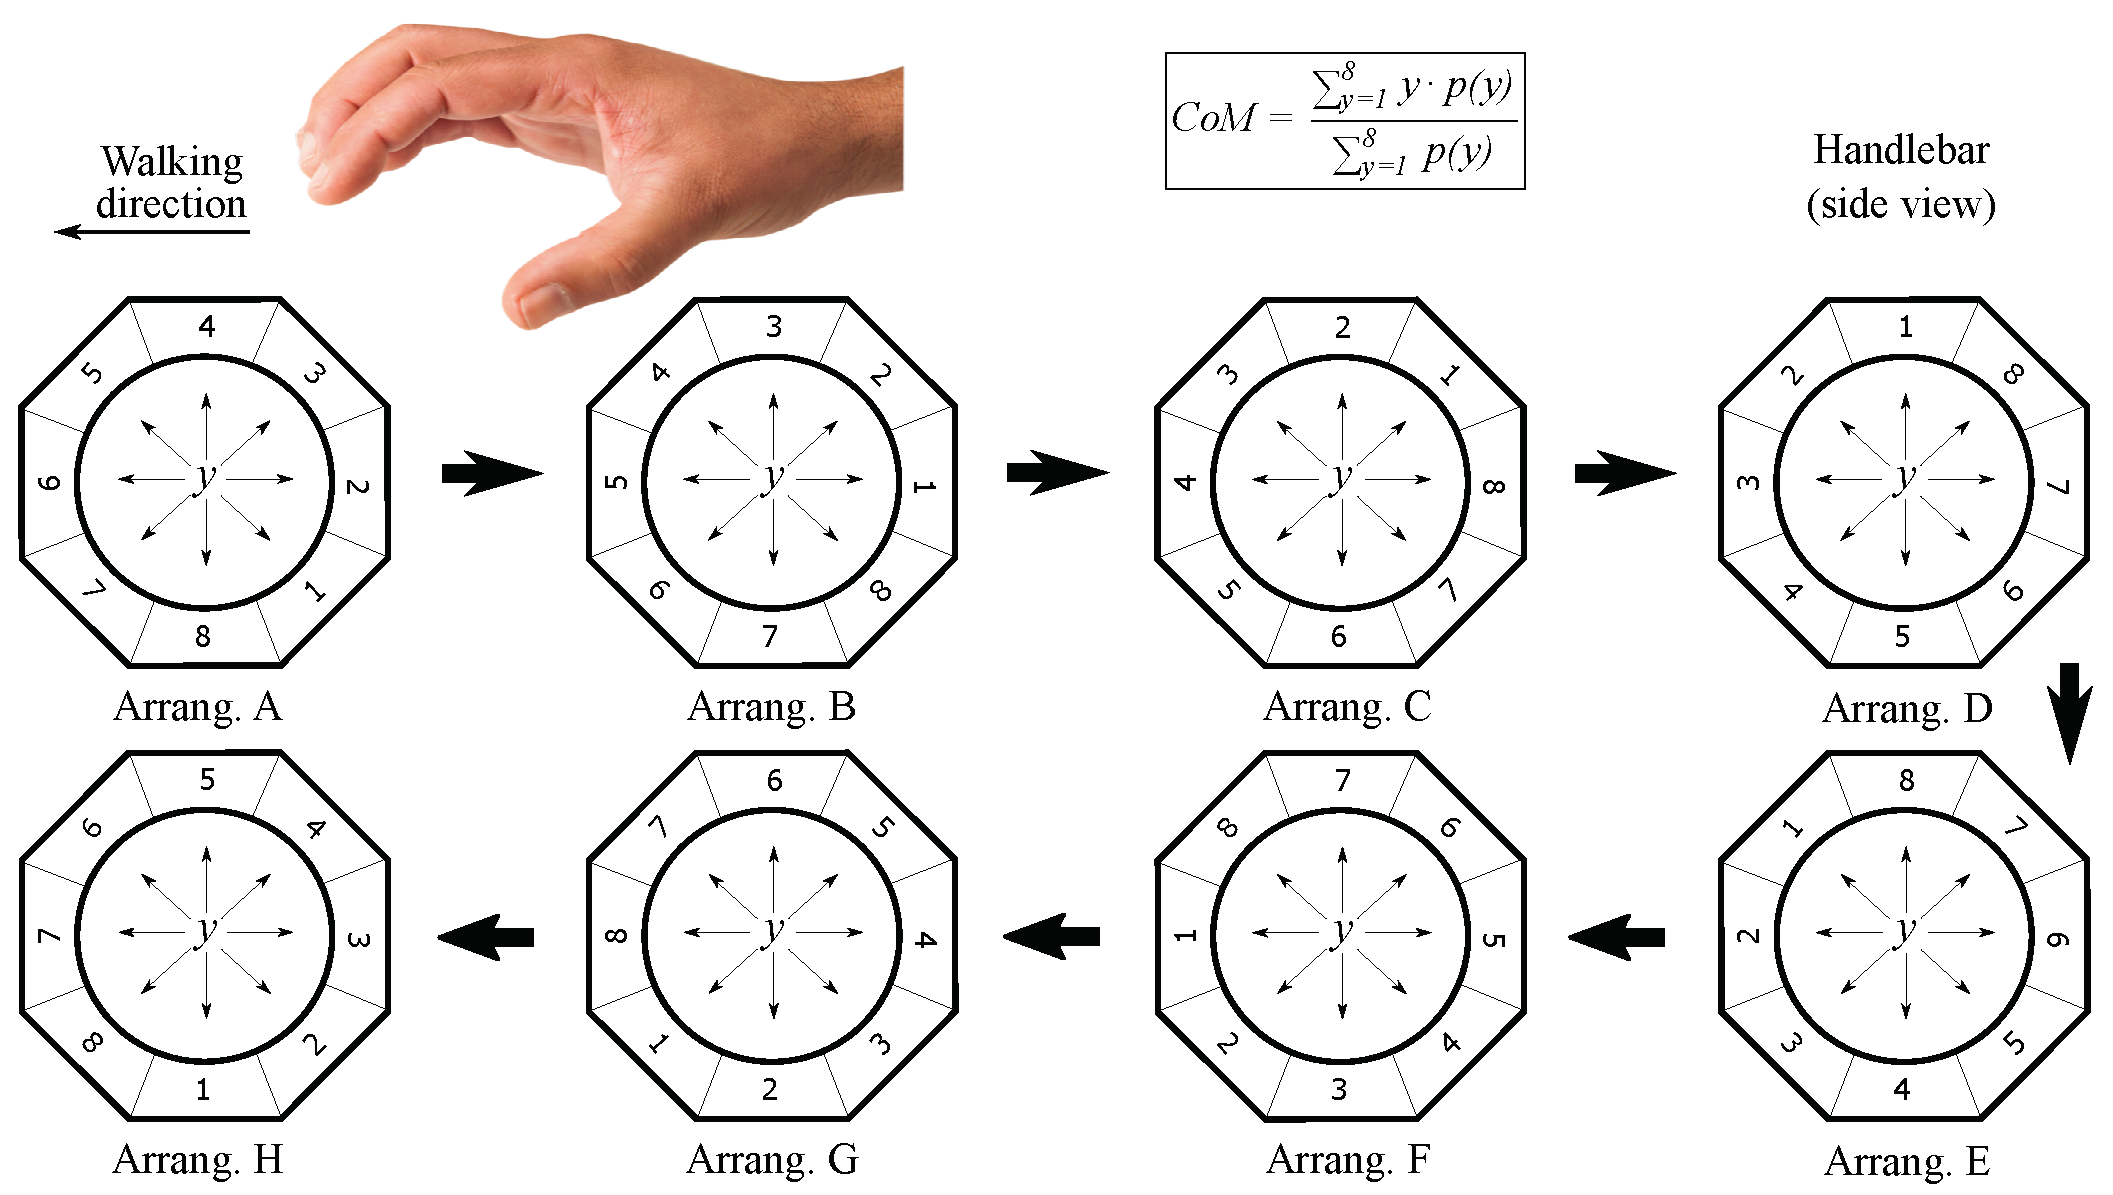
6. Study of the Effect of the Tactel Arrangement
6.1. Methods
6.2. Results and Discussion
7. Study of the Handlebar Grasp
7.1. Methods
7.2. Results and Discussion
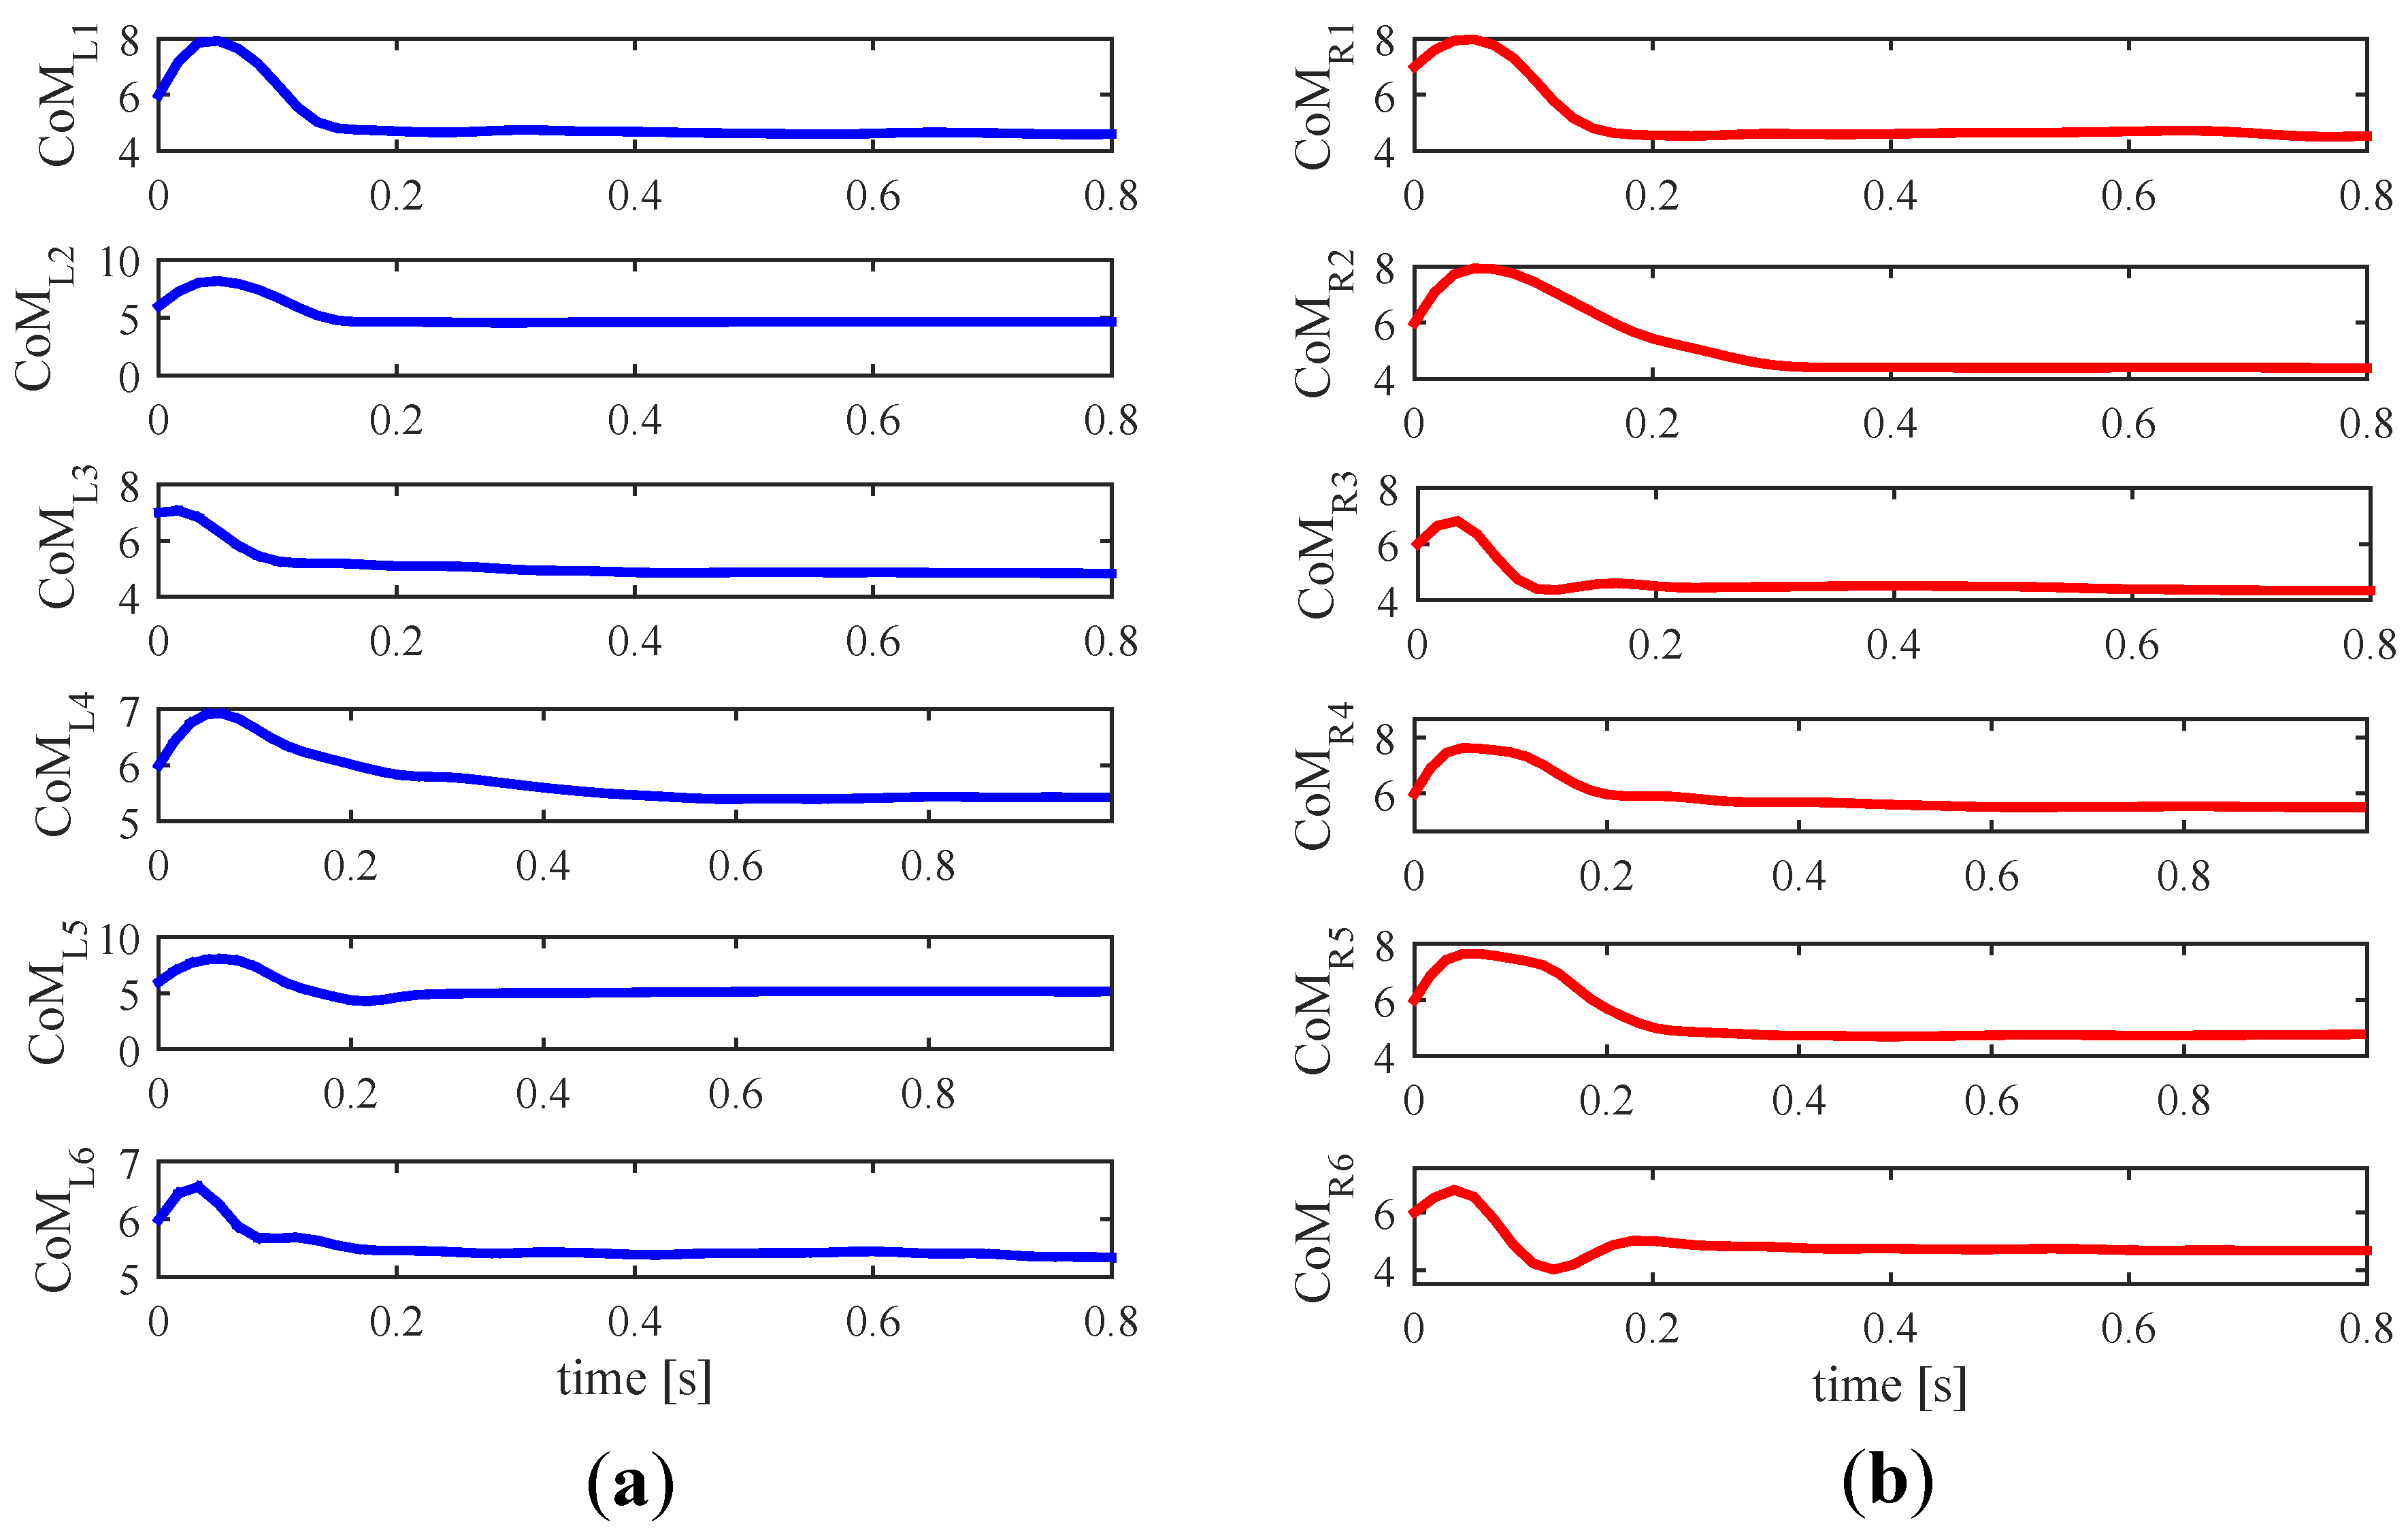
7.2.1. Grip Stabilization
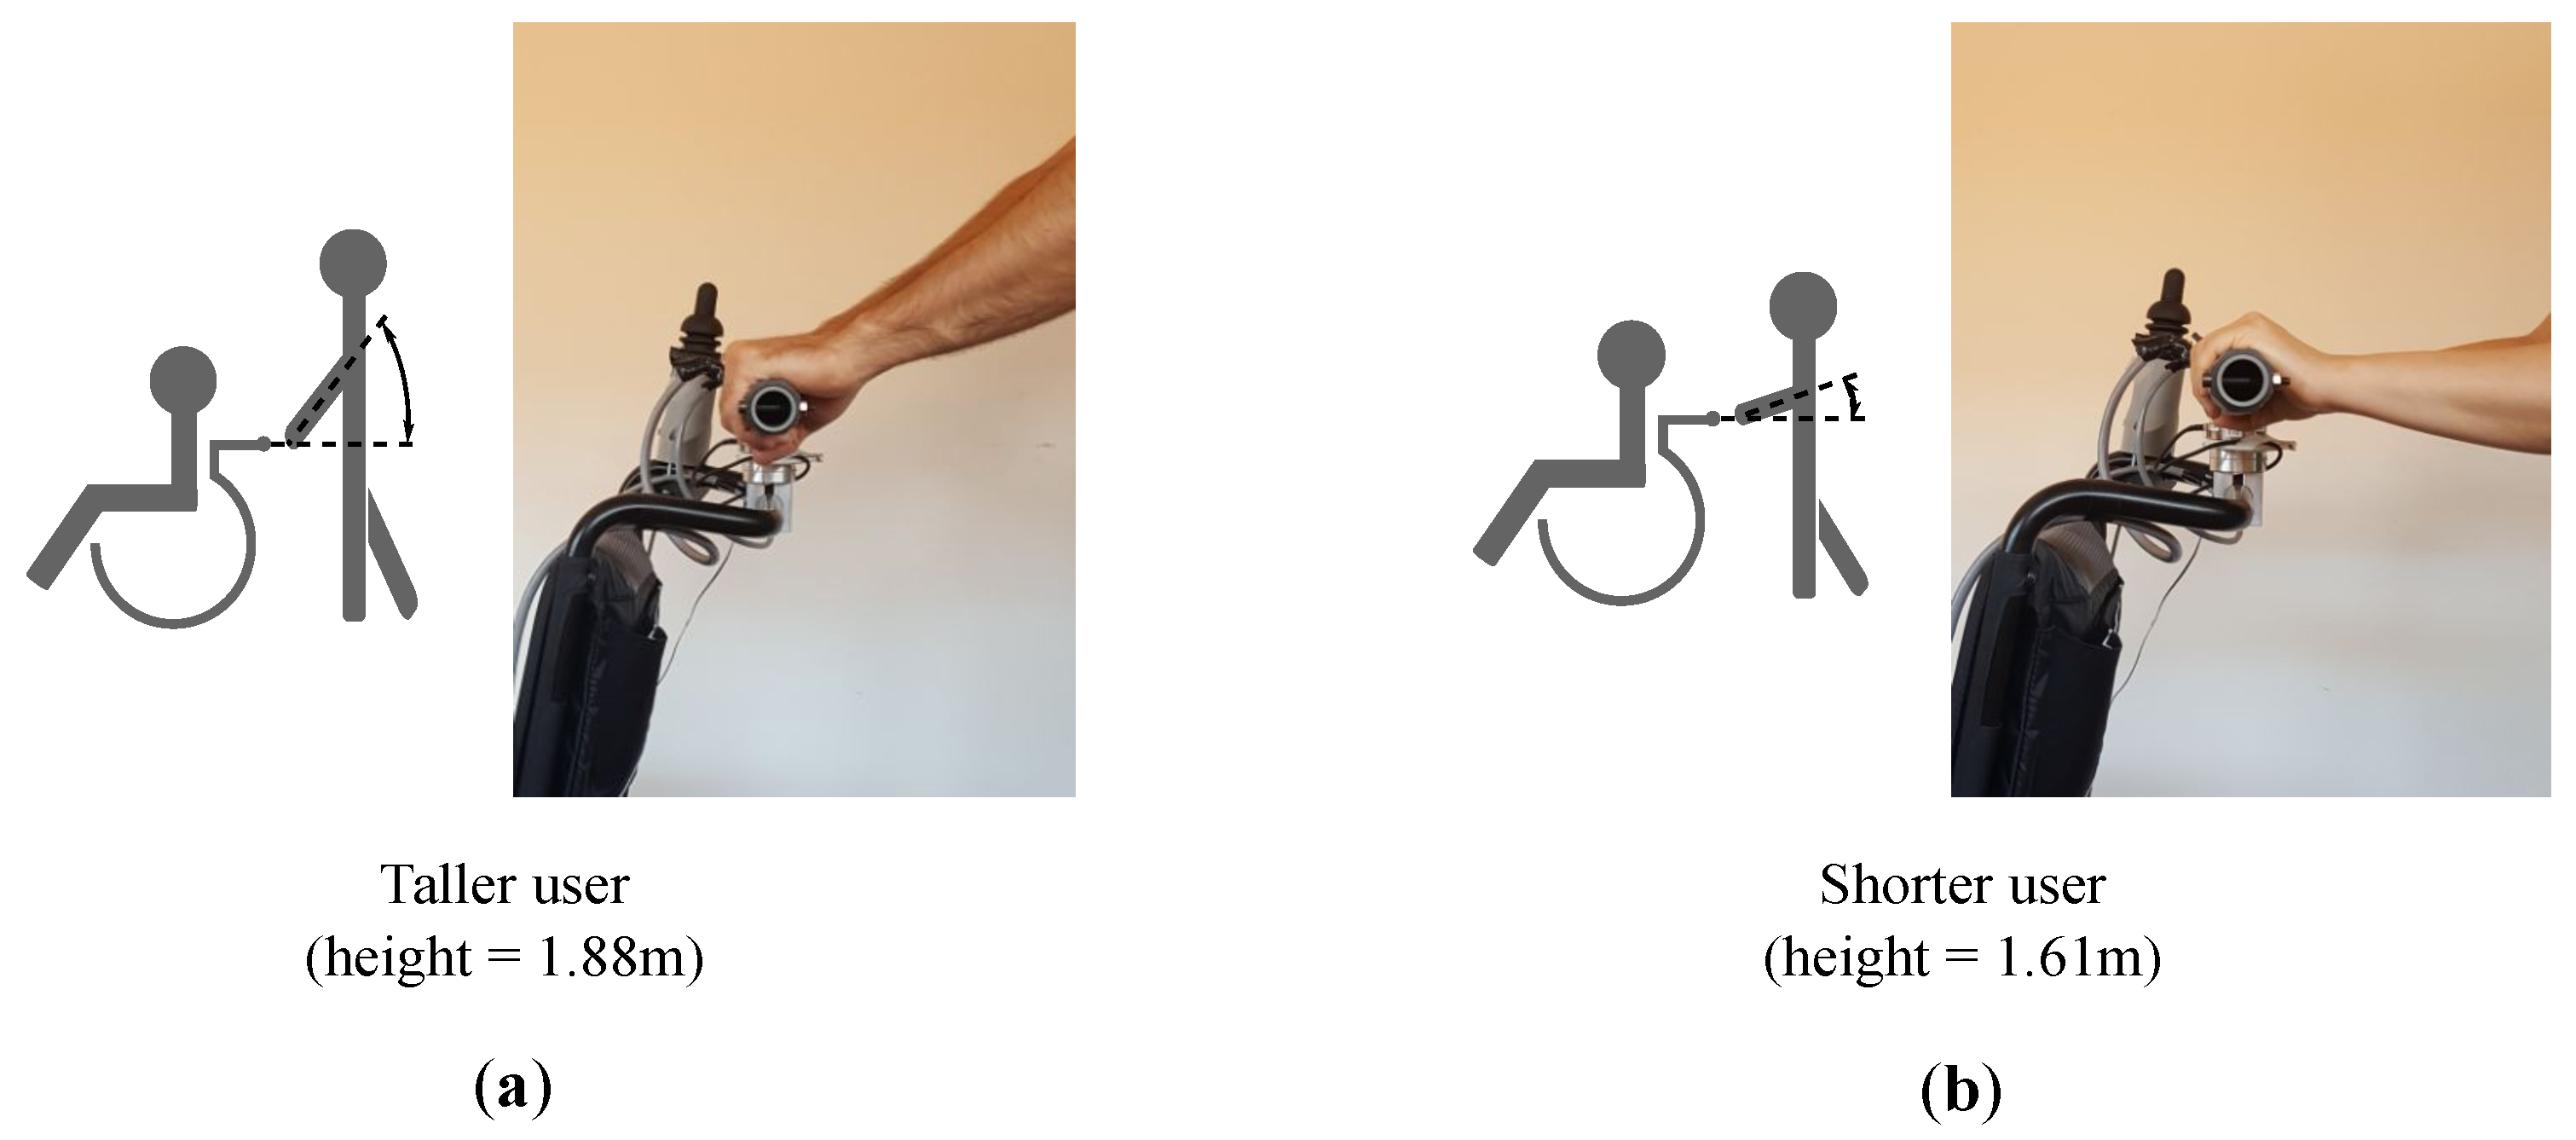
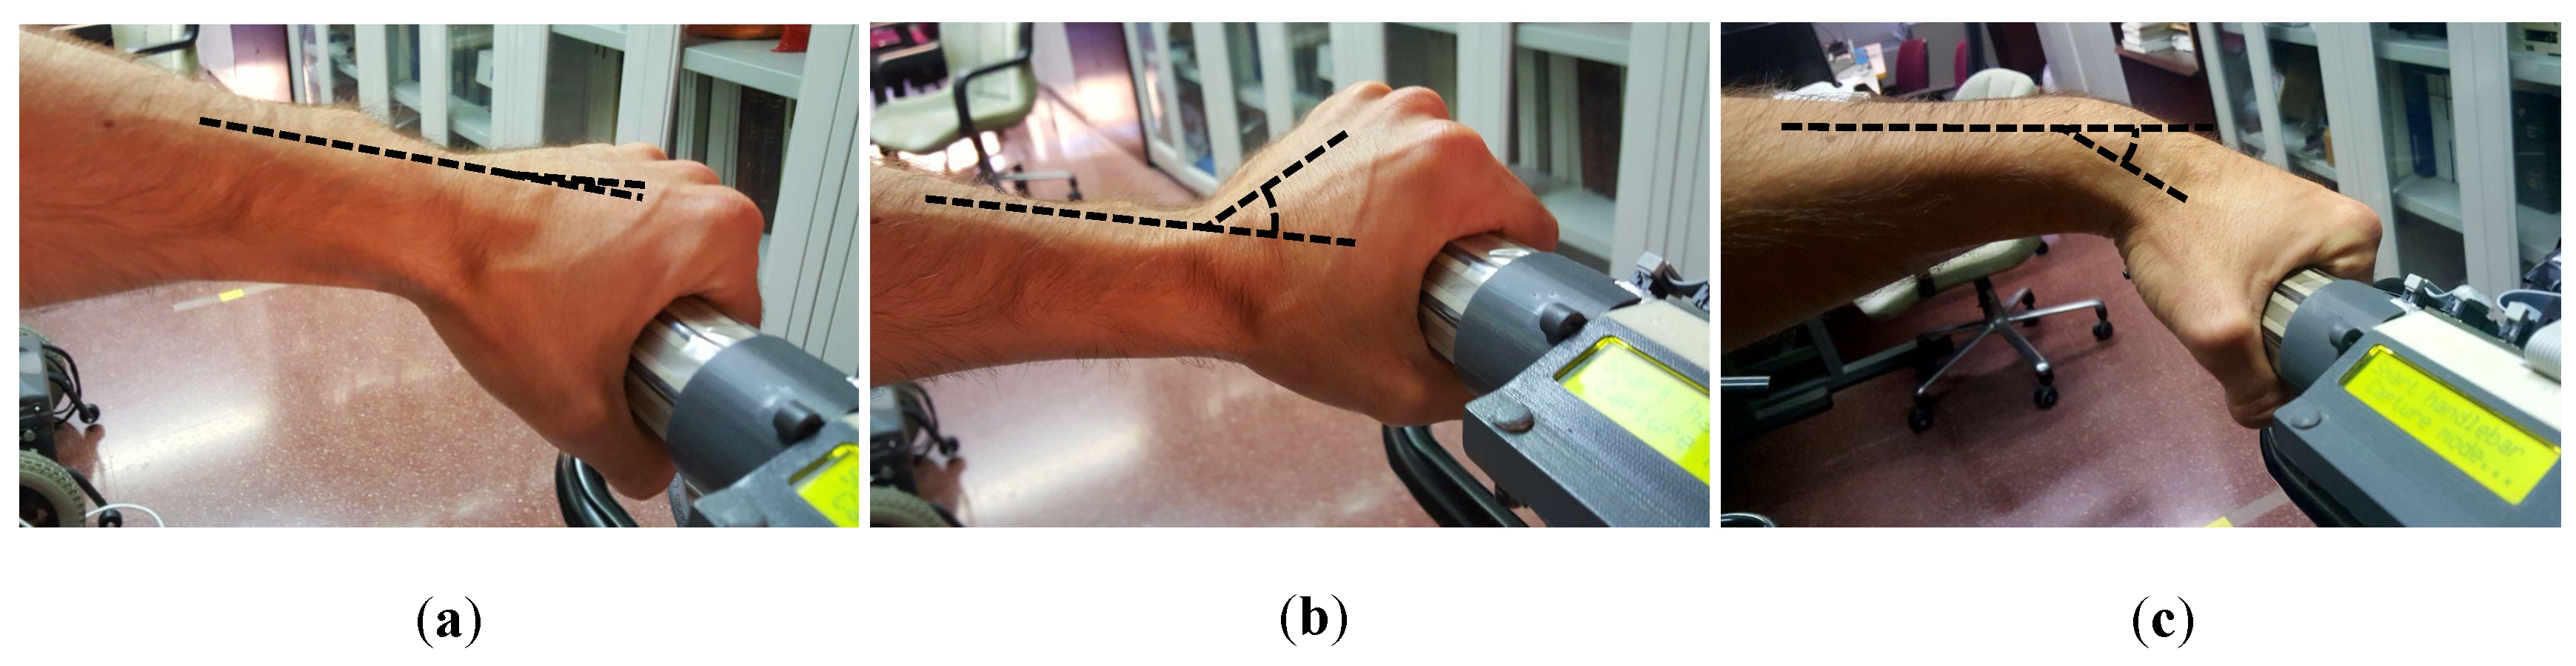
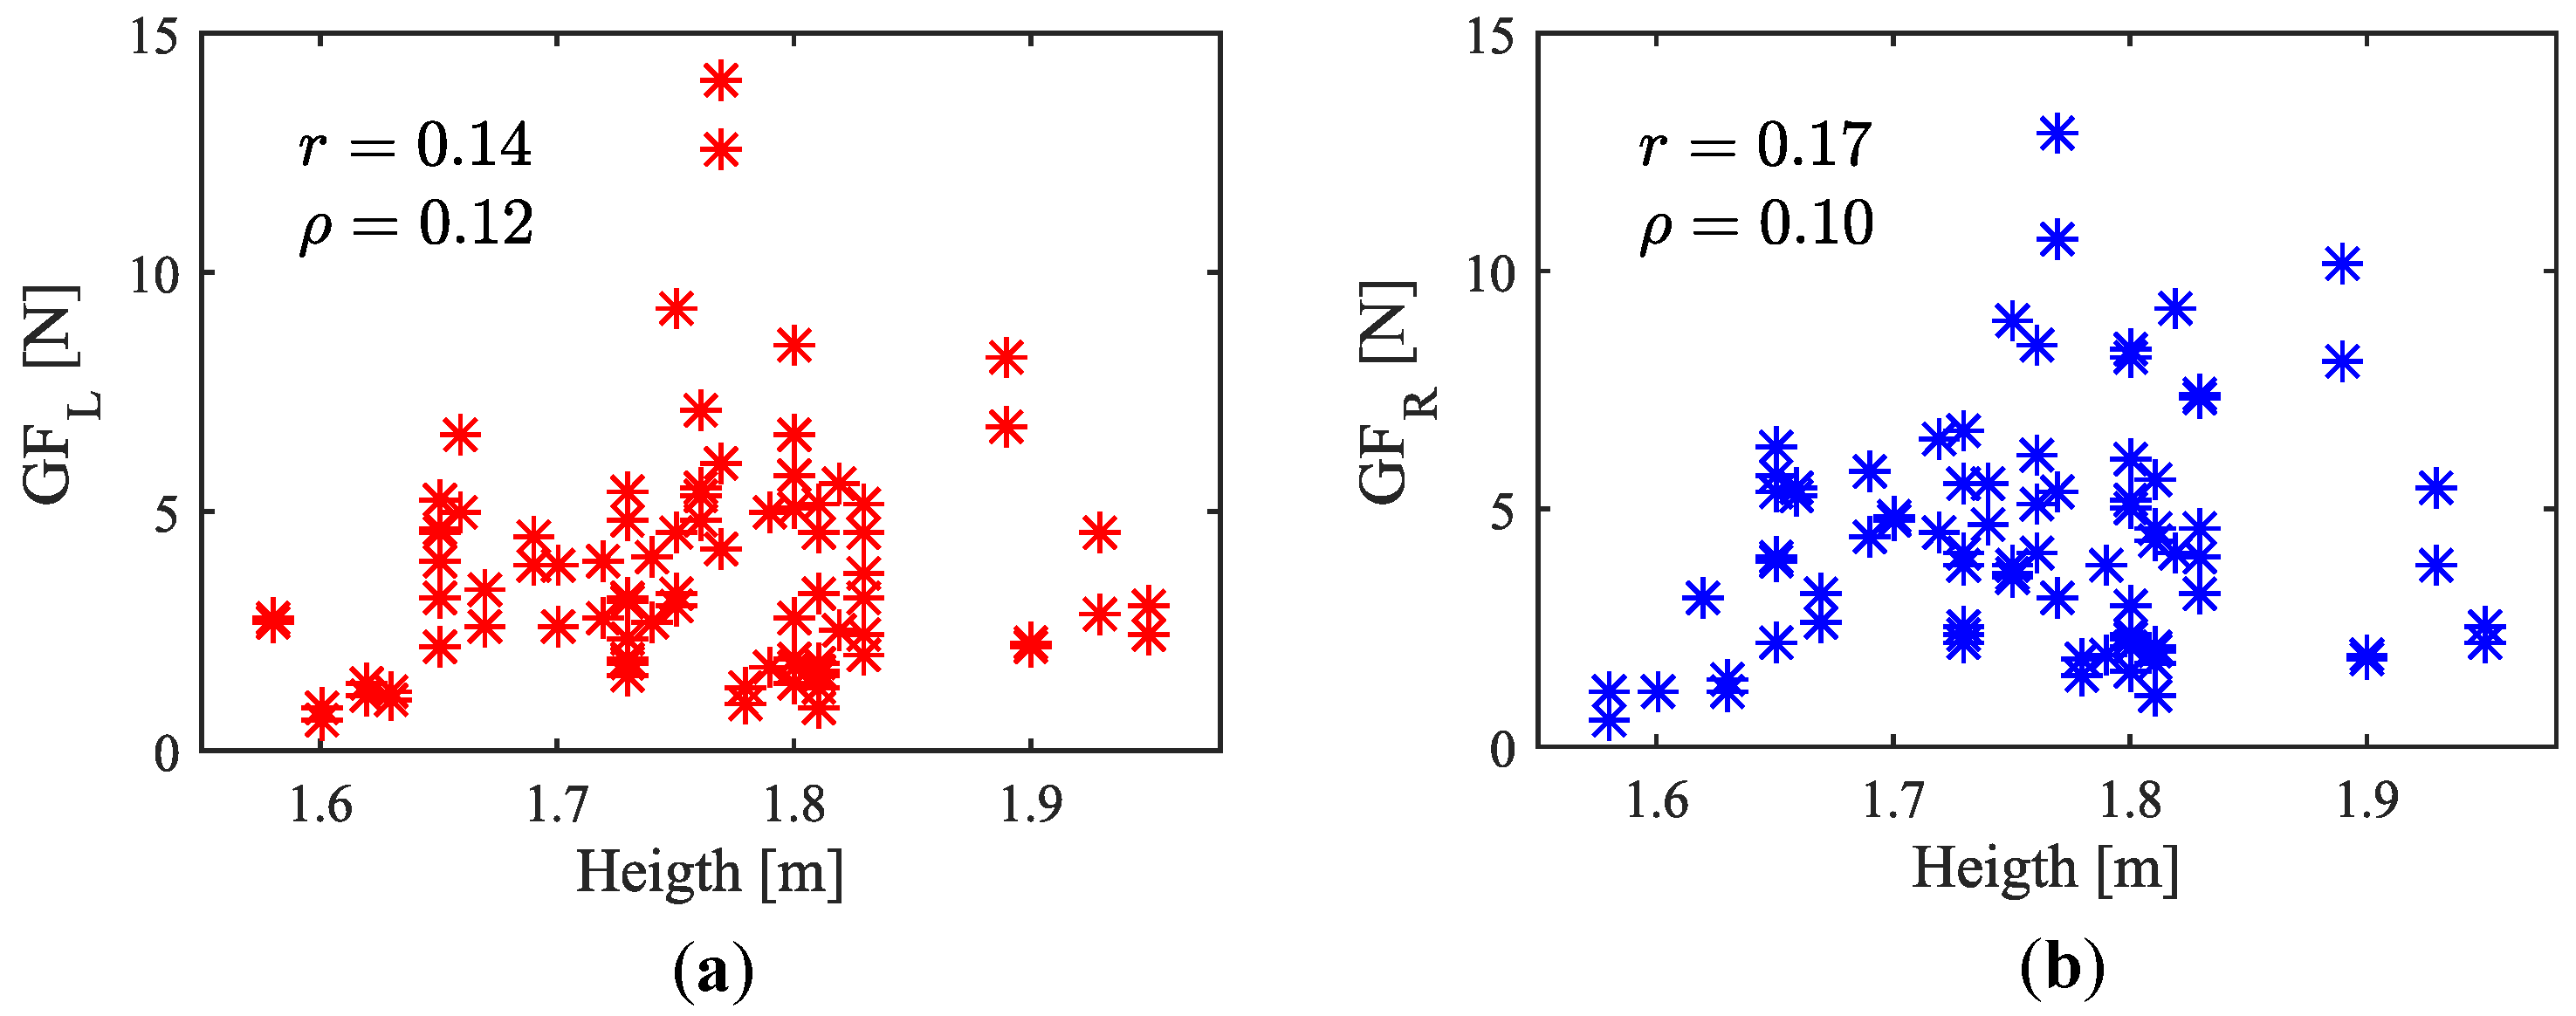
7.2.2. Influence of Attendant Height
7.2.3. Evolution during the Grasp Onset
8. Conclusions
Author Contributions
Funding
Conflicts of Interest
Abbreviations
| Tactel | Tactile element |
| PW | Powered wheelchair |
| Center of mass | |
| Center of mass computed for the left handle | |
| Center of mass computed for the right handle | |
| Gripping force | |
| Subtraction of and | |
| Sum of and | |
| Center of mass in rest condition. Reference value to assess the deviations | |
| Force exerted on the handlebar to carry out push and pull maneuvers | |
| Torque exerted on the handlebar when carrying out turns |
References
- Gollër, M.; Kerscher, T.; Ziegenmeyer, M.; Rönnau, A.; Zöllner, J.; Dillman, R. Haptic Control for the Interactive Behavior Operated Shopping Trolley Inbot. In Proceedings of the New Frontiers in Human-Robot. Interaction Symposium at the Artificial Intelligence and Simulation of Behaviour (AISB), Edinburgh, UK, 6–9 April 2009. [Google Scholar]
- Pasqui, V.; Saint-Bauzel, L.; Zonga, C.; Clady, X.; Decq, P.; Piette, F.; Michel-Pellegrino, V.; el Helou, A.; Carré, M.; Durand, A.; et al. Projet MIRAS: Multimodal interactive robot for assistance in strolling. Technol. Pour La Santé Et L’autonomie 2012, 33, 165–172. [Google Scholar]
- Trujillo-León, A.; Bachta, W.; Vidal-Verdú, F. Tactile Sensor Based Steering as a Substitute of the Attendant Joystick in Powered Wheelchairs. IEEE Trans. Neural Syst. Rehabil. Eng. 2018, 26. [Google Scholar] [CrossRef] [PubMed]
- Zhu, C.; Oda, M.; Yoshioka, M.; Nishikawa, T.; Shimazu, S.; Luo, X. Admittance control based walking support and power assistance of an omnidirectional wheelchair typed robot. In Proceedings of the 2010 IEEE International Conference on Robotics and Biomimetics, Tianjin, China, 14–18 December 2010; pp. 381–386. [Google Scholar] [CrossRef]
- Kakimoto, A.; Matsuda, H.; Sekiguchi, Y. Development of power-assisted attendant-propelled wheelchair. In Proceedings of the 19th Annual International Conference of the IEEE Engineering in Medicine and Biology Society, Chicago, IL, USA, 30 October–2 November 1997; Volume 4, pp. 1875–1876. [Google Scholar] [CrossRef]
- Ueno, Y.; Kitagawa, H.; Kakihara, K.; Terashima, K. Development of collision avoidance supporting system for power assist system in omni-directional mobile robot. In Proceedings of the SICE Annual Conference, Tokyo, Japan, 13–18 September 2011; pp. 1447–1452. [Google Scholar]
- Trujillo-León, A.; Vidal-Verdú, F. Driving Interface Based on Tactile Sensors for Electric Wheelchairs or Trolleys. Sensors 2014, 14, 2644–2662. [Google Scholar] [CrossRef] [PubMed]
- Yan, H.; Ang, M.H.; Poo, A.N. A Survey on Perception Methods for Human–Robot Interaction in Social Robots. Int. J. Soc. Robot. 2014, 6, 85–119. [Google Scholar] [CrossRef]
- Zhou, B.; Altamirano, C.A.V.; Zurian, H.C.; Atefi, S.R.; Billing, E.; Martinez, F.S.; Lukowicz, P. Textile Pressure Mapping Sensor for Emotional Touch Detection in Human-Robot Interaction. Sensors 2017, 17, 2585. [Google Scholar] [CrossRef] [PubMed]
- Cirillo, A.; Cirillo, P.; De Maria, G.; Natale, C.; Pirozzi, S. A Distributed Tactile Sensor for Intuitive Human-Robot Interfacing. J. Sens. 2017, 2017, 1357061. [Google Scholar] [CrossRef]
- Lawson, W.E.; Sullivan, K.; Trafton, G. Understanding Touch Gestures on a Humanoid Robot; 2014 AAAI Fall Symposium Series; AAAI: Arlintong, VA, USA, 2014. [Google Scholar]
- Wu, H.; Liu, H.; Liu, D. Two-Dimensional Direction Recognition Using Uniaxial Tactile Arrays. IEEE Sens. J. 2013, 13, 4897–4903. [Google Scholar] [CrossRef]
- Yamada, K.; Ohara, K.; Ichikawa, A.; Fukuda, T. User intention estimation by grip sensor for cane-type walking support robot. In Proceedings of the 2016 International Symposium on Micro-NanoMechatronics and Human Science (MHS), Nagoya, Japan, 28–30 November 2016; pp. 1–3. [Google Scholar] [CrossRef]
- Leal-Meléndrez, J.A.; Altamirano-Robles, L.; Gonzalez, J.A. Occlusion Handling in Video-Based Augmented Reality Using the Kinect Sensor for Indoor Registration. In Progress in Pattern Recognition, Image Analysis, Computer Vision, and Applications; Ruiz-Shulcloper, J., Sanniti di Baja, G., Eds.; Springer: Berlin/Heidelberg, Germany, 2013; pp. 447–454. [Google Scholar]
- Zohra, F.T.; Rahman, M.W.; Gavrilova, M. Occlusion Detection and Localization from Kinect Depth Images. In Proceedings of the 2016 International Conference on Cyberworlds (CW), Chongqing, China, 28–30 September 2016; pp. 189–196. [Google Scholar] [CrossRef]
- Dahiya, R.S.; Mittendorfer, P.; Valle, M.; Cheng, G.; Lumelsky, V.J. Directions Toward Effective Utilization of Tactile Skin: A Review. IEEE Sens. J. 2013, 13, 4121–4138. [Google Scholar] [CrossRef]
- Vidal-Verdú, F.; Barquero, M.J.; Castellanos-Ramos, J.; Navas-González, R.; Sánchez, J.A.; Serón, J.; García-Cerezo, A. A Large Area Tactile Sensor Patch Based on Commercial Force Sensors. Sensors 2011, 11, 5489–5507. [Google Scholar] [CrossRef] [PubMed]
- Goger, D.; Gorges, N.; Worn, H. Tactile sensing for an anthropomorphic robotic hand: Hardware and signal processing. In Proceedings of the 2009 IEEE International Conference on Robotics and Automation, Kobe, Japan, 12–17 May 2009; pp. 895–901. [Google Scholar] [CrossRef]
- Sánchez-Durán, J.A.; Hidalgo-López, J.A.; Castellanos-Ramos, J.; Oballe-Peinado, Ó.; Vidal-Verdú, F. Influence of Errors in Tactile Sensors on Some High Level Parameters Used for Manipulation with Robotic Hands. Sensors 2015, 15, 20409–20435. [Google Scholar] [CrossRef] [PubMed]
- Abel, E.W.; Frank, T.G. The design of attendant propelled wheelchairs. Prosthet. Orthot. Int. 1991, 15, 38–45. [Google Scholar] [CrossRef] [PubMed]
- Hinkle, D.E.; Wiersma, W.; Jurs, S.G. Applied Statistics for the Behavioral Sciences, 5th ed.; Houghton Mifflin: Boston, MA, USA, 2002. [Google Scholar]
- Petermeijer, S.; Abbink, D.; Mulder, M.; de Winter, J. The effect of haptic support systems on driver performance: A literature survey. IEEE Trans. Haptics 2015, 8, 467–479. [Google Scholar] [CrossRef] [PubMed]
- Robinson, L.; Brittain, K.; Lindsay, S.; Jackson, D.; Olivier, P. Keeping In Touch Everyday (KITE) project: Developing assistive technologies with people with dementia and their carers to promote independence. Int. Psychogeriatr. 2009, 21, 494–502. [Google Scholar] [CrossRef] [PubMed]
- Hersh, M.A. The design and evaluation of assistive technology products and devices part 1: Design. In International Encyclopedia of Rehabilitation; Center for International Rehabilitation Research Information & Exchange: Buffalo, NY, USA, 2010. [Google Scholar]
- Stewart, J.; Bauman, S.; Escobar, M.; Hilden, J.; Bihani, K.; Newman, M.W. Accessible Contextual Information for Urban Orientation. In Proceedings of the 10th International Conference on Ubiquitous Computing (UbiComp ’08), Seoul, Korea, 21–24 September 2008; ACM: New York, NY, USA, 2008; pp. 332–335. [Google Scholar] [CrossRef]
- Pawar, P.K.; Dadhich, A. Study of correlation between human height and foot length in residents of Mumbai. Int. J. Biol. Med. Res. 2012, 3, 2232–2235. [Google Scholar]
- Ibegbu, A.; David, E.; Hamman, W.; Umana, U.; Musa, S. Hand length as a determinat of height in school children. Adv. Life Sci. 2015, 5, 12–17. [Google Scholar]
- Guerra, R.; Fonseca, I.; Pichel, F.; Restivo, M.; Amaral, T. Hand length as an alternative measurement of height. Eur. J. Clin. Nutr. 2014, 68, 229–233. [Google Scholar] [CrossRef] [PubMed]


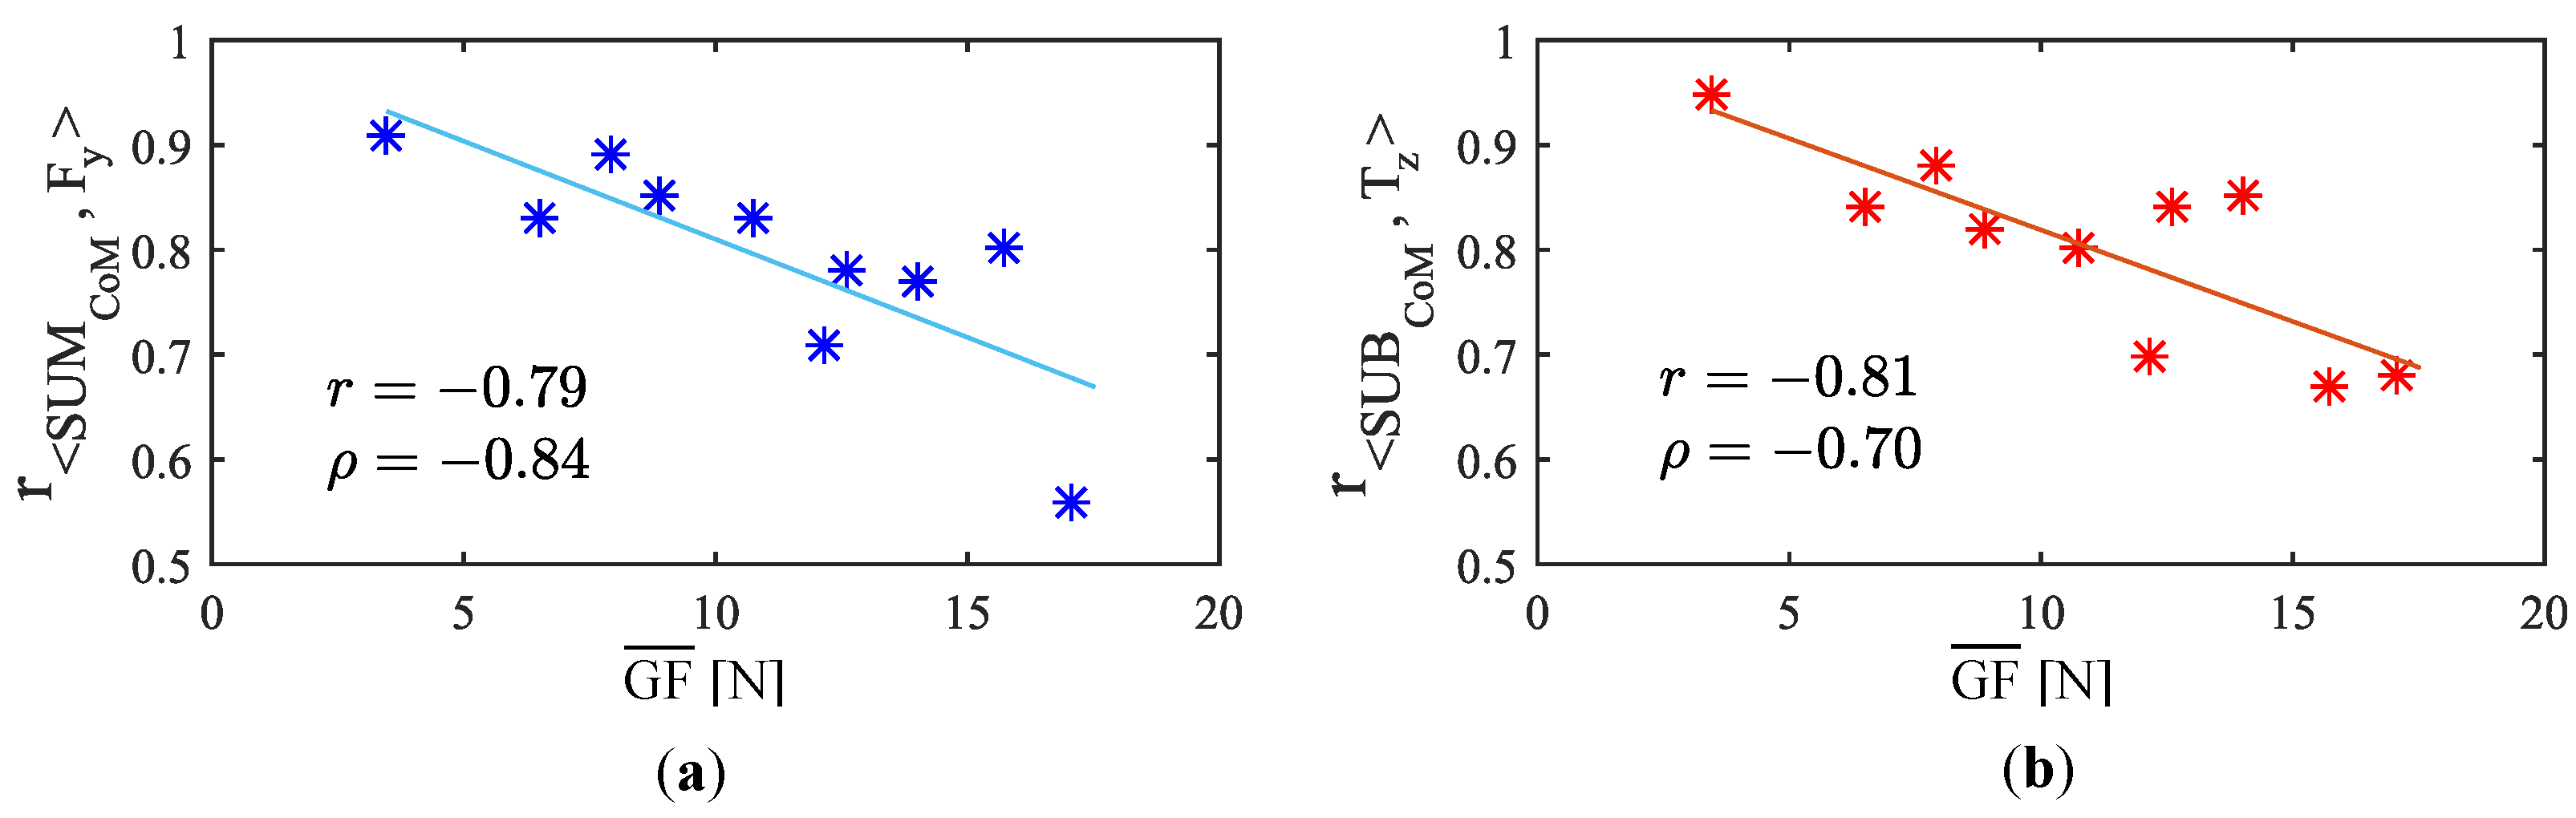
| Size of Correlation | Interpretation |
|---|---|
| 0.9 to 1/−0.9 to −1 | Very high positive/negative correlation |
| 0.7 to 0.9/−0.7 to −0.9 | High positive/negative correlation |
| 0.5 to 0.7/−0.5 to −0.7 | Moderate positive/negative correlation |
| 0.3 to 0.5/−0.3 to −0.5 | Low positive/negative correlation |
| 0 to 0.3/0 to −0.3 | Negligible |
| Participant | ||||
|---|---|---|---|---|
| PA1 | 0.91 () | 0.95 () | ||
| PA2 | 0.83 () | 0.84 () | ||
| PA3 | 0.77 () | 0.85 () | ||
| PA4 | 0.89 () | 0.88 () | ||
| PA5 | 0.71 () | 0.70 () | ||
| PA6 | 0.83 () | 0.80 () | ||
| PA7 | 0.56 () | 0.68 () | ||
| PA8 | 0.80 () | 0.67 () | ||
| PA9 | 0.78 () | 0.84 () | ||
| PA10 | 0.85 () | 0.82 () |
| Group | Group | ||||||
|---|---|---|---|---|---|---|---|
| −0.1323 | −0.1459 | −0.2782 | 1.0470 | −1.0525 | 2.0995 | ||
| −0.067 | −0.1201 | −0.1871 | 0.4729 | −0.6288 | 1.1017 | ||
| −0.0547 | −0.06 | −0.1147 | 0.3053 | −0.1765 | 0.4818 | ||
| −0.0405 | −0.039 | −0.0795 | 0.1429 | −0.1547 | 0.2975 | ||
| −0.0295 | −0.0196 | −0.0491 | 0.0320 | −0.0390 | 0.0711 | ||
| −0.0111 | −0.0098 | −0.0209 | 0.0296 | −0.0293 | 0.0589 |
| All Maneuvers () | ||||||||
| Left handle largest exc. | 3 | 1 | 0 | 2 | 22 | 20 | 0 | 0 |
| Right handle largest exc. | 0 | 1 | 2 | 5 | 30 | 10 | 0 | 0 |
| Pushing/Pulling () | ||||||||
| Left handle largest exc. | 0 | 1 | 0 | 0 | 15 | 8 | 0 | 0 |
| Right handle largest exc. | 0 | 1 | 2 | 2 | 17 | 2 | 0 | 0 |
| Turns () | ||||||||
| Left handle largest exc. | 3 | 0 | 0 | 2 | 7 | 12 | 0 | 0 |
| Right handle largest exc. | 0 | 0 | 0 | 3 | 13 | 8 | 0 | 0 |
| All Maneuvers () | ||||||||
| Left handle largest exc. | 1 | 0 | 1 | 1 | 28 | 17 | 0 | 0 |
| Right handle largest exc. | 0 | 2 | 2 | 2 | 26 | 16 | 0 | 0 |
| Pushing/Pulling () | ||||||||
| Left handle largest exc. | 0 | 0 | 1 | 1 | 15 | 7 | 0 | 0 |
| Right handle largest exc. | 0 | 2 | 2 | 0 | 13 | 7 | 0 | 0 |
| Turns () | ||||||||
| Left handle largest exc. | 1 | 0 | 0 | 0 | 13 | 10 | 0 | 0 |
| Right handle largest exc. | 0 | 0 | 0 | 2 | 13 | 9 | 0 | 0 |
| Stat. Meas. | ||||||||
|---|---|---|---|---|---|---|---|---|
| () | L. Handle | R. Handle | L. Handle | R. Handle | L. Handle | R. Handle | L. Handle | R. Handle |
| Max. | 0.37 | 0.33 | 6.55 | 6.54 | 1.04 | 1.31 | 14.06 | 12.87 |
| Min. | 0.02 | 0.02 | 3.56 | 3.35 | 0.01 | 0.005 | 0.62 | 0.59 |
| Mean | 0.11 | 0.09 | 5.15 | 4.97 | 0.26 | 0.26 | 3.85 | 4.28 |
| Std. Dev. | 0.07 | 0.06 | 0.62 | 0.61 | 0.27 | 0.26 | 2.45 | 2.45 |
© 2018 by the authors. Licensee MDPI, Basel, Switzerland. This article is an open access article distributed under the terms and conditions of the Creative Commons Attribution (CC BY) license (http://creativecommons.org/licenses/by/4.0/).
Share and Cite
Trujillo-León, A.; Bachta, W.; Castellanos-Ramos, J.; Vidal-Verdú, F. Assistive Handlebar Based on Tactile Sensors: Control Inputs and Human Factors. Sensors 2018, 18, 2471. https://doi.org/10.3390/s18082471
Trujillo-León A, Bachta W, Castellanos-Ramos J, Vidal-Verdú F. Assistive Handlebar Based on Tactile Sensors: Control Inputs and Human Factors. Sensors. 2018; 18(8):2471. https://doi.org/10.3390/s18082471
Chicago/Turabian StyleTrujillo-León, Andrés, Wael Bachta, Julián Castellanos-Ramos, and Fernando Vidal-Verdú. 2018. "Assistive Handlebar Based on Tactile Sensors: Control Inputs and Human Factors" Sensors 18, no. 8: 2471. https://doi.org/10.3390/s18082471
APA StyleTrujillo-León, A., Bachta, W., Castellanos-Ramos, J., & Vidal-Verdú, F. (2018). Assistive Handlebar Based on Tactile Sensors: Control Inputs and Human Factors. Sensors, 18(8), 2471. https://doi.org/10.3390/s18082471