Cross-Continental Comparison of National Food Consumption Survey Methods—A Narrative Review

 ,
,
Abstract
:
1. Introduction
2. Experimental Section
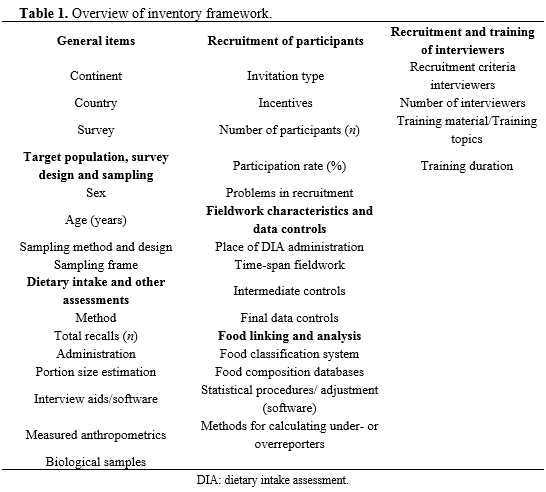
2.1. Development of the Inventory Framework

| General items | Recruitment of participants | Recruitment and training of interviewers |
| Continent | Invitation type | Recruitment criteria interviewers |
| Country | Incentives | Number of interviewers |
| Survey | Number of participants (n) | Training material/Training topics |
| Target population, survey design and sampling | Participation rate (%) | Training duration |
| Sex | Problems in recruitment | |
| Age (years) | Fieldwork characteristics and data controls | |
| Sampling method and design | Place of DIA administration | |
| Sampling frame | Time-span fieldwork | |
| Dietary intake and other assessments | Intermediate controls | |
| Method | Final data controls | |
| Total recalls (n) | Food linking and analysis | |
| Administration | Food classification system | |
| Portion size estimation | Food composition databases | |
| Interview aids/software | Statistical procedures/ adjustment (software) | |
| Measured anthropometrics | Methods for calculating under- or overreporters | |
| Biological samples |
2.2. Search Strategy
3. Results
3.1. Target Population, Survey Design and Sampling Method
3.2. Numbers of Participants and Participation Rates
| Continent Country [Ref.] | Survey name | Institution | Year(s) | Sex | Age (years) | Sampling method and design | Sampling frame |
|---|---|---|---|---|---|---|---|
| North-America | |||||||
| Canada [12,13] | Canadian Community Health Survey - Nutrition (CCHS) | Statistics Canada | 2004 | M and F | All age categories (<1–71+) | Two-step strategy: 1) 80 units in 14 age/sex groups per province 2) power allocation scheme for remaining anticipated units | 4 frames: Labour Force Survey (LFS) area frame, CCHS 2.1 dwellings, Prince Edward Island and Manitoba Healthcare registries |
| US [14,15] | What we Eat in America (WWEIA), National Health and Nutrition Examination Survey (Continuous NHANES) | National Center for Health Statistics (NCHS) from the Centers for Disease Control and Prevention (CDC) | 2001–2002 | M and F | All age categories (< 1–80+) | Stratified, multistage probability sample: Primary Sampling Units (PSUs) (counties) > segments within PSUs (blocks containing a cluster of households) > households within segments > one or more participants within households | PSU samples were selected from a frame of all U.S. counties, using the 2000 census data and associated estimates and projections |
| 2003–2004 | 〃 | 〃 | 〃 | 〃 | |||
| 2005–2006 | 〃 | 〃 | 〃 | 〃 | |||
| 2007–2008 | 〃 | 〃 | 〃 | 〃 | |||
| 2009–2010 | 〃 | 〃 | 〃 | 〃 | |||
| Mexico [16,17,18,19,20] | National Nutrition Survey 1999 (NNS-1999) | Instituto Nacional de Salud Pública (INSP) | 1998–1999 | Adolescents and adults: F Children: M and F | 12–49 <12 | Probabilistic, multistage, stratified cluster sample: basic geographical statistical area (BGSA) > household block > household | Census data (1995), stratification of BGSA by socioeconomic status index |
| Encuesta Nacional de Salud y Nutrición 2006 (ENSANUT 2006), Mexican Health and Nutrition Survey 2006 (MHNS-06) | Instituto Nacional de Salud Pública (INSP) | 2005–2006 | Children: M and F Adults: M and F | <19 ≥19 | Multistage, stratified cluster sample | n/a | |
| South-America | |||||||
| Brazil [21] | Brazilian Individual Dietary Survey (IDS 2008-2009) | Instituto Brasileiro de Geografia e Estatistica (IBGE) | 2008–2009 | M and F | ≥10 | Probabilistic two-stage complex cluster sampling: census tracts > households | Census data (2000), a subsample (25%) of households selected in the Household Budget Survey was randomly selected to participate in the IDS |
| Asia | |||||||
| China [22,23] | China Health and Nutrition Survey (CHNS) | National Institute of Nutrition and Food Safety (NINFS) from the China Center for Disease Control and Prevention (CCDC) | 1989 | Children: M and F Adults: M and F | 1–6 20–45 | Multistage, random cluster sample: province > county > PSUs (n = 190) > household | Stratification of counties by income (low, middle, and high), four counties per province were selected, PSUs are urban neighborhoods, suburban neighborhoods, towns, and rural villages |
| 1991 | M and F | All age categories | 〃 | 〃 | |||
| 1993 | 〃 | 〃 | 〃 | 〃 | |||
| 1997 | 〃 | 〃 | 〃 | 〃 | |||
| 2000 | 〃 | 〃 | Multistage, random cluster sample: province > county > PSUs (n = 216) > household | 〃 | |||
| 2004 | 〃 | 〃 | 〃 | 〃 | |||
| 2006 | 〃 | 〃 | 〃 | 〃 | |||
| 2009 | 〃 | 〃 | 〃 | 〃 | |||
| Japan [24,25] | National Nutrition Survey in Japan (NNS-J) | National Institute of Health and Nutrition (NIHN) | 2004–2007 | M and F | ≥1−70+ | Stratified random sample:survey district units (n = 300) > households | n/a |
| Korea [26,27] | Korean National Health and Nutrition Examination Survey (KNHANES) | Korean Institute for Health and Social Affairs (KIHASA) and the Korea Health Industry Development Institute (KHIDI) | 1998 | M and F | ≥1 − 70+ | Stratified, multistage probability sample: PSUs (n = 600) > households | Census data, population register |
| 〃 | 2001 | 〃 | 〃 | 〃 | 〃 | ||
| KIHASA, KHIDI and the Korean Centers for Disease Control and Prevention (KCDC) | 2005 | 〃 | 〃 | 〃 | 〃 | ||
| KCDC | 2007 | 〃 | 〃 | 〃 | 〃 | ||
| 〃 | 2008 | 〃 | 〃 | 〃 | 〃 | ||
| 〃 | 2009 | 〃 | 〃 | 〃 | 〃 | ||
| Malaysia [28,29] | Malaysian Adult Nutrition Survey (MANS) | Ministry of Health Malaysia (MOH-M) | 2004 | M and F | 18–59 | Stratified random sample with proportional allocation | Enumeration Blocks (EB) and Living Quarters (LQ) were sampled proportionate to population size |
| Australasia | |||||||
| Australia [30,31,32,33] | National Nutrition Survey (NNS) | Australian Bureau of Statistics (ABS) and Commonwealth Department of Health and Family Services (HFS) | 1995 | M and F | ≥ 2 | Multistage, area-based sample | Householders in private dwellings in 8 states and territories; Area-based selection using census collector districts from the 1991 Population Census |
| New Zealand [34,35,36] | New Zealand National Nutrition Survey (NNS97) | New Zealand Ministry of Health (MOH-NZ) | 1996–1997 | M and F | ≥ 15 | Multistage, stratified sample: PSUs (n = 18,000) > households > participant | Area based, census data (1991) |
| New Zealand Adult Nutrition Survey (NZANS) | 〃 | 2008–2009 | 〃 | 〃 | Multistage, stratified, probability-proportional-to-size (PPS) sample | Area based, New Zealand census meshblocks (2006) |
| Continent | Dietary intake assessment | ||||||||
|---|---|---|---|---|---|---|---|---|---|
| Country [Ref.] | Survey name | Year(s) | Method | Total recalls (n) | Administration of method | Portion size estimation | Interview aids/software | Measured anthropometrics | Biological samples |
| North-America | |||||||||
| Canada [12,13] | Canadian Community Health Survey - Nutrition (CCHS) | 2004 | 24-HDR (children: 6-11 years assisted by parents; <6 years reported by parents)/ FFQ (past year, fruit and vegetables only) | 1 (70% of sample) 2 (30% of sample) | Face-to-face (first interview) Telephone (recall)/ Paper-pencil | Food model booklet, volume measures (tablespoon, cup, etc.), weight measures (ounce, gram, etc.), dimensions (length, width, etc.), general measures (relative sizes, container units) | CAI software, developed by Statistics Canada (adopted from AMPM, USDA) | Weight and height | n/a |
| US [14,15] | What we Eat in America (WWEIA), National Health and Nutrition Examination Survey (Continuous NHANES) | 2001–2002 | 24-HDR (children < 16 years proxy provided information)/ FFQ (past year, 124 items) | 1 | Face-to-face/ Paper-pencil | Three-dimensional food models for first interview. | CAI software, developed by USDA: Automated Multiple-Pass Method (AMPM) | Body composition and bone density (Dual energy x-ray absorptiometry), body measurements. | For a complete list of laboratory components of NHANES 1999–2012 visit http://www.cdc.gov/nchs/nhanes/about_nhanes.htm. |
| 2003–2004 | 〃 | 2 (3–10 day interval) | Face-to-face (first interview) Telephone (recall) | Three-dimensional food models for first interview. USDA’s Food Model Booklet (two-dimensional drawings of glasses, mugs, bowls, mounds, circles, etc.) and three-dimensional models (measuring cups and spoons, a ruler, and two household spoons) for telephone interview. | 〃 | 〃 | 〃 | ||
| 2005–2006 | 〃 | 〃 | 〃 | 〃 | 〃 | 〃 | 〃 | ||
| 2007–2008 | 〃 | 〃 | 〃 | 〃 | 〃 | 〃 | 〃 | ||
| 2009–2010 | 〃 | 〃 | 〃 | 〃 | 〃 | 〃 | 〃 | ||
| Mexico [16,17,18,19,20] | National Nutrition Survey 1999 (NNS-1999) | 1998–1999 | 24-HDR | 1 | n/a | n/a | n/a | Weight and height (in women, waist and hip circumferences) | Capillary blood: concentration of hemoglobin Venous blood and urine: assessment of micronutrient status |
| Encuesta Nacional de Salud y Nutrición 2006 (ENSANUT 2006), Mexican Health and Nutrition Survey 2006 (MHNS-06) | 2005–2006 | Semi-quantitative FFQ (past 7 days, 101 foods, 14 food groups) | n/a | n/a | n/a | ||||
| South-America | |||||||||
| Brazil [21] | Brazilian Individual Dietary Survey (IDS 2008-2009) | 2008–2009 | 2-day EDR (non-consecutive on pre-determined days spanning one week) | Paper pencil, face-to-face interview to review food records | Picture book (pictures of plates, glasses, bottles and cutlery) | CAPI software | Weight and height | n/a | |
| Asia | |||||||||
| China [22,23] | China Health and Nutrition Survey (CHNS) | 1989 | 24-HDR (children < 12 years proxy provided information) | 3 (consecutive on pre-determined days spanning one week) | Paper pencil, face-to-face interview | Food models and picture aids | n/a | Weight and height, head circumference, arm circumference, and waist-hip ratio | None |
| 1991 | 〃 | 〃 | 〃 | 〃 | 〃 | 〃 | 〃 | ||
| 1993 | 〃 | 〃 | 〃 | 〃 | 〃 | 〃 | 〃 | ||
| 1997 | 〃 | 〃 | 〃 | 〃 | 〃 | 〃 | 〃 | ||
| 2000 | 〃 | 〃 | 〃 | 〃 | 〃 | 〃 | 〃 | ||
| 2004 | 〃 | 〃 | 〃 | 〃 | 〃 | 〃 | 〃 | ||
| 2006 | 〃 | 〃 | 〃 | 〃 | 〃 | 〃 | 〃 | ||
| 2009 | 〃 | 〃 | 〃 | 〃 | 〃 | 〃 | Blood collection | ||
| Japan [24,25] | National Nutrition Survey in Japan (NNS-J) | 2004–2007 | 1- or 3-day semi-weighed DR/ FFQ (≥20 years/ past 2 months, 122 foods and composite dishes) | Paper pencil, face-to-face interview to review food records/ Paper-pencil | Kitchen scale | n/a | Weight and height (subjects aged 1 year or older), abdominal circumference (subjects aged 6 year or older) | Blood collection (subjects aged 20 years or older) | |
| Korea [26,27] | Korean National Health and Nutrition Examination Survey (KNHANES) | 1998 | 24-HDR (in 200 PSUs)/ FFQ (past year, 109 food items) | 1 | Face-to-face/ Paper-pencil | Three-dimensional food models and a picture book with color photographs of foods | n/a | Weight and height | Blood and urine collection |
| 2001 | 〃 | 〃 | 〃 | 〃 | n/a | 〃 | 〃 | ||
| 2005 | 〃 | 〃 | 〃 | 〃 | n/a | 〃 | 〃 | ||
| 2007 | 〃 | 〃 | 〃 | 〃 | n/a | 〃 | 〃 | ||
| 2008 | 〃 | 〃 | 〃 | 〃 | n/a | 〃 | 〃 | ||
| 2009 | 〃 | 〃 | 〃 | 〃 | n/a | 〃 | 〃 | ||
| Malaysia [28,29] | Malaysian Adult Nutrition Survey (MANS) | 2004 | 24-HDR/ FFQ (past year, 126 foods, 15 food groups) | 1 | Face-to-face/ Paper-pencil | Album of food pictures and household measures | Nutritionist Pro™ Nutrition Analysis Software (for data entry) | Weight and height | n/a |
| Australasia | |||||||||
| Australia [30,31,32,33] | National Nutrition Survey (NNS) | 1995 | 24-HDR (children: 2-4 years reported by adult; 5-11 yrs assisted by adult)/ FFQ (≥ 12 years/ past year, 107 foods) | 1 (90% of sample)2 (10% of sample) | Face-to-face/ Paper-pencil | Measuring cups and spoons, grids and ruler | Food instruction booklet with types of foods and quantities of 15 food groups | Weight and height, waist and hip circumference | n/a |
| New Zealand [34,35,36] | New Zealand National Nutrition Survey (NNS97) | 1996–1997 | 24-HDR/ FFQ (past year, 9 food categories) | 1 2 (n = 695) | Face-to-face/ Paper-pencil | Cups, spoons, thickness sticks (thickness of meat, fish, poultry and cheese), photographs , grids and concentric circles, balls (to estimate apples and oranges), beans bags (to describe mashed potato and rice), standard serving sizes of foods and weights | CAPI software, LINZ24© (analogous to AMPM, USDA) | Weight and height, circumference of waist, hip and arm, waist-hip ratio, triceps and subscapular skinfold thickness, elbow breadth | Non-fasting blood sample: cellular evaluation, blood lipids, iron |
| New Zealand Adult Nutrition Survey (NZANS) | 2008–2009 | 24-HDR/ dietary habits questionnaire | 1 (75% of sample) 2 (25% of sample) | Face-to-face/ Paper-pencil | Food photographs, shape dimensions, food portion assessment aids (e.g. dried beans) and packaging information | 〃 | Weight and height, waist circumference | Non-fasting blood sample: cellular evaluation, blood lipids, iron, HbA1c Spot urine sample: sodium, potassium, iodine, creatinine | |
3.3. Dietary Intake Assessment Methods
3.4. Fieldwork Characteristics and Data Controls
3.5. Food Linking and Analysis
| Continent | |||||||
|---|---|---|---|---|---|---|---|
| Country [Ref.] | Survey name | Year(s) | Invitation type | Incentives | Number of participants (n) | Participation rate (%) | Problems in recruitment/ recruitment notes |
| North-America | |||||||
| Canada [12,13] | Canadian Community Health Survey-Nutrition (CCHS) | 2004 | Invitation letter and telephone invitation | None | 35.107 | 76.5 | Difficulties in approaching target population, participation was experienced as burdensome |
| US [14,15] | What we Eat in America (WWEIA), National Health and Nutrition Examination Survey (Continuous NHANES) | 2001–2002 | Invitation letter, personal visit at home | Participants receive remuneration as well as reimbursement for transportation and child/elder care expenses | 11.039 | 84.0 | NHANES is designed to sample larger numbers of certain subgroups of particular public health interest. Oversampling is done to increase the reliability and precision of estimates of health status indicators for these population subgroups. |
| 2003–2004 | 〃 | 〃 | 10.122 | 79.0 | 〃 | ||
| 2005–2006 | 〃 | 〃 | 10.348 | 80.5 | 〃 | ||
| 2007–2008 | 〃 | 〃 | 10.149 | 78.4 | 〃 | ||
| 2009–2010 | 〃 | 〃 | 10.537 | 79.4 | 〃 | ||
| Mexico [16,17,18,19,20] | National Nutrition Survey 1999 (NNS-1999) | 1998–1999 | n/a | n/a | Adolescent F: 416 Adult F: 2,596 | 82.4 | n/a |
| Encuesta Nacional de Salud y Nutrición 2006 (ENSANUT 2006), Mexican Health and Nutrition Survey 2006 (MHNS-06) | 2005–2006 | n/a | n/a | Adolescents: 7,464 Adults: 21,113 | n/a | n/a | |
| South-America | |||||||
| Brazil [21] | Brazilian Individual Dietary Survey (IDS 2008-2009) | 2008–2009 | Personal visit at home | None | 34.032 | 81.0 | The burden of participating in a survey was reported as a recruitment problem |
| Asia | |||||||
| China [22,23] | China Health and Nutrition Survey (CHNS) | 1989 | Personal visit at home | n/a | 15.927 | n/a | Participants leaving in one survey and moving back in a later year, migration of participants, natural disasters and major redevelopment of housing in all large urban centres |
| 1991 | 〃 | 〃 | 14.789 | 88.1 | 〃 | ||
| 1993 | 〃 | 〃 | 13.893 | 88.2 | 〃 | ||
| 1997 | 〃 | 〃 | 15.874 | 80.9 | 〃 | ||
| 2000 | 〃 | 〃 | 17.054 | 83.0 | 〃 | ||
| 2004 | 〃 | 〃 | 16.129 | 80.2 | 〃 | ||
| 2006 | 〃 | 〃 | 18.764 | 88.0 | 〃 | ||
| 2009 | 〃 | 〃 | n/a | n/a | 〃 | ||
| Japan [24,25] | National Nutrition Survey in Japan (NNS-J) | 2004–2007 | n/a | n/a | 8,762 (2004) 8,885 (2007) | ≈60.0 (a) | n/a |
| Korea [26,27] | Korean National Health and Nutrition Examination Survey (KNHANES) | 1998 | Invitation letter | Small present | 11.525 | 95.9 | n/a |
| 2001 | 〃 | 〃 | 10.051 | 81.0 | |||
| 2005 | 〃 | Small present and a letter with individual results from examination | 9.047 | 80.5 | The burden of participating in a survey and motivation of participants were reported as recruitment problems | ||
| 2007 | 〃 | 〃 | 4.099 | 80.6 | 〃 | ||
| 2008 | 〃 | 〃 | 8.641 | 82.0 | 〃 | ||
| 2009 | 〃 | 〃 | 9.397 | 82.2 | 〃 | ||
| Malaysia [28,29] | Malaysian Adult Nutrition Survey (MANS) | 2004 | n/a | n/a | 6.886 | 93.6 (24-HDR) 92.0 (FFQ) | n/a |
| Australasia | |||||||
| Australia [30,31,32,33] | National Nutrition Survey (NNS) | 1995 | Invitation letter | None | 13.858 | 61.4 (24-HDR) 76.0 (FFQ) | n/a |
| New Zealand [34,35,36] | New Zealand National Nutrition Survey (NNS97) | 1996–1997 | Telephone invitation and/or personal visit at home | Small present | 4.636 | 50.1 | Participants of the Health Survey were asked if they would further consent to the Nutrition Survey which badly affected the response rate since added respondent burden and time lapse between both surveys |
| New Zealand Adult Nutrition Survey (NZANS) | 2008–2009 | Personal visit at home | Grocery voucher (if blood collected) and a letter with individual results from examination | 4.721 | 61.0 | 〃 | |
| Country [Ref.] | Survey name | Year(s) | Place of DIA administration | Time-span fieldwork | Intermediate controls | Final data controls |
|---|---|---|---|---|---|---|
| North-America | ||||||
| Canada [12,13] | Canadian Community Health Survey-Nutrition (CCHS) | 2004 | Participant’s home | Jan 2004–Jan 2005 | Quality control at data entry, checking completeness and accuracy of collected data, regular meetings to review the progress of fieldwork and interviewers. | Identification of extreme values of nutrients and food groups. Calculation of misreporting (see table 6). |
| US [14,15] | What we Eat in America (WWEIA), National Health and Nutrition Examination Survey (Continuous NHANES) | 2001–2002 | First interview: Mobile Examination Center (MEC) | Jan 2001–Dec 2002 | The CAPI software program has built-in data edit and consistency checks to reduce data entry errors. Interviewers were alerted the when unusual or potentially erroneous data values were recorded. | Interview records were reviewed by the NHANES field office staff for accuracy and completeness. A subset of the household interviews was verified by re-contacting the survey participants. Periodically, interviews were audio-taped and reviewed by NCHS and contractor staff. |
| 2003–2004 | First interview: MEC Second interview: participant's home | Jan 2003–Dec 2004 | 〃 | 〃 | ||
| 2005–2006 | 〃 | Jan 2005–Dec 2006 | 〃 | 〃 | ||
| 2007–2008 | 〃 | Jan 2007–Dec2008 | 〃 | 〃 | ||
| 2009–2010 | 〃 | Jan 2009–Dec2010 | 〃 | 〃 | ||
| Mexico [16,17,18,19,20] | National Nutrition Survey 1999 (NNS-1999) | 1998–1999 | n/a | Oct 1998–Mar1999 | n/a | n/a |
| Encuesta Nacional de Salud y Nutrición 2006 (ENSANUT 2006), Mexican Health and Nutrition Survey 2006 (MHNS-06) | 2005–2006 | n/a | Oct 2005–May 2006 | n/a | n/a | |
| South-America | ||||||
| Brazil [21] | Brazilian Individual Dietary Survey (IDS 2008–2009) | 2008–2009 | Participant's home | May 2008–May2009 | Cross-check data, quality control during data entry, completeness and accuracy checks of collected data, regular meetings to review the progress of fieldwork and make adjustments as required | Calculation of misreporting (see table 6). |
| Asia | ||||||
| China [22,23] | China Health and Nutrition Survey (CHNS) | 1989 | Participant’s home | n/a | Internal controls on quality measures have been based on collecting measures of selected factors from multiple perspectives and then using these data to refine measurements. | Individual's average daily dietary intake, calculated from the household survey, was compared with dietary intake based on 24-h recall data. In case of discrepancies, households were revisited. |
| 1991 | 〃 | 〃 | 〃 | 〃 | ||
| 1993 | 〃 | 〃 | 〃 | 〃 | ||
| 1997 | 〃 | 〃 | 〃 | 〃 | ||
| 2000 | 〃 | 〃 | 〃 | 〃 | ||
| 2004 | 〃 | 〃 | 〃 | 〃 | ||
| 2006 | 〃 | 〃 | 〃 | 〃 | ||
| 2009 | 〃 | 〃 | 〃 | |||
| Japan [24,25] | National Nutrition Survey in Japan (NNS-J) | 2004–2007 | Participant's home | n/a | Interview with participant to review food records and check for completeness | n/a |
| Korea [26,27] | Korean National Health and Nutrition Examination Survey (KNHANES) | 1998 | Participant’s home | Nov 1998–Dec 1998 | Cross-check of data, participants were re-contacted to provide extra information when the data is incomplete or possibly wrong | Extreme values for some nutrients and food groups were calculated |
| 2001 | 〃 | Nov 2001–Dec 2001 | 〃 | 〃 | ||
| 2005 | 〃 | Apr 2005–May2005 | 〃 | 〃 | ||
| 2007 | 〃 | Jul 2007–Dec 2007 | 〃 | 〃 | ||
| 2008 | 〃 | Jan 2008–Dec 2008 | 〃 | 〃 | ||
| 2009 | 〃 | Jan 2009–Dec 2009 | 〃 | 〃 | ||
| Malaysia [28,29] | Malaysian Adult Nutrition Survey (MANS) | 2004 | Participant's home | Oct 2002–Dec 2003 | Data entry clerks trained to identify, describe foods and recipes and performed quality control checks, interviewers reviewed the recall with the respondent to check for completeness and accuracy | Calculation of misreporting (see Table 6). |
| Australasia | ||||||
| Australia [30,31,32,33] | National Nutrition Survey (NNS) | 1995 | Participant’s home | Feb 1995–Mar 1996 | Data was checked immediately after collection using standardised checklists. During data entry, all data was scrutinized and quality control checks for extreme quantities were built-in to the data entry computer system. | Extreme values for for energy, macro-nutrients and micro-nutrients by age and sex were checked. Calculation of misreporting (see Table 6). |
| New Zealand [34,35,36] | New Zealand National Nutrition Survey (NNS97) | 1996–1997 | Participant’s home | Dec 1996–Nov 1997 | Interviewers sent diet recalls to project office within 24 hours of collection so the project office could check each recall for accuracy and completeness which enabled interviewers to go back to participants, and/or clarify data with project office | Extreme values for nutrient intakes were scrutinised after conversion of food to nutrients |
| New Zealand Adult Nutrition Survey (NZANS) | 2008–2009 | Participant’s home | Oct 2008–Oct 2009 | 〃 | 〃 |
| Continent | ||||||
|---|---|---|---|---|---|---|
| Country [Ref.] | Survey name | Year(s) | Food classification system | Food composition databases | Statistical procedures/adjustment (software) | Methods for calculating under- or overreporting |
| North-America | ||||||
| Canada [12,13] | Canadian Community Health Survey—Nutrition (CCHS) | 2004 | Bureau of Nutritional Sciences (BNS) food groups, based on British and American food group systems | Nutrition Survey System (NSS) | Nusser method using SIDE (Iowa State University) | Equations by Black and Cole |
| US [14,15] | What we Eat in America (WWEIA), National Health and Nutrition Examination Survey (Continuous NHANES) | 2001–2002 | Food Surveys Research Group (FSRG) defined food groups | USDA Food and Nutrient Database (FNDDS), 1.0 | SUDAAN was used to adjust for survey design effects resulting from NHANES’ complex, multistage, probability sampling | Calculation of EI:BMRest |
| 2003–2004 | 〃 | USDA Food and Nutrient Database (FNDDS), 2.0 | Nusser method using C-SIDE (Iowa State University) | 〃 | ||
| 2005–2006 | 〃 | USDA Food and Nutrient Database (FNDDS), 3.0 | NCI method | 〃 | ||
| 2007–2008 | 〃 | USDA Food and Nutrient Database (FNDDS), 4.1 | 〃 | 〃 | ||
| 2009–2010 | 〃 | USDA Food and Nutrient Database (FNDDS), 5.0 | 〃 | 〃 | ||
| Mexico [16,17,18,19,20] | National Nutrition Survey 1999 (NNS-1999) | 1998–1999 | n/a | USDA Nutrient database for standard reference, University of California Food composition database, Tabla de composición de alimentos para uso en América Latina (PAHO, INCAP), Tablas de composición de alimentos mexicanos del Instituto Nacional de Ciencias Médicas y Nutrición Salvador Zubirán, Tablas de valor nutritivo de los alimentos de mayor consumo en México, Food composition and nutrition tables (Souci, Fachmann & Kraut) | n/a | n/a |
| Encuesta Nacional de Salud y Nutrición 2006 (ENSANUT 2006), Mexican Health and Nutrition Survey 2006 (MHNS-06) | 2005–2006 | n/a | n/a | n/a | n/a | |
| South-America | ||||||
| Brazil [21] | Brazilian Individual Dietary Survey (IDS 2008–2009) | 2008–2009 | National food classification system | Nutrition Coordination Center Nutrient Databank (Nutrition Data System for Research—NDSR, Minneapolis), Brazilian Food Composition Table (TACO) | NCI method | Calculation of EI:BMRest |
| Asia | ||||||
| China [22,23] | China Health and Nutrition Survey (CHNS) | 1989 | n/a | Food Composition Table for China (ed. 1991) | n/a | n/a |
| 1991 | 〃 | 〃 | 〃 | 〃 | ||
| 1993 | 〃 | 〃 | 〃 | 〃 | ||
| 1997 | 〃 | 〃 | 〃 | 〃 | ||
| 2000 | 〃 | 〃 | 〃 | 〃 | ||
| 2004 | 〃 | Food Composition Table for China (ed. 2002) | 〃 | 〃 | ||
| 2006 | 〃 | Food Composition Table for China (ed. 2004) | 〃 | 〃 | ||
| 2009 | 〃 | 〃 | 〃 | 〃 | ||
| Japan [24,25] | National Nutrition Survey in Japan (NNS-J) | 2004-2007 | n/a | Standard Tables of Food Composition in Japan | n/a | n/a |
| Korea [26,27] | Korean National Health and Nutrition Examination Survey (KNHANES) | 1998 | National food classification system | Food composition table from the National Rural Living Science Institute | Nusser method using C-SIDE (Iowa State University) | Not applied |
| 2001 | 〃 | 〃 | 〃 | 〃 | ||
| 2005 | 〃 | 〃 | 〃 | 〃 | ||
| 2007 | 〃 | 〃 | 〃 | 〃 | ||
| 2008 | 〃 | 〃 | 〃 | 〃 | ||
| 2009 | 〃 | 〃 | 〃 | 〃 | ||
| Malaysia [28,29] | Malaysian Adult Nutrition Survey (MANS) | 2004 | n/a | USDA Food Database, Canadian Food Database, Mexico Food Database, Malaysian Food Composition Tables (all available in Nutritionist Pro), Singapore Food Composition Guide, ASEAN Food Composition Tables, and The China Food Composition Tables | n/a | Calculation of EI:BMRest |
| Australasia | ||||||
| Australia [30,31,32,33] | National Nutrition Survey (NNS) | 1995 | National food classification system developed by ANZFA | NNS nutrient composition database AUSNUT (1999) developed by the Australia New Zealand Food Authority (ANZFA). Food and beverage intake data were coded using the Australian Nutrition Survey System (ANSURS). | Adjustment for within-person variability using the equation put forward by the US National Academy of Science (NAS) Subcommittee on Criteria for Dietary Evaluation (1986) | Calculation of EI:BMRest |
| New Zealand [34,35,36] | New Zealand National Nutrition Survey (NNS97) | 1996–1997 | National food classification system | New Zealand Food Composition Database (NZFCD), FOODfiles electronic subset of data from the NZFCD, NUTTAB Food Composition Tables (Australia), McCance and Widdowson’s Composition of Foods and other international data as required | Nusser method using C-SIDE (Iowa State University) | Not applied |
| New Zealand Adult Nutrition Survey (NZANS) | 2008–2009 | 〃 | 〃 | 〃 | 〃 | |
| Continent | |||||||
|---|---|---|---|---|---|---|---|
| Country [Ref.] | Survey name | Year(s) | Recruitment criteria interviewers | Number of interviewers (n) | Training material/Training topics | Training duration | Remarks |
| North-America | |||||||
| Canada [12,13] | Canadian Community Health Survey - Nutrition (CCHS) | 2004 | Professional interviewers who work on a variety of surveys, full-time and part-time | 600 | Software training, interview training | 3, 5 days | |
| US [14,15] | What we Eat in America (WWEIA), National Health and Nutrition Examination Survey (Continuous NHANES) | 2001–2002 | High School diploma required/BA preferred | n/a | Intensive training course and supervised practice interviews, periodic and annual retraining sessions | 2 weeks | |
| 2003–2004 | 〃 | 〃 | 〃 | 〃 | |||
| 2005–2006 | 〃 | 〃 | 〃 | 〃 | |||
| 2007–2008 | 〃 | 〃 | 〃 | 〃 | |||
| 2009–2010 | 〃 | 〃 | 〃 | 〃 | |||
| Mexico [16,17,18,19,20] | Mexican Health and Nutrition Survey 2006 (MHNS-06) | 2005–2006 | n/a | n/a | n/a | n/a | |
| Encuesta Nacional de Salud y Nutrición 2006 (ENSANUT 2006), Mexican Health and Nutrition Survey 2006 (MHNS-06) | 2005–2006 | n/a | n/a | n/a | n/a | ||
| South-America | |||||||
| Brazil [21] | Brazilian Individual Dietary Survey (IDS 2008-2009) | 2008–2009 | n/a | n/a | Software training, training on contacting participants, interview training, data-collection skills | 1 week | |
| Asia | |||||||
| China [22,23] | China Health and Nutrition Survey (CHNS) | 1989 | Trained nutritionists | 160 | Specific training in the collection of dietary data for field staff and office staff | 3 days | |
| 1991 | 〃 | 〃 | 〃 | 〃 | |||
| 1993 | 〃 | 〃 | 〃 | 〃 | |||
| 1997 | 〃 | 〃 | 〃 | 〃 | |||
| 2000 | 〃 | 〃 | 〃 | 〃 | |||
| 2004 | 〃 | 〃 | 〃 | 〃 | |||
| 2006 | 〃 | 〃 | 〃 | 〃 | |||
| 2009 | 〃 | 〃 | 〃 | 〃 | |||
| Japan [24,25] | National Nutrition Survey in Japan (NNS-J) | 2004–2007 | Registered dietitians and dietitians for nutrition component of health survey | n/a | n/a | n/a | |
| Korea [26,27] | Korean National Health and Nutrition Examination Survey (KNHANES) | 1998 | Trained dietitians/nutritionists | 160 | Training on contacting participants, interview training, data-collection skills | 5 days | |
| 2001 | 〃 | 100 | 〃 | 3 days | |||
| 2005 | 〃 | 150 | 〃 | 4 days | |||
| 2007 | 〃 | 10 | 〃 | 11 days | A smaller number of well-trained dietitians were used after changing to the annual survey | ||
| 2008 | 〃 | 12 | 〃 | 10 days | |||
| 2009 | 〃 | 12 | 〃 | 15 days | |||
| Malaysia [28,29] | Malaysian Adult Nutrition Survey (MANS) | 2004 | Nutritionists familiar with local food customs | n/a | Training on interviewing and probing skills, quantification of portion sizes of foods | n/a | |
| Australasia | |||||||
| Australia [30,31,32,33] | National Nutrition Survey (NNS) | 1995 | Qualified dietitians and nutritionists | n/a | Intensive training and supervision of interviewers to reduce non-sampling errors | 2 weeks | |
| New Zealand [34,35,36] | New Zealand National Nutrition Survey (NNS97) | 1996–1997 | Trained interviewers familiar with local food customs passing an admission test | n/a (every interviewer was assisted by one assistant) | Software training, training on contacting participants, interview training, data-collection skills and training on the use of the survey tools. | Interviewer: 2 weeks Assistant: 2 days | Additional training was provided at the regional level every two months. Pacific interviewers and assistants were trained to survey non-English speaking Pacific and Asian immigrant groups. |
| New Zealand Adult Nutrition Survey (NZANS) | 2008–2009 | 〃 | 22 | 〃 | 2 weeks | Additional training was provided at the regional level every three months. Pacific interviewers and assistants were trained to survey non-English speaking Pacific and Asian immigrant groups. | |
3.6. Recruitment and Training of Field Staff
4. Discussion
5. Conclusions
Acknowledgments
Author Contributions
Conflicts of Interest
References
- Brussaard, J.H.; Lowik, M.R.; Steingrimsdottir, L.; Moller, A.; Kearney, J.; de Henauw, S.; Becker, W.; Group, E. A European food consumption survey method—Conclusions and recommendations. Eur. J. Clin. Nutr. 2002, 56, S89–S94. [Google Scholar] [CrossRef] [PubMed]
- de Boer, E.J.; Slimani, N.; van 't Veer, P.; Boeing, H.; Feinberg, M.; Leclercq, C.; Trolle, E.; Amiano, P.; Andersen, L.F.; Freisling, H.; et al. Rationale and methods of the European Food Consumption Validation (EFCOVAL) Project. Eur. J. Clin. Nutr. 2011, 65 (Suppl. 1), S1–S4. [Google Scholar]
- EFSA. Declaration of the Advisory Forum on the Pan-European Food Consumption Survey; EFSA: Seville, Spain, 2010. [Google Scholar]
- European Food Safety Authority (EFSA). Guidance on the EU Menu methodology. EFSA J. 2014, 12, 77. [Google Scholar]
- Ocke, M.; Brants, H.; Dofkova, M.; Freisling, H.; van Rossum, C.; Ruprich, J.; Slimani, N.; Temme, E.; Trolle, E.; Vandevijvere, S.; et al. Feasibility of dietary assessment methods, other tools and procedures for a pan-European food consumption survey among infants, toddlers and children. Eur. J. Nutr. 2014. [Google Scholar] [CrossRef]
- Freisling, H.; Ocke, M.C.; Casagrande, C.; Nicolas, G.; Crispim, S.P.; Niekerk, M.; van der Laan, J.; de Boer, E.; Vandevijvere, S.; de Maeyer, M.; et al. Comparison of two food record-based dietary assessment methods for a pan-European food consumption survey among infants, toddlers, and children using data quality indicators. Eur. J. Nutr. 2015, 54, 437–445. [Google Scholar] [CrossRef] [PubMed]
- Gavrieli, A.; Naska, A.; Berry, R.; Roe, M.; Harvey, L.; Finglas, P.; Glibetic, M.; Gurinovic, M.; Trichopoulou, A. Dietary Monitoring Tools for Risk Assessment; EFSA supporting publication: Parma, Italy, 2014; p. 287. [Google Scholar]
- Huybrechts, I.; Casagrande, C.; Nicolas, G.; Geelen, A.; Crispim, S.P.; de Keyzer, W.; Freisling, H.; de Henauw, S.; de Maeyer, M.; Krems, C.; et al. Inventory of experiences from national/regional dietary monitoring surveys using EPIC-Soft. Eur. J. Clin. Nutr. 2011, 65, S16–S28. [Google Scholar] [CrossRef] [PubMed]
- Pisa, P.T.; Landais, E.; Margetts, B.; Vorster, H.H.; Friedenreich, C.M.; Huybrechts, I.; Martin-Prevel, Y.; Branca, F.; Lee, W.T.; Leclercq, C.; et al. Inventory on the dietary assessment tools available and needed in Africa: A prerequisite for setting up a common methodological research infrastructure for nutritional surveillance, research and prevention of diet-related non-communicable diseases. Crit. Rev. Food Sci. Nutr. 2014. [Google Scholar] [CrossRef]
- Blanquer, M.; Garcia-Alvarez, A.; Ribas-Barba, L.; Wijnhoven, T.M.; Tabacchi, G.; Gurinovic, M.; Serra-Majem, L. How to find information on national food and nutrient consumption surveys across Europe: systematic literature review and questionnaires to selected country experts are both good strategies. Br. J. Nutr. 2009, 101, S37–S50. [Google Scholar] [CrossRef] [PubMed]
- European Food Safety Authority. General principles for the collection of national food consumption data in the view of a pan-European dietary survey. EFSA J. 2009, 7, 51. [Google Scholar]
- Statistics Canada. Canadian Community Health Survey-Nutrition (CCHS). Available online: http://www.statcan.gc.ca/cgi-bin/imdb/p2SV.pl?Function=getSurvey&SDDS=5049&lang=en&db=imdb&adm=8&dis=2 (accessed on 5 November 2012).
- Health and Statistics Division Canada. Inventory of Food Consumption Surveys—Request for Information; Health and Statistics Division Canada: Ottawa, Canada, 2012. [Google Scholar]
- USDA. What We Eat in America, NHANES. Available online: http://www.ars.usda.gov/Services/docs.htm?docid=13793 (accessed on 24 October 2012).
- Centers for Disease Control and Prevention. National Health and Nutrition Examination Survey. Available online: http://www.cdc.gov/nchs/nhanes.htm (accessed on 13 October 2012).
- Barquera, S.; Campirano, F.; Bonvecchio, A.; Hernandez-Barrera, L.; Rivera, J.A.; Popkin, B.M. Caloric beverage consumption patterns in Mexican children. Nutr. J. 2010, 9, 47. [Google Scholar] [CrossRef] [PubMed]
- Barquera, S.; Hernandez-Barrera, L.; Tolentino, M.L.; Espinosa, J.; Ng, S.W.; Rivera, J.A.; Popkin, B.M. Energy intake from beverages is increasing among Mexican adolescents and adults. J. Nutr. 2008, 138, 2454–2461. [Google Scholar] [CrossRef] [PubMed]
- Barquera, S.; Rivera, J.A.; Espinosa-Montero, J.; Safdie, M.; Campirano, F.; Monterrubio, E.A. Energy and nutrient consumption in Mexican women 12–49 years of age: Analysis of the National Nutrition Survey 1999. Salud Pública Méx. 2003, 45, 530–539. [Google Scholar] [CrossRef]
- Resano-Pérez, E.; Méndez-Ramírez, I.; Shamah-Levy, T.; Rivera, J.A.; Sepúlveda-Amor, J. Methods of the National Nutrition Survey, 1999. Salud Pública Méx. 2003, 45, 558–564. [Google Scholar] [CrossRef]
- Rivera, J.A.; Sepúlveda Amor, J. Conclusions from the Mexican National Nutrition Survey 1999: Translating results into nutrition policy. Salud Pública de Méx. 2003, 45, 565–575. [Google Scholar] [CrossRef]
- Pereira, R.A.; Duffey, K.J.; Sichieri, R.; Popkin, B.M. Sources of excessive saturated fat, trans fat and sugar consumption in Brazil: an analysis of the first Brazilian nationwide individual dietary survey. Public Health Nutr. 2014, 17, 113–121. [Google Scholar] [CrossRef] [PubMed]
- Popkin, B.M.; Du, S.; Zhai, F.; Zhang, B. Cohort Profile: The China Health and Nutrition Survey—Monitoring and understanding socio-economic and health change in China, 1989–2011. Int. J. Epidemiol. 2010, 39, 1435–1440. [Google Scholar] [CrossRef] [PubMed]
- Chinese Center for Disease Control and Prevention. China Health and Nutrition Survey. Available online: http://www.cpc.unc.edu/projects/china (accessed on 13 November 2012).
- National Institute of Health and Nutrition Japan. Available online: http://www0.nih.go.jp/eiken/english/ (accessed on 15 October 2012).
- Tokudome, S.; Nishi, N.; Tanaka, H. Towards a better National Health and Nutrition Survey in Japan. Lancet 2012, 379, E44. [Google Scholar] [CrossRef] [PubMed]
- Korea Health Industry Development Institute. Inventory of Food Consumption Surveys—Request for Information; Nutrition Management Service and Policy Team: Chungbuk, Korea, 2012.
- Kim, D.W.; Shim, J.E.; Paik, H.Y.; Song, W.O.; Joung, H. Nutritional intake of Korean population before and after adjusting for within-individual variations: 2001 Korean National Health and Nutrition Survey Data. Nutr. Res. Pract. 2011, 5, 266–274. [Google Scholar] [CrossRef] [PubMed]
- Mirnalini, K.; Zalilah, M.; Safiah, M.; Tahir, A.; Siti Haslinda, M.; Siti Rohana, D.; Khairul Zarina, M.; Mohd Hasyami, S.; Normah, H. Energy and Nutrient Intakes: Findings from the Malaysian Adult Nutrition Survey (MANS). Malays. J. Nutr. 2008, 14, 1–24. [Google Scholar] [PubMed]
- Norimah, A.; Safiah, M.; Jamal, K.; Siti Haslinda, M.; Zuhaida, H.; Rohida, S.; Fatimah, S.; Siti Norazlin, N.; Poh, B.; Kandiah, M.; et al. Food Consumption Patterns: Findings from the Malaysian Adult Nutrition Survey (MANS). Malays. J. Nutr. 2008, 14, 25–39. [Google Scholar] [PubMed]
- Cook, T.; Rutishauser, I.; Seelig, M. Comparable Data on Food and Nutrient Intake and Physical Measurements from the 1983, 1985 and 1995 National Nutrition Surveys; 3057; National Food and Nutrition Monitoring and Surveillance Project—Commonwealth Department of Health and Aged Care: Canberra, Australia, 2001. [Google Scholar]
- McLennan, W.; Podger, A. National Nutrition Survey Selected Highlights Australia 1995; Australian Bureau of Statistics Commonwealth Department of Health and Family Services: Canberra, Australia, 1997. [Google Scholar]
- Rutishauser, I.H. Getting It Right: How to Use the Data from the 1995 National Nutrition Survey; Commonwealth Department of Health and Aged Care: Canberra, Australia, 2000.
- Mackerras, D.; Rutishauser, I. 24-Hour national dietary survey data: How do we interpret them most effectively? Public Health Nutr. 2005, 8, 657–665. [Google Scholar] [CrossRef] [PubMed]
- Ministry of Health. Nutrition Survey (New-Zealand). Available online: http://www.health. govt.nz/nz-health-statistics/national-collections-and-surveys/surveys/current-recent-surveys/nutrition-survey (accessed on 12 October 2012).
- Parnell, W.R.; Wilson, N.C.; Russell, D.G. Methodology of the 1997 New Zealand National Nutrition Survey. N. Z. Med. J. 2001, 114, 123–126. [Google Scholar] [PubMed]
- Quigley, R.; Watts, C. Food Comes First: Methodologies for the National Nutrition Survey of New Zealand; Public Health Group: Wellington, New Zealand, 1997. [Google Scholar]
- Goldberg, G.R.; Black, A.E.; Jebb, S.A.; Cole, T.J.; Murgatroyd, P.R.; Coward, W.A.; Prentice, A.M. Critical evaluation of energy intake data using fundamental principles of energy physiology: 1. Derivation of cut-off limits to identify under-recording. Eur. J. Clin. Nutr. 1991, 45, 569–581. [Google Scholar] [PubMed]
- Black, A.E.; Cole, T.J. Biased over- or under-reporting is characteristic of individuals whether over time or by different assessment methods. J. Am. Diet. Assoc. 2001, 101, 70–80. [Google Scholar] [CrossRef] [PubMed]
- U.S. Department of Agriculture. Using the USDA Food Models for Estimating Portions; Agricultural Research Service, Beltsville Human Nutrition Research Center, Food Surveys Research Group: Beltsville, MD, USA, 2007. [Google Scholar]
- Blanton, C.A.; Moshfegh, A.J.; Baer, D.J.; Kretsch, M.J. The USDA Automated Multiple-Pass Method accurately estimates group total energy and nutrient intake. J. Nutr. 2006, 136, 2594–2599. [Google Scholar] [PubMed]
- Moshfegh, A.J.; Rhodes, D.G.; Baer, D.J.; Murayi, T.; Clemens, J.C.; Rumpler, W.V.; Paul, D.R.; Sebastian, R.S.; Kuczynski, K.J.; Ingwersen, L.A.; et al. The US Department of Agriculture Automated Multiple-Pass Method reduces bias in the collection of energy intakes. Am. J. Clin. Nutr. 2008, 88, 324–332. [Google Scholar] [PubMed]
- Ahuja, J.K.; Moshfegh, A.J.; Holden, J.M.; Harris, E. USDA food and nutrient databases provide the infrastructure for food and nutrition research, policy, and practice. J. Nutr. 2013, 143, 241S–249S. [Google Scholar] [CrossRef] [PubMed]
- Ocke, M.C.; Slimani, N.; Brants, H.; Buurma-Rethans, E.; Casagrande, C.; Nicolas, G.; Dofkova, M.; le Donne, C.; Freisling, H.; Geelen, A.; et al. Potential and requirements for a standardized pan-European food consumption survey using the EPIC-Soft software. Eur. J. Clin. Nutr. 2011, 65, S48–S57. [Google Scholar] [CrossRef] [PubMed]
- Crispim, S.P.; de Vries, J.H.M.; Geelen, A.; Souverein, O.W.; Hulshof, P.J.M.; Lafay, L.; Rousseau, A.-S.; Lillegaard, I.T.L.; Andersen, L.F.; Huybrechts, I.; et al. Two non-consecutive 24 h recalls using EPIC-Soft software are sufficiently valid for comparing protein and potassium intake between five European centres—Results from the European Food Consumption Validation (EFCOVAL) study. Br. J. Nutr. 2011, 105, 447–458. [Google Scholar] [CrossRef] [PubMed]
- Crispim, S.P.; Geelen, A.; Souverein, O.W.; Hulshof, P.J.M.; Ruprich, J.; Dofkova, M.; Huybrechts, I.; De Keyzer, W.; Lillegaard, I.T.; Andersen, L.F.; et al. Biomarker-based evaluation of two 24-h recalls for comparing usual fish, fruit and vegetable intakes across European centers in the EFCOVAL Study. Eur. J. Clin. Nutr. 2011, 65, S38–S47. [Google Scholar] [CrossRef] [PubMed]
- Slimani, N.; Casagrande, C.; Nicolas, G.; Freisling, H.; Huybrechts, I.; Ocke, M.C.; Niekerk, E.M.; van Rossum, C.; Bellemans, M.; De Maeyer, M.; et al. The standardized computerized 24-h dietary recall method EPIC-Soft adapted for pan-European dietary monitoring. Eur. J. Clin. Nutr. 2011, 65, S5–S15. [Google Scholar] [CrossRef] [PubMed]
- IARC. Formal Announcement of the Name Change from EPIC-Soft® to GloboDiet® Software; Communications Group: Lyon, France, 2014. [Google Scholar]
- Hoddinott, J.; Yisehac, Y. Dietary Diversity as a Food Security Indicator. Food and Nutrition Technical Assistance Project (FANTA); Academy for Educational Development (AED): Washington, DC, USA, 2002. [Google Scholar]
- Working Group on Infant and Young Child Feeding Indicators. Developing and Validating Simple Indicators of Dietary Quality and Energy Intake of Infants and Young Children in Developing Countries: Summary of Findings from Analysis of 10 Data Sets. Food and Nutrition Technical Assistance (FANTA) Project; Academy for Educational Development (AED): Washington, DC, USA, 2006. [Google Scholar]
- Arimond, M.; Wiesmann, D.; Becquey, E.; Carriquiry, A.; Daniels, M.C.; Deitchler, M.; Fanou-Fogny, N.; Joseph, M.L.; Kennedy, G.; Martin-Prevel, Y.; et al. Simple food group diversity indicators predict micronutrient adequacy of women’s diets in 5 diverse, resource-poor settings. J. Nutr. 2010, 140, 2059S–2069S. [Google Scholar] [CrossRef] [PubMed]
- FAO. Food Composition Challenges. Available online: http://www.fao.org/infoods/infoods/food-composition-challenges (accessed on 21 May 2013).
- Schoeller, D.A. Validation of habitual energy intake. Public Health Nutr. 2002, 5, 883–888. [Google Scholar] [CrossRef] [PubMed]
- Poslusna, K.; Ruprich, J.; de Vries, J.H.; Jakubikova, M.; van’t Veer, P. Misreporting of energy and micronutrient intake estimated by food records and 24 hour recalls, control and adjustment methods in practice. Br. J. Nutr. 2009, 101, S73–S85. [Google Scholar] [CrossRef] [PubMed]
- Hill, R.J.; Davies, P.S. The validity of self-reported energy intake as determined using the doubly labelled water technique. Br. J. Nutr. 2001, 85, 415–430. [Google Scholar] [CrossRef] [PubMed]
- Trabulsi, J.; Schoeller, D.A. Evaluation of dietary assessment instruments against doubly labeled water, a biomarker of habitual energy intake. Am. J. Physiol. Endocrinol. Metab. 2001, 281, E891–E899. [Google Scholar] [PubMed]
© 2015 by the authors; licensee MDPI, Basel, Switzerland. This article is an open access article distributed under the terms and conditions of the Creative Commons Attribution license (http://creativecommons.org/licenses/by/4.0/).
Share and Cite
De Keyzer, W.; Bracke, T.; McNaughton, S.A.; Parnell, W.; Moshfegh, A.J.; Pereira, R.A.; Lee, H.-S.; Veer, P.V.; De Henauw, S.; Huybrechts, I. Cross-Continental Comparison of National Food Consumption Survey Methods—A Narrative Review. Nutrients 2015, 7, 3587-3620. https://doi.org/10.3390/nu7053587
De Keyzer W, Bracke T, McNaughton SA, Parnell W, Moshfegh AJ, Pereira RA, Lee H-S, Veer PV, De Henauw S, Huybrechts I. Cross-Continental Comparison of National Food Consumption Survey Methods—A Narrative Review. Nutrients. 2015; 7(5):3587-3620. https://doi.org/10.3390/nu7053587
Chicago/Turabian StyleDe Keyzer, Willem, Tatiana Bracke, Sarah A. McNaughton, Winsome Parnell, Alanna J. Moshfegh, Rosangela A. Pereira, Haeng-Shin Lee, Pieter Van't Veer, Stefaan De Henauw, and Inge Huybrechts. 2015. "Cross-Continental Comparison of National Food Consumption Survey Methods—A Narrative Review" Nutrients 7, no. 5: 3587-3620. https://doi.org/10.3390/nu7053587
APA StyleDe Keyzer, W., Bracke, T., McNaughton, S. A., Parnell, W., Moshfegh, A. J., Pereira, R. A., Lee, H.-S., Veer, P. V., De Henauw, S., & Huybrechts, I. (2015). Cross-Continental Comparison of National Food Consumption Survey Methods—A Narrative Review. Nutrients, 7(5), 3587-3620. https://doi.org/10.3390/nu7053587