Article

Effect of a Multicomponent mHealth Intervention on the Composition of Diet in a Population with Overweight and Obesity—Randomized Clinical Trial EVIDENT 3

by
Cristina Lugones-Sánchez
1,*,
José I. Recio-Rodríguez
1,2,
Marta Menéndez-Suárez
3,
Alicia Saz-Lara
4,
José I. Ramirez-Manent
5,6,
María A. Sánchez-Calavera
7,8,
Leticia Gómez-Sánchez
1,
Emiliano Rodríguez-Sánchez
1,9,†,
Luis García-Ortiz
1,10 and
Evident 3 Investigators Group
11,†
1
Primary Care Research Unit of Salamanca (APISAL), Institute of Biomedical Research of Salamanca (IBSAL), Health Service of Castilla y León (SACyL), 37005 Salamanca, Spain
2
Department of Nursing and Physiotherapy, University of Salamanca, 37007 Salamanca, Spain
3
University Clinical Hospital of Valladolid, Health Service of Castilla y León (SACyL), 47003 Valladolid, Spain
4
Health and Social Research Center, University of Castilla-La Mancha, 16071 Cuenca, Spain
5
Calvià Primary Care Center, Balearic Islands Health Research Institute (IDIBSA), Health Service of Balearic Islands, 07180 Calvià, Spain
6
Department of Medicine, University of the Balearic Islands, 07122 Palma, Spain
7
Las Fuentes Norte Health Center, Aragonese Group of Primary Care Research (GAIAP), Aragon Health Research Institute (IISA), Aragon Health Service, 50002 Zaragoza, Spain
8
Department of Internal Medicine, Psychiatry and Dermatology, University of Zaragoza, 50009 Zaragoza, Spain
9
Department of Medicine, University of Salamanca, 37007 Salamanca, Spain
10
Department of Biomedical and Diagnostic Sciences, University of Salamanca, 37007 Salamanca, Spain
11
EVIDENT Research Group, RICAPPS: Chronicity, Primary Care and Health Promotion Research Network, 37005 Salamanca, Spain
*
Author to whom correspondence should be addressed.
These authors contribute equally to this work.
Nutrients 2022, 14(2), 270; https://doi.org/10.3390/nu14020270
Submission received: 28 November 2021 / Revised: 28 December 2021 / Accepted: 6 January 2022 / Published: 9 January 2022

Abstract

:
A balanced diet can help in the prevention of chronic diseases. The aim of this study was to evaluate the effect of an mHealth intervention on the distribution of macronutrients and the intake of food groups. A total of 650 participants were included in this multi-center, clinical, randomized, controlled trial (Evident 3 study). All participants were given brief advice about diet and exercise. The intervention group received, in addition, an app (Evident 3) for the self-recording of their diet and an activity tracker wristband for 3 months. Follow-up visits were performed at 3 and 12 months to collect the diet composition using the Food Frequency Questionnaire. There were decreases in the intake of total calories, fat, protein and carbohydrates in both groups throughout the study, without significant differences between them. The intervention group reduced the intake of cholesterol (−30.8; 95% CI −59.9, −1.7) and full-fat dairies (−23.3; 95% CI −42.8, −3.8) and increased the intake of wholemeal bread (3.3; 95% CI −6.7, 13.3) and whole-grain cereals (3.4; 95% CI −6.8, 13.7) with respect to the control group. No differences were found in the rest of the nutritional parameters. The brief advice is useful to promote a healthier diet, and the app can be a support tool to obtain changes in relevant foods, such as integral foods, and the intake of cholesterol. Trial registration: ClinicalTrials.gov with identifier NCT03175614.

1. Introduction

Changes towards less healthy lifestyles, such as unbalanced diets and the consumption of ultra-processed products, along with physical inactivity, have caused an increase in the prevalence of obesity in the population [1,2]. Moreover, other studies have reported that poor-quality diets, that is, with little nutritional value [3] and a low score in diet quality indices [4], are associated with cardiovascular risk factors [5], leading to an increase in the prevalence of cardiometabolic diseases [6,7,8] and in mortality by chronic diseases [9,10]. Similarly, an inadequate intake of whole-grain cereals, fruit and sodium has been identified as a risk factor, relating to 50% of deaths and 66% of disability-adjusted life years [11]. Therefore, it seems necessary to develop interventions that promote a more balanced diet at every age range, even if these do not result in a short-term weight loss [12].
With the aim of promoting healthier lifestyles and reducing obesity, several studies have evaluated the effectiveness of nutritional interventions based on restricting the intake of calories, carbohydrates and fats in overweight populations, obtaining some beneficial results, such as weight loss [13,14], and improving other health variables [15,16]. However, the effect of this type of interventions is not always maintained in the long term [17,18], thus new strategies are required to prolong the effect.
In this sense, new technologies can play an important role, offering more personalized solutions adapted to the needs of the individual. Moreover, the use of mHealth can provide greater flexibility for their use, facilitating the long-term maintenance of nutritional interventions. In recent years, different studies have evaluated several digital tools for the self-monitoring of diet as a support for the treatment of obesity. Some of these tools have proved to be effective in body weight loss and in the reduction in energy consumption with respect to traditional interventions [19,20]. Mobile applications with other approaches to achieve a change of habits, such as those that include a personalized food planning [21] and those which provide nutritional information after scanning the bar code of food products [22], have also obtained promising results. All this indicates that this type of digital interventions can help to modify eating behaviors, and, consequently, improve different health parameters [23,24].
However, most of the studies that have included this type of tools have mainly evaluated weight loss, the increase in physical activity or the reduction in dietary energy consumption, thus there is still little evidence of the effect of these interventions on diet composition [25]. This information can be important, since obtaining changes in the amount of healthy foods consumed, such as fruit and vegetables, can be a good starting point to attain a more effective and long-lasting change of lifestyle, resulting in the long-term improvement of other health parameters [17], which could prevent the development of chronic diseases [26].
Therefore, the aim of this study was to evaluate the effect of a multicomponent intervention, with a mobile app for diet recording and an activity tracker wristband, on the diet composition, the distribution of macronutrients and the intake of food groups in a Spanish overweight and obese population.

2. Materials and Methods

2.1. Study Design

The EVIDENT 3 study is a multicenter, randomized, controlled clinical trial with two parallel groups and a 12-month follow-up. The study was conducted in five healthcare centers of different Spanish cities (Salamanca, Valladolid, Zaragoza, Cuenca and Palma de Mallorca) belonging to the Spanish Research Network for Preventive Activities and Health Promotion in Primary Care (REDIAPP). Each participant completed a baseline visit and two follow-up visits (at 3 and 12 months) from randomization. The visits of the EVIDENT 3 study were carried out between June 2017 and June 2020. The study was previously registered as a clinical trial (ClinicalTrials.gov identifier: NCT03175614).

2.2. Participants

The sample was selected by consecutive sampling among the individuals who visited the primary care professionals of the participating centers. The selection criteria were: 18–65 years of age, a body mass index (BMI) of 27.5–40, being classified as a sedentary person (performing 20 min of vigorous physical activity less than 3 times per week; 30 min of moderate physical activity less than 5 times per week; or any combination of these intensities less than 5 times per week [27]) and signing the informed consent. The study excluded those individuals with previous cardiovascular diseases, type 1 or 2 diabetes mellitus, people with a BMI over 40 kg/m2, and those who were on a diet monitored by a healthcare professional. The detailed list of inclusion and exclusion criteria can be checked in the protocol [28].

2.3. Screening and Randomization

A total of 677 individuals were evaluated for inclusion, of whom 27 candidates were excluded (20 did not meet the BMI criterion, and the other 7 were excluded for other reasons) (Figure 1). The sample included in the study consisted of a total of 650 individuals randomized into two groups with a ratio of 1:1. The control group (CG), who only received a brief advice, was composed of 332 individuals, and the intervention group (IG), who received, in addition to the brief advice, the app and the activity tracker wristband for 3 months, consisted of 318 individuals. The randomization sequence was generated with a software (Epidat 4.2, Xunta de Galicia, Spain) by an independent researcher, who was blinded until she performed the randomization of the participants to the groups.
To minimize the possible contamination between the groups, the researcher who performed the intervention was different from the one who conducted the evaluation visits. The researcher who performed the data analysis was also blinded. Due to the nature of the intervention, the subjects could not be blinded to it.

2.4. Intervention

2.4.1. Intervention Common for Both Groups

A nurse of each participating healthcare center, who were previously trained for the study and unconnected to the other activities of the study, gave the standardized individual brief advice about healthy lifestyles before randomization to the study groups. The advice regarding diet was based on the plate method [29] to attain a more balanced diet, where the plate is divided into 4 parts: half of the plate for salad or vegetables, a quarter for carbohydrates and the other quarter for proteins (preferably white meats). Moreover, it is recommended to add a medium-sized piece of fruit and a low-fat dairy product, which can be consumed as a dessert. The nurses explained the benefits of performing physical activity and the international recommendations about weekly physical activity, recommending to perform at least 30 min of moderate exercise (cycling, doubles tennis, etc.) 5 days per week or 20 min of vigorous activity (swimming, running, etc.) 3 days per week.

2.4.2. Specific Intervention

After completing the baseline visit and giving the standardized advice to the participants, another visit was performed 7 days after the baseline visit, where all the participants were asked to return the accelerometer and the questionnaires completed by them. Additionally, the participants of the IG received a Smartphone (Samsung Galaxy, Samsung, Suwon, Korea) with the mobile app and an activity tracker wristband (Xiaomi Miband 2, Xiaomi, Beijing, China), to be used throughout the 3 months of the intervention, training them in the use of these tools in a 15-min session on the day they were given these devices. Both the app and the rest of the materials used were provided in Spanish.
The application was set up with the participant’s data (sex, age, weight and height) to set the goals to be attained. The application was designed to enable the self-recording of the daily diet and the automatic gathering of the physical activity recorded by the activity tracker wristband. The participants recorded their daily diet, by selecting, within each meal (breakfast, brunch, lunch, tea and dinner), the foods or dishes consumed among the options offered by the app, indicating the portion size from among the images displayed (tapa, small, medium and large). The nutritional composition of the foods and dishes present in the app were gathered from the Spanish Food Composition Database (BEDCA) [30], which was developed by RedBEDCA and the Spanish Agency of Food and Nutrition (AESAN). Once the user introduces all the information, the app integrates all the data to create personalized recommendations and goals for energy intake, displaying the limits as a black and red line (Figure 2). The upper limit (the red line) was the result of adding the basal metabolic rate, diet-induced thermogenesis and estimated energy expenditure for sedentary activities, while the lower limit (the black line) was the 85% of those calculated calories. The participants could check these recommendations and the information about the daily energy consumption and the distribution of macronutrients (carbohydrates, proteins, and saturated and unsaturated fats) within the app (Figure 2). The application includes the use of effective behavioral strategies to achieve changes in habits, such as self-recording [31], goal setting and positive reinforcement [32]. A multidisciplinary team of doctors, nurses, dietitians and psychologists has collaborated in the development of the app. After the 3 months of intervention, all the devices were collected. All the information generated by the application was analyzed and integrated into the databases of the study.

2.5. Measurements

2.5.1. Dietary Intake

The dietary intake was recorded through the Food Frequency Questionnaire (FFQ), which is self-administered and semi-quantitative, consists of 137 items about eating and has been validated for use in the Spanish population [33]. The participants were requested to complete it with the frequency at which they had consumed, on average, each of the foods of the questionnaire during the last year, choosing one of the nine possible frequencies: never or almost never, 1–3 times per month, once per week, 2–4 times per week, 5–6 times per week, once per day, 2–3 times per day, 4–5 times per day, 6 times per day or more. The diet of the participants was evaluated with this questionnaire both in the baseline visit and in the follow-up visits (at 3 and 12 months). This questionnaire was handed to the participants after each visit, and they were requested to complete it at home and return it 7 days later, along with the devices, for subsequent analysis. The obtained information allowed for estimating the energy consumption, the distribution of macro and micronutrients and the daily intake of each macronutrient and food group in grams per day.

2.5.2. Other Measurements

The detailed description of the variables of the study and how they were gathered can be checked in the published study protocol [28].
Sociodemographic data: information was gathered about age, sex, marital status, employment situation and education level.
Motivation for change: in the baseline visit, the participants completed a self-developed questionnaire to evaluate the motivation and self-efficacy for change, following the transtheoretical model of Prochaska and DiClemente for health behavior change and weight management [34,35]. The questionnaire consisted of 6 Likert-scale items with 5 possible answers, and the participants were classified into three groups according to the obtained score: “not ready” (pre-contemplation and contemplation stages, ≤15 points), “ready” (preparation stage, 16–24 points) and “at the right moment” (action stage, ≥25 points).
Laboratory variable assessment: blood and urine samples were gathered early in the morning, with the patient fasting for over 12 h, following the general recommendations for the determination of the lipid profile, plasma glucose and insulin in the laboratory of the reference hospital.
Peripheral blood pressure: Three measurements of systolic blood pressure (SBP) and diastolic blood pressure (DBP) were recorded using the average of the last two measures with a validated Omron M10-IT sphygmomanometer (Omron Healthcare, Kyoto, Japan). The measurements were performed in both arms, with the participant sitting, after at least 5 min of rest, with a muff of adequate size and following the recommendations of the European Society of Hypertension [36].
Smoking habit: This was evaluated through a questionnaire with 4 standard questions adapted to the MONICA study of the WHO [37]. The participants of the study were classified as current smokers, former smokers (over one year without smoking) or non-smokers.

2.6. Ethics Approval and Consent to Participate

The study was approved by the Drug Research Ethics Committee of the Health Area of Salamanca (Approval Code: 2016-04-P1600170; Approval Date: 25 April 2016) (“CEIm del Área de Salud de Salamanca”) in April 2016 as coordinating team. It was also approved by the Ethics Committee of the rest of the collaborating centers: Western Valladolid, Aragón, Castile-La Mancha and Palma de Mallorca. The participants received the information of the study and signed the informed consent before being included in the study, in compliance with the guidelines of the Declaration of Helsinki [38].

2.7. Stadistical Analysis

The sample size was estimated for the main variables of the study. The recruitment of 650 individuals, with 318 participants in the intervention group and 332 in the control group, was considered sufficient to detect a statistically significant difference of 10 g of total intake of fat between the two groups, with alfa and beta risk levels of 0.05 and 0.20, respectively, in a bilateral test, a standard deviation of 35 g and a correlation between measurements of 0.5, estimating a follow-up loss rate of 10% [39].
The results are expressed as mean ± standard deviation for the quantitative variables or through the number and frequency distribution for the categorical variables. The results were analyzed by intention-to-treat, including all the patients randomized in the group to which they were assigned, regardless of their adherence to, abandonment of or deviation from the protocol, as well as everything that occurred after the randomization [40]. No imputation was performed for the missing data of the FFQ. Student’s t-test was used to compare the means between the two groups, and the paired t-test was employed to evaluate the changes within the same group.
To compare the changes in the composition of the diet between the groups along time (baseline, 3 months and 12 months), a variance analysis was conducted for repeated measures. The presence or absence of sphericity was taken into account, and the Greenhouse-Geisser correction was conducted when necessary. Contrast hypotheses were established using α = 0.05. The data were analyzed with IBM SPSS Statistics for Windows v.26.0 (IBM Corp, Armonk, NY, USA).

3. Results

3.1. Baseline Characteristics

Of all the individuals included in the study, 67.3% (n = 214) and 69.6% (n = 231) were women in IG and CG, respectively, with an average age of 47.7 ± 10.1 and 48.9 ± 9.2 years, respectively, and with no differences in the demographic or baseline clinical characteristics between the two groups (Table 1). Of the 650 individuals included in the trial, 102 and 105 in IG and CG, respectively, did not perform the two follow-up visits due to different reasons (see Figure 1). Therefore, a total of 443 individuals (216 in IG and 227 in CG) completed the follow-up evaluation at 12 months.
The comparison between the baseline characteristics of the 207 individuals who abandoned the study and those who completed it is shown in Table A1. No differences were found between the groups in the analysis of the stage of dietary habit change in the baseline visit, with most of the sample being ready (IG: 52.5%; CG: 52.1%) or at the right moment for change (IG: 42.8%; CG: 44.3%).
In the baseline visit, the FFQ questionnaire was completed and returned by 293 (92.1%) participants of IG and 308 (92.7%) of CG, excluding 49 participants for the causes mentioned in Figure 1. In the visit at 3 months, 236 and 232 questionnaires were collected in IG and CG, respectively, and, in the visit at 12 months, 190 and 197 questionnaires were collected in IG and CG, respectively.

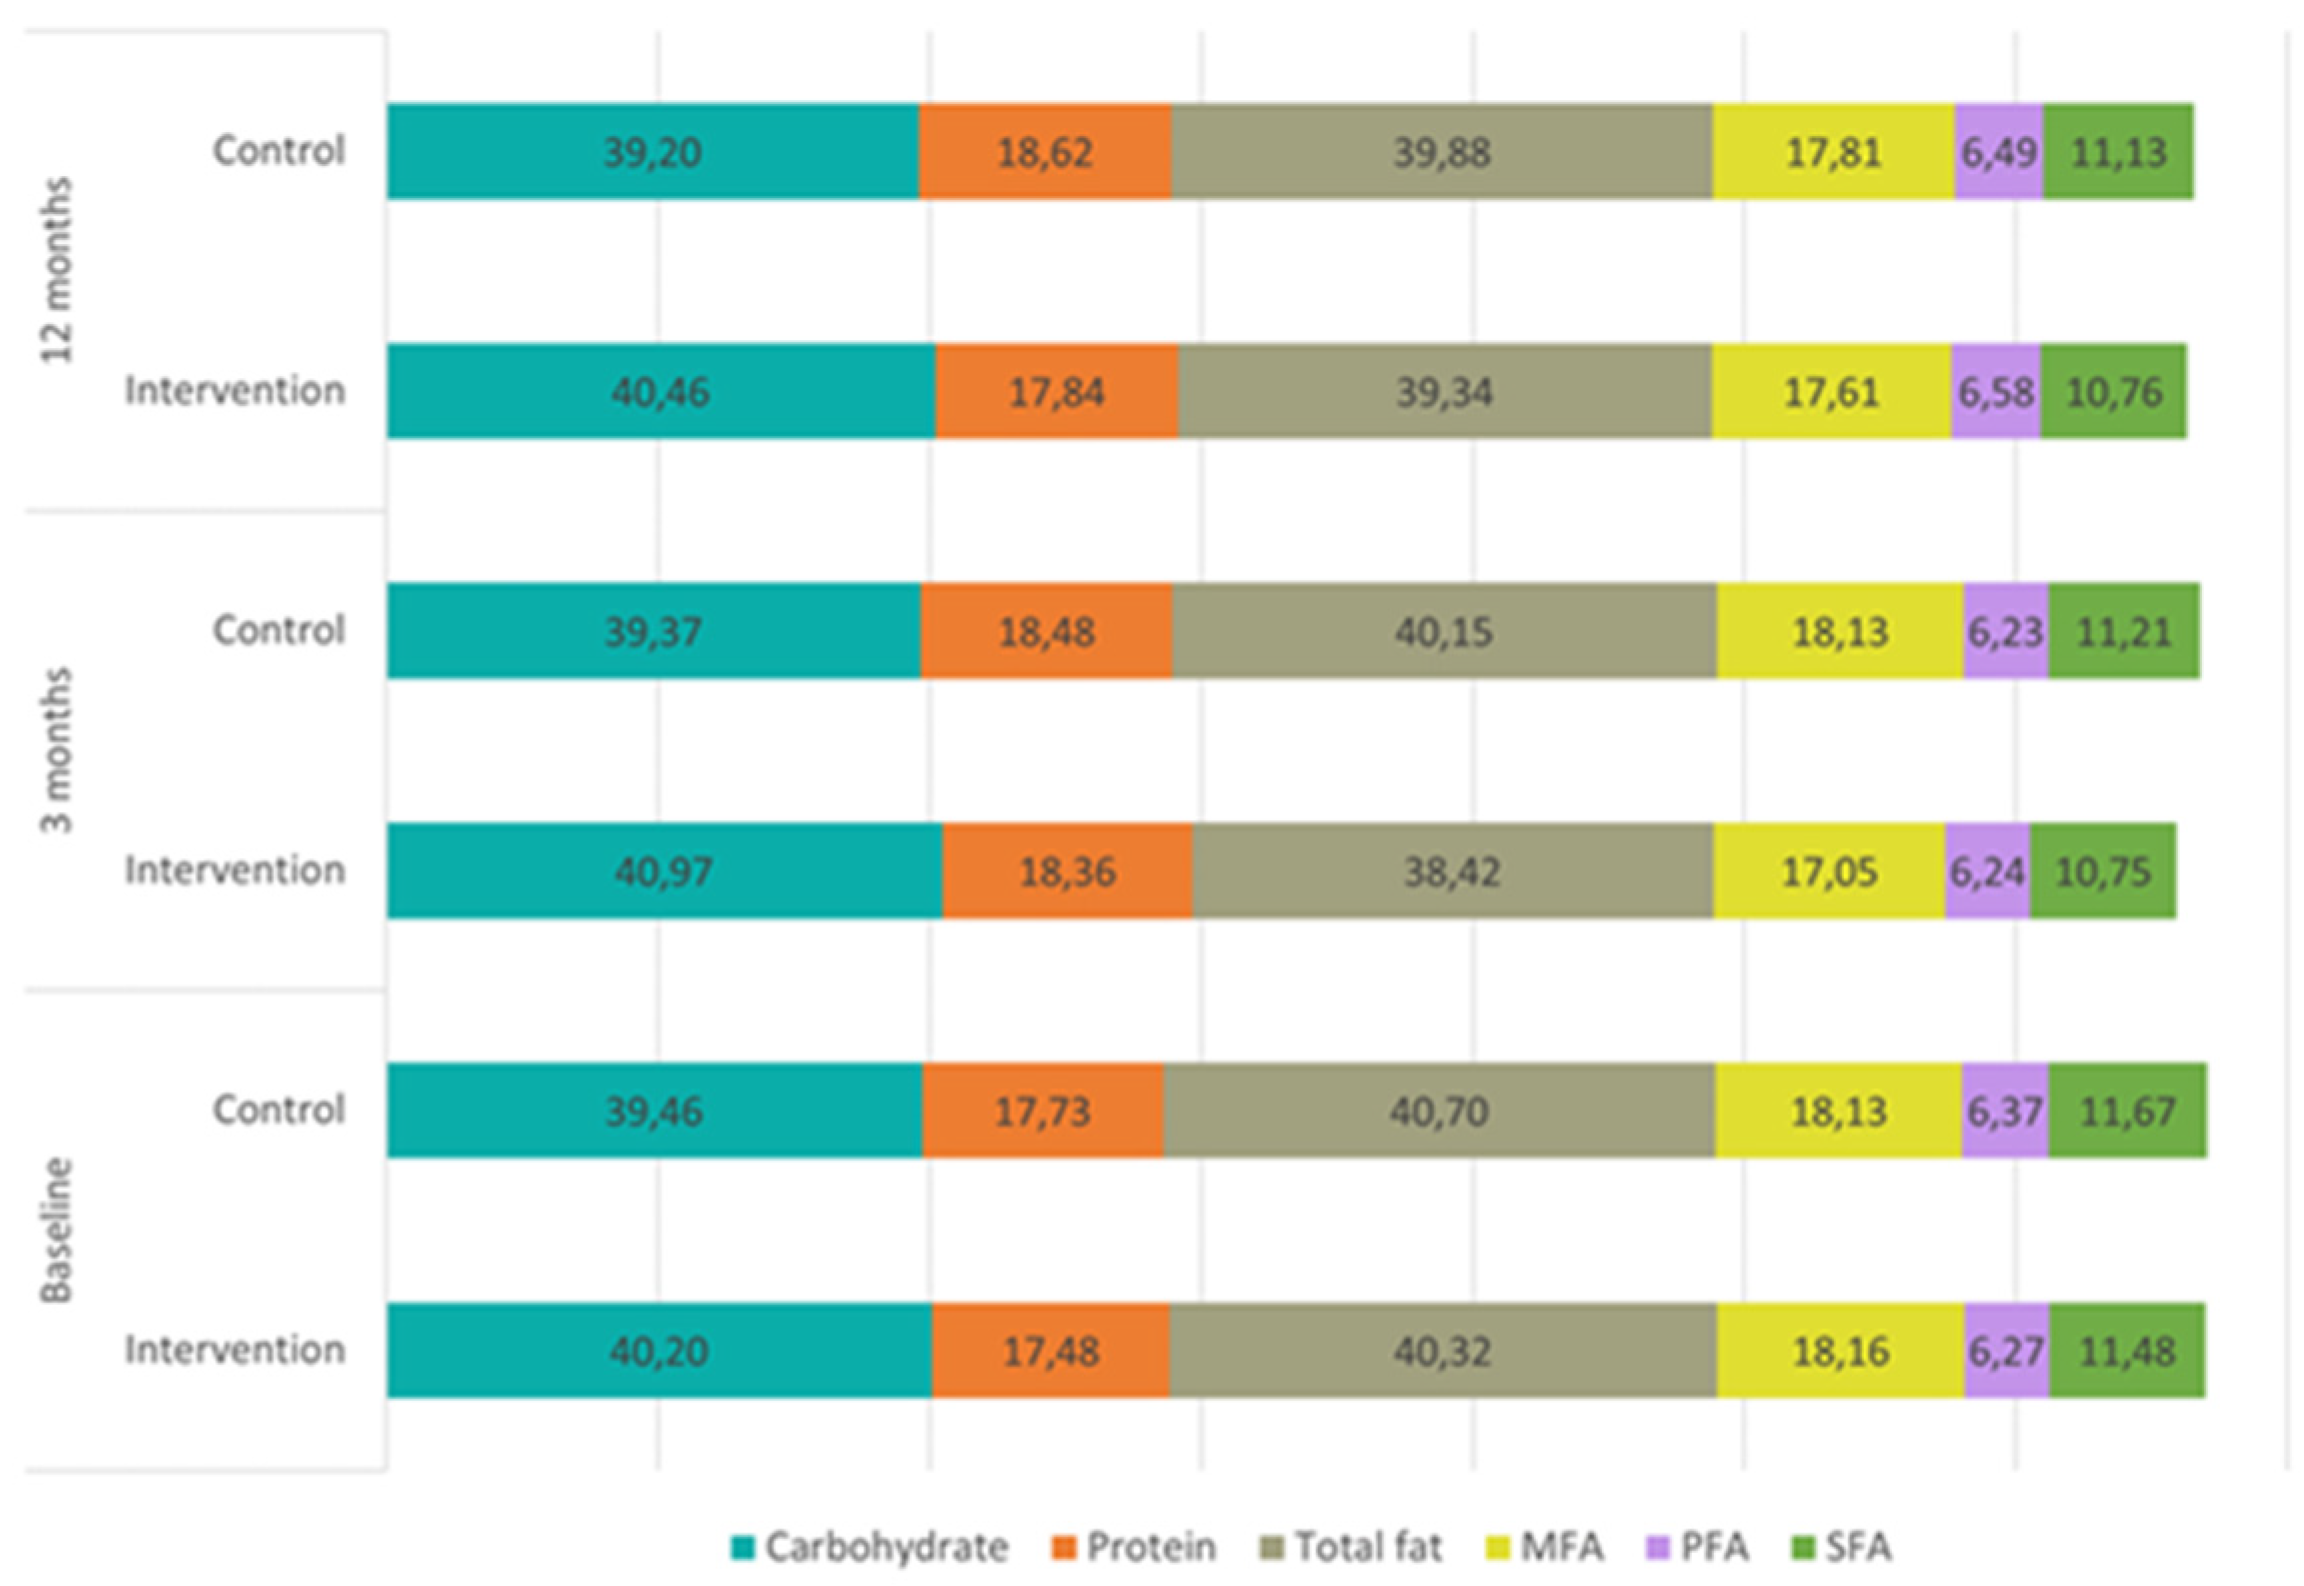
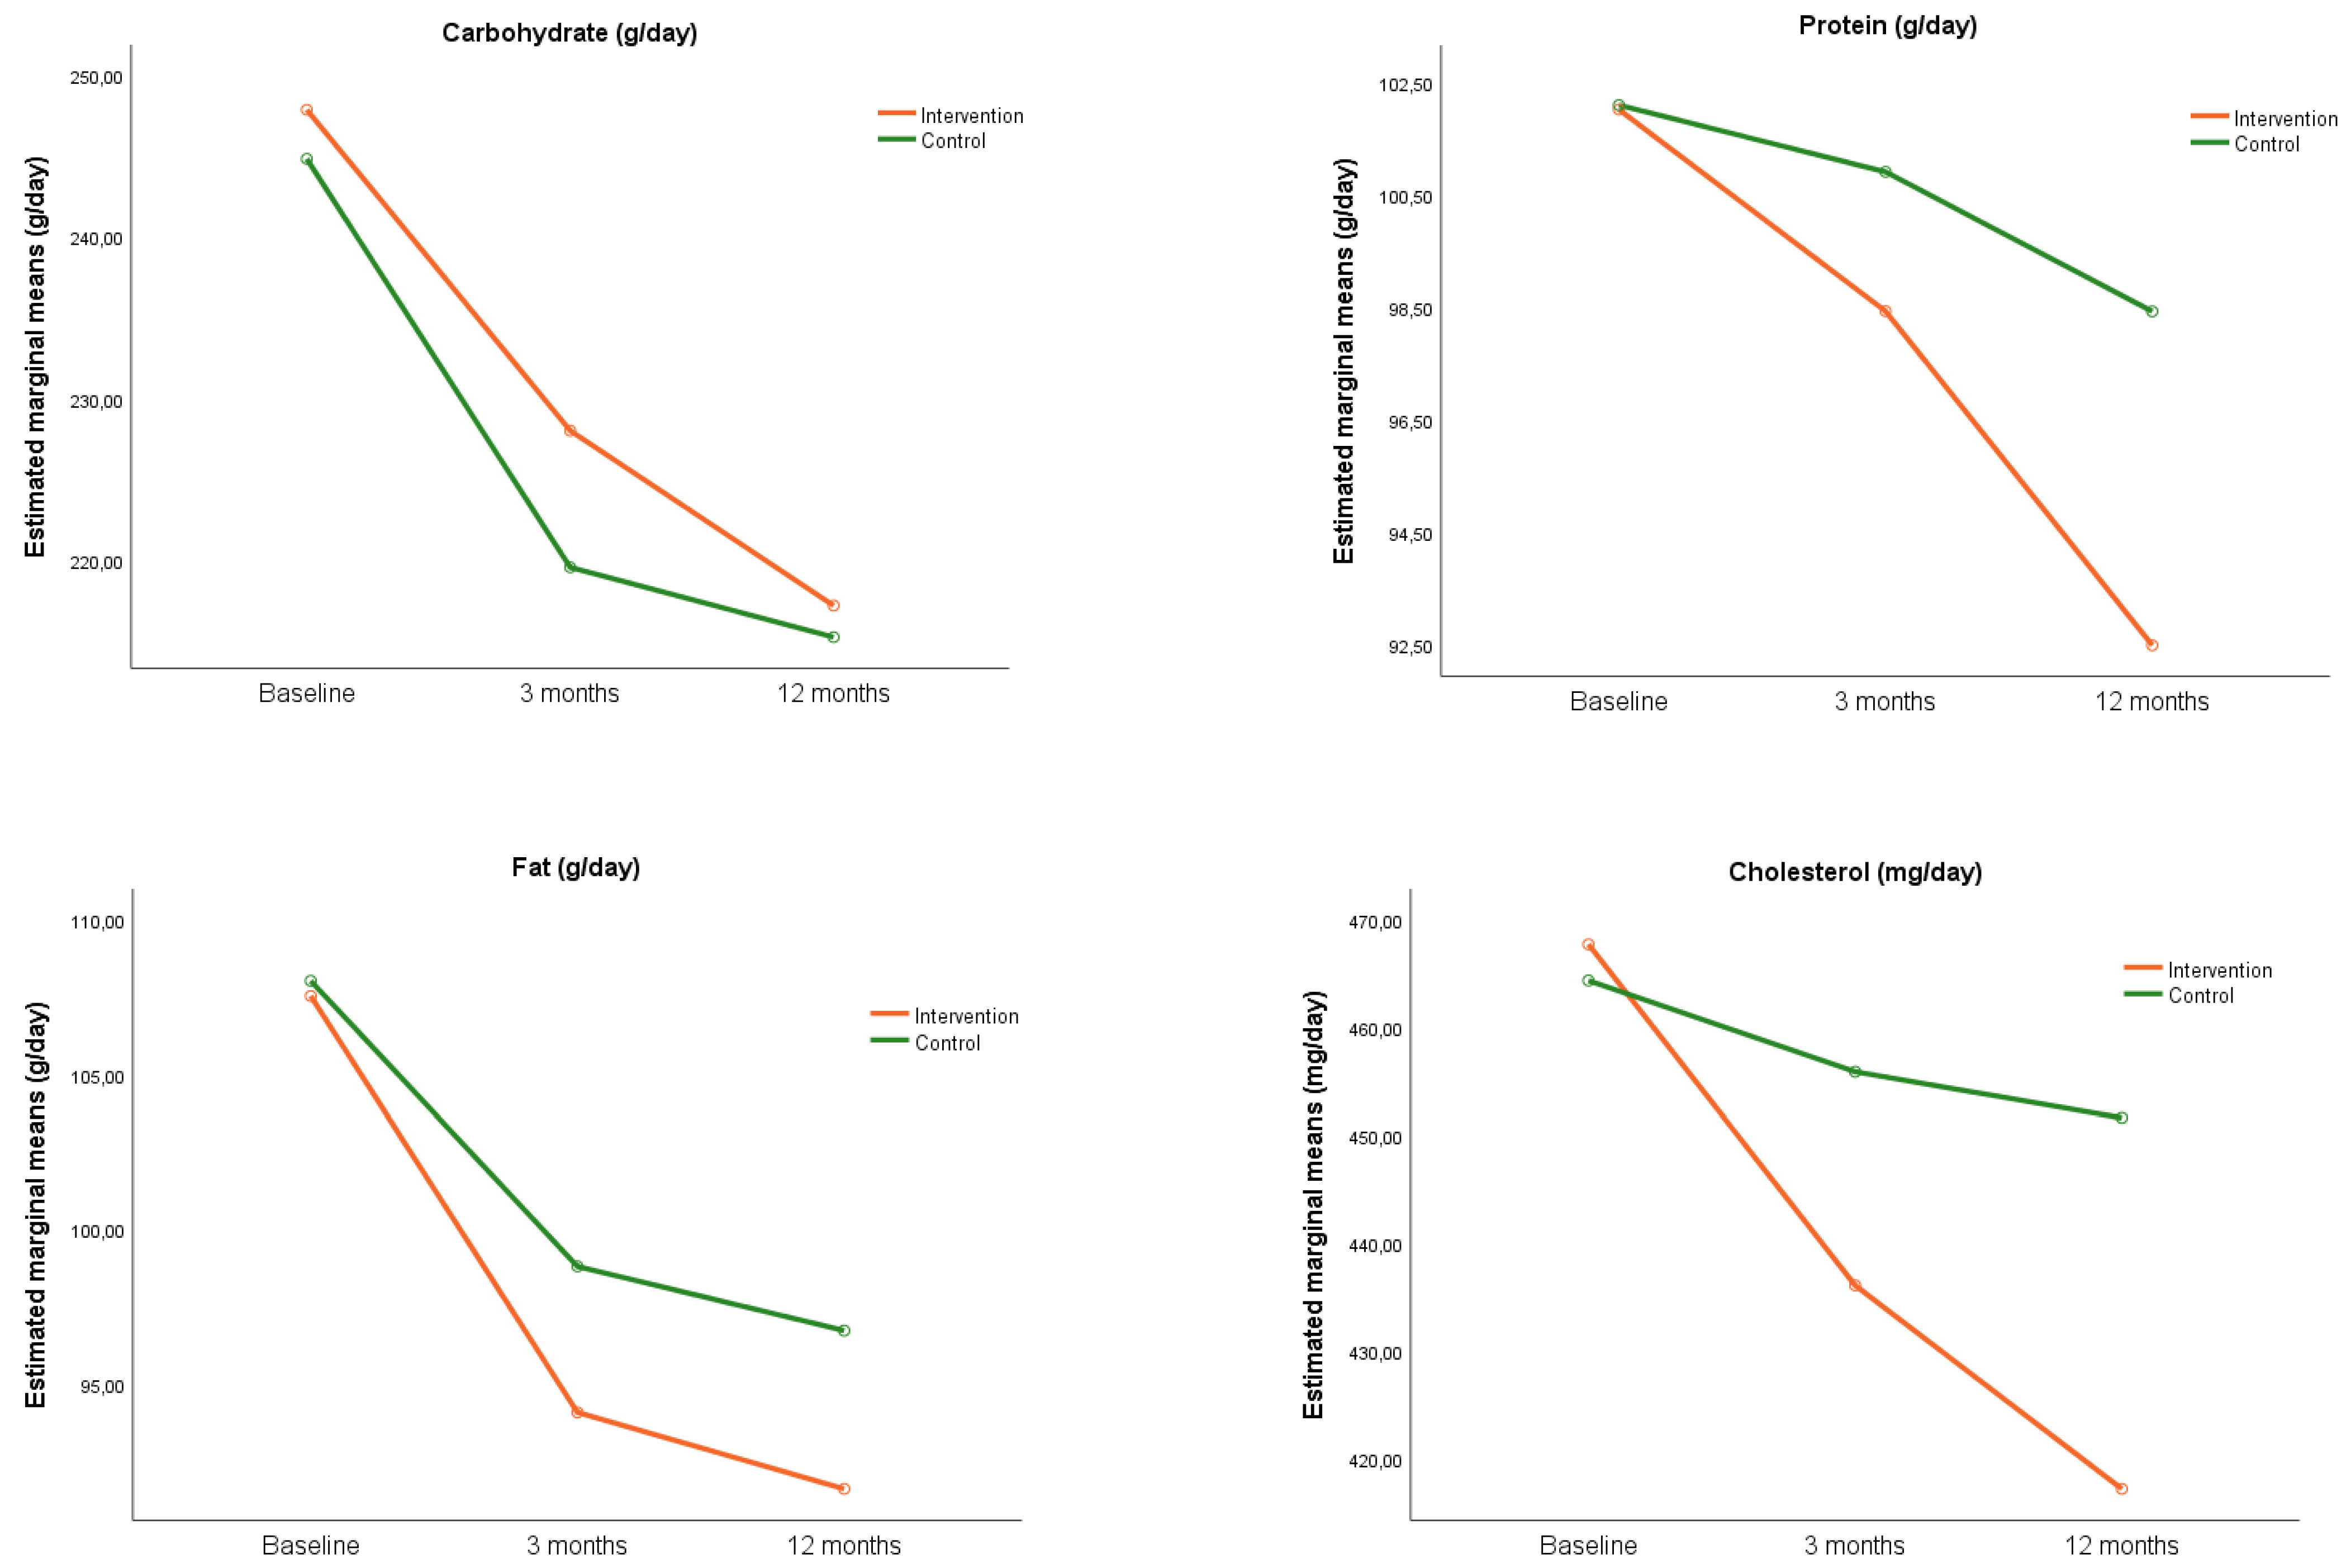
3.2. Changes in Macronutrients Intake

The dietary composition of the two groups throughout the study is represented in Figure 3, showing no differences between them. In the visit at 3 months, IG reduced the intake of carbohydrates (−18.3; 95% CI −29.4, −7.3), proteins (−3.3; 95% CI −6.3, −0.3), total fat (−13.4; 95% CI −17.4, −9.4), and all fatty acids and cholesterol (Table 2), and increased the dietary fiber (1.1; 95% CI 0.1, 2.0). In the visit at 12 months, this decrease in macronutrients was maintained, whereas the increase in the intake of fiber was not.
On the other hand, CG showed similar results at 12 months, with reductions in the three main macronutrients: carbohydrates (−27.2; 95% CI −38.5, −15.9), proteins (−3.9; 95% CI −7.4, −0.5) and total fat (−10.4; 95% CI −15.2, −5.7). However, this group did not show changes in the intake of fiber in the follow-up visits.
Figure 4 shows the evolution of the intake of the main macronutrients and cholesterol for each group during the study. The analysis of the effect of the intervention on macronutrients intake (Table 3), found no differences between groups at 3 and 12 months except for cholesterol intake, where a decrease in IG was found compared to CG (−30.8; 95% CI: −59.9, −1.7) at 12 months.

3.3. Changes in Daily Intake of Food Groups

Table 4 shows the changes obtained in the visits of the study for both groups. In the visit at 3 months, IG reduced the intake of olive oil, full-fat dairy products, biscuits, sweets, industrial pastries, sodium and sugar, and increased the intake of wholemeal bread. On the other hand, CG reduced the intake of biscuits, sweets, industrial pastries, sodium and sugar, and increased the intake of vegetables, fruit, legumes and white meat. Therefore, improvements were obtained in the diet of both groups.
In the visit at 12 months, both groups increased the intake of vegetables (IG: 24.8; 95% CI 7.9, 41.7 and CG: 25.4; 95% CI 8.7, 42.1) and fruit (IG: 34.3; 95% CI 12.4, 56.1 and CG: 37.9; 95% CI 16.0, 59.8). The two groups also reduced the intake of dairy products, red meat, biscuits, sweets, industrial pastries, sodium and sugar. In addition to these changes, IG increased the dairy grams of nuts (2.4; 95% CI 0.01, 4.8) and wholemeal bread (7.2; 95% CI 0.3, 14.0), and reduced the intake of sugary drinks (−12.1; 95% CI −20.6, −3.6). Table 5 shows the effect of the intervention on the different food groups, obtaining an increase in IG with respect to CG for wholemeal bread (14.7; 95% CI 6.4, 23.0) and whole-grain cereals (15.7; 95% CI 7.3, 24.1) at 3 months, and for full-fat dairy products (−23.3; 95% CI −42.8, −3.8), wholemeal bread (3.3; 95% CI −6.7, 13.3) and whole-grain cereals (3.4; 95% CI −6.8, 13.7) at 12 months.

4. Discussion

The intervention of the EVIDENT 3 study, consisting of a mobile application for the recording of the diet and an activity tracker wristband, in combination with a brief advice, obtained relevant changes in the habitual dietary composition, measured through the self-administered FFQ questionnaire. Specifically, there was a decrease in the intake of cholesterol and full-fat dairy products, and an increase in the intake of wholemeal bread and whole-grain cereals in IG with respect to CG at 12 months. Moreover, both groups decreased the total intake of calories and essential nutrients, and increased the consumption of vegetables and fruit. Additionally, the reduction in the grams per day of confectionery, industrial pastries, sodium and sugar in both groups at the follow-up visits should be noted, although no differences were found between groups.
The use of digital tools, such as apps containing self-recording strategies, have proved to be beneficial for the change towards healthier behaviors [41], allowing the user to obtain greater knowledge about his/her diet. A recent systematic review has shown that the applications that include a self-record of diet have great potential to improve the intake of fruit and vegetables, with consequent benefits for health [42]. Moreover, they seem to have greater acceptance among users than the traditional self-recording methods [41,43]. In fact, these strategies have been used in previous studies for the modification of the quality of life, increasing the intake of healthier food groups, such as the VegEze app, which promoted the intake of vegetables and obtained an increase in a daily half ration of vegetables [44], and the Vegethon app [45], which obtained an increase in a ration of vegetables measured with the 24-h diet recorder. Despite the fact that the intervention of our study did not have an effect on the intake of fruit and vegetables, it is worth highlighting that neither the recommendation nor the self-record are exclusively focused on these food groups, which is the case of the above-mentioned apps.
The effectiveness of this type of intervention on diet modification was also evaluated with the EVIDENT 2 app, obtaining a decrease in the intake of red meats and a change in the intake of macronutrients [39]. However, this was evaluated in the general population, with a lower proportion of people with obesity, thus the motivation of the participants to adopt healthier habits may have influenced the fact that changes were observed in more food groups.
The results obtained in the EVIDENT 3 study are in line with those obtained with the Mynutricart app [46], which reduced, in IG, the daily ration of refined flour (IG: −1.18, p = 0.01) legumes (IG: −0.16, p = 0.02) and snacks (IG: −0.78, p = 0.03), among others, showing no differences at 8 weeks with respect to CG. Nevertheless, the aim of this app is to facilitate a list of foods for the purchase of healthier options and provide results in the short-term. Therefore, the results of the EVIDENT3 study can provide evidence on the long-term effect of these interventions, reducing the intake of full-fat dairy products and increasing the intake of wholemeal bread and whole-grain cereals at 12 months. On the other hand, no differences were observed in dietary fiber, which could be due to the increase in the intake of fiber recorded in CG from other sources, such as fruit and vegetables. Despite this, an increase in the intake of these food groups allows obtaining a better lipid profile in the medium-long term, decreasing the cardiovascular risk [47,48]. Both wholemeal bread and whole-grain cereals are more nutritional and satiating, and they could also reduce postprandial glucose and increase insulin sensitivity [49,50]; these are also related to a lower risk of gaining weight [51], which can thereby reduce the risk of developing chronic diseases in the long term.
Similarly, this intervention obtained a decrease in the intake of cholesterol, which is in line with other studies, such as the SMART study [52], which gave a brief advice to the entire sample and a digital self-recording intervention with personalized advices, finding nutritional improvements in the two groups. This intervention obtained, in IG, a decrease in the intake of total calories (IG: −23.4% vs. CG: −14.1%, p = 0.03) and saturated fat (IG: −9.3% vs. CG: 3.4%, p = 0.04) at 24 months, and in the intake of total fat (IG: −10.4% vs. CG: −4.7%, p =0.09) at 6 months, although the latter was not significant. This decrease in the intake of cholesterol could be mainly due to a lower consumption of red meat and full-fat dairy products, since the intake of these was reduced in both groups at 12 months. The reduced intake of cholesterol can improve the levels of plasma cholesterol and reduce the cardiovascular risk in the long term [53].
The results show an improvement in the composition of diet in both groups, reducing carbohydrates and fats, with slight differences between the groups due to several factors. The individuals with overweight and obesity who participated in the study were motivated to change, with most of the sample being ready or at the right moment to modify their diet. This may have led CG, who received a brief advice about eating and exercise, to modify their lifestyles towards healthier ones, obtaining similar results at 12 months with respect to IG. It is also worth highlighting that the brief advice given in this study had been previously evaluated [54], proving effective to obtain changes in the main variables of the study, and showing that it may produce differences not in the food groups included in the advice (vegetables, carbohydrates, proteins and fruit) but in those in which the app gave a personalized advice (fat-free dairy products, wholemeal bread and whole-grain cereals). Moreover, there was no additional contact or reinforcement of the advice on healthy habits to the participants in the follow-up visits; therefore, all this could indicate that the brief advice is effective to attain changes in the diet, and that the app could be a support tool that improves the profile of more specific food groups. It is also possible that the intervention time, i.e., 3 months, may have not been enough to generate longer lasting changes in the IG participants; thus, terminating the use of the app caused a progressive loss of the effect of the intervention. In this line, a systematic review has suggested that the effect of eHealth interventions to improve the diet is greater if the intervention time is 4-6 months [55], thus future studies should evaluate the effect of longer interventions on the modification of such variables.

Limitations

Due to the inclusion of healthy adults with a certain BMI range, the results may not be generalized to other BMI ranges. Despite the fact that the participants were asked not to use any other application or device that could interfere with the study, it cannot be guaranteed that they followed our request. The intervention time (3 months) may have not been enough to identify greater benefits in the composition of the diet. The evaluation of the diet was conducted through a self-informed questionnaire; therefore, there may have been social approval bias, increasing the frequency of healthy foods in the follow-up visits [56]. Moreover, the lack of knowledge of the standard ration of certain foods, such as vegetables (200 g), in the baseline visit may have led to an overestimation of the initial intake, thereby obtaining more accurate information in the follow-up visits after the intervention and the nutritional advice. Future studies should consider the use of more objective measures to obtain more precise results. Lastly, the rate of participants who left the study (31.8%) may have produced biases in the final composition of the sample. However, the randomization of the study group and the fact that similar abandonment rates were obtained in both groups enabled their comparison [57].

5. Conclusions

The brief advice given to all participants obtained positive changes both in the macronutrients and in the intake of certain food groups in the sample. Furthermore, the intervention group reduced the intake of cholesterol and full-fat dairy products, while increasing the intake of wholemeal bread and whole-grain cereals. Therefore, the standardized brief advice is useful to promote changes in the diet, and the EVIDENT 3 app can be a support tool to obtain additional changes in some relevant foods, such as integral foods, and in the intake of cholesterol. Further research is necessary to evaluate the effect of this type of intervention on the modification of the diet towards healthier nutritional habits, both in populations with chronic diseases and in general populations, as well as their maintenance in the long-term.

Author Contributions

Conceptualization L.G.-O. and J.I.R.-R.; Methodology L.G.-O., J.I.R.-R. and E.R.-S.; Formal analysis L.G.-O.; Investigation C.L.-S., J.I.R.-R., M.M.-S., A.S.-L., M.A.S.-C., J.I.R.-M., L.G.-S.; Data curation C.L.-S., L.G.-O.; Writing—Original draft preparation C.L.-S.; Writing—Review and editing L.G.-O., E.R.-S.; Supervision L.G.-O.; Project administration C.L.-S.; Funding Acquisition L.G.-O. All authors have read and agreed to the published version of the manuscript.

Funding

This study was funded by the Spanish Ministry of Science and Innovation, Instituto de Salud Carlos III and co-funded by European Union (ERDF/ESF, “Investing in your future”) (RD21/0016/0010, RD21/0016/0005, RD21/0016/0025, RD21/0016/0009) and (PI16/00101, PI16/00952, PI16/00765, PI16/00659, PI16/00421, PI16/00170, FI17/00040). Gerencia Regional de Salud de Castilla y Leon (GRS 1277/B/16, GRS 1580/B/17) also collaborated in the funding of this study. They played no role in the study design, data analysis, reporting results or the decision to submit the manuscript for publication.

Institutional Review Board Statement

The study was conducted according to the guidelines of the Declaration of Helsinki, and approved by the Clinical Research Ethics Committee of the Health Area of Salamanca in April 2016 (Approval Code: 2016-04-P1600170; Approval Date: 25 April 2016). Informed consent was obtained from all subjects involved in the study.

Informed Consent Statement

Informed consent was obtained from all subjects involved in the study.

Data Availability Statement

The datasets used and/or analyzed during the current study are available from the corresponding author on reasonable request.

Acknowledgments

The EVIDENT 3 Investigators Group comprised the following: Unidad de Investigación de Atención Primaria de Salamanca (APISAL): Luis García-Ortiz (PI), José I Recio-Rodríguez, Cristina Lugones-Sánchez, Manuel A. Gómez-Marcos, Emiliano Rodríguez-Sánchez, Olaya Tamayo-Morales, Rosario Alonso-Domínguez, Natalia Sánchez-Aguadero, Susana González-Sánchez, Ángela de Cabo-Laso, Carmela Rodríguez-Martín, Carmen Castaño-Sánchez, Benigna Sánchez-Salgado, Jesus González-Sánchez, María C. Patino-Alonso, José A. Maderuelo-Fernández, Leticia Gómez-Sánchez, Inés Llamas-Ramos. Centro de Salud Torreramona de Zaragoza (Health Service of Aragón): Natividad González-Viejo, José Félix Magdalena-Belio, Luis Otegui-Ilarduya, Francisco J. Rubio-Galán, Cristina I. Sauras-Yera, Amor Melguizo-Bejar, María J. Gil-Train, Marta Iribarne-Ferrer, Olga Magdalena-González, Miguel A. Lafuente-Ripollés, M Mar Martínez, Pilar Jiménez-Marcén. Centro de Salud Cuenca I (Health Service of Castilla-La Mancha): Fernando Salcedo-Aguilar, Fructuoso Muelas-Herraiz, María A. Molina-Morate, Amparo Pérez-Parra, Fernando Madero, Ángel García-Imbroda, José M. Izquierdo, María L. Monterde, Universidad de Castilla-La Mancha (University of Castilla-La Mancha): Vicente Rodríguez-Vizcaino, Alba Soriano-Cano, Diana Patricia Pozuelo-Carrascosa, Esther Gálvez-Adalia, Alicia del Saz-Lara, Ana Díez-Fernandez, Montserrat Solera-Martínez. Centro de Salud Sta Ponça de Palma de Mallorca (Health Service of Balear Islands): José I. Ramírez-Manent, José L. Ferrer-Perelló, José E. Romero-Palmer, Manuel Sarmiento-Cruz, Guillermo Artigues, Jitka Mudrychova, María Albaladejo-Blanco, Margarita I. Moyá-Seguí, Cristina Vidal-Ribas, Patricia Lorente-Montalvo, Isabel Torrens-Darder, María M. Torrens-Darder, Lucía Pascual Calleja. Centro de Salud San Pablo de Valladolid (Health Service of Castilla y León): María J. Álvarez-Miguel, María D. de Arriba-Gómez, María A Rodríguez-Fernández, Isabel Arranz-Hernando, Silvia Ramos-de la Torre, Amparo Arqueaga-Luengo, María E. Moreno-Moreno, Agustina Marcos-García, Nora Manrique-Vinagre, Nieves Palomo-Blázquez, José L. Montalvillo-Montalvillo, María E. Fernández-Rodríguez, Alejandro González-Moro, Marta Santiago-Pastor, María I Pérez-Concejo, Aurora Rubio-Fernández. Centro de Salud Casa del Barco de Valladolid (Health Service of Castilla y León): Amparo Gómez-Arranz, Carmen Fernández-Alonso, Daniel Rodríguez-Domínguez, Irene Repiso-Gento, Aventina de la Cal-de la Fuente, Rosa Aragón-García, Miguel A. Díez-García, Elisa Ibañes-Jalón, Inés Castrillo-Sanz, Ana M. Corcho-Castaño, Esther Jiménez-López, Daniel Correa-González, Lucía Barruso-Villafaina, Isabel Peña-García, Dolores Escudero-Terrón, Pilar Mena-Martín, Rosario Fraile-Gómez, Alberto Alonso-Gómez, Pilar Urueña, Francisca Martínez-Bermejo, Concepción Hernández-San José, Manuela Nuñez-Gómez, Patricia Sanz-Capdepont, Ana I Pazos-Revuelta, Sofía Pérez-Niño, María E. Junquera-del Pozo. CGB Computer Company, Salamanca, Spain, contributed to the technical development of EVIDENT 3 application.

Conflicts of Interest

The authors declare that they have no competing interest.

Appendix A

Table A1. Baseline characteristics comparison between participants who completed the study and those who dropped out.
Complete (n = 443)Loss of Follow-Up (n = 207)p Value
Mean ± SDMean ± SD
Age, years (SD) 49.2 ± 9.446.3 ± 9.9<0.001
Sex, n (%)Men140 (31.6)65 (31.4)0.959
Women303 (68.4)142 (68.6)
Smoker status, n (%)Non-smoker181 (40.9)82 (39.6)0.403
Current smoker91 (20.5)52 (25.1)
Former smoker171 (38.6)73 (35.3)
Civil status, n (%)Single94 (21.2)40 (19.3)0.111
Married299 (67.5)145 (70.1)
Separated39 (8.8)22 (10.6)
Widower11 (2.5)0 (0.0)
BMI (kg/m2) 32.7 ± 3.433.6 ± 3.60.003
SBP (mmHg) 119.6 ± 15.9119.9 ± 14.70.851
DBP (mmHg) 80.4 ± 9.879.5 ± 9.70.265
Total Cholesterol (mg/dL) 200.0 ± 39.1199.4 ± 34.70.835
HDL Cholesterol (mg/dL) 51.6 ± 12.651.3 ± 12.00.732
Hypertension, n (%) 144 (32.5)60 (29.1)0.414
Dyslipidaemia, n (%) 122 (27.5)38 (19.3)0.029
Diabetes Mellitus, n (%) 5 (1.2)4 (2.2)0.465
BMI: Body Mass Index; SBP: Systolic Blood Pressure; DBP: Diastolic Blood Pressure.

References

  1. De Deus Mendonça, R.; Pimenta, A.M.; Gea, A.; de la Fuente-Arrillaga, C.; Martinez-Gonzalez, M.A.; Lopes, A.C.S.; Bes-Rastrollo, M. Ultraprocessed Food Consumption and Risk of Overweight and Obesity: The University of Navarra Follow-Up (SUN) Cohort Study. Am. J. Clin. Nutr. 2016, 104, 1433–1440. [Google Scholar] [CrossRef] [PubMed]
  2. Monteiro, C.A.; Moubarac, J.-C.; Levy, R.B.; Canella, D.S.; da Costa Louzada, M.L.; Cannon, G. Household Availability of Ultra-Processed Foods and Obesity in Nineteen European Countries. Public Health Nutr. 2018, 21, 18–26. [Google Scholar] [CrossRef] [Green Version]
  3. Aljuraiban, G.S.; Gibson, R.; Oude Griep, L.M.; Okuda, N.; Steffen, L.M.; Van Horn, L.; Chan, Q. Perspective: The Application of A Priori Diet Quality Scores to Cardiovascular Disease Risk—A Critical Evaluation of Current Scoring Systems. Adv. Nutr. 2020, 11, 10–24. [Google Scholar] [CrossRef]
  4. Asghari, G.; Mirmiran, P.; Yuzbashian, E.; Azizi, F. A Systematic Review of Diet Quality Indices in Relation to Obesity. Br. J. Nutr. 2017, 117, 1055–1065. [Google Scholar] [CrossRef] [PubMed] [Green Version]
  5. Nicklas, T.A.; O’Neil, C.E.; Fulgoni, V.L., III. Diet Quality Is Inversely Related to Cardiovascular Risk Factors in Adults. J. Nutr. 2012, 142, 2112–2118. [Google Scholar] [CrossRef]
  6. Morze, J.; Danielewicz, A.; Hoffmann, G.; Schwingshackl, L. Diet Quality as Assessed by the Healthy Eating Index, Alternate Healthy Eating Index, Dietary Approaches to Stop Hypertension Score, and Health Outcomes: A Second Update of a Systematic Review and Meta-Analysis of Cohort Studies. J. Acad. Nutr. Diet. 2020, 120, 1998–2031.e15. [Google Scholar] [CrossRef]
  7. Nouri, F.; Sadeghi, M.; Mohammadifard, N.; Roohafza, H.; Feizi, A.; Sarrafzadegan, N. Longitudinal Association between an Overall Diet Quality Index and Latent Profiles of Cardiovascular Risk Factors: Results from a Population Based 13-Year Follow up Cohort Study. Nutr. Metab. 2021, 18, 28. [Google Scholar] [CrossRef] [PubMed]
  8. Jannasch, F.; Kröger, J.; Schulze, M.B. Dietary Patterns and Type 2 Diabetes: A Systematic Literature Review and Meta-Analysis of Prospective Studies. J. Nutr. 2017, 147, 1174–1182. [Google Scholar] [CrossRef] [Green Version]
  9. George, S.M.; Ballard-Barbash, R.; Manson, J.E.; Reedy, J.; Shikany, J.M.; Subar, A.F.; Tinker, L.F.; Vitolins, M.; Neuhouser, M.L. Comparing Indices of Diet Quality With Chronic Disease Mortality Risk in Postmenopausal Women in the Women’s Health Initiative Observational Study: Evidence to Inform National Dietary Guidance. Am. J. Epidemiol. 2014, 180, 616–625. [Google Scholar] [CrossRef] [Green Version]
  10. Reedy, J.; Krebs-Smith, S.M.; Miller, P.E.; Liese, A.D.; Kahle, L.L.; Park, Y.; Subar, A.F. Higher Diet Quality Is Associated with Decreased Risk of All-Cause, Cardiovascular Disease, and Cancer Mortality among Older Adults. J. Nutr. 2014, 144, 881–889. [Google Scholar] [CrossRef] [Green Version]
  11. Afshin, A.; Sur, P.J.; Fay, K.A.; Cornaby, L.; Ferrara, G.; Salama, J.S.; Mullany, E.C.; Abate, K.H.; Abbafati, C.; Abebe, Z.; et al. Health Effects of Dietary Risks in 195 Countries, 1990–2017: A Systematic Analysis for the Global Burden of Disease Study 2017. Lancet 2019, 393, 1958–1972. [Google Scholar] [CrossRef] [Green Version]
  12. Fernandes, A.C.; Rieger, D.K.; Proença, R.P.C. Perspective: Public Health Nutrition Policies Should Focus on Healthy Eating, Not on Calorie Counting, Even to Decrease Obesity. Adv. Nutr. 2019, 10, 549–556. [Google Scholar] [CrossRef] [PubMed]
  13. Chawla, S.; Tessarolo Silva, F.; Amaral Medeiros, S.; Mekary, R.A.; Radenkovic, D. The Effect of Low-Fat and Low-Carbohydrate Diets on Weight Loss and Lipid Levels: A Systematic Review and Meta-Analysis. Nutrients 2020, 12, 3774. [Google Scholar] [CrossRef]
  14. Mehrabani, H.H.; Salehpour, S.; Amiri, Z.; Farahani, S.J.; Meyer, B.J.; Tahbaz, F. Beneficial Effects of a High-Protein, Low-Glycemic-Load Hypocaloric Diet in Overweight and Obese Women with Polycystic Ovary Syndrome: A Randomized Controlled Intervention Study. J. Am. Coll. Nutr. 2012, 31, 117–125. [Google Scholar] [CrossRef] [PubMed] [Green Version]
  15. Stern, L.; Iqbal, N.; Seshadri, P.; Chicano, K.L.; Daily, D.A.; McGrory, J.; Williams, M.; Gracely, E.J.; Samaha, F.F. The Effects of Low-Carbohydrate versus Conventional Weight Loss Diets in Severely Obese Adults: One-Year Follow-up of a Randomized Trial. Ann. Intern. Med. 2004, 140, 778–785. [Google Scholar] [CrossRef] [PubMed] [Green Version]
  16. Saslow, L.R.; Daubenmier, J.J.; Moskowitz, J.T.; Kim, S.; Murphy, E.J.; Phinney, S.D.; Ploutz-Snyder, R.; Goldman, V.; Cox, R.M.; Mason, A.E.; et al. Twelve-Month Outcomes of a Randomized Trial of a Moderate-Carbohydrate versus Very Low-Carbohydrate Diet in Overweight Adults with Type 2 Diabetes Mellitus or Prediabetes. Nutr. Diabetes 2017, 7, 304. [Google Scholar] [CrossRef]
  17. Shai, I.; Schwarzfuchs, D.; Henkin, Y.; Shahar, D.R.; Witkow, S.; Greenberg, I.; Golan, R.; Fraser, D.; Bolotin, A.; Vardi, H.; et al. Weight Loss with a Low-Carbohydrate, Mediterranean, or Low-Fat Diet. N. Engl. J. Med. 2008, 359, 229–241. [Google Scholar] [CrossRef] [PubMed] [Green Version]
  18. Brouns, F. Overweight and Diabetes Prevention: Is a Low-Carbohydrate–High-Fat Diet Recommendable? Eur. J. Nutr. 2018, 57, 1301–1312. [Google Scholar] [CrossRef] [PubMed] [Green Version]
  19. Rumbo-Rodríguez, L.; Sánchez-SanSegundo, M.; Ruiz-Robledillo, N.; Albaladejo-Blázquez, N.; Ferrer-Cascales, R.; Zaragoza-Martí, A. Use of Technology-Based Interventions in the Treatment of Patients with Overweight and Obesity: A Systematic Review. Nutrients 2020, 12, 3634. [Google Scholar] [CrossRef]
  20. Phillips, N.E.; Mareschal, J.; Schwab, N.; Manoogian, E.N.C.; Borloz, S.; Ostinelli, G.; Gauthier-Jaques, A.; Umwali, S.; Gonzalez Rodriguez, E.; Aeberli, D.; et al. The Effects of Time-Restricted Eating versus Standard Dietary Advice on Weight, Metabolic Health and the Consumption of Processed Food: A Pragmatic Randomised Controlled Trial in Community-Based Adults. Nutrients 2021, 13, 1042. [Google Scholar] [CrossRef]
  21. Hu, E.A.; Nguyen, V.; Langheier, J.; Shurney, D. Weight Reduction Through a Digital Nutrition and Food Purchasing Platform Among Users With Obesity: Longitudinal Study. J. Med. Internet Res. 2020, 22, e19634. [Google Scholar] [CrossRef] [PubMed]
  22. Dunford, E.; Trevena, H.; Goodsell, C.; Ng, K.H.; Webster, J.; Millis, A.; Goldstein, S.; Hugueniot, O.; Neal, B. FoodSwitch: A Mobile Phone App to Enable Consumers to Make Healthier Food Choices and Crowdsourcing of National Food Composition Data. JMIR mHealth uHealth 2014, 2, e3230. [Google Scholar] [CrossRef]
  23. Block, G.; Azar, K.M.; Romanelli, R.J.; Block, T.J.; Hopkins, D.; Carpenter, H.A.; Dolginsky, M.S.; Hudes, M.L.; Palaniappan, L.P.; Block, C.H. Diabetes Prevention and Weight Loss with a Fully Automated Behavioral Intervention by Email, Web, and Mobile Phone: A Randomized Controlled Trial Among Persons with Prediabetes. J. Med. Internet Res. 2015, 17, e4897. [Google Scholar] [CrossRef]
  24. Haas, K.; Hayoz, S.; Maurer-Wiesner, S. Effectiveness and Feasibility of a Remote Lifestyle Intervention by Dietitians for Overweight and Obese Adults: Pilot Study. JMIR mHealth uHealth 2019, 7, e12289. [Google Scholar] [CrossRef] [PubMed] [Green Version]
  25. McCarroll, R.; Eyles, H.; Ni Mhurchu, C. Effectiveness of Mobile Health (MHealth) Interventions for Promoting Healthy Eating in Adults: A Systematic Review. Prev. Med. 2017, 105, 156–168. [Google Scholar] [CrossRef]
  26. Wallace, T.C.; Bailey, R.L.; Blumberg, J.B.; Burton-Freeman, B.; Chen, C.O.; Crowe-White, K.M.; Drewnowski, A.; Hooshmand, S.; Johnson, E.; Lewis, R.; et al. Fruits, Vegetables, and Health: A Comprehensive Narrative, Umbrella Review of the Science and Recommendations for Enhanced Public Policy to Improve Intake. Crit. Rev. Food Sci. Nutr. 2020, 60, 2174–2211. [Google Scholar] [CrossRef] [PubMed] [Green Version]
  27. Puig-Ribera, A.; Martín-Cantera, C.; Puigdomenech, E.; Real, J.; Romaguera, M.; Magdalena-Belio, J.F.; Recio-Rodríguez, J.I.; Rodriguez-Martin, B.; Arietaleanizbeaskoa, M.S.; Repiso–Gento, I.; et al. Screening Physical Activity in Family Practice: Validity of the Spanish Version of a Brief Physical Activity Questionnaire. PLoS ONE 2015, 10, e0136870. [Google Scholar] [CrossRef]
  28. Recio-Rodriguez, J.I.; Gómez-Marcos, M.A.; Agudo-Conde, C.; Ramirez, I.; Gonzalez-Viejo, N.; Gomez-Arranz, A.; Salcedo-Aguilar, F.; Rodriguez-Sanchez, E.; Alonso-Domínguez, R.; Sánchez-Aguadero, N.; et al. EVIDENT 3 Study: A Randomized, Controlled Clinical Trial to Reduce Inactivity and Caloric Intake in Sedentary and Overweight or Obese People Using a Smartphone Application: Study Protocol. Medicine 2018, 97, e9633. [Google Scholar] [CrossRef]
  29. Raidl, M.; Spain, K.; Hartman-Cunningham, M.; Lanting, R.; Lockard, M.; Johnson, S.; Spencer, M.; Sant, L.; Welch, J.; Liddil, A. The Healthy Diabetes Plate. Prev. Chronic Dis. 2006, 4, A12. [Google Scholar]
  30. RedBedca; AESAN BEDCA. Base de Datos Española de Composición De Alimentos. Available online: https://bedca.net/ (accessed on 2 October 2021).
  31. Burke, L.E.; Wang, J.; Sevick, M.A. Self-Monitoring in Weight Loss: A Systematic Review of the Literature. J. Am. Diet. Assoc. 2011, 111, 92–102. [Google Scholar] [CrossRef] [Green Version]
  32. Schmidt-Kraepelin, M.; Toussaint, P.A.; Thiebes, S.; Hamari, J.; Sunyaev, A. Archetypes of Gamification: Analysis of MHealth Apps. JMIR mHealth uHealth 2020, 8, e19280. [Google Scholar] [CrossRef]
  33. de la Fuente-Arrillaga, C.; Ruiz, Z.V.; Bes-Rastrollo, M.; Sampson, L.; Martinez-González, M.A. Reproducibility of an FFQ Validated in Spain. Public Health Nutr. 2010, 13, 1364–1372. [Google Scholar] [CrossRef]
  34. Prochaska, J.; Velicer, W.F. The Transtheoretical Model of Health Behavior Change. Am. J. Health Promot. 1997, 12, 38–48. [Google Scholar] [CrossRef]
  35. Andrés, A.; Saldaña, C.; Gómez-Benito, J. The Transtheoretical Model in Weight Management: Validation of the Processes of Change Questionnaire. OFA 2011, 4, 433–442. [Google Scholar] [CrossRef] [Green Version]
  36. Mancia, G.; Fagard, R.; Narkiewicz, K.; Redán, J.; Zanchetti, A.; Böhm, M.; Christiaens, T.; Cifkova, R.; De Backer, G.; Dominiczak, A.; et al. 2013 Practice Guidelines for the Management of Arterial Hypertension of the European Society of Hypertension (ESH) and the European Society of Cardiology (ESC): ESH/ESC Task Force for the Management of Arterial Hypertension. J. Hypertens. 2013, 31, 1925–1938. [Google Scholar] [CrossRef] [PubMed] [Green Version]
  37. WHO MONICA Project Principal Investigators The World Health Organization Monica Project (Monitoring Trends and Determinants in Cardiovascular Disease): A Major International Collaboration. J. Clin. Epidemiol. 1988, 41, 105–114. [CrossRef]
  38. World Medical Association World Medical Association Declaration of Helsinki: Ethical Principles for Medical Research Involving Human Subjects. JAMA 2013, 310, 2191–2194. [CrossRef] [Green Version]
  39. Recio-Rodriguez, J.I.; Agudo Conde, C.; Calvo-Aponte, M.J.; Gonzalez-Viejo, N.; Fernandez-Alonso, C.; Mendizabal-Gallastegui, N.; Rodriguez-Martin, B.; Maderuelo-Fernandez, J.A.; Rodriguez-Sanchez, E.; Gomez-Marcos, M.A.; et al. The Effectiveness of a Smartphone Application on Modifying the Intakes of Macro and Micronutrients in Primary Care: A Randomized Controlled Trial. EVIDENT II Study. Nutr. 2018, 10, 1473. [Google Scholar] [CrossRef] [PubMed] [Green Version]
  40. Gupta, S.K. Intention-to-Treat Concept: A Review. Perspect. Clin. Res. 2011, 2, 109. [Google Scholar] [CrossRef] [PubMed]
  41. Burke, L.E.; Styn, M.A.; Sereika, S.M.; Conroy, M.B.; Ye, L.; Glanz, K.; Sevick, M.A.; Ewing, L.J. Using MHealth Technology to Enhance Self-Monitoring for Weight Loss: A Randomized Trial. Am. J. Prev. Med. 2012, 43, 20–26. [Google Scholar] [CrossRef] [Green Version]
  42. Mandracchia, F.; Llauradó, E.; Tarro, L.; del Bas, J.M.; Valls, R.M.; Pedret, A.; Radeva, P.; Arola, L.; Solà, R.; Boqué, N. Potential Use of Mobile Phone Applications for Self-Monitoring and Increasing Daily Fruit and Vegetable Consumption: A Systematized Review. Nutrients 2019, 11, 686. [Google Scholar] [CrossRef] [Green Version]
  43. Burke, L.E.; Conroy, M.B.; Sereika, S.M.; Elci, O.U.; Styn, M.A.; Acharya, S.D.; Sevick, M.A.; Ewing, L.J.; Glanz, K. The Effect of Electronic Self-Monitoring on Weight Loss and Dietary Intake: A Randomized Behavioral Weight Loss Trial. Obesity 2011, 19, 338–344. [Google Scholar] [CrossRef]
  44. Hendrie, G.A.; Hussain, M.S.; Brindal, E.; James-Martin, G.; Williams, G.; Crook, A. Impact of a Mobile Phone App to Increase Vegetable Consumption and Variety in Adults: Large-Scale Community Cohort Study. JMIR mHealth uHealth 2020, 8, e14726. [Google Scholar] [CrossRef]
  45. Mummah, S.; Robinson, T.N.; Mathur, M.; Farzinkhou, S.; Sutton, S.; Gardner, C.D. Effect of a Mobile App Intervention on Vegetable Consumption in Overweight Adults: A Randomized Controlled Trial. Int. J. Behav. Nutr. Phys. Act. 2017, 14, 125. [Google Scholar] [CrossRef] [PubMed] [Green Version]
  46. Palacios, C.; Torres, M.; López, D.; Trak-Fellermeier, M.A.; Coccia, C.; Pérez, C.M. Effectiveness of the Nutritional App “MyNutriCart” on Food Choices Related to Purchase and Dietary Behavior: A Pilot Randomized Controlled Trial. Nutrients 2018, 10, 1967. [Google Scholar] [CrossRef] [Green Version]
  47. Maki, K.C.; Beiseigel, J.M.; Jonnalagadda, S.S.; Gugger, C.K.; Reeves, M.S.; Farmer, M.V.; Kaden, V.N.; Rains, T.M. Whole-Grain Ready-to-Eat Oat Cereal, as Part of a Dietary Program for Weight Loss, Reduces Low-Density Lipoprotein Cholesterol in Adults with Overweight and Obesity More than a Dietary Program Including Low-Fiber Control Foods. J. Am. Diet. Assoc. 2010, 110, 205–214. [Google Scholar] [CrossRef] [PubMed]
  48. Berger, S.; Raman, G.; Vishwanathan, R.; Jacques, P.F.; Johnson, E.J. Dietary Cholesterol and Cardiovascular Disease: A Systematic Review and Meta-Analysis. Am. J. Clin. Nutr. 2015, 102, 276–294. [Google Scholar] [CrossRef] [Green Version]
  49. Diabetes Prevention Program Research Group A High-Carbohydrate, High-Fiber, Low-Fat Diet Results in Weight Loss among Adults at High Risk of Type 2 Diabetes. J. Nutr. 2017, 147, 2060–2066. [CrossRef] [Green Version]
  50. Meyer, K.A.; Kushi, L.H.; Jacobs, D.R., Jr.; Slavin, J.; Sellers, T.A.; Folsom, A.R. Carbohydrates, Dietary Fiber, and Incident Type 2 Diabetes in Older Women. Am. J. Clin. Nutr. 2000, 71, 921–930. [Google Scholar] [CrossRef] [PubMed] [Green Version]
  51. Călinoiu, L.F.; Vodnar, D.C. Whole Grains and Phenolic Acids: A Review on Bioactivity, Functionality, Health Benefits and Bioavailability. Nutrients 2018, 10, 1615. [Google Scholar] [CrossRef] [Green Version]
  52. Ambeba, E.J.; Ye, L.; Sereika, S.M.; Styn, M.A.; Acharya, S.D.; Sevick, M.A.; Ewing, L.J.; Conroy, M.B.; Glanz, K.; Zheng, Y.; et al. The Use of MHealth to Deliver Tailored Messages Reduces Reported Energy and Fat Intake. J. Cardiovasc. Nurs. 2015, 30, 35–43. [Google Scholar] [CrossRef] [PubMed] [Green Version]
  53. Carson, J.A.S.; Lichtenstein, A.H.; Anderson, C.A.M.; Appel, L.J.; Kris-Etherton, P.M.; Meyer, K.A.; Petersen, K.; Polonsky, T.; Van Horn, L. Dietary Cholesterol and Cardiovascular Risk: A Science Advisory From the American Heart Association. Circulation 2020, 141, e39–e53. [Google Scholar] [CrossRef] [PubMed] [Green Version]
  54. Recio-Rodriguez, J.I.; Agudo-Conde, C.; Martin-Cantera, C.; González-Viejo, M.N.; Fernandez-Alonso, M.C.; Arietaleanizbeaskoa, M.S.; Schmolling-Guinovart, Y.; Maderuelo-Fernandez, J.-A.; Rodriguez-Sanchez, E.; Gomez-Marcos, M.A.; et al. Short-Term Effectiveness of a Mobile Phone App for Increasing Physical Activity and Adherence to the Mediterranean Diet in Primary Care: A Randomized Controlled Trial (EVIDENT II Study). J. Med. Internet Res. 2016, 18, e6814. [Google Scholar] [CrossRef] [PubMed]
  55. Robert, C.; Erdt, M.; Lee, J.; Cao, Y.; Naharudin, N.B.; Theng, Y.-L. Effectiveness of EHealth Nutritional Interventions for Middle-Aged and Older Adults: Systematic Review and Meta-Analysis. J. Med. Internet Res. 2021, 23, e15649. [Google Scholar] [CrossRef]
  56. Miller, T.M.; Abdel-Maksoud, M.F.; Crane, L.A.; Marcus, A.C.; Byers, T.E. Effects of Social Approval Bias on Self-Reported Fruit and Vegetable Consumption: A Randomized Controlled Trial. Nutr. J. 2008, 7, 18. [Google Scholar] [CrossRef] [PubMed] [Green Version]
  57. Dumville, J.C.; Torgerson, D.J.; Hewitt, C.E. Reporting Attrition in Randomised Controlled Trials. BMJ 2006, 332, 969–971. [Google Scholar] [CrossRef] [Green Version]
Figure 1. Flowchart of the study. FFQ: Food Frequency Questionnaire.
Nutrients 14 00270 g001
Figure 2. Screenshots of the Evident 3 app.
Nutrients 14 00270 g002
Figure 3. Dietary composition by energy percentage of the main nutrients per visit for each study group. SFA: Saturated Fatty Acids; PFA: Polyunsaturated Fatty Acids; MFA: Monounsaturated Fatty Acids.
Nutrients 14 00270 g003
Figure 4. Evolution of the intake of macronutrients throughout the study.
Nutrients 14 00270 g004
Table 1. Characteristics of study participants at baseline.
Intervention
(n = 318)
Control
(n = 332)
p-Value
Mean ± SDMean ± SD
Age, years 47.7 ± 10.148.9 ± 9.20.130
Sex, n (%)Men104 (32.7)101(30.4)0.555
Women214 (67.3)231 (69.6)
Smoking status, n (%)Non smoker124 (39.0)139 (41.9)0.560
Smoker68 (21.4)75 (22.6)
Former smoker126 (39.6)118 (35.5)
Marital status, n (%)Single60 (18.9)74 (22.3)0.736
Married222 (69.8)222 (66.9)
Divorced31 (9.7)30 (9.0)
Widowed5 (1.6)6 (1.8)
BMI (kg/m2) 33.1 ± 3.433.0 ± 3.60.607
SBP (mmHg) 119 ± 15120 ± 160.402
DBP (mmHg) 79 ± 981 ± 100.091
Heart rate (lpm) 72 ± 1274 ± 120.061
Total Cholesterol (mg/dL) 198 ± 36202 ± 400.230
HDL Cholesterol (mg/dL) 51 ± 1352 ± 120.557
LDL Cholesterol (mg/dL) 122 ± 31125 ± 360.247
Triglycerides (mg/dL) 131 ± 73127 ± 630.513
Glycaemia (mg/dL) 93 ± 1495 ± 210.190
HbA1c (%) 5.4 ± 0.45.5 ± 0.50.058
Hypertension, n (%) 88 (27.7)116 (35.0)0.052
Dyslipidemia, n (%) 73 (23.4)87 (26.5)0.411
Diabetes Mellitus n (%) 5 (1.7)4 (1.3)0.748
Motivation,
state to change, n (%)
Not ready15 (4.7)12 (3.6)0.754
Ready167 (52.5)173 (52.1)
Right moment136 (42.8)147 (44.3)
SD: standard deviation; BMI: body mass index; SBP: Systolic blood pressure; DBP: Diastolic blood pressure; HDL: High-density lipoprotein; LDL: Low-density lipoprotein; HbA1c: Hemoglobin A1c.
Table 2. Changes in macronutrients and energy intake throughout the study.
Intervention Group (n = 293)Control Group (n = 308)
Baseline
Mean (SD)
3 Months
Mean Diff. (95 CI%)
12 Months
Mean Diff. (95 CI%)
Baseline
Mean (SD)
3 Months
Mean Diff. (95 CI%)
12 Months
Mean Diff. (95 CI%)
Carbohydrates (g/day)242.0 (81.9)−18.3 (−29.4 to −7.3) **−31.4 (−43.6 to −19.2) **235.8 (86.9)−22.1 (−32.2 to −12.0) **−27.2 (−38.5 to −15.9) **
Proteins (g/day)102.4 (26.2)−3.3 (−6.3 to −0.3) *−8.8 (−12.4 to −5.1) **102.0 (24.8)−2.6 (−5.9 to 0.7)−3.9 (−7.4 to −0.5) *
Total fat (g/day)107.6 (35.9)−13.4 (−17.4 to −9.4) **−15.2 (−20.3 to −10.0) **106.8 (35.3)−9.4 (−13.6 to −5.3) **−10.4 (−15.2 to −5.7) **
Monounsaturated fatty acids (g/day)48.5 (18.2)−6.6 (−8.7 to −4.5) **−7.0 (−9.7 to −4.2) **47.6 (17.4)−3.9 (−6.0 to −1.8) **−5.0 (−7.3 to −2.7) **
Polyunsaturated fatty acids (g/day)16.8 (6.8)−1.2 (−2.0 to −0.4) **−1.3 (−2.4 to −0.2) *16.8 (7.4)−1.7 (−2.6 to −0.8) **−1.0 (−2.1 to 0.2)
Saturated fatty acids (g/day)30.7 (10.6)−4.5 (−5.6 to −3.3) **−5.6 (−7.0 to −4.2) **30.7 (10.7)−3.3 (−4.5 to −2.0) **−3.7 (−5.1 to −2.3) **
Trans fatty acids (g/day)0.8 (0.4)−0.2 (−0.2 to −0.1) **−0.2 (−0.3 to −0.2) **0.9 (0.5)−0.2 (−0.2 to −0.1) **−0.2 (−0.2 to −0.1) **
Cholesterol (mg/day)475.2 (144.4)−30.7 (−48.5 to −12.8) **−46.1 (−66.7 to −25.5) **462.2 (139.0)−14.6 (−33.0 to 3.8)−15.3 (−36.0 to 5.4)
Dietary fiber (g/day)23.8 (8.3)1.1 (0.1 to 2.0) *0.5 (−0.6 to 1.6)23.0 (8.5)0.4 (−0.5 to 1.3)0.8 (−0.3 to 1.8)
Alcohol (g/day)6.8 (9.0)0.4 (−0.5 to 1.4)0.3 (−0.8 to 1.4)6.9 (10.2)−0.9 (−1.8 to 0.1)−0.6 (−1.6 to 0.3)
Energy (kcal/day)2394.1 (676.4)−204.2 (−285.5 to −122.9) **−295.3 (−391.6 to −198.9) **2360.0 (681.1)−189.8 (−268.9 to −110.7) **−222.9 (−310.6 to −135.1) **
* p < 0.05. ** p < 0.01.
Table 3. Effect of the intervention on the intake of macronutrients at 3 and 12 months.
Mean Difference (IG–CG) 3 Months (95% CI)Mean Difference (IG–CG) 12 Months (95% CI)p for Trend
Carbohydrates (g/day)3.8 (−11.1 to 18.7)−4.2 (−20.8 to 12.4)0.696
Proteins (g/day)−0.7 (−5.1 to 3.7)−4.8 (−9.8 to 0.2)0.071
Total fat (g/day)−4.0 (−9.7 to 1.8)−4.7 (−11.7 to 2.2)0.316
Monounsaturated fatty acids (g/day)−2.7 (−5.7 to 0.2)−1.9 (−5.6 to 1.7)0.208
Polyunsaturated fatty acids (g/day)0.5 (−0.7 to 1.8)−0.3 (−1.9 to 1.3)0.396
Saturated fatty acids (g/day)−1.2 (−2.9 to 0.5)−1.9 (−3.9 to 0.1)0.073
Trans fatty acids (g/day)0.0 (−0.1 to 0.0)0.0 (−0.1 to 0.0)0.253
Cholesterol (mg/day)−16.1 (−41.7 to 9.5)−30.8 (−59.9 to −1.7) *0.043
Dietary fiber (g/day)0.6 (−0.7 to 2.0)−0.2 (−1.8 to 1.3)0.431
Alcohol (g/day)1.3 (−0.1 to 2.7)0.9 (−0.5 to 2.4)0.328
Energy (kcal/day)−14.3 (−127.5 to 98.8)−72.4 (−202.1 to 57.3)0.470
* p < 0.05 compared with the baseline visit. p-value by ANOVA.
Table 4. Changes in the intake of food groups throughout the study.
Intervention Group (n = 293)Control Group (n =308)
Baseline3 Months
Mean Diff. (95 CI%)
12 Months
Mean Diff. (95 CI%)
Baseline3 Months
Mean Diff. (95 CI%)
12 Months
Mean Diff. (95 CI%)
Vegetables (g/day)259.8 ± 129.76.9 (−7.5 to 21.4)24.8 (7.9 to 41.7) *255.4 ± 119.716.4 (3.6 to 29.3) *25.4 (8.7 to 42.1) **
Fresh fruits (g/day)253.4 ± 133.713.9 (−2.5 to 30.3)34.3 (12.4 to 56.1) *249.0 ± 142.325.3 (8.5 to 42.2) **37.9 (16.0 to 59.8) **
Legumes (g/day)21.2 ± 10.80.3 (−1.2 to 1.9)−0.4 (−2.0 to 1.1)20.7 ± 9.92.2 (0.5 to 3.9) **0.0 (−1.9 to 1.9)
White meat (g/day)68.4 ± 34.72.0 (−3.4 to 7.3)2.2 (−3.6 to 8.0)69.5 ± 35.85.9 (0.3 to 11.5) *6.1 (−0.3 to 12.6)
Red meat (g/day)67.0 ± 38.9−3.6 (−8.4 to 1.1)−9.4 (−15.9 to −2.9) **70.6 ± 38.3−3.1 ( −7.9 to 1.7)−8.2 (−14.1 to −2.4) **
Fish (g/day)107.4 ± 58.32.8 (−3.5 to 9.1)−3.2 (−10.7 to 4.2)104.8 ± 51.33.7 (3.7 to 11.1)5.4 (−1.8 to 12.6)
Nuts (g/day)12.7 ± 15.61.4 (−0.3 to 3.1)2.4 (0.0 to 4.8) *12.7 ± 16.6−0.8 (−2.7 to 1.1)2.4 (0.0 to 4.8)
Olive oil (g/day)27.3 ± 18.6−3.6 (−6.0 to −1.2) **−2.0 (−5.0 to 1.0)25.7 ± 17.1−0.9 (−3.2 to 1.4)−2.7 (−5.3 to −0.1) *
Dairy (g/day)344.0 ± 188.5−9.1 (−32.7 to 14.5)−58.6 (−85.5 to −31.7) **346.9 ± 200.3−17.3 (−38.2 to 3.6)−43.0 (−67.5 to −18.5) **
Full-fat dairy (g/day)102.2 ± 107.8−20.8 (−34.8 to −6.8) **−26.6 (−39.8 to −13.3)106.6 ± 119.9−9.3 (−19.3 to 0.7)−3.3 (−17.7 to 11.1)
Wholemeal bread (g/day)23.4 ± 38.016.3 (9.7 to 22.8) **7.2 (0.3 to 14.0) *19.9 ± 39.31.5 (−3.6 to 6.7)3.9 (−3.4 to 11.1)
Whole-grain cereals (g/day)26.6 ± 39.517.4 (10.7 to 24.0) **7.2 (−0.1 to 14.5)22.9 ± 40.41.7 (−3.4 to 6.8)3.8 (−3.4 to 11.0)
Confectionery (g/day)48.4 ± 40.3−21.7 (−26.8 to −16.7) **−22.8 (−28.3 to −17.4) **46.6 ± 40.1−16.0 (−20.6 to −11.4) **−17.0 (−22.5 to −11.4) **
Industrial pastries (g/day)30.5 ± 29.5−10.2 (−14.0 to −6.4) **−10.2 (−14.3 to −6.2) **31.4 ± 32.4−8.2 (−11.6 to −4.7) **−9.3 (−13.6 to −5.0) **
Sweetened beverages (g/day)34.4 ± 73.0−10.0(−19.8 to −0.1)−12.1 (−20.6 to −3.6) **38.2 ± 76.3−10.2 (−21.1 to 0.7)−15.4 (−26.5 to −4.3) **
Sodium (mg/ day)2638.2 ± 893.0−229.7 (−338.1 to −121.3) **−382.6 (−503.4 to −261.8) **2574.4 ± 894.9−240.5 (−351.2 to −129.8) **−268.6 (−389.2 to −147.9) **
Sugar (g/day)8.1 ± 13.0−1.9 (−3.5 to −0.3) *−2.6 (−4.3 to −0.8) **8.7 ± 14.7−2.5 (−4.0 to −1.0) **−2.2 (−3.8 to −0.6) **
* p < 0.05. ** p < 0.01.
Table 5. Effect of the intervention on the intake of food groups throughout the study.
Mean Difference (IG–CG)
3 Months (95% CI)
Mean Difference (IG–CG)
12 Months (95% CI)
p for Trend
Vegetables (g/day)−9.5 (−28.8 to 9.8)−0.6 (−24.3 to 23.1)0.716
Fresh fruits (g/day)−11.5 (−34.9 to 12.0)−3.6 (−34.5 to 27.3)0.603
Legumes (g/day)−1.9 (−4.2 to 0.4)−0.4 (−2.9 to 2.0)0.373
White meat (g/day)−4.0 (−11.7 to 3.7)−3.9 (−12.6 to 4.7)0.508
Red meat (g/day)−0.5 (−7.2 to 6.2)−1.2 (−9.9 to 7.5)0.528
Fish (g/day)−0.9 (−10.6 to 8.8)−8.6 (−18.9 to 1.7)0.195
Nuts (g/day)2.3 (−0.3 to 4.8)0.1 (−3.3 to 3.4)0.263
Dairy (g/day)8.3 (−23.2 to 39.7)−15.6 (−51.8 to 20.6)0.428
Full-fat dairy (g/day)−11.5 (−28.7 to 5.7)−23.3 (−42.8 to −3.8) *0.043
Olive oil (g/day)−2.7 (−6.0 to 0.6)0.7 (−3.3 to 4.7)0.218
Wholemeal bread (g/day)14.7 (6.4 to 23.0) *3.3 (−6.7 to 13.3)0.005
Whole-grain cereals (g/day)15.7 (7.3 to 24.1) *3.4 (−6.8 to 13.7)0.004
Confectionery (g/day)−5.7 (−12.6 to 1.1)−5.9 (−13.7 to 1.9)0.112
Industrial pastries (g/day)−2.1 (−7.2 to 3.1)−1.0 (−6.8 to 4.9)0.304
Sweetened beverages (g/day)0.2 (−14.4 to 14.9)3.3 (−10.7 to 17.3)0.860
Sodium (mg/ day)10.8 (−143.7 to 165.3)−114.0 (−284.3 to 56.2)0.463
Sugar (g/day)0.6 (−1.6 to 2.7)−0.4 (−2.8 to 2.0)0.293
* p < 0.05 compared with the baseline visit. p-value by ANOVA.
Publisher’s Note: MDPI stays neutral with regard to jurisdictional claims in published maps and institutional affiliations.

