Abstract
Carriers are protective transporters of drugs to target cells, facilitating therapy under each points of view, such as fast healing, reducing infective phenomena, and curing illnesses while avoiding side effects. Over the last 60 years, several scientists have studied drug carrier properties, trying to adapt them to the release environment. Drug/Carrier interaction phenomena have been deeply studied, and the release kinetics have been modeled according to the occurring phenomena involved in the system. It is not easy to define models’ advantages and disadvantages, since each of them may fit in a specific situation, considering material interactions, diffusion and erosion phenomena, and, no less important, the behavior of receiving medium. This work represents a critical review on main mathematical models concerning their dependency on physical, chemical, empirical, or semi-empirical variables. A quantitative representation of release profiles has been shown for the most representative models. A final critical comment on the applicability of these models has been presented at the end. A mathematical approach to this topic may help students and researchers approach the wide panorama of models that exist in literature and have been optimized over time. This models list could be of practical inspiration for the development of researchers’ own new models or for the application of proper modifications, with the introduction of new variable dependency.
1. Introduction
The role of drug transporters raised much interest in the pharmaceutical [1], medical [2], and engineering fields [3], especially to improve drug bioavailability and efficacy for target cells [4]. Drug Carriers (DC) have always been considered as transporters of molecules, improving and preserving their properties during administration [5,6,7,8]. Nowadays, very complex drug delivery systems have been developed in order to reduce or avoid side effects, according to drugs’ therapeutic windows.
Today, the well-consolidated theory of drug carriers has been included in an emerging, more complex concept, which goes under the definition of Drug Delivery Systems (DDS) [9]. These intelligent (and often self-powered [10]) transporters [11] can be either artificial or natural objects [12], and they are generally used for the simultaneous transportation and protection of active molecules from the external environment to specific target cells or living tissues [13].
The intrinsic nature of these carriers could be very different [14] according to several fabrication factors [15], such as production process [16], materials employed [17], type of drug entrapped [18], and the eventual addition of peptides or specific ligands affecting release [19].
According to their shape, Drug Carriers can be classified [20] in spherical, cylindrical, disc, or thin film complexes [21,22], which are responsible for their way and time of releasing their drug content. However, another important parameter of distinction is related to their mean dimensions (at nanometric or micrometric level), depending on the application required by the system [23].
One of the main reasons for the use of drug carriers is related to native drug degradation tendency. Therefore, drug can be in contact with external stimuli [24], such as heat [25], temperature [26], pH variations [27], or vibrational phenomena, due to near infrared activation [28]. In addition, drug loss and degradation are often due to endogenous effects, such as the human Immune System (IS), acting against external administered molecules, which could be identified as “enemies” and subsequently eliminated. Based on the Cell-Penetrating-Peptide approach (CPP), the main goal of drug carriers stands in the preparation of specific biocompatible objects that can act as Trojan horses, releasing the beneficial effects of drugs without being blocked by the effect of the Immune System [29].
Drug carriers have been designed, developed, and used in order to avoid degradation phenomena, which are often responsible for the inefficacy of drug after administration [30]. This protection is often guaranteed to drugs incorporated in DCs, since carriers’ material behave as protective barrier during the overall release time necessary from administration to cellular uptake. Another important role played by protective carriers is related to the necessity of controlling drug concentration in the blood after delivery [31]; in other words, drug concentration must be included in the therapeutic window, i.e., a region delimited by a minimum level Cmin of efficacy and a maximum level Cmax of toxicity. The main problem of native administered drugs is that each drug may have a very different behavior, in terms of efficacy and toxic levels, respectively. Therefore, it is actually not easy to determine those levels with great precision and in a unique manner [32,33]. Without the use of a carrier, drug molecules can easily reach the toxic level, due to the side effects that an initial burst could cause; however, diffusion through drug release guarantees a delayed or controlled release of the drug, thus reaching optimal blood concentration levels within the therapeutic window. In specific situations, the use of drug carriers can significantly extend the area of the therapeutic window [34], but this operation must be studied, according to native drug pharmacokinetics, compared to the same molecule entrapped into DDS.
As defined by Williams in 2008 [35], biocompatibility is the capability of a specific material to behave with an appropriate host response in a specific application, i.e., it performs the desired function without significant side effects or deleterious systemic phenomena. Therefore, the development of biocompatible drug carriers has been characterized by great advances in the last 10 years, especially for the technologies developed to continuously balance the drug concentration in the blood [36], maintaining it at the desired values for as long as possible. It is the case of Micro-electro-mechanical Systems (MEMS) [37] (first proposed by the end of 20th century [38] for automatized diabetes control and management [39]) that are characterized by a precise closed loop algorithm in order to take therapeutic decisions without a direct human intervention [40].
The increase in complexity in the development of drug carriers resulted in a serious necessity to start a dialogue and an efficient collaboration among biotechnologists, pharmacists, medical doctors, and engineers [41]. The knowledge obtained from scientists working in different scientific fields created a full knowledge of the problems that needed to be solved. Therefore, several kinds of drug delivery systems have been developed over years [42]; each of them has its own history and can be classified according to their shape, geometry, methods of production, and final applications (pharmaceutical, nutraceutical, cosmetic, etc.). Nowadays, one of the most employed drug carrier systems in pharmaceutical applications is characterized by a spherical shape, and it can be constituted by lipids, cholesterol, or other surfactants. This DC subset goes under the name of spherical vesicle-based carriers [43] and is mainly characterized by liposomes [44,45], niosomes [46,47], solid lipid nanoparticles [48], polymersomes [49], nanospheres [50], and microcapsules [51]. On the other hand, there is another subset of DC that is stable in the form of homogeneous and macroscopic matrices, i.e., finite elements that it is possible to see with the naked eye, if compared with colloidal nanometric suspensions. These carriers are characterized by a macroscopic and a microscopic world. Of course, this means that they are constituted by micro or nanostructures or pores [52]. Foams [53], aerogels [54], and hydrogels [55] have several characteristics in common, and they deserve to be included in the same subset [56].
In order to determine a successful production of drug carriers, different techniques have been developed with the aim of protecting the entrapped drugs after administration [57]. For example, in the case of liposomes (spherical vesicles made by a double layer of phospholipids surrounding an aqueous nucleus), hydrophilic drugs can be entrapped in the inner core, while hydrophobic can be encapsulated among the double lipidic layers. In these cases, the transportation in these two different compartments of hydrophilic and lipophilic compounds can also occur simultaneously. Spherical DC are also niosomes, which are essentially made of surfactants belonging to the family of Tween and Span (polysorbates); they can be used to entrap drugs of the same nature. Aerogels [58] and foams [59,60,61,62], as well as more complex structures, such as cubosomes, are thought to be a sort of homogeneous box containing the drug.
The entrapment of drugs into carriers has given these objects a higher chance to increase the drug’s bioavailability [63], meaning their efficacy during release, soon after administration. Moreover, according to these systems, drug administration takes place more gradually, since there is a natural barrier given by the carrier itself; this contributes to delaying the loss of the active principle. The drug can diffuse from the inner part of the carrier to the external environment while being delayed by the carrier’s material resistance and external viscosity. This delay time is not considered a disadvantage; on the contrary, it is a precise manner to control drug release time, tuning the exact amount of drug that the cells need to absorb per time unit and avoiding the side effects caused by native drug administration overdose. To control and learn how to tune drug loss from carriers per time unit, it is particularly important to study drug release profiles, i.e., the kinetics of the drugs diffusing from carriers to the external receiving medium. These conditions can be reproduced easily in vitro.
The theory regarding drug release gained much importance in the last decades, and it has found great help with the use of computationally aided observation techniques. In particular, the controlled release’s main purpose is to maintain specific drug concentration levels in blood vessels for as long as possible, controlling the release rate and its duration in target tissues.
Drug release profiles often follow different phenomena, such as simple diffusion, erosion, degradation, and absorption uptake [64]. Scientists have proposed several mathematical models and used them as tools for the design of pharmaceutical formulations [65]. As a definition, models could be intended as mathematical interpretations of the phenomena that are observed by scientists among their experimental findings and common experience [66]. The necessity to fit the enormous amount of raw data registered, experimentally, from release profiles was also moved by the overlapping of more than one competing phenomenon, observed or hypothesized, in the release environment. Mathematical models used to describe raw data release profiles could be empirical, semi empirical, or built on the physical concepts of their variables. Often, some of these models are derived from well-known equations reported in the literature. However, only a precise combination of the experimental observations with the proposed models can result in a full understanding of the release mechanisms, thereby enabling a correct prediction of release kinetics and material interactions.
Drug carriers differ in shape, dimension, drug dissolution profile, and functionality [67], thus resulting in the impossibility to develop a unique model for predicting release profile in a universal manner. Therefore, it is crucial to choose the best model that fits correctly in each case of study [68].
After a careful reading of the literature, it appears to be of fundamental importance to study the physical value of each variable included in the model used in order to understand the effect of different factors affecting the drug dissolution rate and how this can influence the efficacy of the drug, according to the therapy requested for patients.
Once defined, the main goal of this review work, an overall comment on the most used drug release modeling profiles, is proposed. Each reported fitting model will be analyzed from the mathematical and physical point of view, indicating the type of function that is described and its related application. An average fitting quality evaluation will follow this analysis for the same models, according to parameter significance, and study the effect of the trends on modeling.
2. Description of Models for Drug Release
The interest of researchers in drug delivery is abundantly reported in literature. To have a concrete idea on the attention of scientists and researchers to this field, the certified source Academia.edu has been consulted (accessed on the 11 May 2022) in order to get information on the approximate number of papers that mention, in their full text some specific keywords.
In particular, by searching “drug delivery” as a very generic expression in this academic search engine, more than 873 thousand papers appeared, citing these two words, specifically. Among these, 164 thousand report a more specific “drug delivery modeling” in their full text. This means that around 18.8% of papers related to drug carriers are effectively sensible and interested in the problem of modeling raw data obtained from drug delivery experiments or explanations. A similar result has been obtained by searching “drug delivery systems” and “drug delivery systems modeling”, obtaining, in the first case, about 579 thousand mentions and, in the second case, about 137 thousand, with a 23% ratio. As a third confirmation, a final search has been performed with “drug carriers” and with “drug carriers modeling”, obtaining a ratio of 22.3%. On average, it appears that one paper over five is referring to models, denoting that only 20% of the works related to drug delivery are effectively described by a mathematical prediction of the phenomena.
In Table 1 and Figure 1, the research has been performed by going deeply into details of the kind of mathematical models used in drug delivery field. This research regards the 10 most used models of drug delivery developed or modified over the years. The searching criteria consisted of writing the name of the author’s proposing model, followed by “drug delivery model” as a full expression.

Table 1.
Diffusion of specific authors’ and scientists’ models for drug release.
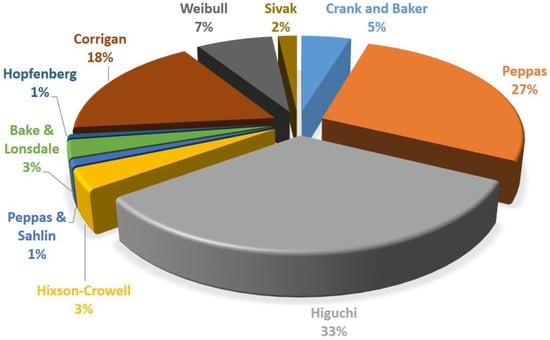
Figure 1.
Frequency use distribution of the most famous drug release models.
Scientists have studied raw data obtained during experimentations; drug release tests have been reproduced in laboratories, trying to describe the phenomena involving drug specific behavior. For example, the resistances offered by materials and media represent a barrier among drugs and target tissues. These molecules need to overcome those barriers during their diffusion from the inner part of the carrier to the external receiving liquid bulk.
Several mathematical models have been reported in the literature over the years, and they were employed by a large number of scientists to fit their drug release raw data [69]. Moreover, drug release previously consisted only in simple observations; then, the advancement of computer simulation and data analysis interpretation resulted in an improved pharmaceutical technology. The use of well-known mathematical models and the development of new ones contributed to correctly designing new drug formulations and dosages. Nowadays, the main challenge that scientists are facing is the development of mathematical models that simultaneously combine the theories describing drug release phenomena and the effects on drugs during transportation to the human body. In other words, it is not simple to define models that take into account both the diffusion phenomena and the uptake response of cells, simultaneously. However, this field of study is in continuous evolution, especially from the industrial point of view, due to its enormous potential.
The kind of drug, its hydrophobicity or lipophilicity, the drug amount incorporated in carriers, the eventual excipients, and the bulk delivery conditions could affect the drug release. Some of these features influencing release are listed as: polymer degradation, polymer or drug dissolution in the external medium, possible degradation of excipient or stabilizers, creation of hydrostatic pressure inside the system, coalescence of drug carriers among them, variation of pH or temperature induced by not programmed stimuli, or environmental phenomena. However, it is practically impossible to simultaneously predict all of these phenomena, especially considering the drug transport coupled with cellular response.
Mathematical solutions are generally characterized by complex partial differential equations, with dependencies on time and tridimensional space. The use of numerical approximations, limiting the introduced error as much as possible, resulted in a reduced level of complexity in drug release models. In this section, the most famous models for drug release will be described one by one, describing the physics behind the involved variables and providing application purposes.
In order to correctly describe the models for drug delivery systems, it is worth adding the concept of drug encapsulation efficiency into carriers. This means that the effective amount of a drug entrapped in the carrier could not be equal to the amount of drug dissolved in the preparation solutions before production of the carriers themselves. For example, when preparing the precursor solutions, an operator will dissolve M0 (theoretical initial mass of drug) into a defined initial volume V. This will result in a drug concentration (defined as C0). However, after the processing of drugs and materials for carriers, a partial loss of the drug could occur, defining a final Mf value of the drug incorporated in its final volume Vf, thus resulting in a final concentration Cf. This theory can be described by the following equation:
In case the volume of the system is constant, this equation can easily become
Generally, these measurements are performed using a UV-Vis (UltraViolet-VISible) spectrophotometer at the specific wavelength of the incorporated drug (reported in tables or databases for each molecule). The ultraviolet region is generally included among 100 nm and 400 nm, while the visible region is among 400 and 700 nm. This instrument works, with a good approximation, with the Lambert–Beer equation (Equation (3)), which linearly correlates the concentration of drug dissolved in the bulk solution to the absorbance of the drug in that medium:
where A is the absorbance of that drug (measured after setting the wavelength), C is the concentration, and K is the slope obtained by the calibration line at known drug concentrations. The slope and the concentration should also be multiplied by the optical path value, which is often equal to one.
A = K C
The definition of the encapsulation efficiency is extremely important, since it is strictly correlated with the drug release study. In case of representation of the cumulative drug release percentage, it is correct to multiply the following modeled drug concentration by the encapsulation efficiency obtained for the prepared drug carriers. Otherwise, the drug release pharmacokinetics could be overestimated.
A tool to identify the efficacy of a model in a specific system is equally necessary, and it is worth citing it in this section. In a certain manner, the following Equation (4) represents a model-for-the-models; this means that this mathematical correlation can be used to compare the other models among them and evaluate their predictive efficacy. Before defining that a model fits his/her necessities, the acute researchers or students have the chance to minimize the value coming out from the following mathematical correlation. This equation goes under the classical definition of Summed Square Error (SSE):
where the subtraction, reported in parenthesis, is among the value calculated using the model and the value observed or registered by experimentation.
2.1. Fick’s Classic Model
Drug release could be described as simple diffusion controlled by a constant coefficient. This is the specific case of drug depots, which consist of reservoirs of drugs surrounded by a homogeneous polymer-based membrane. Another example is characterized by monolithic systems, also known as one-block delivery systems. The important feature is that there should be no separation between the drug reservoir and the controlling barrier. In other words, the simplicity of the system could be easily approximated by a generic Fick’s law [70,71,72]; in case of complex or multiple barriers controlling the release rate, it is not possible to use this model.
According to the classification proposed by Siepmann [73,74,75], in case drug permeability through the polymeric barrier is constant, the release kinetic could be approximated as the first order:
where M(t) represents the amount of the drug released with time dependency, M0 is the initial mass of the drug, V is the total volume of the drug depot, A is the total surface area of the device, and L is the thickness of the polymeric membrane, which separates the drug depot from the external environment. Obviously, D is the diffusion coefficient of the drug among the membrane and in the external bulk. As it is possible to see, in these systems, the release rate is considered constant, as well as the diffusion rate and the A, K, L, and V coefficients; that is the reason why this partial differential equation has a linear solution in the time variable and could be an easy approximation. Vice versa, in case the initial drug concentration is larger than the drug solubility in the reservoir liquid bulk, drug crystals will be created in the depot, resulting in saturated conditions at the interphase internal/external of the drug carrier. In this case, the differential variation of drug concentration with time is constant and directly proportional to A, D, K, and Cs, with this last value being the solubility of the drug in the depot. Therefore, the drug release system will consist of a zero-order release rate, as long as there will be an excess of drugs in the drug depot.
In the case of monolithic solutions, the geometry of the system will significantly affect the drug release. For example, for thin films, Crank and Baker proposed a cumulative approach model, as follows:
According to this model, M(t)/M0 ratio should be a value between 0 and 0.6. In particular, M(t) is the cumulative amount released at time t, M0 is the initial drug amount, D is the drug diffusion coefficient in the considered matrix, and L is the thickness of the film. Similar equations were adapted by Crank in 1975 for spherical and cylindrical matrices, which simply differ by some geometrical modifications, but are essentially similar.
It is also worth adding that M0 is not always equal to Minf. Indeed, the initial mass of the drug and the mass of the drug released at time infinite are equal only in the case that all the drug content is released from the carrier, thus indicating M(t)/M0 as the fraction released at time t. A simulation of the Crank and Baker model has been ideally reported in Figure 2, where the model evolution over time is discretized in black dots. It is quite important to note that the varying parameters have been chosen in order to obtain a clear visualization of the trends on physical effects. However, this choice has been taken according to the physical significance of these parameters.
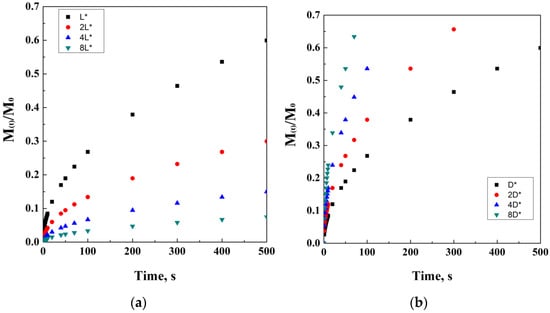
Figure 2.
Crank and Baker model at different thickness values (a) and diffusion coefficients (b).
In case the diffusion controls totally release the system, it could be also independent from the shape or geometry of the carrier. In that situation, the release model could be simplified to a classical power law, also proposed by Peppas, as described in the following sections.
In case of osmotically controlled systems [76,77,78,79], the following equation could describe the system, as follows:
where Lp is a coefficient of permeability (unit of measure of length over time), C is the concentration of the drug, δ is the thickness of the carrier matrix, is the osmotic pressure of water, A is the cross-section area of the carrier, σ is a reflection coefficient, and K is an empirical coefficient.
2.2. Higuchi’s Model
Drug dissolution from matrices requires a different mathematical approach [80]; this model is well-known in the literature, since it was firstly introduced in the 1960s by Takeru Higuchi, who derived it while studying drug release from ointments. However, this famous scientist was also an expert in release phenomena from semi-solid and solid matrix systems. The first studied systems were characterized by planar mixtures releasing a lipophilic compound. According to this model, the concentration of drugs liberated increases with the square root of time. In this case, the mathematical model used was:
where M(t)/ represents the drug fraction released per unit surface area. This fraction has dimensions of [Length]−2 and is a function of the square root of time. Cs is the solubility of the drug in the external matrix medium, D is the diffusivity in the matrix medium, and A is the loading of solute, in case it exceeds its solubility in the matrix. A theoretical simulation of Higuchi’s model has been proposed in Figure 3.
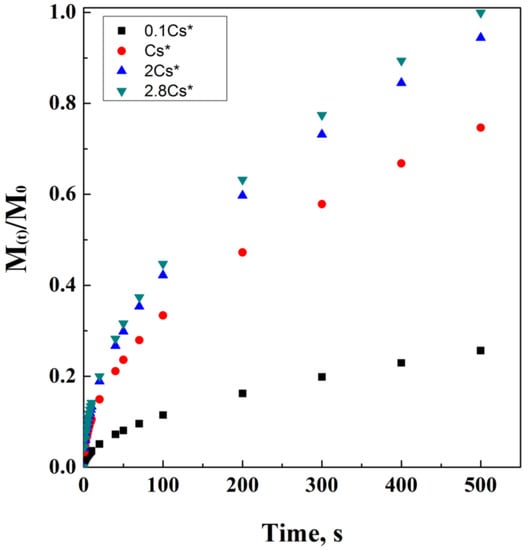
Figure 3.
Higuchi’s model at different drug solubility concentrations.
This model, of course, is particularly applicable in a saturated system, and it has also been proposed for other kinds of shapes and geometries, such as spherical. Available in homogeneous and not homogeneous systems, the equation can be adapted to porous systems, as follows:
where ε is the porosity of the matrix and τ is its tortuosity factor. Figure 4 reports an ideal simulation of Higuchi’s modified equation, including tortuosity and porosity dependencies. It is interesting noting how the direct proportionality is related to porosity, while the indirect one is related to tortuosity.
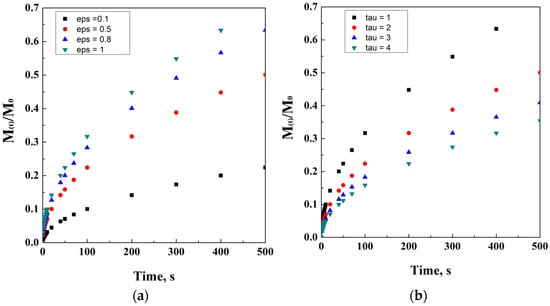
Figure 4.
Higuchi’s model at different porosity (a) and tortuosity (b) values.
However, another modification was proposed for this equation, in case of a matrix already saturated with a drug, that excluded Cs and introduced C0, intended as the concentration of the diffusing drug in a porous matrix:
This equation establishes that the fraction of the drug released is proportional to the square root of release time; according to this last equation, all the concentration, diffusion, tortuosity and porosity coefficients are assumed constant and are indicated as a unique constant KH, named Higuchi’s constant. The possibility to use this model is linked to conditions; among those, the initial drug concentration must be higher than saturation conditions of the drug in the defined matrix; moreover, diffusion must be considered unidirectional and constant; last, but not least, dissolution of the matrix and border effects are negligible.
2.3. Hixson-Crowell’s Model
The researchers Hixson and Crowell [81,82,83] proposed a model that correlates initial drug mass amount fed to the system to the amount of remaining drug (i.e., not released) at time t. However, in this case, the cubic roots of these two mass values are linearly correlated with time. Therefore, it is possible to define the following Equation (11):
where M0 is the initial amount of drug, Mi(t) is a function of time, describing the amount of drug that still remains confined at each time lapse, KHC is defined as a constant of incorporation, which is, respectively, a function of surface and volume of the drug carrier. Generally, this model is used for specific DC geometries, such as tablets or parallel planes.
The value of this constant could be additionally defined as follows: by introducing the number of particles N, the diffusivity D, the solubility at saturated conditions and fixed temperature Cs, and being no less important, the thickness of the thin layer δ.
This equation introduces a new constant, K′, that refers to the average density of the carrier. Of course, it is in correlation with not only the number of particles but also with its mass concentration in the bulk solution. Moreover, the use of this model is strictly correlated to the literal possibility to count particles in colloidal suspensions; this could be performed using proper instruments or technologies, such as Nanoparticle Tracking Analysis (NTA). However, this technique is not sufficient by itself, since it gives only information about particles number and their velocity, following their Brownian motion. However, the main characteristics of these particles, pores and shape, could be observed and critically commented on by only using a scanning electron microscope, which also provides the possibility to measure pores dimensions. If the dissolution of the drug is constant, especially from spherical particles, K′ becomes constant and determined experimentally.
2.4. Peppas’ Models
The model proposed by Peppas [84,85,86] in 1983 consisted of a simple power law; this necessity resulted from the fact that, in general, it is not easy to reach a zero order kinetic with a linear correlation among the drug fraction released over time t. Indeed, the laboratory experience of Peppas and his co-workers induced the development of a new semi-empirical model, which described drug release as an exponential function of time. Indicating M(t) as the amount of the drug released at time t and as the final amount of drug at the equilibrium, the following simple model was proposed:
where n is the exponent of time t and it is related to the drug release mechanisms, which can be also obtained experimentally. In particular, K is the constant that depends on the shape and geometry of the drug carrier vesicles or matrix. Indeed, this equation can be easily re-written as
where is a constant and could be englobed in K as:
It is worth clarifying that the encapsulation efficiency plays an important role in defining the value of ; in fact, if the encapsulation efficiency is equal to the total initial drug amount fed to the system before the preparation of the drug carrier, the value could be assimilated into the initial amount of the drug dissolved into the system. On the contrary, if the Encapsulation Efficiency (EE) is not equal to 100%, it is necessary to multiply by the EE percentage. An ideal representation of Peppa’s model is reported in Figure 5.
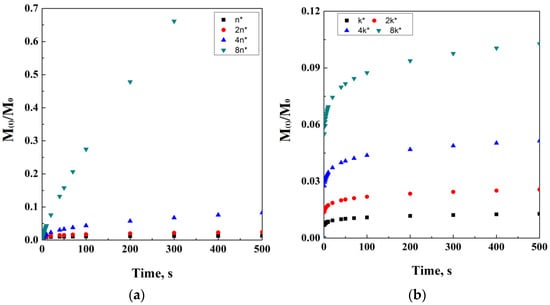
Figure 5.
Power law at different exponent values (a) and k coefficients (b).
However, it is possible to modify this equation by the necessity to consider the latency time, i.e., the lag phase in which the drug carrier is overcoming the resistance to diffusion, offered by the external layers of the drug carrier and/or by the external initial bulk conditions. This power law model has been ideally simulated in Figure 6. In Equation (16), Mi−l represents the initial mass, considering that the administration starts at the end of the lag phase.
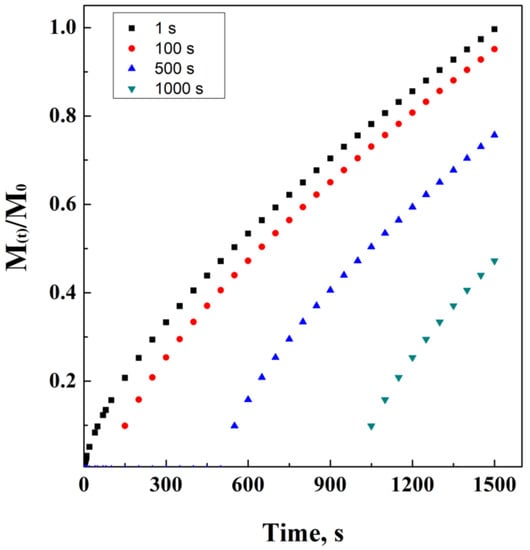
Figure 6.
Power law at different lag times.
Furthermore, it is possible to correct this model in case an initial burst of drug occurs, as follows:
where b describes the initial concentration of the drug rapidly released to the system soon after the time-zero from the beginning of the phenomenon.
However, Peppas is the author of several papers reporting different models developed in collaboration with his co-workers. For example, the description of uncommon simultaneous release phenomena (diffusion and relaxation of polymer chains) was included in this model as a sum of two additive contribution of power laws. This new equation by Peppas and Sahlin [87,88] is described as follows:
where three constants have been introduced: K1, K2, and n. While K1 represents the Fick’s diffusional contribution from matrices of any shape, K2 is related to the relaxation contribution.
The relaxation time is correlated to the diffusion time, calculating the following Deborah number:
where λ is the relaxation time of polymers chains, and θ the diffusion time. In the case that De is much lower than 1, diffusion controls the release process; on the contrary, when it is much larger than 1, relaxation phenomenon controls the process. In case of a value near to 1, the two contributions need to be evaluated together.
2.5. Baker’s and Lonsdale’s Model
These two scientists derived a model from Higuchi’s equation [89,90,91], adapting it for drug release from spherical matrices. This model was recombined as follows:
In this model, again, Mt is a function of time. Describing the amount of a drug released over time, is the maximum amount released considering an infinite time, t is the independent variable, and K is determined as follows:
where D represents the diffusion coefficient of the drug, S is the solubility of the drug in the carrier, r0 is the initial radius of the carrier, and C0 is the initial concentration of the drug. In case the solubility and the diffusion coefficient in the carrier matrix are constant over time, the value of K could be considered a constant. K values could vary according to the kind of the entrapped drug and the type of carrier matrix. Of course, the values of D and S are related to a matrix that is just releasing drug, reducing its diameter and mass without degradation phenomena. In the case of foams of other porous matrices, the K value becomes:
where ε and τ represent the porosity of the carrier matrix and the tortuosity during drug diffusion, respectively.
In this case, a graphical simulation of the model is not reported, since it requires a numerical solution by successive attempts.
2.6. Hopfenberg’s Model
Hopfenberg [92,93] proposed a model to describe drug release from polymers that could be degraded or eroded during drug loss, independently from their shape or dimensions.
The main representing equation for this model is conditioned by the erosion grade constant, named k0, and by the initial concentration of drug entrapped in the matrix, C0:
where, as always, M(t) and are the mass of drug released at time t and at plateau level, respectively; t is the independent variable of time, and a0 is the initial length of the carrier matrix. Of course, this last variable could be a function of time; however, in this case, it can be approximated to the initial value. Indeed, a0 only depends on the shape of the matrix (radius in case of a sphere or cylinder, or half thickness in case of a thin layer). The exponent “n” is set to 1 in case of a thin film shape, to 2 in case of a cylinder, and 3 in case of a sphere.
As it is possible to see, in case of thin layer, the equation becomes:
where the three constants could be included under a unique k1 value, as follows:
In case of a not negligible latency time (tL) from the beginning of release experiments or administration, a correction could be performed on the following equation:
This equation represents an evolution of the exponential model. In this case, there is no graphical simulation, since this model is easily linkable to one of the previously mentioned equations.
2.7. Corrigan’s Model
Dr. Owen I. Corrigan [94,95,96] proposed the use of poly(lactic-co-glycolic) acids (PLGA), for the design of innovative drug delivery systems, for the entrapment of several kinds of active principles, such as steroids, anti-inflammatory drugs, antigens and, in general, therapeutic agents. These scientists demonstrated that copolymers could be characterized by complex simultaneous release phenomena, probably also due to drug-polymer interactions and to drug molecular weight. In the case of large molecules, such as Bovine Serum Albumin (BSA), the phenomenon of release from polymeric particles was characterized by a fast initial burst, followed by a subsequent slower, and continuous release. Corrigan attributed this behavior not only to degradation of polymer but also to the affinity between BSA and PLGA.
For specific compounds, even three steps were detected during drug delivery observation: an initial burst due to diffusion, a subsequent lag phase, and a final completion of drug release due to polymer mass loss. In particular, the kinetics of polymer mass loss, for pure microparticles of PLGA, are described by the following equation.
where x represents the polymer mass loss, t is the time lapse since the beginning of the observation, while k and tmax are, respectively, time and rate constants directly related to the bulk degradation of the polymer.
Drug release from copolymers such as PLGA/PLA (see Abbreviation List) were described using a two phase model, according to which there was a first controlling step, where the drug diffuses among the interface of the polymer, followed by a second release of the drug entrapped into the polymer structure, with this last step starting its own degradation. The initial diffusion step is described by the following equation.
where FB is the released amount due to the diffusion, FBIN is the burst fraction considering an infinite time of observation, and kb represents the first order constant rate associated with diffusion step. In particular, kb is also directly dependent on the diffusion coefficient (D), solubility of the drug (CS), and surface area of drug that takes part in the dissolution. The second degradative step describes the release due to degradation phenomena of the polymer; this contribution is described by the following equation:
Combining the two contributes, the Corrigan overall formula becomes the following:
Moreover, the quantification of the active drug released (At) is given by the product of the fraction FTOT and the amount of drug loaded. An example that came out from the studies of Corrigan and co-workers describes the production of ketoprofen-loaded PLGA nanoparticles, which resulted in an encapsulation efficiency between 40 and 65%. Drug release studies showed a first plateau at 5 days due to diffusion, followed by a second plateau reached at about 20 days, due to polymer degradation. An idealistic representation of Corrigan’s model is proposed in Figure 7. In details, in Figure 7b,c, lines represent guides for the eyes.
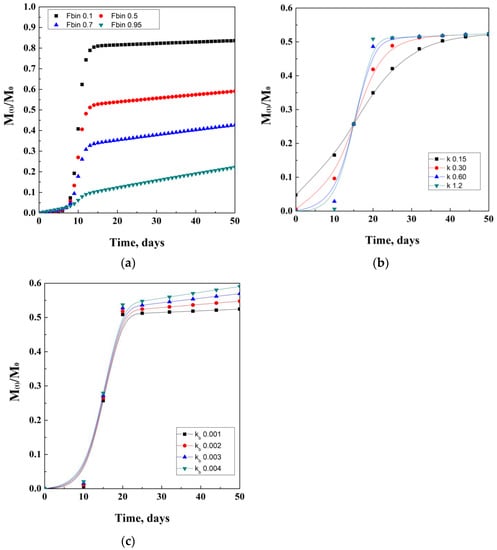
Figure 7.
Corrigan model depending on the Fbin coefficient (a), k degradation coefficient (b), and kb diffusion coefficient (c).
2.8. Weibull’s Model
Weibull [97,98,99] proposed a model to describe the phenomena of drug release during a finite time of observation.
This mathematical model is characterized by three newly introduced parameters. The first one is k = 1/a, where “a” is the time-scale parameter, and it is obtained empirically; t is the time elapsed from administration; tc is the central value of time, related to the latency time from the beginning of the release. This value can be, of course, equal to zero in case of negligible latency time of the release system; the last parameter is the exponent d, strictly correlated to the type of modeling curve. In particular, d is equal to 1 in case of a simple exponential equation, while it is more than 1 in case of a sigmoid and less than 1 in case of parabolic modeling function.
This model is generally used as a comparative reference to check the accuracy of different models among them, describing drug release from polymeric matrices. Another reason linked to its use is that it does not depend on the simultaneous effect of different phenomena occurring during release. An ideal mathematical simulation of this model is proposed in Figure 8, where for tc a unit of time has been used.

Figure 8.
Weibul model at different tc values.
2.9. Sivak Model
Sivak, in 2009, proposed a model [100] for the simultaneous release of two anti-cancer compounds (DB-67 and doxorubicin [101]) from polyurethane foams [102]. In particular, the two indicated compounds are characterized by several functional groups, which can act as points to create chemical bonds with polyurethane networks. These tests were performed in a phosphate-buffered saline (PBS) medium at controlled temperatures of 4 °C, 22 °C, 37 °C, and 70 °C, for a maximum period of 10 weeks.
The drug-released amount was detected using fluorescence spectroscopy; raw data were used to develop this model; in particular, the amount of drug diffused into the external medium is expressed by the following equation, in terms of molar ratio:
where m and V are the mass and the volume of each collected sample at the i-th time interval, VT is the total volume of the system in which the release experiment is performed, and j represents the last time interval. Authors showed that, working at 37 °C, an initial rapid burst is detected, especially, for DB-67, but then, drug concentration stabilizes after about 10 days. Instead, working at 70 °C, a rapid increase of the curve slope was detected, over time, without obtaining a plateau after more than 70 days.
2.10. Pulsatile Drug Delivery
Pulsed delivery [103,104,105] consists of the artificial intervention during delivery and after administration. For example, let us imagine that a spherical drug carrier has been delivered to a blood vessel; it will start releasing drug content only after receiving a stimulus from an external agent that is activated by an operator. Then, after a defined therapy time, the operator interrupts this stimulus, stopping the release of the drug from the carrier. The release function suddenly equals a drug concentration of a fraction equal to zero.
In detail, each of the previously described models are eligible for pulsed drug delivery. A generic system of this kind can be characterized as follows:
where C(t) is a generic function of time, depending on the release phenomena and type of carrier employed; instead, k represents a generic variable that, in this case, determines the timing value of the function. Let k be 1 h; this means that the carrier will be programmed to release its content for the entire first hour after administration, following the model indicated by the generic function f(t). Soon after, the release will be stopped by the interruption of the external stimulus, and the concentration of the drug released will go to zero, until reaching time m. Of course, this alternation of “release” and “no release” could be programmed to be cyclic, as well as the associated stimulus that induces the release. This kind of mechanism could be very useful to have a fast initial burst of drug without a significant drug accumulation in the target tissues, avoiding consequent toxic side effects. A tentative representation of this model is ideally reported in Figure 9, considering f(t) as the equation adapted from the Crank and Baker model, which is assumed as the example.
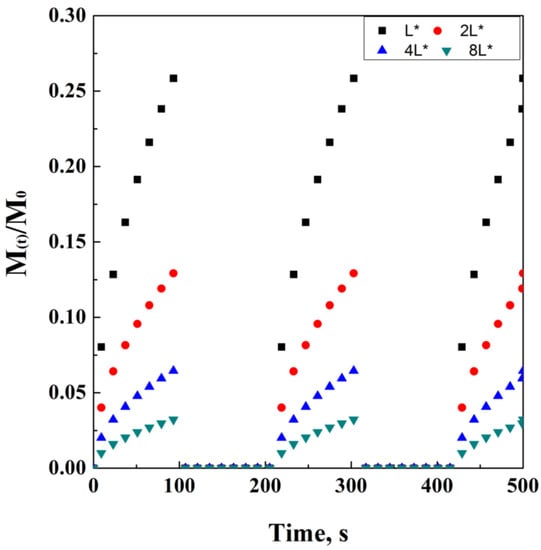
Figure 9.
An example of pulsed delivery, adapted from the Crank and Baker parametric, on thickness L.
However, it is possible to simplify this model as follows:
where p represents a constant value of drug released concentration, in case the system is able to lose a time-independent amount of drug; b represents the initial time where the drug’s initial burst occurs: this last value could be approximated to 0 in the case of very long release times at a constant value of C(t).
3. Discussion
According to the wide literature treating these topics, the previous section represented just a brief summary of the mathematical models for drug delivery. The difficulty that researchers and scientists may find during their experimental campaigns stands not only in the interaction that eventually occur among drug and carrier’s materials but also on different phenomena that may happen during delivery, such as degradation, bio-degradation, erosion, and bio-erosion [106,107,108,109]. In order to distinguish these phenomena, it is necessary to recall their definitions, as summarized in Table 2.
Table 2.
Definition of general disrupting phenomena occurring in drug delivery.
In detail, the scission of a chain is a chemical phenomenon that causes the separation of a long polymeric chain into monomers and oligomers. This is considered a degradation phenomenon, since the polymeric barrier created using the long chain is disrupted, thus characterizing the fast and unwanted diffusion of the entrapped drug from the inner core to the external bulk. Chain scission could be caused either by artificial stimuli or by the action of microorganisms. Instead, erosion is actually mass loss, occurring at the interphase between the DC external surface and the aqueous bulk. This boundary layer phenomenon is controlled by reactions that only occur on the surface of the DC, and it may be, in this case, caused by artificial or natural stimuli, such as microorganisms’ action.
Mathematical models can be considered empirical when they are purely characterized by trial and error attempts to let the variable work correctly to describe the release profiles; otherwise, the models are classified according to their physic-chemical dependencies, in case they describe the diffusive phenomena and the chemical reaction occurring in the chosen system. In these last cases, they can be classified as semi-empirical models.
In more detail, depending on the specific composition of an erodible support (i.e., on the kind of polymer), on the loading of additives, and on the geometry and shape of the matrix, many phenomena of mass transfer and chemical reactions may influence the release kinetics of a drug. This set of phenomena (listed in Table 3) should be considered as a subset of Table 1, since they go, deeply, into the effect of degradation on materials.
Table 3.
Phenomena of degradation.
In details the invasions of the external bulk, in the inner core of DC, is due to probable interphase disruption and the creation of a pressure gradient directed to the inner compartment. Drug degradation may occur during an increase in temperature and energy of the system, resulting in total or partial loss of efficacy of a drug during administration. Polymer degradation may occur during preparation of DC or delivery, probably due to the overcoming of glass transition conditions. The creation of aqueous pores is a sort of partial invasion of the external water in the inner compartments of DC. Degradative phenomena, due to drug/polymer interference, are essentially related to reactions that may occur in the disruptive polymeric membrane, separating inner compartments from external bulk. Polymer swelling is caused when a solvent penetrates into the polymeric network, causing a sudden change in the volume. Drug adsorption on polymers is the well-known phenomenon of physical uptake of a solute (in this case, the drug) on a solid matrix (the polymer).
Depending on the complexity of physical phenomena, each release system must be preliminarily characterized; then, a modeling attempt can be performed. The information obtained after this analysis can be of fundamental importance to the use of a mathematical model, which either already exists, in which case it needs to be optimized, or is created ex novo. If there is not sufficient information on the release system, it will be difficult to find a model that properly describes the phenomena. For this reason, it is essential to study, with great attention, the property variations of the system during the release, over time.
Indeed, this work was intended as a collection of mathematical correlations, leaving, to the reader, the critical choice of the one that best fits with their research and development activities. Several scientists have successfully and brilliantly studied the deep functionalization of complex carriers, thus obtaining outstanding results; some examples are related to the use of dietary supplements, proteins, aerogel, liposomes, hydrogels, nanogels, and nanocomposites [128,129,130,131,132,133,134,135,136], whose data have been successfully used and applied to the existing models [137,138], taking into account the occurring phenomena naturally or artificially induced during therapy [139,140,141,142,143,144].
Purely empirical models generally do not take into consideration the overlapping of different transport phenomena effects, such as diffusion of water and the drug, swelling, or degradation phenomena that may also bring to a zero order kinetic. Instead, using a non-empirical model, physical and chemical phenomena are described precisely, with a more complex mathematical expression dedicated to them. Summarizing, empirical models have a less precise approach, but they are particularly powerful with a more simplified kinetic; non-empirical models describe all the phenomena occurring in the system but with a complex mathematical approach. Last, but not less important, semi-empirical models are a mix of previous characteristics and properties, with variable kinetic orders.
4. Conclusions
Recalling the aims of this paper, the author tried to provide a general and basic knowledge on this topic without presuming to give the proper tools to predict any kind of complex simultaneous phenomena and occurring during drug delivery, such as predicting bio-relevant media for drug dissolution experiments or providing the best carrier material for a specific molecule. The use of mathematical tools represents a modern approach for the correct exploitation of drugs and their beneficial effects on human tissues [145]. Release mechanisms can be controlled and ruled by diffusion, chemical reactions, osmotic pressure, or swelling. Moreover, the correct prediction of the physics of the systems is a strong tool also for its potential reduction in the number of experiments; for example, professor Higuchi was considered a sort of “father” of the mathematical modeling for drug carriers, since his method was recognized to be theoretically stable and easy to apply [146].
However, the preliminary understanding of these phenomena is of fundamental importance [147] before approaching the problem using a mathematical model. Indeed, the theory of drug delivery requires accurate molecular, transport, and thermodynamic evaluations of the carriers’ behavior in the chosen environmental system, in order to predict the expected interactions. Of course, a physical and chemical approach to the system needs to be validated with several experimental runs, especially in terms of drug dosage optimization; one actual example is represented by the genetic material delivery, which is particularly complex. This will require much more studies and wider validations across semi-empirical models, in order to approach a rational design of modern delivery systems. To reach this goal, the most powerful and efficient high-pressure systems [148,149] and computer-aided analysis [150,151,152] and simulations will be significantly helpful in the decisional process for delivery description and modeling, becoming an integral and essential part of this theory.
Funding
This research received no external funding.
Conflicts of Interest
The authors declare no conflict of interest.
Abbreviations
| DC | Drug Carriers |
| DDS | Drug Delivery Systems |
| IS | Immune System |
| CPP | Cell-Penetrating-Peptide |
| MEMS | Micro-electro-mechanical Systems |
| UV-Vis | Ultraviolet-Visible |
| SSE | Summed Square Error |
| EE | Encapsulation Efficiency |
| PLGA | poly(lactic-co-glycolic) Acids |
| BSA | Bovine Serum Albumin |
| PLA | Poly-lactic Acid |
| PBS | Phosphate-buffered saline |
References
- Chothe, P.P.; Nakakariya, M.; Rotter, C.J.; Sandoval, P.; Tohyama, K. Recent advances in drug transporter sciences: Highlights from the year 2020. Drug Metab. Rev. 2001, 53, 321–349. [Google Scholar] [CrossRef]
- Borst, P.; Evers, R.; Kool, M.; Wijnholds, J. A family of drug transporters: The multidrug resistance-associated proteins. J. Natl. Cancer Inst. 2000, 92, 1295–1302. [Google Scholar] [CrossRef]
- Sahoo, S.K.; Labhasetwar, V. Nanotech approaches to drug delivery and imaging. Drug Discov. Today 2003, 8, 1112–1120. [Google Scholar]
- Zylberberg, C.; Matosevic, S. Pharmaceutical liposomal drug delivery: A review of new delivery systems and a look at the regulatory landscape. Drug Deliv. 2016, 23, 3319–3329. [Google Scholar] [CrossRef] [Green Version]
- Coelho, J.; Trucillo, P.; Nobre, B.; Palavra, A.F.; Campardelli, R.; Reverchon, E. Extraction and bioprocessing with supercritical fluids. Phys. Sci. Rev. 2020, 5, 1–14. [Google Scholar] [CrossRef]
- Balasubramanian, V.; Onaca, O.; Enea, R.; Hughes, D.W.; Palivan, C.G. Protein delivery: From conventional drug delivery carriers to polymeric nanoreactors. Expert Opin. Drug Deliv. 2010, 7, 63–78. [Google Scholar] [CrossRef]
- D’Angelo, I.; Conte, C.; La Rotonda, M.I.; Miro, A.; Quaglia, F.; Ungaro, F. Improving the efficacy of inhaled drugs in cystic fibrosis: Challenges and emerging drug delivery strategies. Adv. Drug Deliv. Rev. 2014, 75, 92–111. [Google Scholar] [CrossRef]
- Beloqui, A.; Solinís, M.Á.; Rodríguez-Gascón, A.; Almeida, A.J.; Préat, V. Nanostructured lipid carriers: Promising drug delivery systems for future clinics. Nanomed. Nanotechnol. Biol. Med. 2016, 12, 143–161. [Google Scholar] [CrossRef]
- Jahromi, L.P.; Ghazali, M.; Ashrafi, H.; Azadi, A. A comparison of models for the analysis of the kinetics of drug release from PLGA-based nanoparticles. Heliyon 2020, 6, e03451. [Google Scholar] [CrossRef] [Green Version]
- Patra, D.; Sengupta, S.; Duan, W.; Zhang, H.; Pavlick, R.; Sen, A. Intelligent, self-powered, drug delivery systems. Nanoscale 2013, 5, 1273–1283. [Google Scholar] [CrossRef]
- Dutta, R.C. Drug carriers in pharmaceutical design: Promises and progress. Curr. Pharm. Des. 2007, 13, 761–769. [Google Scholar] [CrossRef]
- Alvarez-Lorenzo, C.; Bromberg, L.; Concheiro, A. Light-sensitive intelligent drug delivery systems. Photochem. Photobiol. 2009, 85, 848–860. [Google Scholar] [CrossRef]
- Langer, R.; Peppas, N.A. Advances in biomaterials, drug delivery, and bionanotechnology. AIChE J. 2003, 49, 2990–3006. [Google Scholar] [CrossRef]
- Nigam, S.K. What do drug transporters really do? Nat. Rev. Drug Discov. 2015, 14, 29–44. [Google Scholar] [CrossRef] [Green Version]
- Goldberg, M.; Langer, R.; Jia, X. Nanostructured materials for applications in drug delivery and tissue engineering. J. Biomater. Sci. 2007, 18, 241–268. [Google Scholar] [CrossRef] [Green Version]
- Trucillo, P. Drug carriers: Classification, administration, release profiles, and industrial approach. Processes 2021, 9, 470. [Google Scholar] [CrossRef]
- Lutz, J.F. Polymerization of oligo (ethylene glycol)(meth) acrylates: Toward new generations of smart biocompatible materials. J. Polym. Sci. Part A Polym. Chem. 2008, 46, 3459–3470. [Google Scholar] [CrossRef]
- Langer, R. New methods of drug delivery. Science 1990, 249, 1527–1533. [Google Scholar] [CrossRef]
- Davoodi, P.; Lee, L.Y.; Xu, Q.; Sunil, V.; Sun, Y.; Soh, S.; Wang, C.H. Drug delivery systems for programmed and on-demand release. Adv. Drug Deliv. Rev. 2018, 132, 104–138. [Google Scholar] [CrossRef]
- Champion, J.A.; Katare, Y.K.; Mitragotri, S. Particle shape: A new design parameter for micro-and nanoscale drug delivery carriers. J. Control. Release 2007, 121, 3–9. [Google Scholar] [CrossRef] [Green Version]
- Champion, J.A.; Katare, Y.K.; Mitragotri, S. Making polymeric micro-and nanoparticles of complex shapes. Proc. Natl. Acad. Sci. USA 2007, 104, 11901–11904. [Google Scholar] [CrossRef] [Green Version]
- Holder, S.J.; Sommerdijk, N.A. New micellar morphologies from amphiphilic block copolymers: Disks, toroids and bicontinuous micelles. Polym. Chem. 2011, 2, 1018–1028. [Google Scholar] [CrossRef]
- Trucillo, P.; Campardelli, R.; Scognamiglio, M.; Reverchon, E. Control of liposomes diameter at micrometric and nanometric level using a supercritical assisted technique. J. CO2 Util. 2019, 32, 119–127. [Google Scholar] [CrossRef]
- Chen, Y.; Chen, N.; Feng, X. The role of internal and external stimuli in the rational design of skin-specific drug delivery systems. Int. J. Pharm. 2021, 592, 120081. [Google Scholar] [CrossRef]
- Fuller, E.G.; Sun, H.; Dhavalikar, R.D.; Unni, M.; Scheutz, G.M.; Sumerlin, B.S.; Rinaldi, C. Externally triggered heat and drug release from magnetically controlled nanocarriers. ACS Appl. Polym. Mater. 2019, 1, 211–220. [Google Scholar] [CrossRef]
- Choi, S.W.; Zhang, Y.; Xia, Y. A temperature-sensitive drug release system based on phase-change materials. Angew. Chem. Int. Ed. 2010, 49, 7904–7908. [Google Scholar] [CrossRef] [Green Version]
- Wu, W.; Zhang, Q.; Wang, J.; Chen, M.; Li, S.; Lin, Z.; Li, J. Tumor-targeted aggregation of pH-sensitive nanocarriers for enhanced retention and rapid intracellular drug release. Polym. Chem. 2014, 5, 5668–5679. [Google Scholar] [CrossRef]
- Luo, L.; Bian, Y.; Liu, Y.; Zhang, X.; Wang, M.; Xing, S.; Li, L.; Gao, D. Combined near infrared photothermal therapy and chemotherapy using gold nanoshells coated liposomes to enhance antitumor effect. Small 2016, 12, 4103–4112. [Google Scholar] [CrossRef]
- Huang, Y.; Jiang, Y.; Wang, H.; Wang, J.; Shin, M.C.; Byun, Y.; He, H.; Liang, Y.; Yang, V.C. Curb challenges of the “Trojan Horse” approach: Smart strategies in achieving effective yet safe cell-penetrating peptide-based drug delivery. Adv. Drug Deliv. Rev. 2013, 65, 1299–1315. [Google Scholar] [CrossRef] [Green Version]
- Casalini, T.; Rossi, F.; Lazzari, S.; Perale, G.; Masi, M. Mathematical modeling of PLGA microparticles: From polymer degradation to drug release. Mol. Pharm. 2014, 11, 4036–4048. [Google Scholar] [CrossRef]
- Yun, Y.H.; Lee, B.K.; Park, K. Controlled drug delivery: Historical perspective for the next generation. J. Control. Release 2015, 219, 2–7. [Google Scholar] [CrossRef] [Green Version]
- Bowers, L.D. Therapeutic monitoring for cyclosporine: Difficulties in establishing a therapeutic window. Clin. Biochem. 1991, 24, 81–87. [Google Scholar] [CrossRef]
- Hampton Atkinson, J.; Patel, S.M.; Meyer, J.M.; Slater, M.A.; Zisook, S.; Capparelli, E. Is there a therapeutic window with some antidepressants for analgesic response? Curr. Pain Headache Rep. 2009, 13, 93–99. [Google Scholar] [CrossRef]
- Khera, E.; Thurber, G.M. Pharmacokinetic and immunological considerations for expanding the therapeutic window of next-generation antibody–drug conjugates. BioDrugs 2018, 32, 465–480. [Google Scholar] [CrossRef]
- Williams, D.F. On the mechanisms of biocompatibility. Biomaterials 2008, 29, 2941–2953. [Google Scholar] [CrossRef]
- Kohane, D.S.; Langer, R. Biocompatibility and drug delivery systems. Chem. Sci. 2010, 1, 441–446. [Google Scholar] [CrossRef]
- Tsai, N.C.; Sue, C.Y. Review of MEMS-based drug delivery and dosing systems. Sens. Actuators A Phys. 2007, 134, 555–564. [Google Scholar] [CrossRef]
- Liepmann, D.; Pisano, A.P.; Sage, B. Microelectromechanical systems technology to deliver insulin. Diabetes Technol. Ther. 1999, 1, 469–476. [Google Scholar] [CrossRef]
- Hultström, M.; Roxhed, N.; Nordquist, L. Intradermal insulin delivery: A promising future for diabetes management. J. Diabetes Sci. Technol. 2014, 8, 453–457. [Google Scholar] [CrossRef] [Green Version]
- Trevitt, S.; Simpson, S.; Wood, A. Artificial pancreas device systems for the closed-loop control of type 1 diabetes: What systems are in development? J. Diabetes Sci. Technol. 2016, 10, 714–723. [Google Scholar] [CrossRef] [Green Version]
- Abrahams, E.; Ginsburg, G.S.; Silver, M. The personalized medicine coalition. Am. J. Pharm. 2005, 5, 345–355. [Google Scholar] [CrossRef] [PubMed]
- Patra, J.K.; Das, G.; Fraceto, L.F.; Campos, E.V.R.; Rodriguez-Torres, M.D.P.; Acosta-Torres, L.S.; Diaz-Torrez, L.A.; Grillo, R.; Swamy, K.M.K.; Sharma, S.; et al. Nano based drug delivery systems: Recent developments and future prospects. J. Nanobiotechnol. 2018, 16, 71. [Google Scholar] [CrossRef] [Green Version]
- Dan, N. Vesicle-based drug carriers: Liposomes, polymersomes, and niosomes. In Design and Development of New Nanocarriers; William Andrew Publishing: Norwich, NY, USA, 2018; pp. 1–55. [Google Scholar]
- Brandl, M. Liposomes as drug carriers: A technological approach. Biotechnol. Annu. Rev. 2001, 7, 59–85. [Google Scholar] [PubMed]
- Torchilin, V.P. Liposomes as targetable drug carriers. Crit. Rev. Ther. Drug Carr. Syst. 1985, 2, 65–115. [Google Scholar]
- Namdeo, A.; Jain, N.K. Niosomes as drug carriers. Indian J. Pharm. Sci. 1996, 58, 41–47. [Google Scholar]
- Shahiwala, A.; Misra, A. Studies in topical application of niosomally entrapped nimesulide. J. Pharm. Pharm. Sci. 2002, 5, 220–225. [Google Scholar] [PubMed]
- Wissing, S.A.; Kayser, O.; Müller, R.H. Solid lipid nanoparticles for parenteral drug delivery. Adv. Drug Deliv. Rev. 2004, 56, 1257–1272. [Google Scholar] [CrossRef] [PubMed]
- Lee, J.S.; Feijen, J. Polymersomes for drug delivery: Design, formation and characterization. J. Control. Release 2012, 161, 473–483. [Google Scholar] [CrossRef]
- Yu, C.Y.; Jia, L.H.; Yin, B.C.; Zhang, X.Z.; Cheng, S.X.; Zhuo, R.X. Fabrication of nanospheres and vesicles as drug carriers by self-assembly of alginate. J. Phys. Chem. C 2008, 112, 16774–16778. [Google Scholar] [CrossRef]
- Zhang, J.; Li, C.; Wang, Y.; Zhuo, R.X.; Zhang, X.Z. Controllable exploding microcapsules as drug carriers. Chem. Commun. 2011, 47, 4457–4459. [Google Scholar] [CrossRef]
- Ran, R.; Sun, Q.; Baby, T.; Wibowo, D.; Middelberg, A.P.; Zhao, C.X. Multiphase microfluidic synthesis of micro-and nanostructures for pharmaceutical applications. Chem. Eng. Sci. 2017, 169, 78–96. [Google Scholar] [CrossRef] [Green Version]
- Chakravarty, P.; Famili, A.; Nagapudi, K.; Al-Sayah, M.A. Using supercritical fluid technology as a green alternative during the preparation of drug delivery systems. Pharmaceutics 2019, 11, 629. [Google Scholar] [CrossRef] [PubMed] [Green Version]
- Lovskaya, D.D.; Lebedev, A.E.; Menshutina, N.V. Aerogels as drug delivery systems: In vitro and in vivo evaluations. J. Supercrit. Fluids 2015, 106, 115–121. [Google Scholar] [CrossRef]
- Ghasemiyeh, P.; Mohammadi-Samani, S. Hydrogels as drug delivery systems; pros and cons. Trends Pharm. Sci. 2019, 5, 7–24. [Google Scholar]
- Zhao, S.; Malfait, W.J.; Guerrero-Alburquerque, N.; Koebel, M.M.; Nyström, G. Biopolymer aerogels and foams: Chemistry, properties, and applications. Angew. Chem. Int. Ed. 2018, 57, 7580–7608. [Google Scholar] [CrossRef]
- Yousefi, M.; Narmani, A.; Jafari, S.M. Dendrimers as efficient nanocarriers for the protection and delivery of bioactive phytochemicals. Adv. Colloid Interface Sci. 2020, 278, 102125. [Google Scholar] [CrossRef]
- García-González, C.A.; Sosnik, A.; Kalmár, J.; De Marco, I.; Erkey, C.; Concheiro, A.; Alvarez-Lorenzo, C. Aerogels in drug delivery: From design to application. J. Control. Release 2021, 332, 40–63. [Google Scholar] [CrossRef]
- Tamarkin, D.; Friedman, D.; Shemer, A. Emollient foam in topical drug delivery. Expert Opin. Drug Deliv. 2006, 3, 799–807. [Google Scholar] [CrossRef]
- Trucillo, P.; Di Maio, E. Classification and Production of Polymeric Foams among the Systems for Wound Treatment. Polymers 2021, 13, 1608. [Google Scholar] [CrossRef]
- Marrazzo, C.; Maio, E.; Iannace, S. Foaming of synthetic and natural biodegradable polymers. J. Cell. Plast. 2007, 43, 123–133. [Google Scholar] [CrossRef]
- Marrazzo, C.; Di Maio, E.; Iannace, S.; Nicolais, L. Process-structure relationships in PCL foaming. J. Cell. Plast. 2008, 44, 37–52. [Google Scholar] [CrossRef]
- Iqbal, M.A.; Md, S.; Sahni, J.K.; Baboota, S.; Dang, S.; Ali, J. Nanostructured lipid carriers system: Recent advances in drug delivery. J. Drug Target. 2012, 20, 813–830. [Google Scholar] [CrossRef] [PubMed]
- Soares, J.S.; Zunino, P. A mixture model for water uptake, degradation, erosion and drug release from polydisperse polymeric networks. Biomaterials 2010, 31, 3032–3042. [Google Scholar] [PubMed]
- Raza, S.N.; Khan, N.A. Role of mathematical modelling in controlled release drug delivery. Int. J. Med. Res. Pharm. Sci 2017, 4, 84–95. [Google Scholar]
- Grassi, M.; Grassi, G. Mathematical modelling and controlled drug delivery: Matrix systems. Curr. Drug Deliv. 2005, 2, 97–116. [Google Scholar] [CrossRef] [PubMed]
- Zhang, Y.; Huo, M.; Zhou, J.; Zou, A.; Li, W.; Yao, C.; Xie, S. DDSolver: An add-in program for modeling and comparison of drug dissolution profiles. AAPS J. 2010, 12, 263–271. [Google Scholar]
- Arifin, D.Y.; Lee, L.Y.; Wang, C.H. Mathematical modeling and simulation of drug release from microspheres: Implications to drug delivery systems. Adv. Drug Deliv. Rev. 2006, 58, 1274–1325. [Google Scholar]
- Siepmann, J.; Siepmann, F. Mathematical modeling of drug delivery. Int. J. Pharm. 2008, 364, 328–343. [Google Scholar] [CrossRef]
- Siepmann, J.; Siegel, R.A.; Siepmann, F. Diffusion controlled drug delivery systems. In Fundamentals and Applications of Controlled Release Drug Delivery; Springer: Boston, MA, USA, 2012; pp. 127–152. [Google Scholar]
- Sripetch, S.; Loftsson, T. Topical drug delivery to the posterior segment of the eye: Thermodynamic considerations. Int. J. Pharm. 2021, 597, 120332. [Google Scholar] [CrossRef]
- Serra, L.; Doménech, J.; Peppas, N.A. Engineering design and molecular dynamics of mucoadhesive drug delivery systems as targeting agents. Eur. J. Pharm. Biopharm. 2009, 71, 519–528. [Google Scholar] [CrossRef] [Green Version]
- Siepmann, J.; Peppas, N.A. Modeling of drug release from delivery systems based on hydroxypropyl methylcellulose (HPMC). Adv. Drug Deliv. Rev. 2012, 64, 163–174. [Google Scholar] [CrossRef]
- Siepmann, J.; Peppas, N.A. Hydrophilic matrices for controlled drug delivery: An improved mathematical model to predict the resulting drug release kinetics (the “sequential layer” model). Pharm. Res. 2000, 17, 1290–1298. [Google Scholar] [CrossRef] [PubMed]
- Muschert, S.; Siepmann, F.; Leclercq, B.; Carlin, B.; Siepmann, J. Prediction of drug release from ethylcellulose coated pellets. J. Control. Release 2009, 135, 71–79. [Google Scholar] [CrossRef]
- Kedem, O.; Katchalsky, A. Thermodynamic analysis of the permeability of biological membranes to non-electrolytes. Biochim. Et Biophys. Acta 1958, 27, 229–246. [Google Scholar] [CrossRef]
- Peppas, N.A.; Narasimhan, B. Mathematical models in drug delivery: How modeling has shaped the way we design new drug delivery systems. J. Control. Release 2014, 190, 75–81. [Google Scholar] [CrossRef]
- Verma, R.K.; Mishra, B.; Garg, S. Osmotically controlled oral drug delivery. Drug Dev. Ind. Pharm. 2000, 26, 695–708. [Google Scholar] [CrossRef]
- Gupta, B.P.; Thakur, N.; Jain, N.P.; Banweer, J.; Jain, S. Osmotically controlled drug delivery system with associated drugs. J. Pharm. Pharm. Sci. 2010, 13, 571–588. [Google Scholar] [CrossRef] [Green Version]
- Paul, D.R. Elaborations on the Higuchi model for drug delivery. Int. J. Pharm. 2011, 418, 13–17. [Google Scholar] [CrossRef]
- Ramteke, K.H.; Dighe, P.A.; Kharat, A.R.; Patil, S.V. Mathematical models of drug dissolution: A review. Sch. Acad. J. Pharm. 2014, 3, 388–396. [Google Scholar]
- Singhvi, G.; Singh, M. In-vitro drug release characterization models. Int. J. Pharm. Stud. Res. 2011, 2, 77–84. [Google Scholar]
- Rehman, Q.; Akash, M.S.H.; Rasool, M.F.; Rehman, K. Role of Kinetic Models in Drug Stability. In Drug Stability and Chemical Kinetics; Springer: Singapore, 2020; pp. 155–165. [Google Scholar]
- Peppas, N.A. A model of dissolution-controlled solute release from porous drug delivery polymeric systems. J. Biomed. Mater. Res. 1983, 17, 1079–1087. [Google Scholar] [CrossRef] [PubMed]
- Campelo, P.; Neves-Moreira, F.; Amorim, P.; Almada-Lobo, B. Consistent vehicle routing problem with service level agreements: A case study in the pharmaceutical distribution sector. Eur. J. Oper. Res. 2009, 273, 131–145. [Google Scholar] [CrossRef]
- Colombo, P.; Bettini, R.; Santi, P.; Peppas, N.A. Swellable matrices for controlled drug delivery: Gel-layer behaviour, mechanisms and optimal performance. Pharm. Sci. Technol. Today 2000, 3, 198–204. [Google Scholar] [CrossRef]
- Peppas, N.A.; Sahlin, J.J. A simple equation for the description of solute release. III. Coupling of diffusion and relaxation. Int. J. Pharm. 1989, 57, 169–172. [Google Scholar] [CrossRef]
- Kiortsis, S.; Kachrimanis, K.; Broussali, T.; Malamataris, S. Drug release from tableted wet granulations comprising cellulosic (HPMC or HPC) and hydrophobic component. Eur. J. Pharm. Biopharm. 2005, 59, 73–83. [Google Scholar] [CrossRef]
- Paarakh, M.P.; Jose, P.A.; Setty, C.M.; Christoper, G.P. Release kinetics–concepts and applications. Int. J. Pharm. Res. Technol. 2018, 8, 12–20. [Google Scholar]
- Adrover, M.E.; Pedernera, M.; Bonne, M.; Lebeau, B.; Bucalá, V.; Gallo, L. Synthesis and characterization of mesoporous SBA-15 and SBA-16 as carriers to improve albendazole dissolution rate. Saudi Pharm. J. 2020, 28, 15–24. [Google Scholar] [CrossRef]
- Bhardwaj, S.B.; Shukla, A.J.; Collins, C.C. Effect of varying drug loading on particle size distribution and drug release kinetics of verapamil hydrochloride microspheres prepared with cellulose esters. J. Microencapsul. 1995, 12, 71–81. [Google Scholar] [CrossRef]
- Hopfenberg, H.B. Membranes. In Polymers in Medicine and Surgery; Springer: Boston, MA, USA, 1975; pp. 99–107. [Google Scholar]
- Katzhendler, I.; Hoffman, A.; Goldberger, A.; Friedman, M. Modeling of drug release from erodible tablets. J. Pharm. Sci. 1997, 86, 110–115. [Google Scholar] [CrossRef]
- Corrigan, O.I.; Li, X. Quantifying drug release from PLGA nanoparticulates. Eur. J. Pharm. Sci. 2009, 37, 477–485. [Google Scholar] [CrossRef]
- Coughlan, D.C.; Quilty, F.P.; Corrigan, O.I. Effect of drug physicochemical properties on swelling/deswelling kinetics and pulsatile drug release from thermoresponsive poly (N-isopropylacrylamide) hydrogels. J. Control. Release 2004, 98, 97–114. [Google Scholar] [CrossRef] [PubMed]
- Fitzgerald, J.F.; Corrigan, O.I. Mechanisms governing drug release from poly-α-hydroxy aliphatic esters: Diltiazem base release from poly-lactide-co-glycolide delivery systems. Polym. Deliv. Syst. 1993, 23, 311–326. [Google Scholar]
- Papadopoulou, V.; Kosmidis, K.; Vlachou, M.; Macheras, P. On the use of the Weibull function for the discernment of drug release mechanisms. Int. J. Pharm. 2006, 309, 44–50. [Google Scholar] [CrossRef] [PubMed]
- Kosmidis, K.; Argyrakis, P.; Macheras, P. A reappraisal of drug release laws using Monte Carlo simulations: The prevalence of the Weibull function. Pharm. Res. 2003, 20, 988–995. [Google Scholar] [CrossRef]
- Ghosal, K.; Chandra, A.; Rajabalaya, R.; Chakraborty, S.; Nanda, A. Mathematical modeling of drug release profiles for modified hydrophobic HPMC based gels. Die Pharm.-Int. J. Pharm. Sci. 2012, 67, 147–155. [Google Scholar]
- Sivak, W.N.; Zhang, J.; Petoud, S.; Beckman, E.J. Simultaneous drug release at different rates from biodegradable polyurethane foams. Acta Biomater. 2009, 5, 2398–2408. [Google Scholar] [CrossRef]
- Sivak, W.N. Synthesis and Characterization of Novel Polyurethane Drug Delivery Systems. Ph.D. Thesis, University of Pittsburgh, Pittsburgh, PA, USA, 2007. [Google Scholar]
- Cherng, J.Y.; Hou, T.Y.; Shih, M.F.; Talsma, H.; Hennink, W.E. Polyurethane-based drug delivery systems. Int. J. Pharm. 2013, 450, 145–162. [Google Scholar] [CrossRef]
- De Geest, B.G.; Mehuys, E.; Laekeman, G.; Demeester, J.; De Smedt, S.C. Pulsed drug delivery. Expert Opin. Drug Deliv. 2006, 3, 459–462. [Google Scholar] [CrossRef]
- Marin, A.; Muniruzzaman, M.; Rapoport, N. Acoustic activation of drug delivery from polymeric micelles: Effect of pulsed ultrasound. J. Control. Release 2001, 71, 239–249. [Google Scholar] [CrossRef]
- Kikuchi, A.; Okano, T. Pulsatile drug release control using hydrogels. Adv. Drug Deliv. Rev. 2002, 54, 53–77. [Google Scholar] [CrossRef]
- Göpferich, A. Mechanisms of polymer degradation and erosion. In The Biomaterials: Silver Jubilee Compendium; Elsevier: Amsrerdam, The Netherlands, 1996; pp. 117–128. [Google Scholar]
- Zhu, X.; Braatz, R.D. A mechanistic model for drug release in PLGA biodegradable stent coatings coupled with polymer degradation and erosion. J. Biomed. Mater. Res. Part A 2015, 103, 2269–2279. [Google Scholar] [CrossRef] [PubMed] [Green Version]
- Göpferich, A.; Tessmar, J. Polyanhydride degradation and erosion. Adv. Drug Deliv. Rev. 2002, 54, 911–931. [Google Scholar] [CrossRef]
- Sevim, K.; Pan, J. A model for hydrolytic degradation and erosion of biodegradable polymers. Acta Biomater. 2018, 66, 192–199. [Google Scholar] [CrossRef] [PubMed] [Green Version]
- Lao, L.L.; Peppas, N.A.; Boey, F.Y.C.; Venkatraman, S.S. Modeling of drug release from bulk-degrading polymers. Int. J. Pharm. 2011, 418, 28–41. [Google Scholar] [CrossRef] [PubMed]
- Siepmann, J.; Faisant, N.; Akiki, J.; Richard, J.; Benoit, J.P. Effect of the size of biodegradable microparticles on drug release: Experiment and theory. J. Control. Release 2004, 96, 123–134. [Google Scholar] [CrossRef] [PubMed]
- Batycky, R.P.; Hanes, J.; Langer, R.; Edwards, D.A. A theoretical model of erosion and macromolecular drug release from biodegrading microspheres. J. Pharm. Sci. 1997, 86, 1464–1477. [Google Scholar] [CrossRef]
- Guo, Q.; Knight, P.T.; Mather, P.T. Tailored drug release from biodegradable stent coatings based on hybrid polyurethanes. J. Control. Release 2009, 137, 224–233. [Google Scholar] [CrossRef]
- Siegel, R.A.; Rathbone, M.J. Overview of controlled release mechanisms. Fundam. Appl. Control. Release Drug Deliv. 2012, 2, 19–43. [Google Scholar]
- Bajpai, A.K.; Shukla, S.K.; Bhanu, S.; Kankane, S. Responsive polymers in controlled drug delivery. Prog. Polym. Sci. 2008, 33, 1088–1118. [Google Scholar] [CrossRef]
- Hotha, K.K.; Roychowdhury, S.; Subramanian, V. Drug-excipient interactions: Case studies and overview of drug degradation pathways. Am. J. Anal. Chem. 2016, 7, 107–140. [Google Scholar] [CrossRef] [Green Version]
- von Ahn, A.; Dallegrave, A.; dos Santos, J.H.Z. Evaluation of the Cefalexin Drug Degradation Profile in Pharmaceutical Capsule Forms Based on Forced Degradation Studies. Chromatographia 2022, 85, 263–279. [Google Scholar] [CrossRef]
- Prabhu, S.; Hossainy, S. Modeling of degradation and drug release from a biodegradable stent coating. J. Biomed. Mater. Res. Part A 2007, 80, 732–741. [Google Scholar] [CrossRef] [PubMed]
- Hurrell, S.; Cameron, R.E. The effect of initial polymer morphology on the degradation and drug release from polyglycolide. Biomaterials 2002, 23, 2401–2409. [Google Scholar] [CrossRef]
- Di Colo, G. Controlled drug release from implantable matrices based on hydrophobia polymers. Biomaterials 1992, 13, 850–856. [Google Scholar] [CrossRef]
- Weaver, J.C.; Vaughan, T.E.; Chizmadzhev, Y. Theory of electrical creation of aqueous pathways across skin transport barriers. Adv. Drug Deliv. Rev. 1999, 35, 21–39. [Google Scholar] [CrossRef]
- Wischke, C.; Behl, M.; Lendlein, A. Drug-releasing shape-memory polymers–the role of morphology, processing effects, and matrix degradation. Expert Opin. Drug Deliv. 2013, 10, 1193–1205. [Google Scholar] [CrossRef]
- Visan, A.I.; Popescu-Pelin, G.; Socol, G. Degradation Behavior of Polymers Used as Coating Materials for Drug Delivery—A Basic Review. Polymers 2021, 13, 1272. [Google Scholar] [CrossRef]
- Proikakis, C.S.; Mamouzelos, N.J.; Tarantili, P.A.; Andreopoulos, A.G. Swelling and hydrolytic degradation of poly (D, L-lactic acid) in aqueous solutions. Polym. Degrad. Stab. 2006, 91, 614–619. [Google Scholar] [CrossRef]
- Kaunisto, E.; Marucci, M.; Borgquist, P.; Axelsson, A. Mechanistic modelling of drug release from polymer-coated and swelling and dissolving polymer matrix systems. Int. J. Pharm. 2011, 418, 54–77. [Google Scholar] [CrossRef]
- Rizwan, M.I.; Damodharan, N. Mathematical modelling of dissolution kinetics in dosage forms. Res. J. Pharm. Technol. 2020, 13, 1339–1345. [Google Scholar]
- Rossi, F.; Castiglione, F.; Ferro, M.; Moioli, M.; Mele, A.; Masi, M. The role of drug–drug interactions in hydrogel delivery systems: Experimental and model study. ChemPhysChem 2016, 17, 1615–1622. [Google Scholar] [CrossRef] [PubMed]
- Iftime, M.M.; Dobreci, D.L.; Irimiciuc, S.A.; Agop, M.; Petrescu, T.; Doroftei, B. A theoretical mathematical model for assessing diclofenac release from chitosan-based formulations. Drug Deliv. 2020, 27, 1125–1133. [Google Scholar] [CrossRef] [PubMed]
- Clercq, S.; Temelli, F.; Badens, E. In-Depth Study of Cyclodextrin Complexation with Carotenoids toward the Formation of Enhanced Delivery Systems. Mol. Pharm. 2021, 18, 1720–1729. [Google Scholar] [CrossRef] [PubMed]
- Comin, L.M.; Temelli, F.; Saldaña, M.D. Barley β-glucan aerogels as a carrier for flax oil via supercritical CO2. J. Food Eng. 2012, 111, 625–631. [Google Scholar] [CrossRef]
- Zhao, L.; Temelli, F. Preparation of liposomes using supercritical carbon dioxide via depressurization of the supercritical phase. J. Food Eng. 2015, 158, 104–112. [Google Scholar] [CrossRef]
- Zhao, L.; Temelli, F.; Curtis, J.M.; Chen, L. Encapsulation of lutein in liposomes using supercritical carbon dioxide. Food Res. Int. 2017, 100, 168–179. [Google Scholar] [CrossRef]
- Li, X.; Sun, H.; Li, H.; Hu, C.; Luo, Y.; Shi, X.; Pich, A. Multi-Responsive Biodegradable Cationic Nanogels for Highly Efficient Treatment of Tumors. Adv. Funct. Mater. 2021, 31, 2100227. [Google Scholar] [CrossRef]
- Liang, K.; Li, Z.; Luo, Y.; Zhang, Q.; Yin, F.; Xu, L.; Chwen, H.; Wang, H. Intelligent Nanocomposites with Intrinsic Blood–Brain-Barrier Crossing Ability Designed for Highly Specific MR Imaging and Sonodynamic Therapy of Glioblastoma. Small 2020, 16, 1906985. [Google Scholar] [CrossRef]
- Trucillo, P.; Martino, M.; Reverchon, E. Supercritical Assisted Production of Lutein-Loaded Liposomes and Modelling of Drug Release. Processes 2021, 9, 1162. [Google Scholar] [CrossRef]
- Sharmeen, S.; Rahman, A.M.; Lubna, M.M.; Salem, K.S.; Islam, R.; Khan, M.A. Polyethylene glycol functionalized carbon nanotubes/gelatin-chitosan nanocomposite: An approach for significant drug release. Bioact. Mater. 2018, 3, 236–244. [Google Scholar] [CrossRef]
- Salgado, M.; Santos, F.; Rodríguez-Rojo, S.; Reis, R.L.; Duarte, A.R.C.; Cocero, M.J. Development of barley and yeast β-glucan aerogels for drug delivery by supercritical fluids. J. CO2 Util. 2017, 22, 262–269. [Google Scholar] [CrossRef]
- Haghiralsadat, F.; Amoabediny, G.; Helder, M.N.; Naderinezhad, S.; Sheikhha, M.H.; Forouzanfar, T.; Zandieh-Doulabi, B. A comprehensive mathematical model of drug release kinetics from nano-liposomes, derived from optimization studies of cationic PEGylated liposomal doxorubicin formulations for drug-gene delivery. Artif. Cells Nanomed. Biotechnol. 2018, 46, 169–177. [Google Scholar] [CrossRef] [PubMed] [Green Version]
- Drakoulas, G.; Kokkinos, C.; Fotiadis, D.; Kokkinos, S.; Loukas, K.; Moulas, A.N.; Semertzioglou, A. Coupled FEA Model with Continuum Damage Mechanics for the Degradation of Polymer-based coatings on Drug-Eluting Stents. In Proceedings of the 43rd Annual International Conference of the IEEE Engineering in Medicine & Biology Society, Virtual, 30 October–5 November 2021; pp. 4319–4323. [Google Scholar]
- Yang, Z.; Luo, Y.; Hu, Y.; Liang, K.; He, G.; Chen, Q.; Wang, Q.; Chen, H. Photothermo-Promoted Nanocatalysis Combined with H2S-Mediated Respiration Inhibition for Efficient Cancer Therapy. Adv. Funct. Mater. 2021, 31, 2007991. [Google Scholar] [CrossRef]
- Li, J.; Yu, X.; Jiang, Y.; He, S.; Zhang, Y.; Luo, Y.; Pu, K. Second near-infrared photothermal semiconducting polymer nanoadjuvant for enhanced cancer immunotherapy. Adv. Mater. 2021, 33, 2003458. [Google Scholar] [CrossRef] [PubMed]
- Sun, H.; Yu, T.; Li, X.; Lei, Y.; Li, J.; Wang, X.; Peng, P.; Ni, D.; Wang, X.; Luo, Y. Second near-infrared photothermal-amplified immunotherapy using photoactivatable composite nanostimulators. J. Nanobiotechnol. 2021, 19, 433. [Google Scholar] [CrossRef]
- Zhang, C.; He, S.; Zeng, Z.; Cheng, P.; Pu, K. Smart Nano-PROTACs Reprogram Tumor Microenvironment for Activatable Photo-metabolic Cancer Immunotherapy. Angew. Chem. 2022, 61, e202114957. [Google Scholar]
- Sun, X.; Agate, S.; Salem, K.S.; Lucia, L.; Pal, L. Hydrogel-based sensor networks: Compositions, properties, and applications—A review. ACS Appl. Bio. Mater. 2000, 4, 140–162. [Google Scholar] [CrossRef]
- Dash, S.; Murthy, P.N.; Nath, L.; Chowdhury, P. Kinetic modeling on drug release from controlled drug delivery systems. Acta Pol. Pharm. 2010, 67, 217–223. [Google Scholar]
- Elmas, A.; Akyüz, G.; Bergal, A.; Andaç, M.; Andac, O. Mathematical modelling of drug release. Res. Eng. Struct. Mater. 2000, 6, 63–86. [Google Scholar] [CrossRef]
- Quiño, J.; Franke, K.; Ivanova, M.; Kareth, S.; Petermann, M.; Braeuer, A.S. In situ measurement of drug transport in porous silica gel. Microporous Mesoporous Mater. 2018, 260, 17–23. [Google Scholar] [CrossRef]
- Badens, E.; Masmoudi, Y.; Mouahid, A.; Crampon, C. Current situation and perspectives in drug formulation by using supercritical fluid technology. J. Supercrit. Fluids 2018, 134, 274–283. [Google Scholar] [CrossRef] [Green Version]
- Bouledjouidja, A.; Masmoudi, Y.; Sergent, M.; Trivedi, V.; Meniai, A.; Badens, E. Drug loading of foldable commercial intraocular lenses using supercritical impregnation. Int. J. Pharm. 2016, 500, 85–99. [Google Scholar] [CrossRef] [PubMed]
- Metwally, A.A.; Hathout, R.M. Computer-assisted drug formulation design: Novel approach in drug delivery. Mol. Pharm. 2015, 12, 2800–2810. [Google Scholar] [CrossRef] [PubMed]
- Mizera, M.; Muratov, E.N.; Alves, V.M.; Tropsha, A.; Cielecka-Piontek, J. Computer-aided discovery of new solubility-enhancing drug delivery system. Biomolecules 2020, 10, 913. [Google Scholar] [CrossRef]
- Piotto, S.; Di Biasi, L.; Fino, R.; Parisi, R.; Sessa, L. Yada: A novel tool for molecular docking calculations. J. Comput.-Aided Mol. Des. 2016, 30, 753–759. [Google Scholar] [CrossRef]

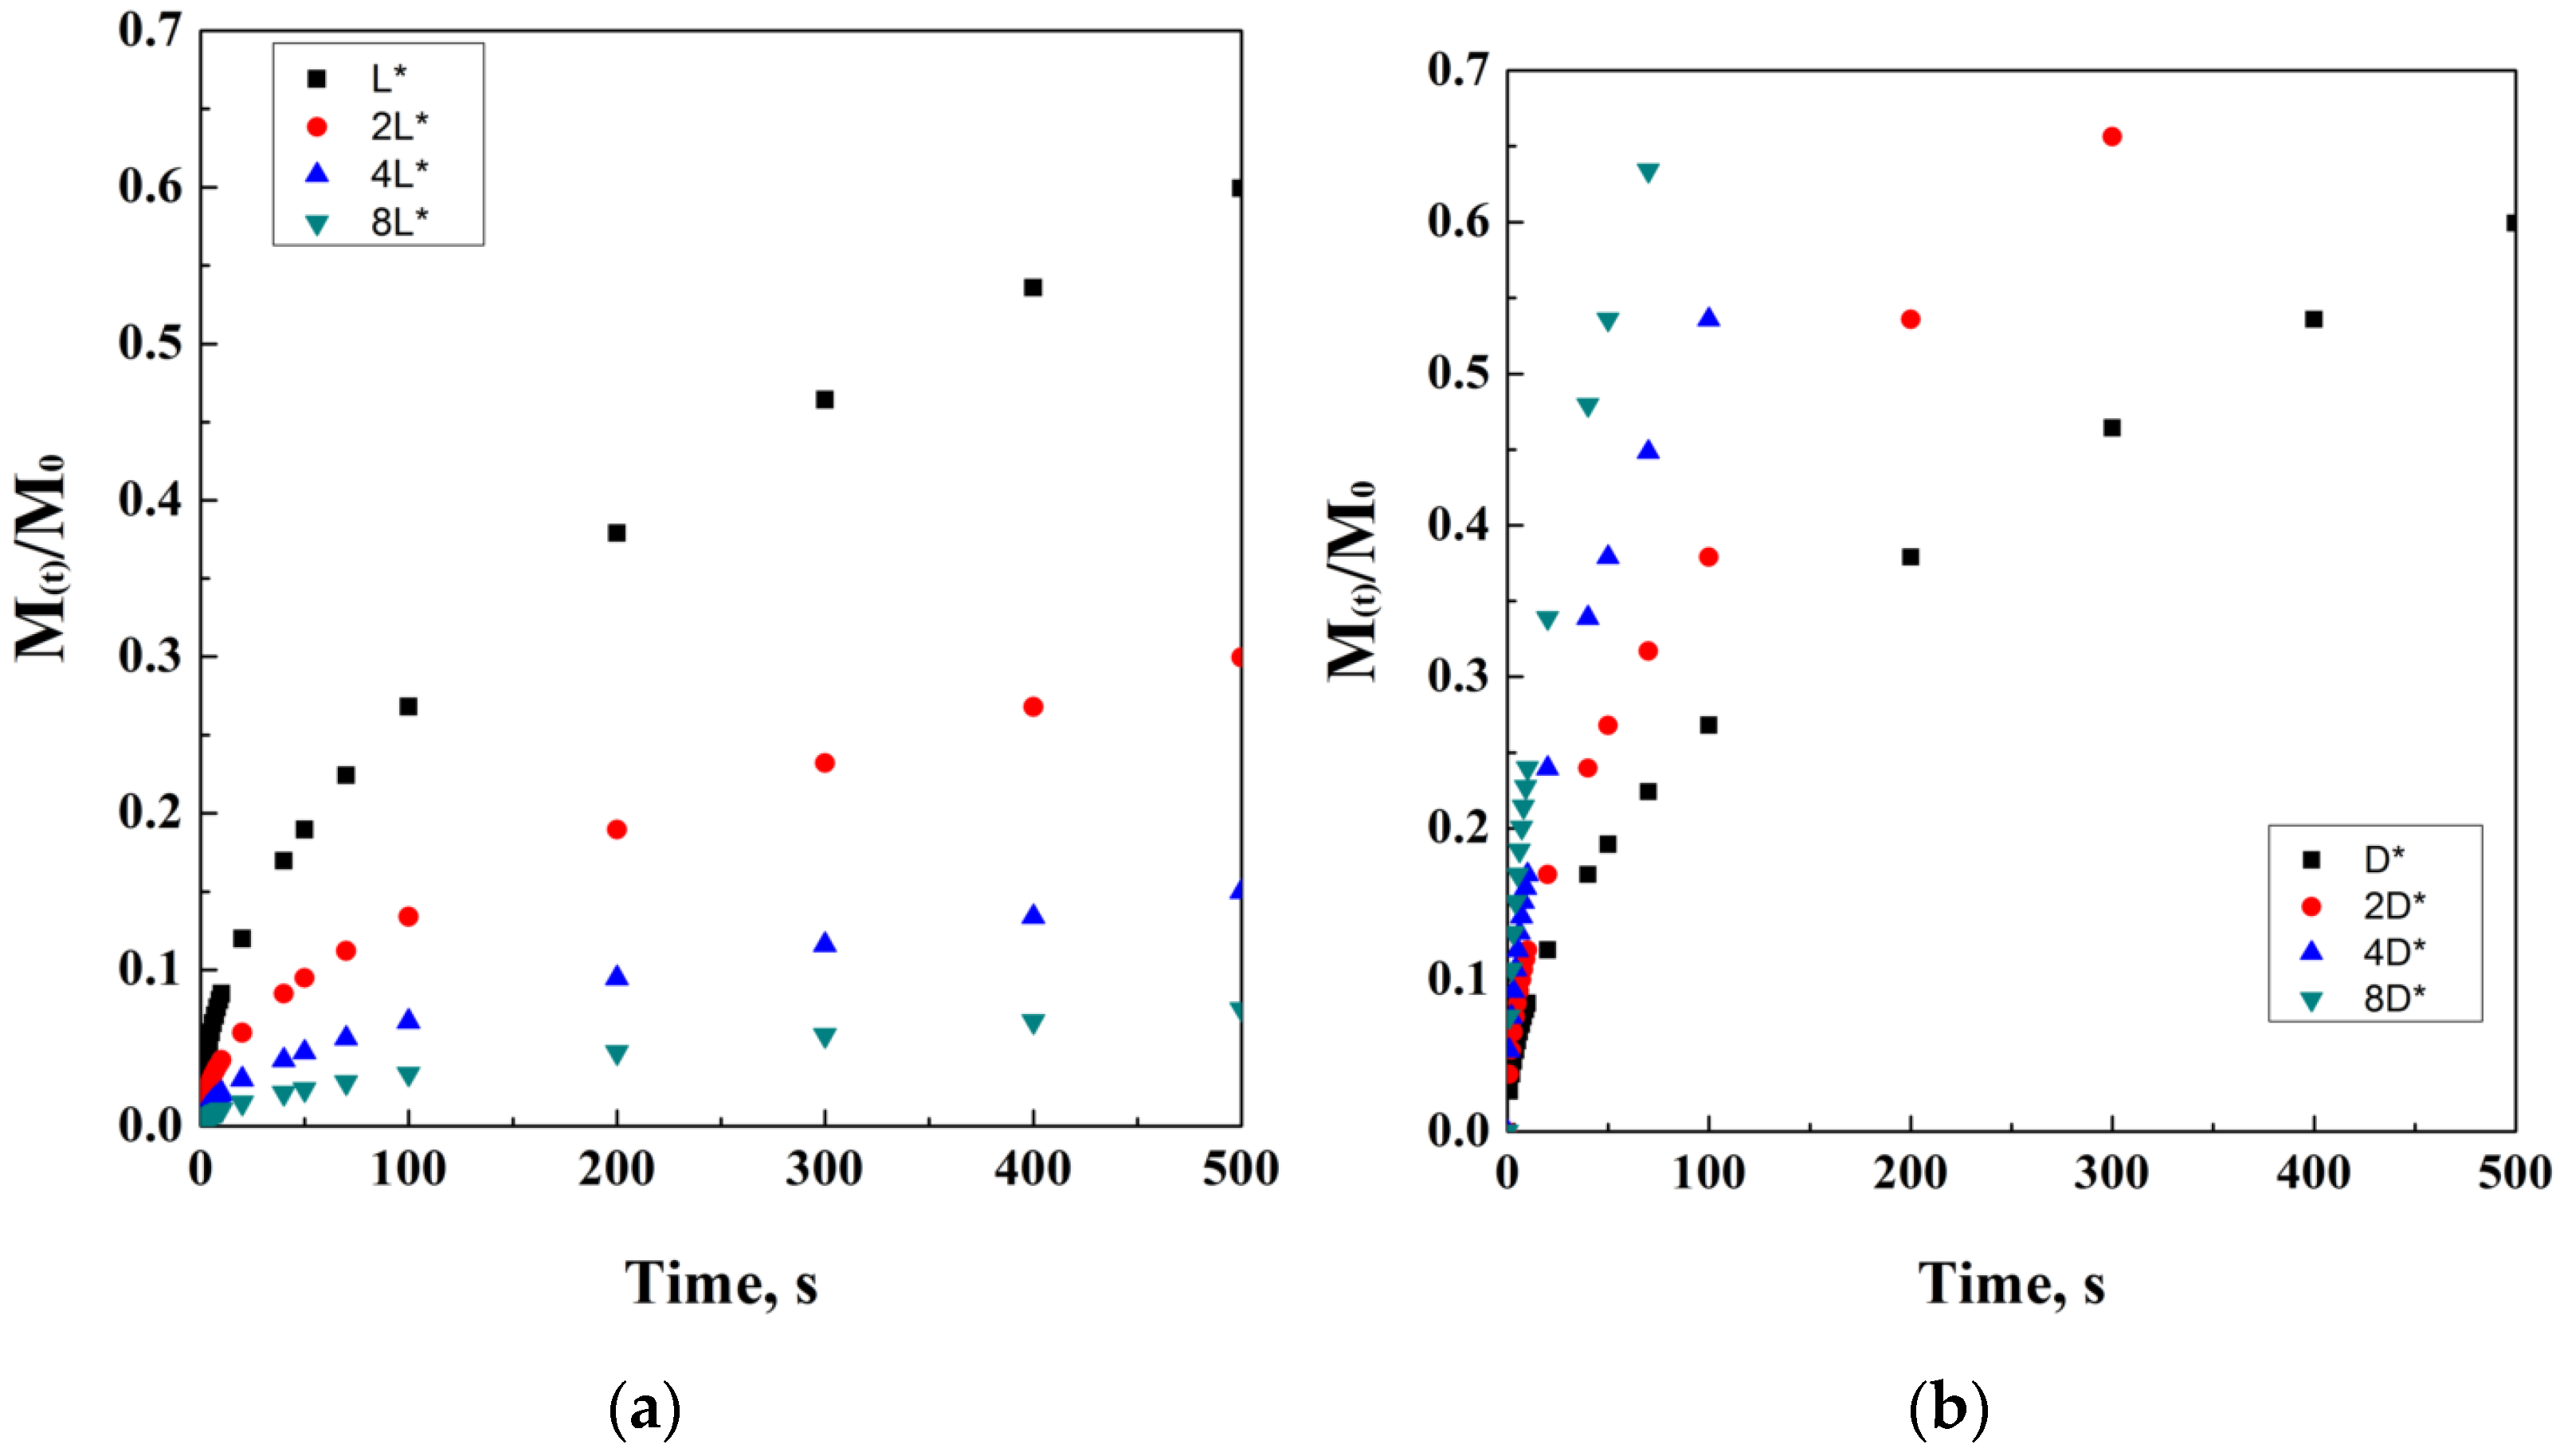
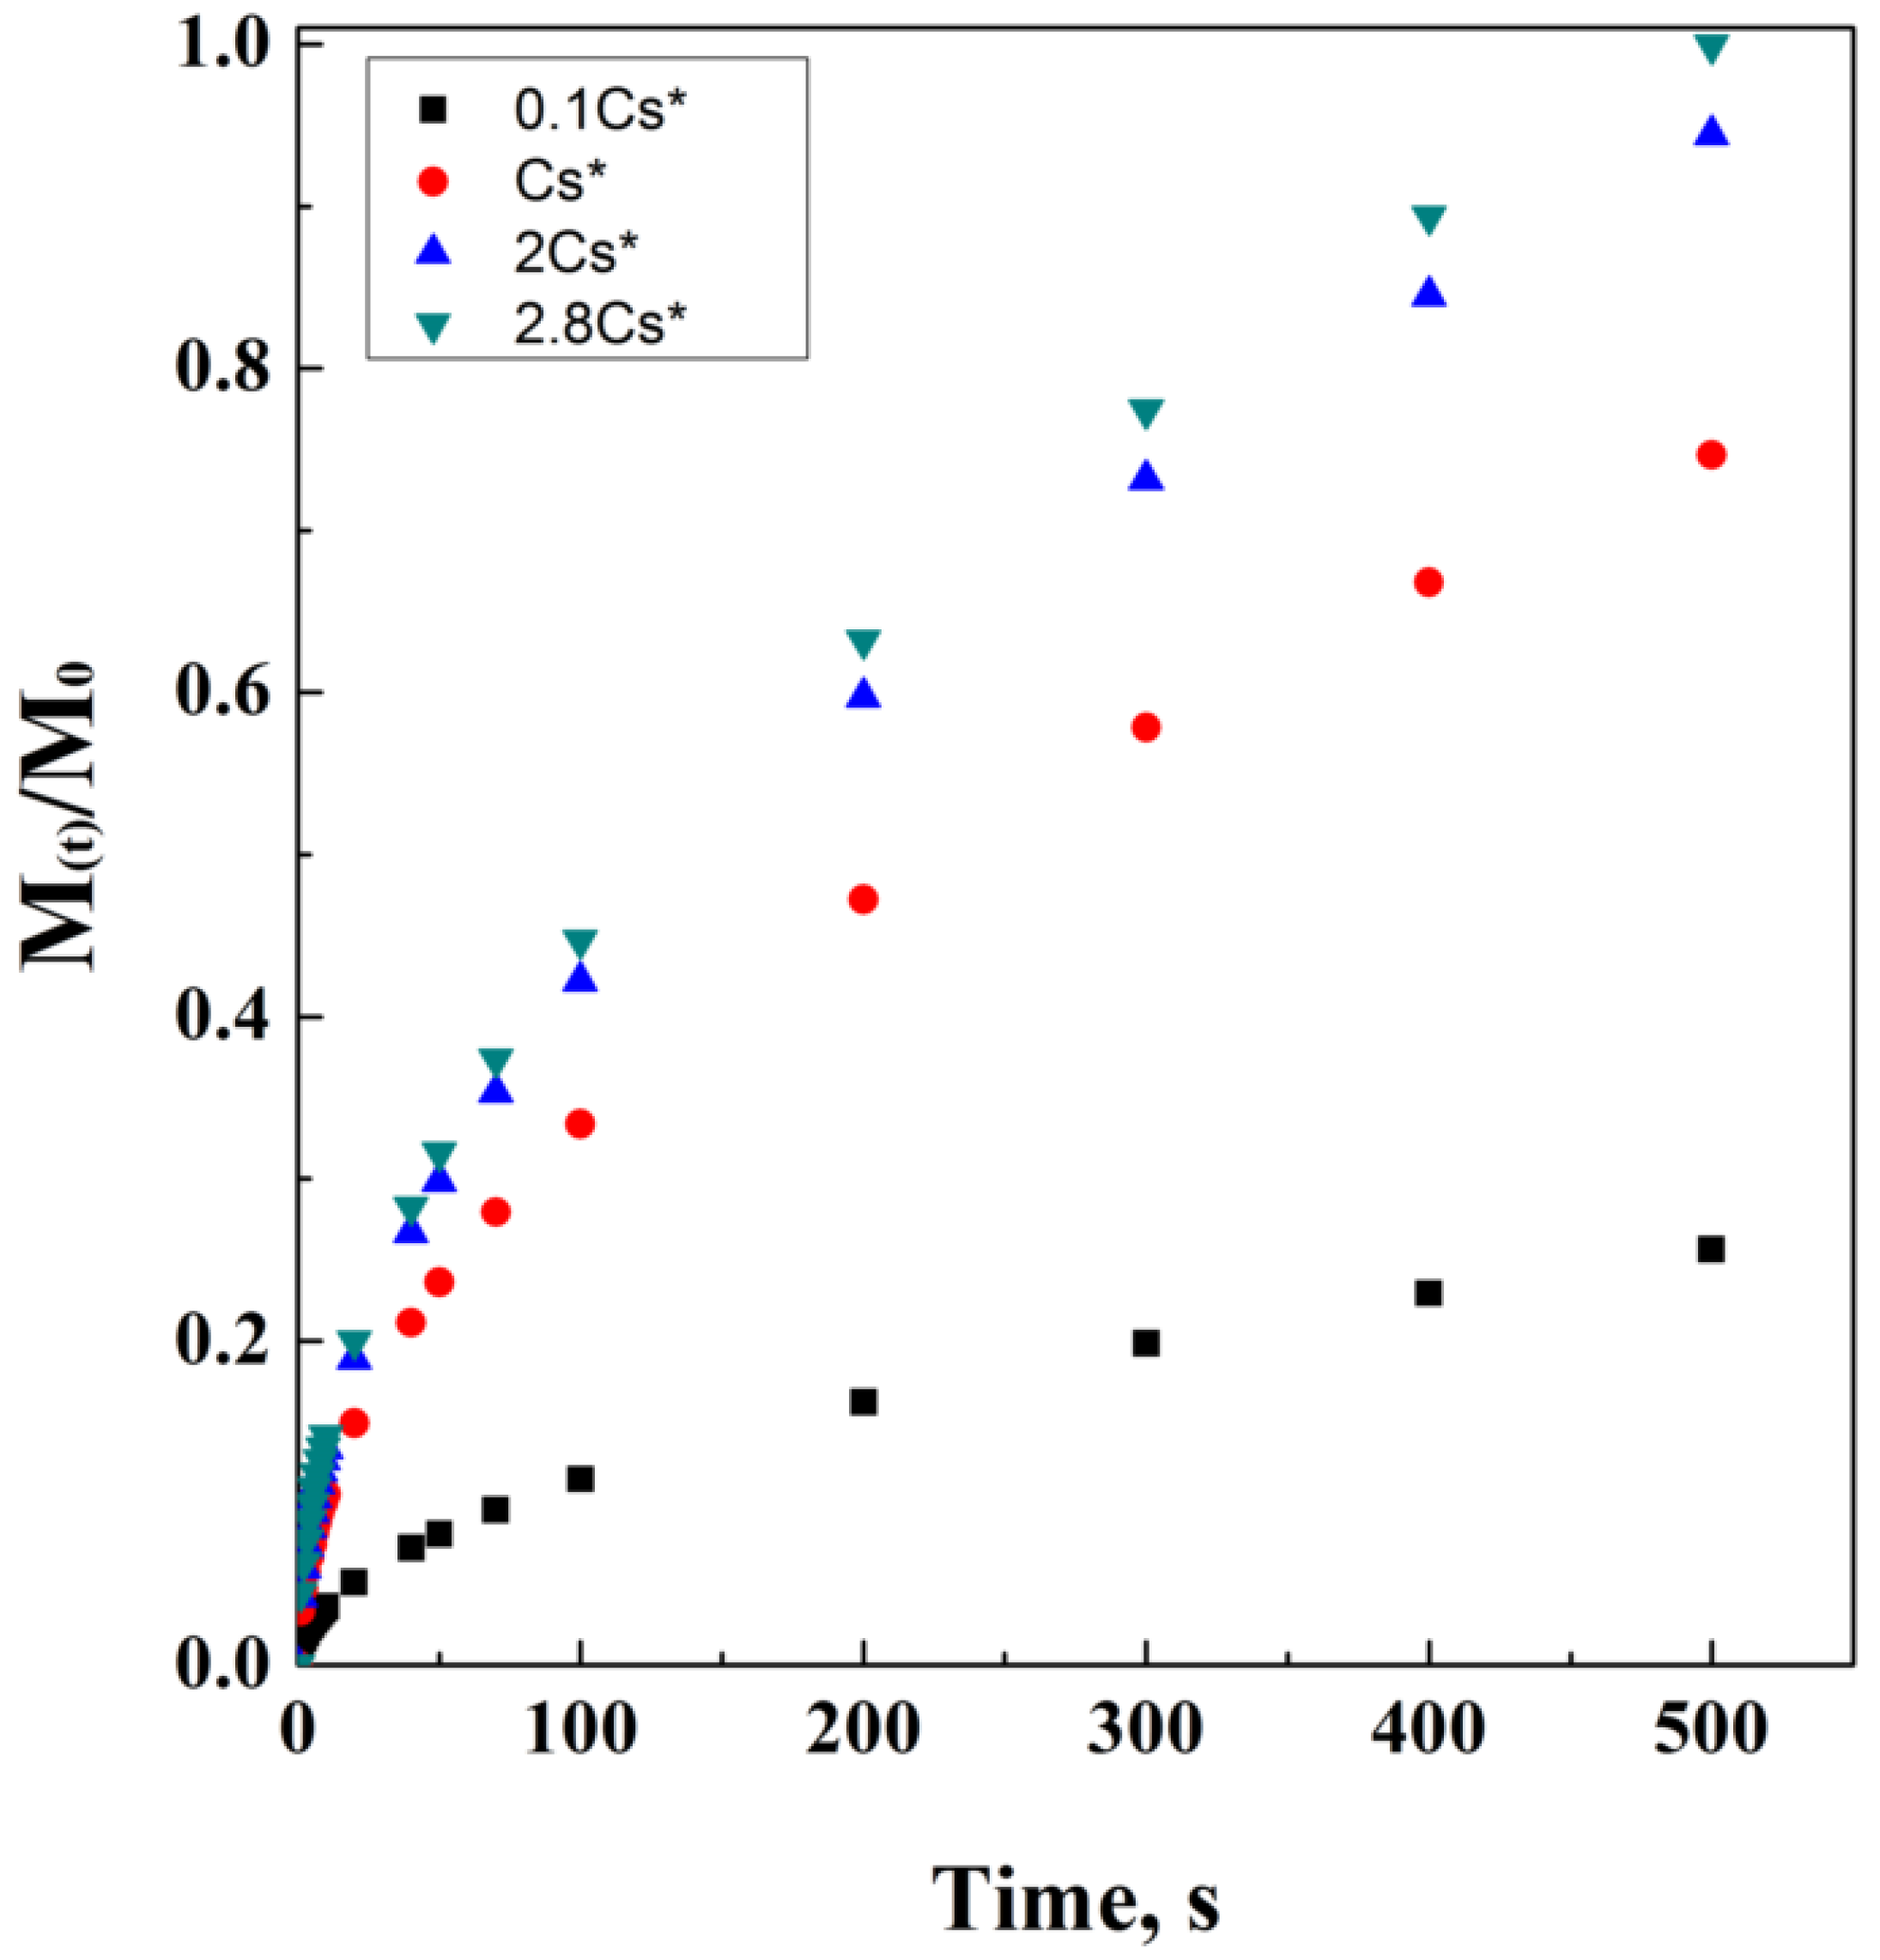
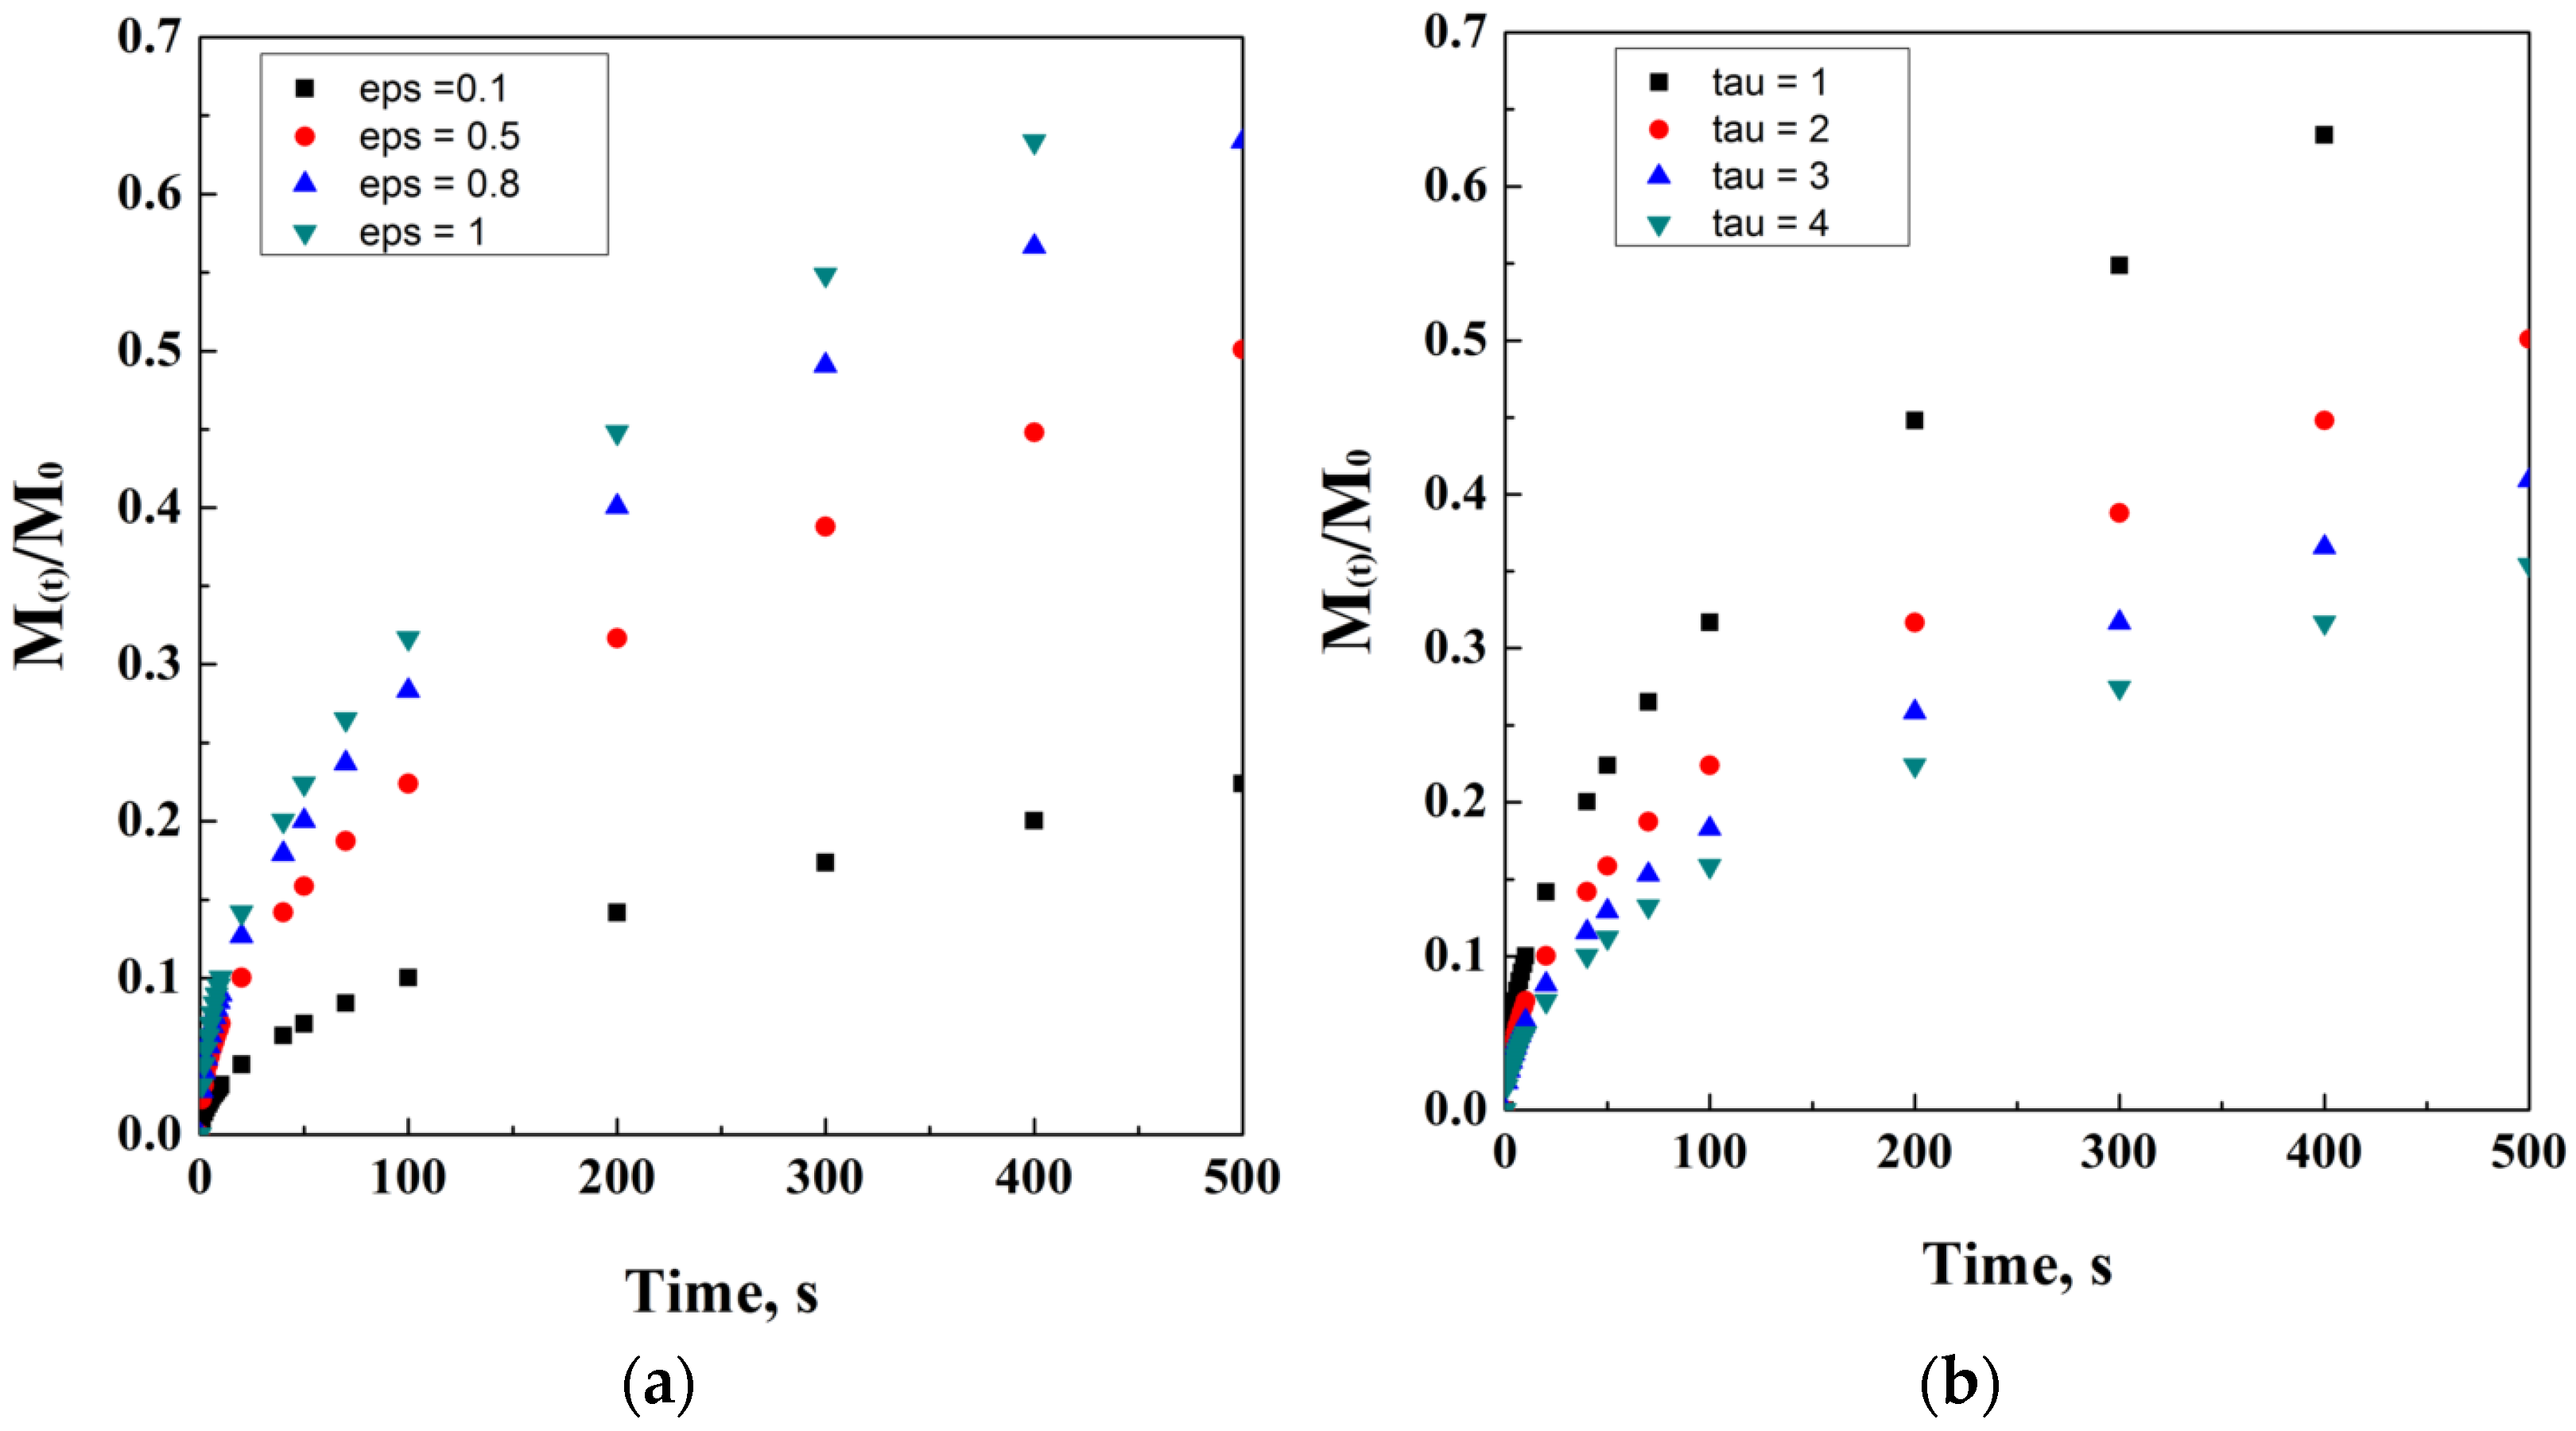
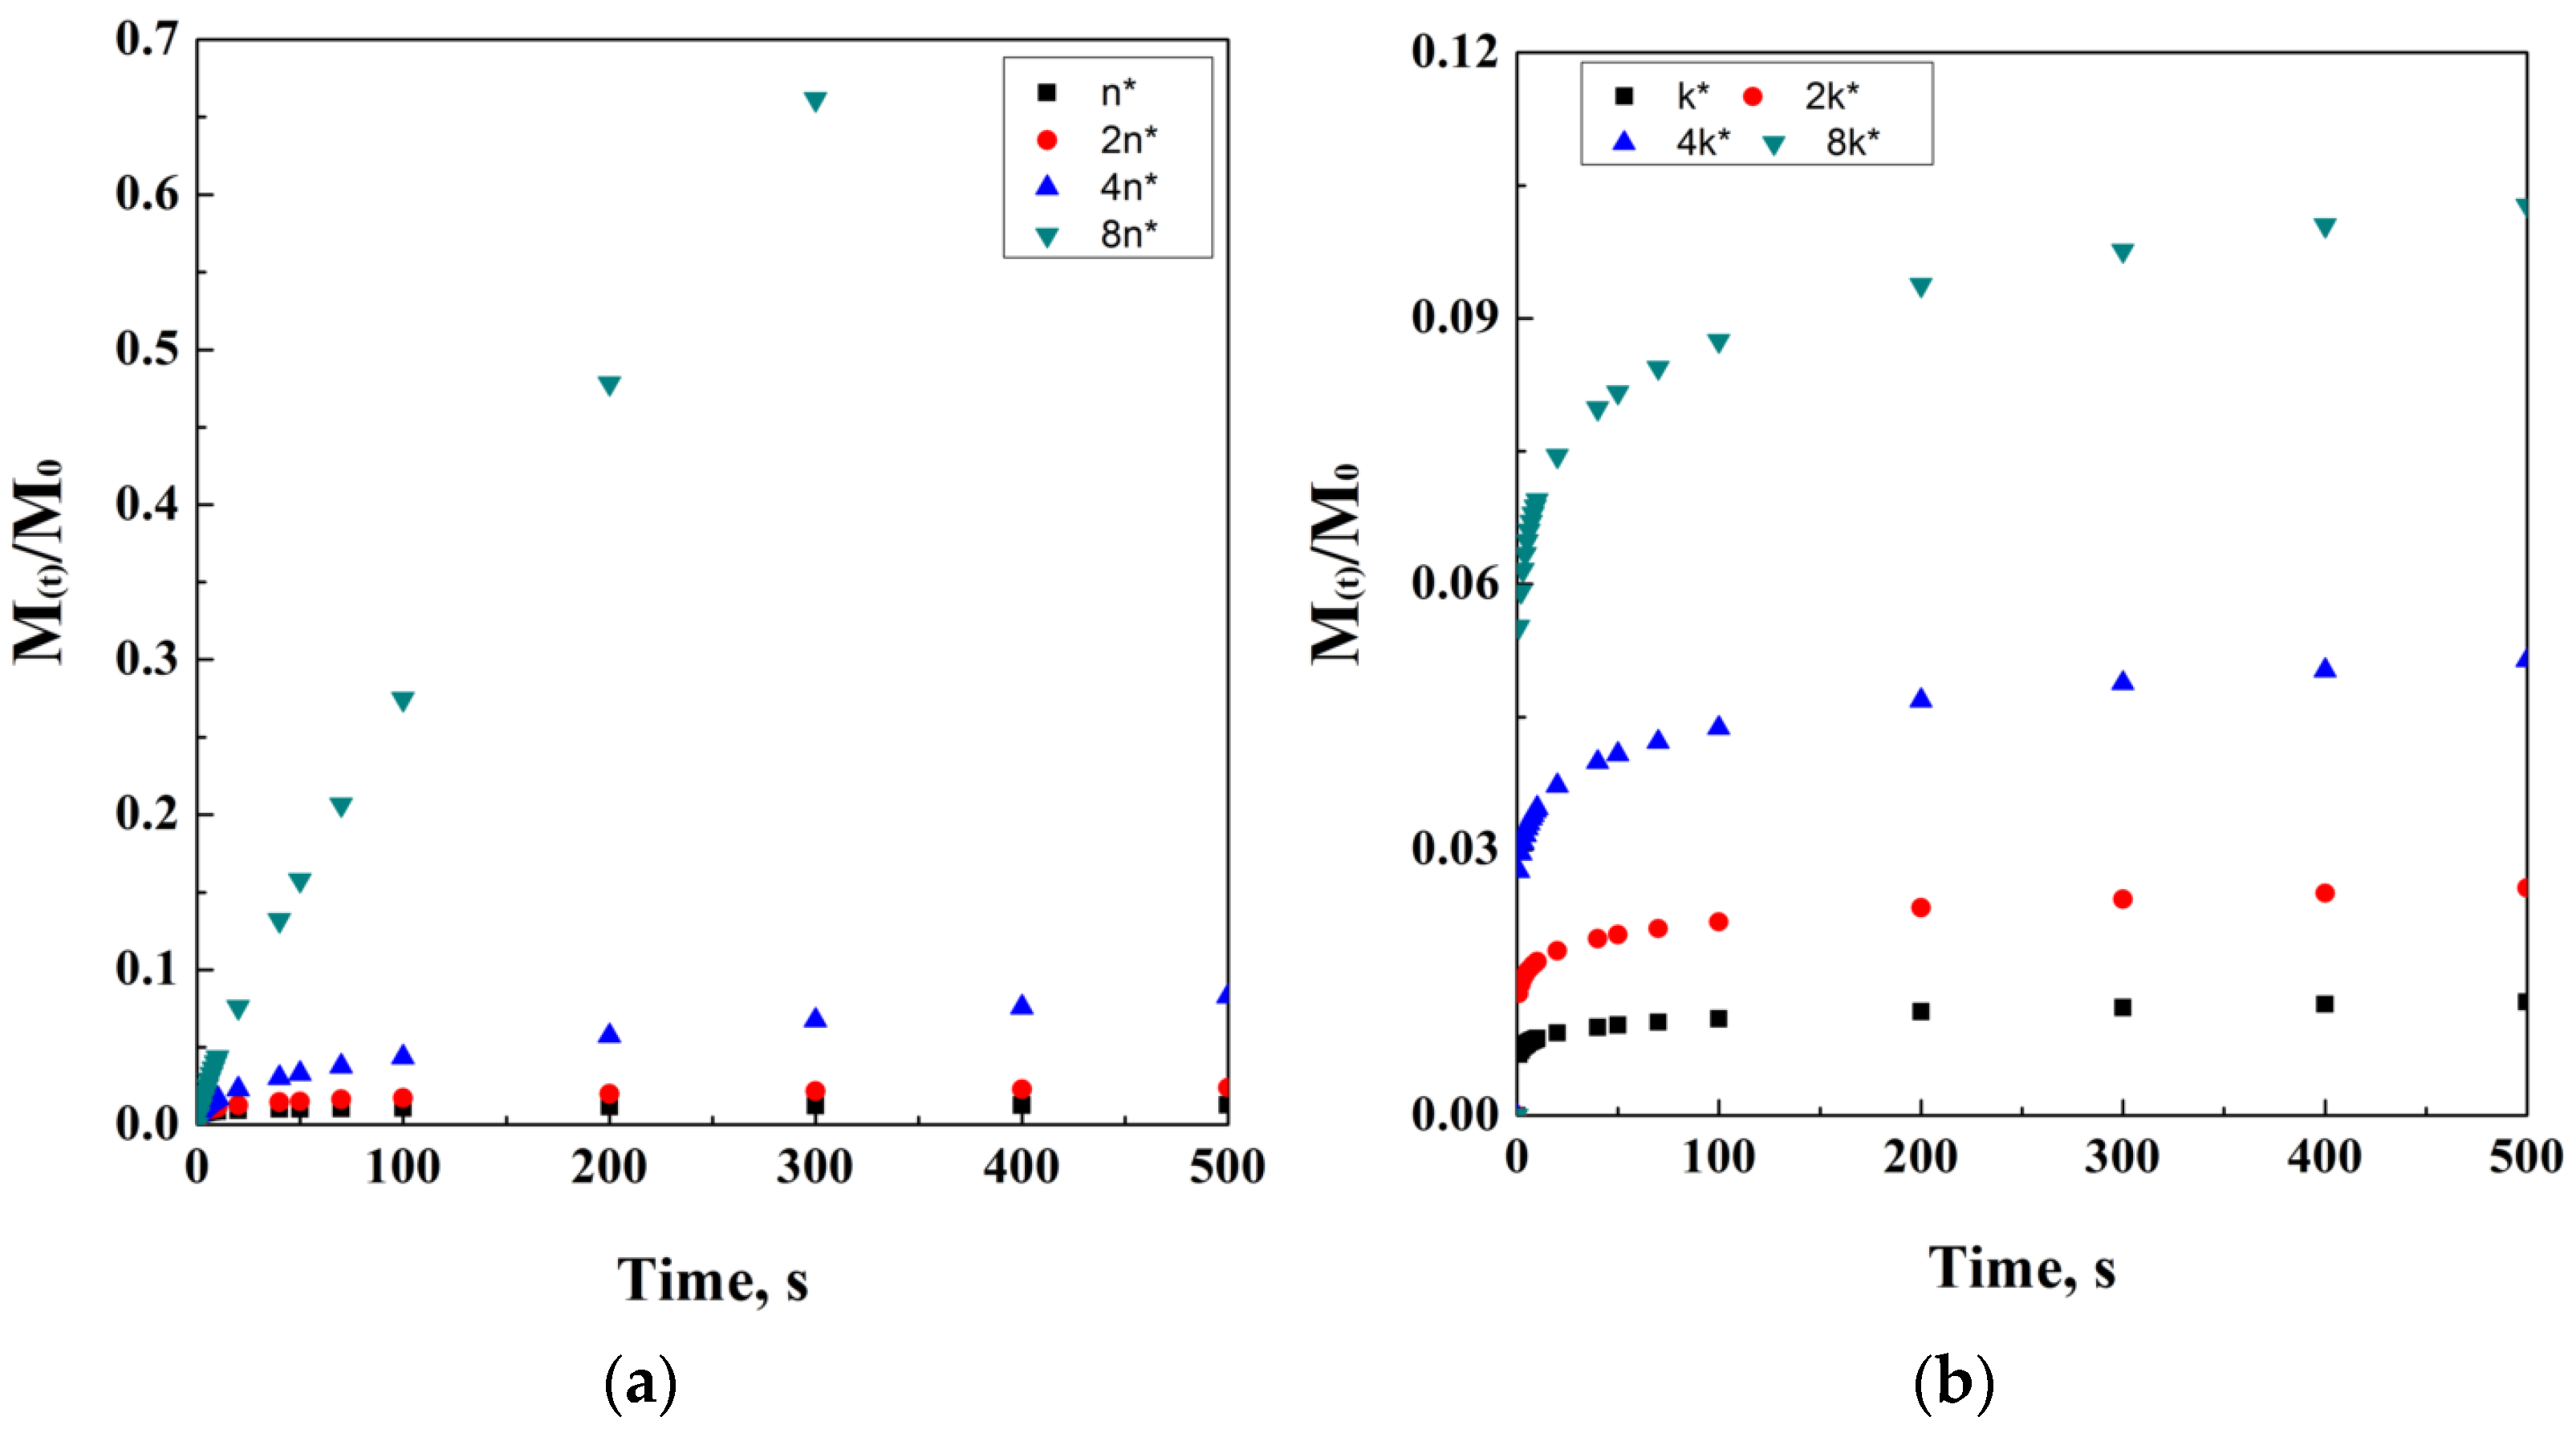
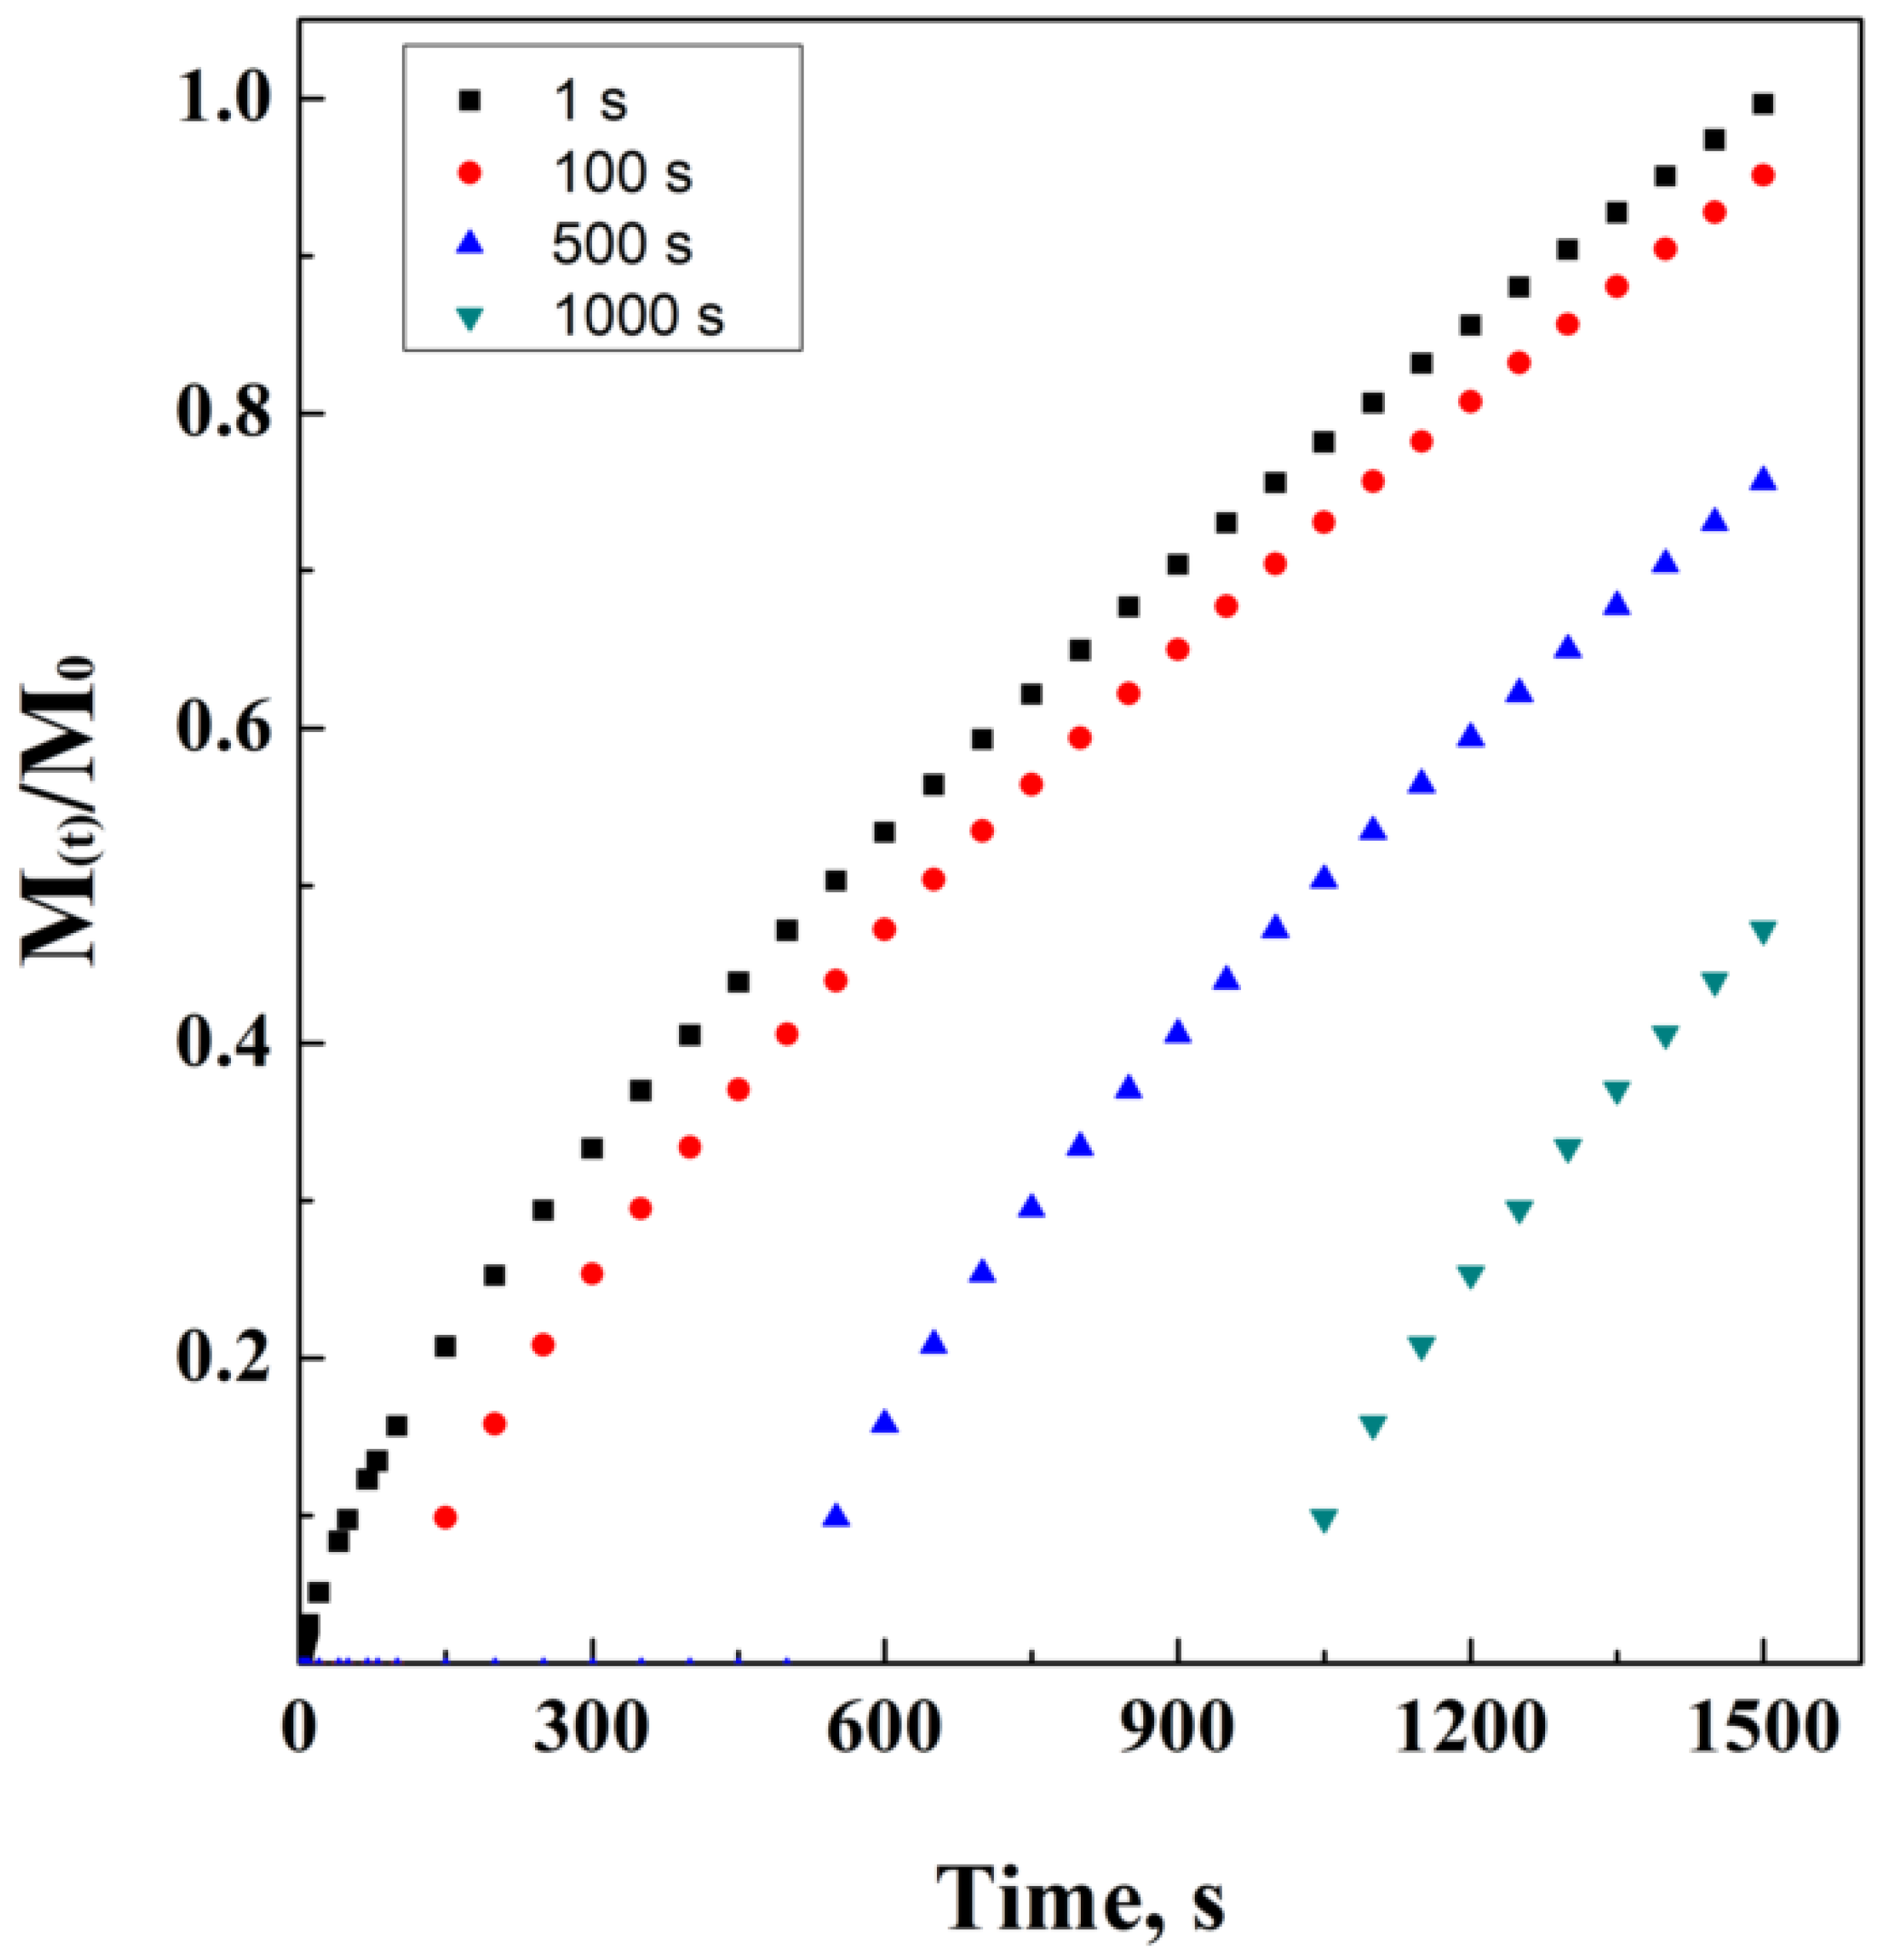
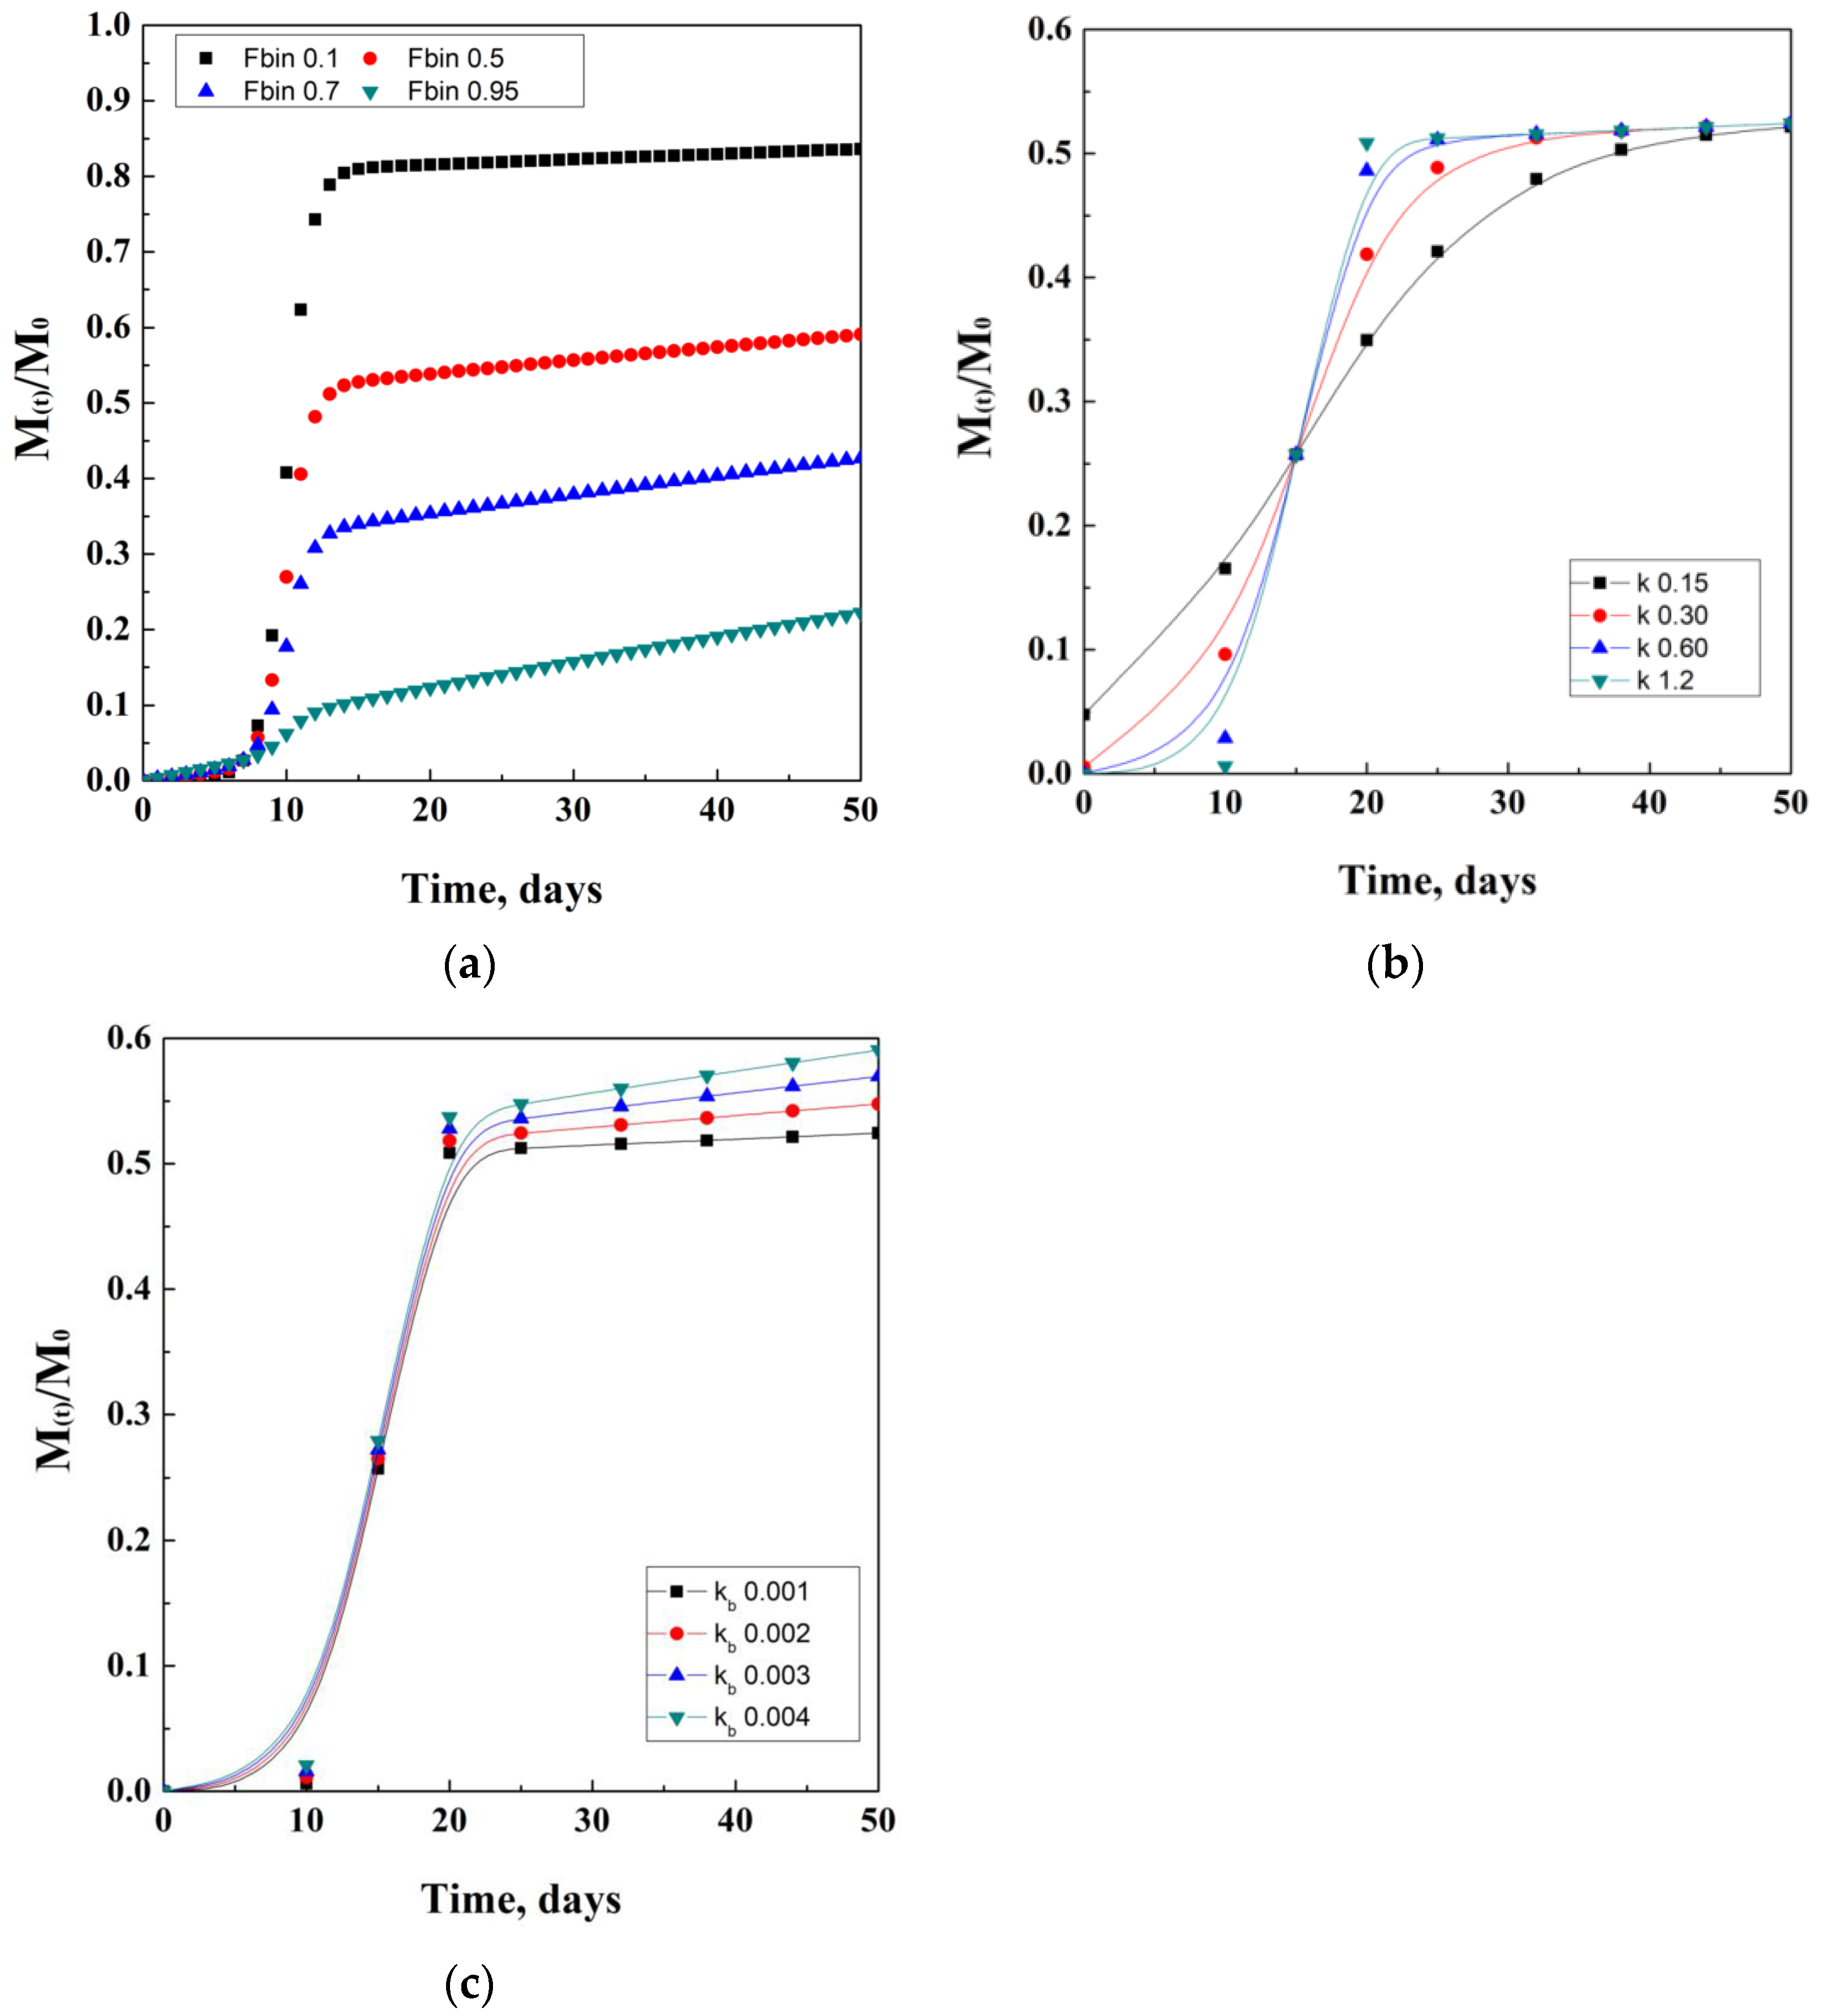
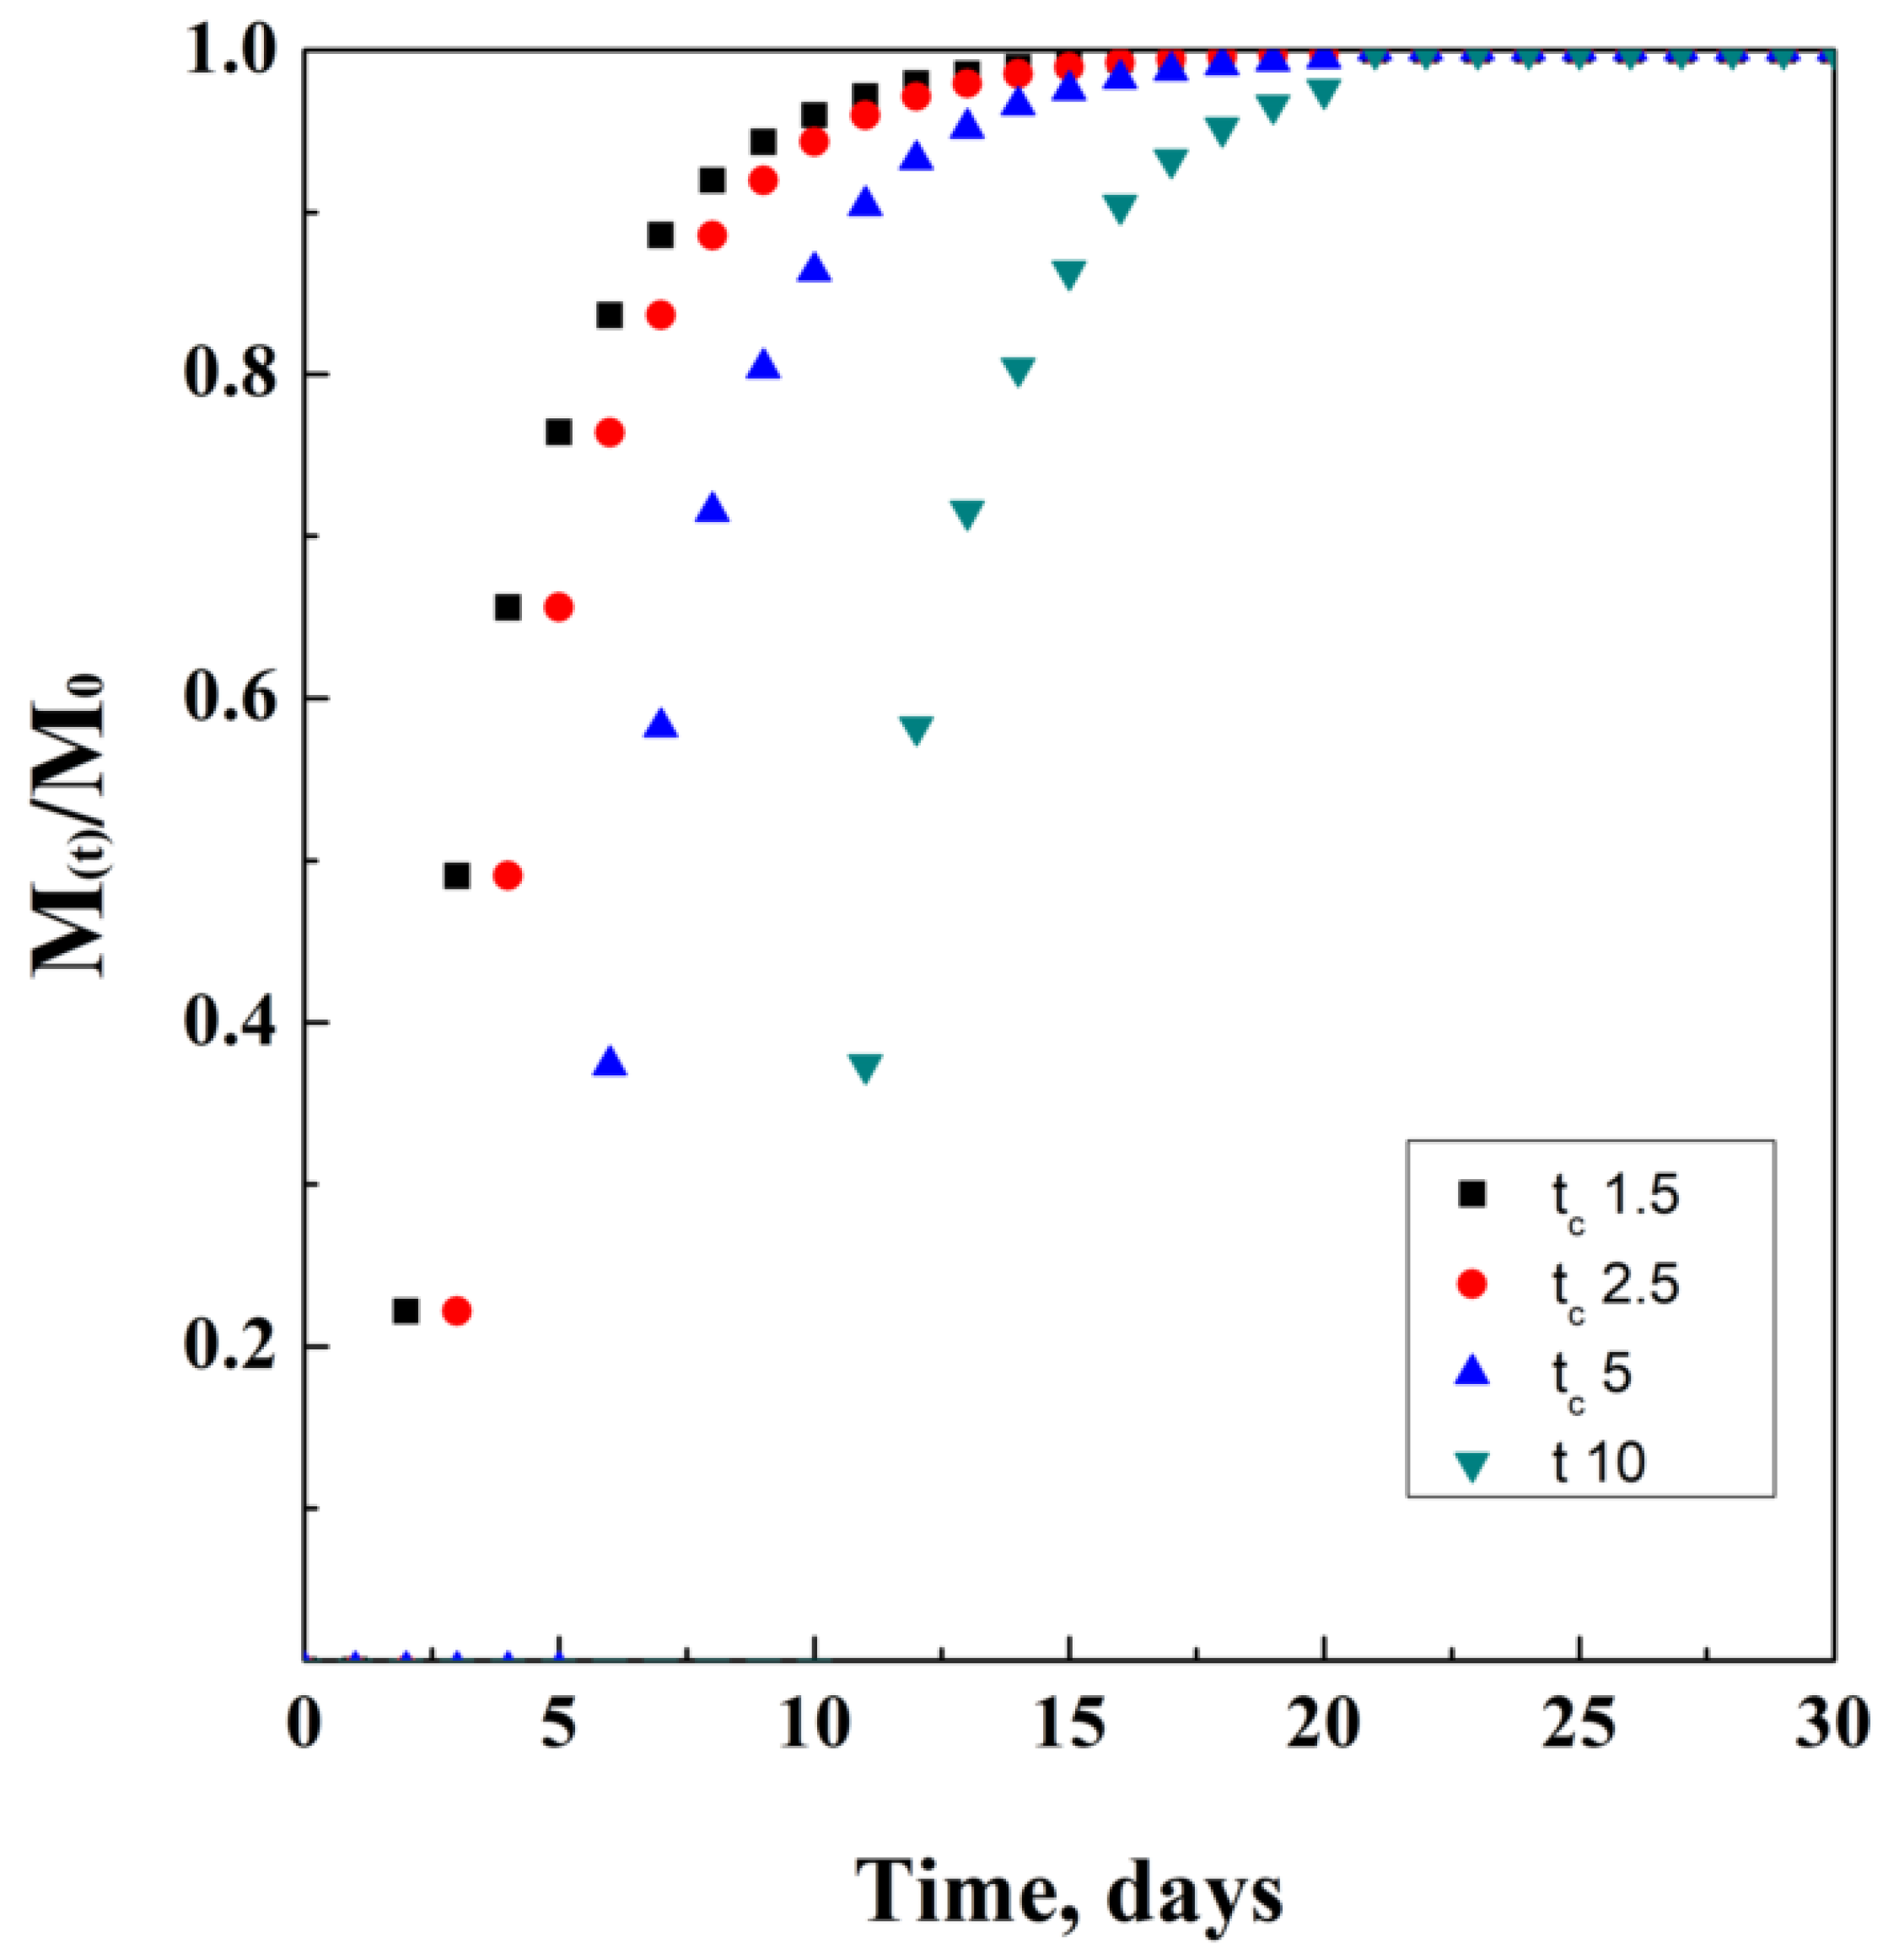
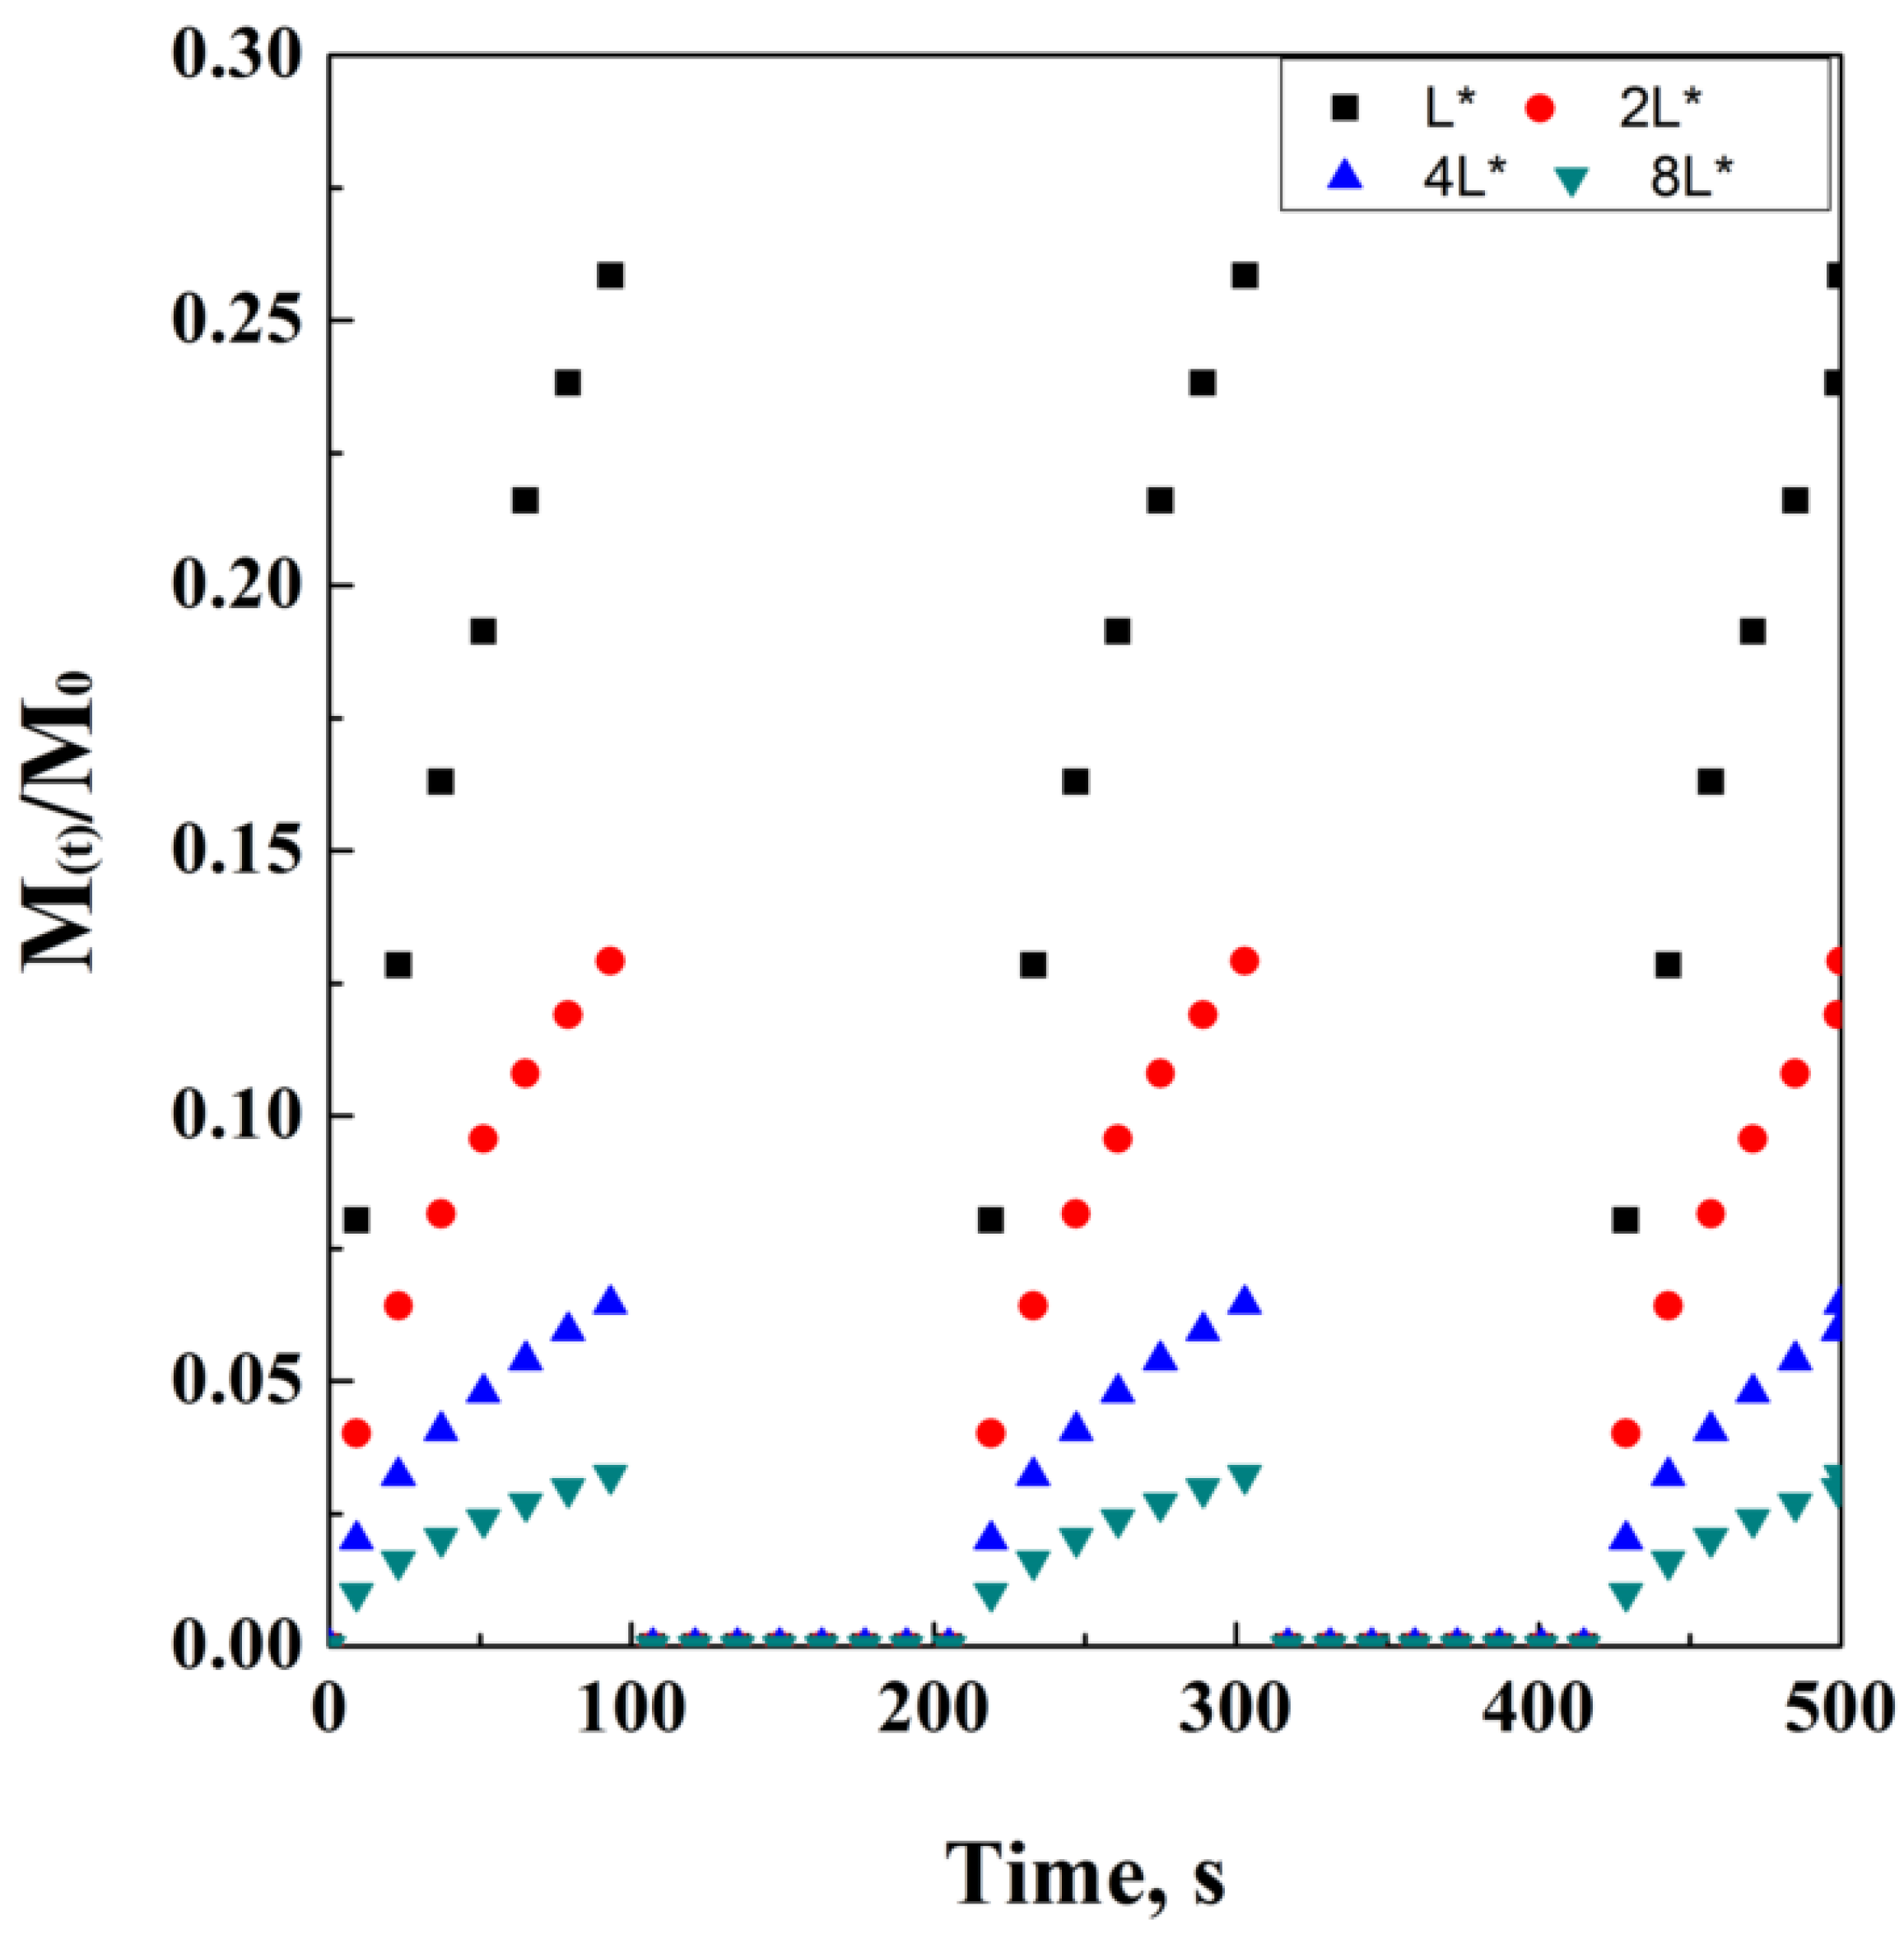
Publisher’s Note: MDPI stays neutral with regard to jurisdictional claims in published maps and institutional affiliations. |
© 2022 by the author. Licensee MDPI, Basel, Switzerland. This article is an open access article distributed under the terms and conditions of the Creative Commons Attribution (CC BY) license (https://creativecommons.org/licenses/by/4.0/).