Abstract
Construct-irrelevant variance (CIV), defined as excessive variance that is unrelated to the intended construct, poses a significant threat to the validity of test interpretations and applications. CIV can arise from two notable sources: construct-irrelevant items, which include items with content unrelated to the construct being measured, and redundant items, which repeat information already captured by other items, leading to individual fatigue and inflated reliability estimates. This study explores the detection of CIV using network psychometrics in comparison with traditional psychometrics methods. The study utilizes the HEXACO-PI dataset, focusing on six personality dimensions, and applies network psychometrics techniques such as Exploratory Graph Analysis and Unique Variable Analysis. These techniques are compared against traditional methods, such as reliability and factor analysis, to assess their effectiveness in identifying CIV items. Results highlight the potential of network psychometrics as a complementary approach for enhancing the structural integrity of psychological instruments, with 89% agreement in the number of identified CIV items. This comparison provides insights into alternative methods for improving psychological instruments, with implications for the future of psychometric evaluation.
1. Introduction
Construct-irrelevant variance (CIV), known as excessive variance that lacks a meaningful association with the intended construct, is a common threat to the validity of the interpretations and uses of a test (Haladyna & Downing, 2005; Messick, 1989). Specifically, poorly formulated assessment items that do not represent their intended construct could jeopardize the construct validity of the survey by distorting item parameters (e.g., difficulty and discrimination) (Downing, 2002; Haladyna & Rodriguez, 2013). In the context of this study, the terms “survey,” “instrument,” “test,” or “assessment” are used interchangeably to denote instruments assessing psychological constructs (e.g., personality) among individuals. On the other hand, the term “measurement” refers to the technical processes and mechanisms involved in the assessment of psychological constructs, emphasizing a more technical perspective. Construct-irrelevant items could introduce noise in the thought process of individuals, thus contaminating their thoughts about the construct and contributing to CIV. For example, an item asking about an individual’s satisfaction with a particular item may not be pertinent to assessing their personality, potentially diverting their focus during the test.
Further, construct-irrelevant items could perform sub-optimally due to issues such as linguistic complexity, overly specific or overly general content, or inappropriate question length (Haladyna & Rodriguez, 2013). In this case, the identified construct-irrelevant items may be minimally correlated with other items and could negatively impact the overall coefficient alpha reliability of the assessment if retained as is (Finch & French, 2019). The adverse effects of CIV are exacerbated by redundant items that, despite demonstrating comparable performance to other items, have the potential to cause unnecessary fatigue among individuals, as the construct has already been assessed by their counterparts (Haladyna & Rodriguez, 2013). Specifically, redundant items may exhibit large correlations with other items that measure a similar construct, thereby posing challenges in the interpretation of these items—hovering between the notions of “both items complement each other” and “both items measure the same thing” (Wood et al., 2023).
The common solution to identify items that contribute to CIV (i.e., CIV items) is through traditional psychometrics approaches such as item analysis for reliability, discrimination, and the factor analysis method that includes exploratory factor analysis (EFA) and confirmatory factor analysis (CFA) (Finch & French, 2019; Finch et al., 2023). Identified CIV items often display problematic statistical properties, such as low reliability or discrimination. Aside from the traditional methods, such as factor analysis in examining the structure of a survey, the network psychometrics approach also offers an equivalent means to investigate relationships between items.
This alternative approach operates with different data-generating hypotheses; that is, the network approach conceptualizes observed variables (e.g., items within an assessment) as individual “nodes” that collectively influence each other as a whole system (Christensen & Golino, 2021b; Isvoranu et al., 2022). The network psychometrics approach can also examine the structure of a survey without being constrained by the assumption that there is a latent variable underlying item responses, as in the factor analytic approach (Borsboom et al., 2021; Flora et al., 2012). In other words, the network approach offers a novel perspective on the complex structure of an instrument, which could be unavailable through the employment of the traditional psychometrics approach (Christensen et al., 2019). Despite the increasing in methodological uptake, scholars have raised concerns about their interpretation when latent variables are present. For example, studies caution that network indices such as centrality can overlap with traditional factor loadings, raising the possibility of redundancy rather than unique causal structure. This discrepancy highlights the importance of comparisons across methods (Hallquist et al., 2021).
Despite these parallel developments, no empirical study has systematically compared traditional and network psychometric approaches in their ability to detect CIV. Prior research has either demonstrated the utility of traditional methods for improving measurement validity (Downing, 2002; Finch & French, 2019) or highlighted the conceptual innovations of network models (Christensen et al., 2019; H. Golino et al., 2022), but their relative effectiveness in identifying CIV remains unclear. This represents a critical gap: without such comparisons, it is difficult to know whether network psychometrics provides genuinely new evidence or merely reproduces what traditional approaches already capture.
This study addresses that gap through a large-scale empirical comparison using the HEXACO-PI dataset, which includes responses to 240 items spanning six personality dimensions (Ashton et al., 2007). We evaluate the capability of the network psychometrics approach in detecting CIV items (Christensen et al., 2018; H. Golino et al., 2022; Massara et al., 2016). Results from network psychometrics will be compared with those from traditional psychometrics for validation. The research question is “What is the effectiveness of the network psychometrics approach in identifying CIV items?”.
This comparison is timely because large-scale assessments increasingly face scrutiny over item redundancy and fairness, and network psychometrics has gained rapid traction as a promising alternative. Establishing whether it offers advantages over traditional approaches is crucial for both methodological and practical reasons. Our contributions are threefold. Theoretically, we advance understanding of how CIV manifests across different measurement frameworks, clarifying where latent-variable and network perspectives converge and diverge. Empirically, to our best knowledge, we provide the first direct evidence on the agreement and disagreement between traditional and network approaches in detecting CIV. Practically, we illustrate how test developers can use network psychometrics as a complementary tool alongside traditional methods to enhance validity and reduce redundancy in psychological assessments. In doing so, this study builds on prior methodological work and extends it by offering systematic, item-level evidence on the relative strengths of both approaches.
1.1. Impact of CIV Items on Measurement Validity
Validity refers to the extent to which test score interpretations and uses are supported by evidence and theory (Kane, 2013). CIV can distort test properties and negatively affect the validity of these interpretations and uses (Downing, 2002; Haladyna & Downing, 2005). CIV represents systematic measurement error, meaning it affects every individual consistently, potentially deflating or inflating their scores (Haladyna & Downing, 2005). CIV can alter item difficulty in dichotomous items and the likelihood of endorsement in polytomous items, which compromises test fairness and can lead to differential item functioning (DIF) (Alavi & Bordbar, 2017; Huang et al., 2023).
From a classical test theory (CTT) perspective, where errors are assumed to be random, systematic errors like CIV disrupt this assumption (R. Hambleton & Jones, 1993). If different groups interpret and respond to items differently due to issues like ambiguous language or readability, CIV may arise, impairing validity and fairness (Alavi & Bordbar, 2017; Haladyna & Downing, 2005). Furthermore, redundant items, even when functioning properly, can induce fatigue, introducing another form of systematic error (Wood et al., 2023).
Within item response theory (IRT), which models item responses based on parameters like discrimination and difficulty, CIV poses a threat by violating key assumptions such as unidimensionality, local independence, and monotonicity (De Champlain, 2010). For instance, redundant items can violate the local independence assumption by influencing responses to similar items, reducing the accuracy of ability estimates (Mislevy & Chang, 2000). Similarly, violations of parameter invariance can occur due to culturally biased phrasing or unfamiliar language, further contributing to CIV and distorting item parameters (Huang et al., 2023).
1.2. Traditional Psychometric Approaches for Identifying CIV Items
To date, research has been done to identify CIV and enhance the quality of the assessment (Downing, 2002; Kassim, 2011). Traditional psychometric methods play a key role, using statistical techniques like item analysis, reliability analysis, DIF analysis, and factor analysis to detect and adjust CIV items (Finch & French, 2019). Item analysis, a core method, evaluates difficulty and discrimination parameters from CTT and IRT perspectives, helping identify CIV. Items with different difficulty levels across subgroups or low discrimination values may indicate CIV, especially when affected by construct-irrelevant content or ambiguous wording (Cor, 2018).
In CTT, reliability measures the consistency and stability of test scores, reflecting how well items consistently assess the same construct (Finch & French, 2019). A reliable test yields consistent results across individuals with varying construct levels. Coefficient alpha is a common reliability measure that indicates if items within a test are measuring the same construct (Cronbach, 1951). Reliability analysis can help detect CIV items by identifying those that contribute to measurement error. If dropping an item increases the test’s reliability, it may indicate CIV, as such items can disrupt measurement consistency by not aligning well with other items.
DIF analysis is crucial for ensuring fairness in assessments across diverse groups, as DIF items often contribute to CIV (Mellenbergh, 1995). DIF analysis identifies items that function differently for individuals with similar abilities but from different subgroups (e.g., gender, race, culture) (De Beer, 2004; Finch & French, 2019). Uniform DIF occurs when an item consistently favors one group, while non-uniform DIF occurs when favorability shifts at different levels of the construct (De Beer, 2004). Statistical methods, like the generalized logistic regression method, are preferred for detecting both uniform and non-uniform DIF in polytomous items, as they examine variations in item response probabilities across groups along the latent trait continuum (Bulut & Suh, 2017; Hladká & Martinková, 2020).
Lastly, factor analysis examines the relationships between observed variables (test items) and underlying latent constructs (factors) (Brown, 2015; Orcan, 2018). It can be used for exploratory purposes via EFA or confirmatory purposes via CFA. EFA, a data-driven approach, is commonly used first to explore item-factor relationships without a strong prior hypothesis, modeling these through a multivariate linear regression (Finch & French, 2019). Items that do not load with their peers or show cross-loadings may be construct-irrelevant, suggesting removal or revision (Acar Güvendir & Özer Özkan, 2022). CFA, a hypothesis-driven approach, tests whether the data fit a predefined theory, assessing model fit using indices like root mean square error of approximation (RMSEA), standardized root mean square residual (SRMR), comparative fit index (CFI), and Tucker–Lewis index (TLI) (Finch & French, 2019). CIV items often disrupt CFA results by skewing the test structure, with redundantly worded items creating convergence issues due to their large correlations and increased model complexity (Morin et al., 2020; Wood et al., 2023).
1.3. Network Psychometrics: An Alternative Approach to CIV Item Detection
As the field of psychometrics advances, network psychometrics emerges as a promising alternative approach for identifying items influenced by CIV. This network approach to psychometrics works on the premise that a psychological construct is represented by a system of interconnected variables such as psychological, sociological, and biological elements (Epskamp, 2017). This technique denotes observed variables as “nodes” and pairwise conditional association, represented by partial correlations, between nodes as “edges”. Unlike the traditional approach of CFA, where the structural relationship between observed and latent variables is conceptualized, the network approach operates without imposing strong a priori assumptions; this methodology permits the variation in the data structure without restricting nodes to any latent variable (Borsboom et al., 2021; Isvoranu et al., 2022). Latent variables are identified in network psychometrics through the relative location of nodes, forming “communities”. As indicated in Figure 1, items within the same community are positioned closer together, indicating stronger relationships, while items with weaker associations are positioned farther apart from their peers (Borsboom et al., 2021). Despite the difference in terms of data conceptualization, network loading, represented by edge weights, was found to offer comparable information to factor loading in CFA; As a result, network psychometrics yields results that are as viable as those from CFA, albeit from a novel perspective (Christensen & Golino, 2021a).
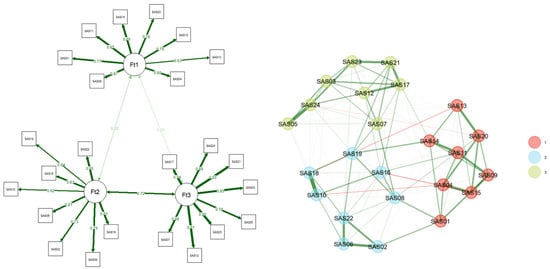
Figure 1.
Factor model and network model of the statistical anxiety scale. Note. The figure was created from the Statistical Anxiety Scale dataset from Chew et al. (2018) in R (R Core Team, 2023). The numbers correspond to the respective items; for instance, SAS01 refers to item one.
Under the umbrella of Network psychometrics, several techniques are available to examine the structures of the test and the properties of its items. This study curates a selection of methods that could identify items with CIV characteristics such as construct-irrelevance and redundancy, namely exploratory graph analysis (EGA) (H. Golino et al., 2022), unique variable analysis (UVA) (Christensen et al., 2023; H. Golino et al., 2022), and Triangulated Maximally Filtered Graph (TMFG) (Christensen et al., 2018; Massara et al., 2016). In fact, recent studies have combined traditional factor-analytic methods with network approaches to examine local dependence and dimensional validity (Verkuilen et al., 2021). These findings highlight how redundancy and overlap can undermine construct validity, reinforcing the need for systematic comparisons of methods in detecting CIV.
1.3.1. EGA
EGA applies graphical network estimation and community detection to estimate dimensionality in psychological data (H. Golino et al., 2022). It helps identify latent variables (network clusters) and their associated items (H. F. Golino & Epskamp, 2017). Using partial correlation and graphical least absolute shrinkage and selection operator (GLASSO), EGA reveals meaningful relationships within the data by forming clusters and penalizing weak edges (Baba et al., 2004). EGA’s robustness can be tested through bootstrap resampling, thereby enhancing network stability (Christensen & Golino, 2021b). EGA also provides network plots, item assignments, and common fit indices like RMSEA and CFI, with the Bootstrap EGA offering additional metrics like structural consistency and replication proportions (Christensen & Golino, 2021a; H. F. Golino & Epskamp, 2017).
EGA also provides a unique index of Total Entropy Fit Index (TEFI), which indicates the robustness of item organization with lower values indicating reduced uncertainty (H. Golino et al., 2021). TEFI is a network metric that quantifies uncertainty or disorder within a system (H. Golino et al., 2021). In essence, TEFI assesses how well a proposed model partitions variables into distinct dimensions by comparing the entropy of the observed network structure to that of a random baseline (H. Golino et al., 2021). A lower TEFI value indicates a better fit, suggesting that the model captures meaningful structure rather than noise (H. Golino et al., 2021).
EGA performs comparably to traditional dimensionality methods like parallel analysis, but outperforms them in more complex conditions (H. F. Golino & Epskamp, 2017). EGA’s visual clarity and ability to detect complex structures give it an edge, especially in identifying CIV items, which are prone to instability and community shifts during resampling, suggesting divergence in their statistical associations (Christensen & Golino, 2021b).
1.3.2. UVA
Developed alongside EGA, UVA uses network estimation to identify redundant items (i.e., nodes) that may cause local dependency (Christensen et al., 2023). It combines GLASSO and weighted Topological Overlap (wTO) to measure node similarity based on partial correlations, helping to detect locally dependent items for intervention (Christensen et al., 2023; Nowick et al., 2009). Specifically, wTO is metric used to quantify the degree of shared connectivity between pairs of variables, typically symptoms, traits, or behaviors within a weighted network (Nowick et al., 2009). It builds on the concept of topological overlap, which assesses how much two nodes share common neighbors and how strongly they are connected (Christensen et al., 2023). In practice, wTO helps identify clusters or communities of variables that co-occur or interact in meaningful ways, such as symptom co-occurrence in mental health or patterns of cognitive traits. By emphasizing both direct and indirect relationships, wTO supports the detection of locally dependent structures, which is an important consideration in psychometrics (Finch & French, 2019).
Practically speaking, wTO highlights highly correlated nodes with similar relationships to others, allowing visualization of node interactions and overlaps in the network system. Once redundant nodes are identified, UVA offers options for reduction, including combining them into latent variables, eliminating, or aggregating them (H. Golino et al., 2022). Christensen et al. (2023) found UVA more effective than methods like exploratory structural equation modeling for instrument structure examination. For this study, redundant nodes can also contribute to CIV due to shared item phrasing, which may inflate internal consistency reliability (Christensen et al., 2023; Reise et al., 2018).
1.3.3. TMFG
TMFG uses the information filtering networks approach to estimate psychological data networks (Massara et al., 2016). Available through the EGAnet (Christensen et al., 2018) and NetworkToolbox (H. Golino et al., 2022) packages in R, TMFG selects four nodes with the largest sum of correlations above the average correlation as anchor variables to build the network. This method produces a structure similar to GLASSO but can create both directed and undirected networks, capturing both direct and indirect influences on related factors (Christensen et al., 2018). A key advantage of TMFG is its ability to account for common covariance, which allows it to represent hierarchical constructs like personality traits without manual input (Christensen et al., 2019). In CIV item detection, TMFG, like EGA, may position ambiguous items farther from their intended groups due to divergent response patterns, signaling construct-irrelevance (Christensen & Golino, 2021b). Researchers can use this information to decide how to handle such items.
1.4. Current Study
This study utilizes the HEXACO-PI dataset—a large-scale response dataset of an instrument measuring six personality traits (i.e., Honesty-Humility, Emotionality, Extraversion, Agreeableness, Conscientiousness, and Openness to experience) from the International Personality Item Pool (IPIP) (Ashton et al., 2007). To answer the research question, this study first identifies CIV items utilizing the mentioned network psychometrics of UVA, EGA with GLASSO algorithm, and EGA with TMFG algorithm. Then, the final dataset is chosen based on the results of the post-reduction model fit analysis. Subsequently, the same dataset will be analyzed by methods under the traditional network psychometrics approach, namely discrimination analysis, reliability analysis, DIF analysis, and factor analysis (i.e., EFA and CFA). Results from the traditional psychometrics analysis will be used to validate results from the network approach by comparing their agreement in terms of identified CIV items.
The contribution of this study is twofold. At the technical level, this study provides an empirical comparison between the traditional and the network psychometrics approach in detecting CIV items, which could attest to the effectiveness of the latter approach in assessing the structure of a psychological instrument. At the practical level, the application of network psychometrics for CIV item detection could serve as guidance for test developers to produce a novel line of evidence in addition to those of traditional psychometrics analysis to inform their instrument enhancement.
2. Methods
2.1. Data Source and Preprocessing
This study utilizes response data obtained from the HEXACO-PI instrument, originally developed by Ashton et al. (2007) and sourced from the IPIP website. The data was collected through the IPIP website as a public-domain source of various psychological instruments assessing personality traits via self-report for research purposes (Goldberg et al., 2006). It comprises individuals’ responses to the instrument and additional information about their country of origin. There are no restrictions based on age, gender, or educational background, as the assessment was publicly accessible. It was administered as a computer-based assessment with English as the test language. There was no inducement or incentive for completing the assessment. The HEXACO-PI instrument consists of six domains, each comprising four facets with 10 items each, totaling 240 items. Each item prompts individuals to express their level of agreement with statements reflecting the dimensions and facets of the HEXACO personality model (Ashton, 2023). Responses were recorded using a seven-point Likert scale: 1 = strongly disagree, 2 = disagree, 3 = slightly disagree, 4 = neutral, 5 = slightly agree, 6 = agree, and 7 = strongly agree.
The dataset included both native and non-native English speakers. We retained both groups because the HEXACO-PI was developed for international use and is widely administered across diverse populations Ashton et al. (2007). This methodological choice allows the dataset to reflect its intended use and thereby enhance its ecological validity. To address potential language-related CIV, we explicitly tested for DIF across native and non-native respondents. This allowed us to evaluate whether language background systematically biased responses, ensuring that our conclusions accounted for fairness considerations.
Missing data analysis was performed as a part of the data screening process. Following the removal of cases with missing values, which accounted for less than 1% of the original sample, the final dataset consisted of 22,714 participants. The pattern of missing data suggested the possibility of missing completely at random, as there was no noticeable pattern from the upset plot that visualizes common sets of missing values (Tierney & Cook, 2023). The question statements measuring all six domains and 24 facets are described in Table S1 in the Supplemental Materials.
Response data were re-coded from numeric to categorical to reflect the ordinal scale of the data. Individuals who participated in the instrument were drawn from 125 countries in total. For analytical purposes, countries of individuals were re-coded into a binary variable: non-English speaking countries (coded as 0) and English-speaking countries (coded as 1). This re-coding was based on a guideline obtained from the Central Intelligence Agency (2021). The ratio between countries with English as an official language and those with non-English as an official language was 19,094 to 3620, respectively.
2.2. Data Analysis
2.2.1. Network Psychometrics Analysis
This approach to analysis is foundational to this study. Table 1 delineates and juxtaposes the utilized network analysis methods, including their respective metrics. Figure 2 explains the implementation sequence of network psychometrics analysis in this study. From the raw dataset, UVA was performed to detect redundant items, thereby reducing the dataset and preparing it for further analyses. UVA was performed with the UVA function in the EGAnet R package version 2.3.0 (H. Golino et al., 2022). The function was configured with “MBR” redundant node identification method and the wTO cut-off value = 0.25. The MBR configuration is recommended by Christensen et al. (2023) as a more robust method than its alternative (i.e., EJP). Redundant nodes were identified and subsequently removed based on their wTO values.

Table 1.
Utilized network psychometrics methods.
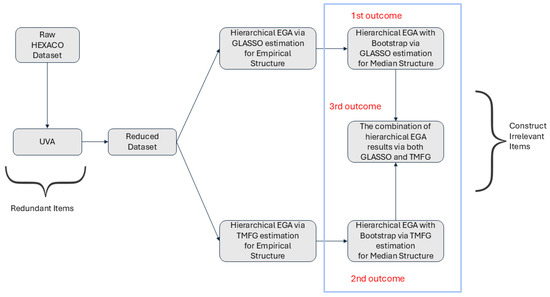
Figure 2.
The employed network analysis process. Note. UVA stands for unique variable analysis. EGA stands for exploratory graph analysis. GLASSO stands for graphical least absolute shrinkage and selection operator. TMFG stands for triangulated maximally filtered graph.
After obtaining reduced datasets from UVA, Hierarchical EGA was performed to account for the hierarchical nature of the HEXACO-PI assessment, which includes both lower-order facet and higher-order dimension components (Jiménez et al., 2023). Hierarchical EGA was performed with the hierEGA function in the EGAnet package to obtain the empirical structure of the dataset(H. Golino et al., 2022). Further, bootstrap EGA was performed with the bootEGA function in the same package to examine a typical median network structure and its stability across bootstrap iterations (H. Golino et al., 2022; H. F. Golino & Epskamp, 2017; R Core Team, 2023).
As indicated in Figure 2, Hierarchical EGA and bootstrap hierarchical EGA were performed with both GLASSO and TMFG network estimation algorithms on datasets obtained from UVA. Results from both GLASSO and TMFG were also combined to examine the effectiveness of network estimation algorithms both by themselves and as complementary parts. This combination was done by removing items that were flagged as CIV at least once by either algorithm. The hierarchical EGA was configured with the following settings: the “BRM” network loading calculating method, the “network” method for structure estimation, the “simple” loading structure, the “cor_auto” correlation method for conducting polychoric correlation with ordinal response data, the “louvain” consensus clustering for lower-order community estimation, and the “walktrap” algorithm for higher-order community estimation.
The bootstrap hierarchical EGA was configured similarly to the hierarchical EGA, with a difference of using the “parametric” bootstrap method to simulate new datasets based on multivariate normal random distributions of the original dataset. Specifically, 1000 replica datasets were generated (i.e., iter = 1000). Consensus on the number of communities among computation iterations was determined based on the structure with the highest modularity (i.e., consensus.method = highest_modularity).
Item-level statistics of EGA and Bootstrapped EGA were consulted to determine construct-irrelevant items. Specifically, the assigned community of items was assessed in terms of their alignment with the theoretical structure of the dataset. Further, the replication proportion of an item across bootstrap iterations in bootstrapped EGA was evaluated. Items that have low replication proportion and are not assigned with their theoretical peers may be considered as construct-irrelevant items (Christensen & Golino, 2021b).
Item Filtering Process of the Network Approach
The process for identifying construct-irrelevant statement items utilizing the network psychometrics approach is described in Figure 3 as follows:
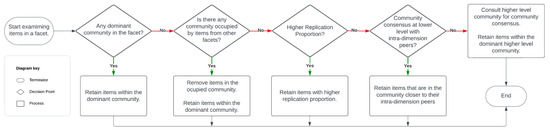
Figure 3.
The process for identifying construct-irrelevant items with the network psychometrics approach. Note. CIV stands for construct-irrelevant variance. DIF stands for differential item functioning. EFA stands for exploratory factor analysis. CFA stands for confirmatory factor analysis.
- Check the Main Community: First, examine the community where most of the items from a specific facet are grouped. For example, if most “modesty” items are in the 2nd community, but a few are in the 3rd, the outlier items in the 3rd community are identified as construct-irrelevant and removed.
- Handle Ties or Small Differences: When there is a tie between communities, or the difference is small (e.g., only one item), preference is given to the community where other related items are grouped. For example, if “modesty” items are evenly split between the 2nd and 3rd communities, but most “greed avoidance” items are in the 3rd community, the modesty items in the 3rd community were removed for consistency.
- Consult Replication Proportion: If the above guideline does not apply, the stability of the communities is checked using replication proportions. This shows how often items are consistently placed in the same community during bootstrapping. For example, if three modesty items are in the 2nd community and two are in the 3rd, but the replication proportion for the 2nd community is lower than the within-facet mean, items in the 2nd community may be removed to maintain the stability of the measurement.
- Use Intra-Dimension Peers: If two communities are still tied in terms of item count and replication proportion, reference their peers within the same dimension. For instance, if two “unconventionality” items are in community 37 and three in community 8, and no other facets are associated with these communities, but facets like aesthetic appreciation, inquisitiveness, and creativity are grouped in communities 34–36, it may be best to eliminate items in community 8 as it is more of an outlier within the dimension, given that community reflects the number of latent factors in a domain (H. F. Golino & Epskamp, 2017; Jiménez et al., 2023).
- Default to Higher-Level Community: If no consensus can be reached at the lower level (i.e., all items belong to unique communities or the communities are already occupied by items from other facets), the higher-level community allocation takes precedence. For example, if four items are spread across communities 5, 7, 8, and 9 at the lower level but three of them belong to community 4 at the higher level, the item associated with another higher-level community was excluded to maintain coherence.
After identifying all CIV items through the network psychometrics approach, results from both TMFG and GLASSO were combined as the third outcome for exhaustiveness. Items that are flagged as a CIV item at least once by either the GLASSO or the TMFG condition were removed in the combined condition. This combination serves to capture CIV items that the other misses. In instances where a facet exhibits severe instability, combining the results from both TMFG and GLASSO streams may result in the elimination of all items or the preservation of only one item within that facet. In such rare cases, priority was given to a stream that retains items of the highest quality. That is, items that demonstrate higher replication proportions at both higher and lower levels were prioritized to maintain the integrity of the dataset to the greatest extent possible.
Post-Reduction Analysis of the Network Approach
To confirm the robustness of the non-CIV dataset, the full dataset was assessed for four model fit indices (i.e., RMSEA, SRMR, CFI, and TLI) using CFA to establish a baseline condition. Subsequently, the non-CIV dataset was evaluated for fit indices based on both theoretical (six-factor structure) and empirical (recommended structure from network analysis) models, compared to the baseline condition. This comparison determined whether model fit improves after the removal of CIV items, providing evidence of the effectiveness of each condition. To compare all conditions, fit indices were compared rather than utilizing the Chi-square test, as the latter is unsuitable for comparing non-nested models that have different endogenous variables. As supplemental evidence, the empirical network model for each condition was assessed for TEFI at general, lower-order, and higher-order levels to provide additional information on model fit.
Additionally, we evaluated the median dimension, which represents the typical number of dimensions recovered across bootstrap replications of the network model (H. Golino et al., 2022). A median dimension close to the theoretical six dimensions of HEXACO indicates that the empirical structure is consistent with the intended construct framework, whereas substantial deviation suggests misalignment. We also considered the replication frequency of these dimensions at both lower and higher hierarchical levels, which reflects the stability of the dimensional solution across resampled datasets (H. Golino et al., 2022). Together, the median dimension and replication frequencies provided supplementary evidence for selecting the condition that best aligned with the theoretical structure of HEXACO and was therefore most appropriate for validation using traditional psychometric methods.
2.2.2. Traditional Psychometrics Analysis
This approach to analysis serves to validate results from the network psychometrics analyses by comparing the model fit derived from the network psychometrics approach with results from traditional psychometrics analysis, as well as examining whether the CIV items identified from the network approach exhibit CIV properties from the traditional approach. Additionally, it serves to confirm whether the identified CIV item exhibits problematic CIV properties according to the traditional psychometrics approach. The R programming language was employed for this purpose (R Core Team, 2023). Figure 4 explains the traditional psychometrics analysis process in this study. Item parameter-, reliability-, DIF analysis, and EFA can identify construct-irrelevant items, while intra-factor pairwise correlation can identify redundant items.
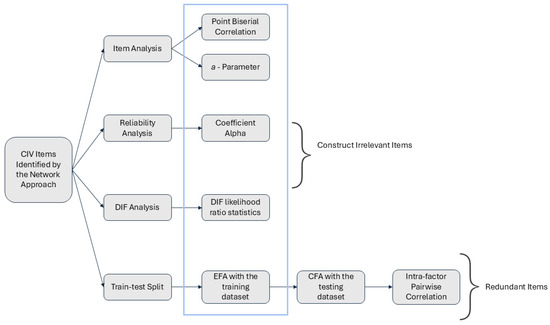
Figure 4.
The process for identifying construct-irrelevant items with the traditional psychometrics approach. Note. DIF Stands for differential item functioning; EFA stands for exploratory factor analysis; CFA stands for confirmatory factor analysis.
Moreover, the decision to apply traditional psychometric analysis exclusively to the CIV items identified by the network approach, rather than to the entire dataset, was guided by both practical and methodological considerations. Applying Computationally, analyses such as IRT estimation and large-scale factor analysis rely on iterative algorithms that require repeated convergence cycles. At this scale (240 × 22,714 responses = over 5.4 million data points), such analyses become prohibitively time-intensive and prone to critical system errors. In several cases, attempts to run full-scale models led to resource exhaustion and system-level interruptions, including fatal errors and forced shutdowns, even on high-performance systems. For this reason, and to maintain methodological efficiency, we adopted a two-stage design: network methods first screened for candidate items, followed by targeted application of traditional analyses to those flagged items.
This two-stage design reflects a purposeful strategy. The network methods serve as a structural filter, flagging items that show instability, redundancy, or community misalignment that threatens structural integrity of the instrument. Then, traditional psychometric methods provide item-level diagnostics for confirmatory purposes. In this sense, the two approaches function in tandem: the network perspective highlights structural irregularities, while the traditional methods interrogates those items’ psychometric properties in detail to identify items most likely to disrupt the instrument’s structural integrity. This approach mirrors test development practice, where item pools are first screened before applying intensive diagnostics. While this choice limits the balance of direct comparison, it enhances ecological validity and ensures that the focus remains on the network approach as the primary framework. However, we humbly acknowledge that this two-stage design may reduce the balance of comparison, as traditional methods were not applied exhaustively to every item.
CTT-based item and reliability analysis were conducted using the itemAnalysis function in the CTT package (R Core Team, 2023; Willse, 2018), assessing point-biserial correlations for discrimination and coefficient alpha for internal consistency at both item and dimension levels. For IRT-based analysis, the Graded Response Model (Zanon et al., 2016) was applied via the mirt function from the mirt package (Chalmers, 2012; R Core Team, 2023), configured for six factors and estimated using the Metropolis-Hastings Robbins-Monro (MHRM) algorithm to account for HEXACO’s multidimensional structure. Item discrimination was evaluated using a-parameters, with CTT-based reliability serving as the primary reliability metric due to the dataset’s high dimensionality, which limited the feasibility of extracting information plots.
DIF analysis was performed with the difORD function from the difNLR package version 1.5.1-4 to utilize the adjacent category logit model for DIF detection (Hladká & Martinková, 2020; R Core Team, 2023). DIF results were interpreted based on the likelihood ratio Chi-square statistics at a significance level of p < 0.05. The algorithm was configured to detect both uniform and non-uniform DIF, and the p-value adjustment method for multiple comparisons was set to Benjamini-Hochberg (BH).
Lastly, factor analysis was performed with the fa and cfa functions from the lavaan package for exploratory and confirmatory factor analysis, respectively (R Core Team, 2023; Rosseel, 2012). The raw dataset was divided into two datasets: a training dataset for EFA (N = 17,035) and a testing dataset for CFA (N = 5679) to prevent confirmation bias from data leakage. EFA was configured with oblimin rotation and six-factor solutions as indicated by the HEXACO personality model to examine whether items load onto their intended dimensions without researcher-imposed constraints. CFA, using the “WLSMV” estimator for categorical variables, evaluated model fit with RMSEA and SRMR, followed by pairwise correlation analysis to identify and remove redundant items within dimensions (Nussbeck et al., 2006).
For the traditional psychometrics process, we acknowledge that each of these indices has limitations when used in isolation. For example, alpha if item deleted is relatively insensitive in long tests and IRT discrimination parameters are sample-dependent (Cortina, 1993; R. K. Hambleton et al., 1991). Similarly, differential item functioning identifies subgroup bias but does not address redundancy, and factor analysis is constrained by assumptions of simple structure (Finch & French, 2019; Nunnally & Bernstein, 1994). Our rationale for including this diverse set of analyses was to triangulate their results instead of relying on any sole metric. Each method targets different sources of CIV such as redundancy, poor discrimination, subgroup bias, and dimensional misalignment. When considered together, these methods provide a more balanced evaluation of the HEXACO items.
3. Results
3.1. Network Psychometrics
3.1.1. UVA Analysis
From the original dataset, the UVA algorithm identified 22 redundant items. Among these, 13 items are identified with large-to-very large redundancy (i.e., wTO > 0.30); these items are HMode2, HMode6, EAnxi7, ESent6, AForg7, AForg9, COrga1, CPerf3, OAesA1, OInqu4, OInqu5, OCrea8, and OUnco9. Furthermore, the algorithm identifies 9 items with moderate-to-large redundancy (i.e., wTO > 0.25). These items are HFair1, HGree3, HGree4, HMode3, XExpr6, XLive3, CPerf9, CPrud3, and OCrea1. Following the removal of redundant items, the reduced dataset in the UVA stream consists of 218 items eligible for further analysis to identify construct-irrelevant items through hierarchical EGA with GLASSO and TMFG algorithm.
3.1.2. Hierarchical EGA with GLASSO
Using the reduced dataset, the hierarchical EGA with GLASSO identified 80 construct-irrelevant items, which were excluded from further analysis based on the process outlined in Figure 3. Detailed output, including community assignments and replication proportions for each item at both lower and higher levels, is provided in Table S2 in the Supplemental Materials. Key reasons for item removal across facets are summarized as follows:
- Non-Dominant Community Assignment: Items in the facets of Sincerity (Hsinc 2, 3, 5, 7, and 9), Fairness (HFair5), Greed Avoidance (HGree8), and others were removed as they were assigned to non-dominant or minority communities, suggesting weak alignment with core construct definitions.
- Occupied or Exclusive Community Assignment: Items in facets such as Sincerity, Modesty, and Flexibility were excluded due to assignment to occupied or exclusive communities, indicating possible divergence from intended construct facets.
- Low Replication Proportion: Items in facets like Anxiety, Dependence, and Sentimentality were removed based on low replication proportions, reflecting inconsistencies in measurement across communities.
3.1.3. Hierarchical EGA with TMFG
From the reduced dataset, the hierarchical EGA with TMFG identified 59 construct-irrelevant items, which were excluded from further analysis. Table S3 in the Supplemental Materials provides detailed output, including community assignments and replication proportions for each item at both lower and higher levels after redundancy removal. Key reasons for item removal across facets are summarized as follows:
- Occupied or Minority Community Assignment: Items within the Sincerity (HSinc 5, 7, 9, 10), Fairness (HFair5), Greed Avoidance (HGree 1, 2), and other facets were removed due to their assignment to occupied or minority communities, suggesting they diverged from the main constructs.
- Low Replication Proportion: Items across facets such as Social Boldness, Dependence, and Expressiveness were excluded due to low replication proportions, indicating inconsistent measurement reliability within these communities.
- Community Overlap with Related Facets: Items in the Unconventionality facet (e.g., OUnco 4, 10) were assigned to the same community as Creativity items, a permissible overlap given their shared emphasis on unique perspectives, norm-challenging, and innovation (Ashton, 2023).
3.1.4. Hierarchical EGA with Both GLASSO and TMFG
After identifying construct-irrelevant statement items from both the GLASSO and TMFG conditions, the results from both conditions were combined by removing items that were flagged at least once by either condition. The combined condition revealed a total of 110 construct-irrelevant statement items distributed across six dimensions as follows:
- Honesty/Humility: HSinc 2, 3, 5, 7, 9, 10; HFair 1, 5; HGree 1, 2, 3, 4, 8; HMode 1, 2, 3, 5, 6, 9, 10.
- Emotionality: EAnxi 5, 7, 8, 9; EDepe 4, 5, 6, 7, 9; ESent 2, 3, 5, 6, 7, 8, 9, 10.
- Extraversion: XExpr 1, 2, 3, 5, 6, 7, 8, 10; XSocB 1, 2, 3, 6, 7, 8, 9, 10; XSoci 2, 4; XLive 3, 4, 6, 7, 8, 10.
- Agreeableness: AForg 7, 9, 10; AGent 1, 2, 4, 5, 7, 8, 9; AFlex 1, 2, 4, 10; APati 6, 10.
- Conscientiousness: COrga 1, 2, 3, 5, 8, 10; CDili 3, 5, 10; CPerf 3, 9, 10; CPrud 1, 2, 3.
- Openness to Experience: OAesA 1, 5; OInqu 2, 4, 5; OCrea 1, 3, 8, 9, 10; OUnco 2, 4, 5, 6, 7, 8, 9, 10.
3.1.5. Model Fit Evaluation for Final Condition Selection
Results from the network psychometrics approach for three conditions (i.e., GLASSO, TMFG, Hybrid of both algorithms) were evaluated for CFA model fit and TEFI at general, lower-order, and higher-order levels. Median dimension and replication frequency were also analyzed to assess alignment between empirical and theoretical HEXACO structures.
Theoretical Fit Evaluation
Table S4 in the Supplemental Materials presents the theoretical CFA fit indices, including RMSEA, SRMR, CFI, and TLI, for all three conditions of the network analysis, including the baseline condition for reference. RMSEA values are interpreted as follows: less than 0.05 indicates a good fit, between 0.05 and 0.08 is acceptable, between 0.08 and 0.1 is marginal, and greater than 0.1 is poor (Fabrigar et al., 1999). SRMR values less than 0.08 indicate a good fit (Hu & Bentler, 1998). For CFI and TLI, values greater than 0.95 indicate a good fit (Hu & Bentler, 1999).
The baseline CFA model shows mixed fit indices: good RMSEA (0.042), but poor SRMR (0.096), CFI (0.591), and TLI (0.587). In the experimental conditions, hierarchical EGA revision with GLASSO yields acceptable RMSEA (0.05), poor SRMR (0.094), CFI (0.677), and TLI (0.671). The dataset after CIV item removal with TMFG shows good RMSEA (0.049) but poor SRMR (0.1), CFI (0.649), and TLI (0.644). Finally, the revision with both GLASSO and TMFG results in acceptable RMSEA (0.05), poor SRMR (0.96), CFI (0.695), and TLI (0.689).
Empirical Fit Evaluation
Table S5 in the Supplemental Materials presents the empirical CFA fit indices for all three conditions of the network analysis, including the baseline condition for reference. The structure of each condition is arranged based on the suggested empirical solutions from hierarchical EGA. The dataset includes additional conditions wherein the final structure, revised by hierarchical EGA with both GLASSO and TMFG, is re-evaluated using both methods to identify the optimal empirical structure.
The baseline condition exhibits mixed CFA model fit indices: RMSEA = 0.042 (good), SRMR = 0.096 (poor), CFI = 0.591 (poor), and TLI = 0.587 (poor), consistent with the theoretical fit result. Following a revision with hierarchical EGA via the GLASSO algorithm, the hierarchical EGA with GLASSO yields RMSEA = 0.041 (good), SRMR = 0.090 (poor), CFI = 0.737 (poor), and TLI = 0.729 (poor). Revision with the TMFG algorithm shows RMSEA = 0.038 (good), SRMR = 0.096 (poor), CFI = 0.707 (poor), and TLI = 0.700 (poor). When combining the results from both GLASSO and TMFG (estimated by GLASSO), the model fit is RMSEA = 0.042 (good), SRMR = 0.091 (poor), CFI = 0.741 (poor), and TLI = 0.732 (poor). When data of the combined condition is estimated by TMFG, the fit is RMSEA = 0.044 (good), SRMR = 0.106 (poor), CFI = 0.709 (poor), and TLI = 0.700 (poor).
Network Fit Evaluation
Tables S6 and S7 in the Supplemental Materials present the network fit indices, specifically TEFI, dimension information, and replication frequency across all conditions, which are two baseline conditions (GLASSO and TMFG) and four experimental conditions (i.e., non-CIV dataset estimated by GLASSO, TMFG, combined results with GLASSO as the final estimation, and combined results with TMFG as the final estimation).
The baseline models showed generalized TEFI values of −1349.266 (GLASSO) and −1155.893 (TMFG). For the GLASSO baseline, the 48 lower-order dimensions had a replication frequency of 0.25, and the 6 higher-order dimensions had 0.324. For the TMFG baseline, the 26 lower-order dimensions had a replication frequency of 0.287, and the 4 higher-order dimensions had 0.509.
In the experimental condition, generalized TEFI values ranged from −515.072 to −721.450. The models identified 18–23 lower-order dimensions with replication frequencies of 0.451–0.595, and primarily yielded 3 higher-order dimensions (one case of 5) with replication frequencies of 0.451–0.678. Models revised using both GLASSO and TMFG produced generalized TEFI values of −583.384 (GLASSO estimation) and −515.072 (TMFG estimation), with 23 and 18 lower-order dimensions (replication frequencies 0.539 and 0.466) and 3 higher-order dimensions (replication frequencies 0.617 and 0.551), respectively.
Final Dataset Selection
After evaluating the theoretical CFA fit, empirical CFA fit, and network fit, the dataset revised by hierarchical EGA with both GLASSO and TMFG (with final estimation by GLASSO) was selected as the final dataset. This selection was based on several factors: First, this condition demonstrated the best theoretical and empirical CFA fit among all conditions, with the highest CFI and TLI values (although still in the poor range), and slightly better SRMR compared to other conditions.
Second, this condition demonstrated a robust dimensional structure, with replication frequencies of 53% at the lower level and 61% at the higher level. Third, the estimated structure closely aligned with the HEXACO model, yielding 23 lower-level dimensions and 3 higher-level dimensions, compared to the theoretical 24 facets and 6 dimensions (Ashton, 2023). While the results of the hierarchical EGA with GLASSO condition better matched the theoretical higher-level dimensions (5 dimensions), its lower replication frequency led to its exclusion.
Fourth, this condition outperformed the GLASSO-only and TMFG-only conditions in generalized, higher-order, and lower-order TEFI, indicating reduced structural uncertainty. Despite not having the lowest TEFI values, this condition was selected for its superior theoretical and empirical CFA fit, which outweighed network fit considerations. As a result, the dataset resulting from this condition was selected to be validated with the traditional psychometrics results.
3.1.6. Summary of Network Findings
The network psychometrics analyses consistently identified items that contributed to CIV. UVA detected 22 redundant items, many of which showed large to very large redundancy values, indicating substantial overlap in content. Hierarchical EGA further identified a large set of items that were misaligned with their theoretical communities, with the GLASSO algorithm flagging 80 items and the TMFG algorithm flagging 59 items. When results from both estimation methods were combined, 110 items across all six HEXACO dimensions were identified as construct-irrelevant. Post-reduction analyses demonstrated modest improvements in overall model fit, particularly in terms of RMSEA, but CFI and TLI values remained below conventional thresholds. These results indicate that network methods are effective in detecting both redundancy and construct misalignment.
One caveat remains. Despite item removal, overall model fit remained below conventional thresholds. This is likely because CIV may not be the sole source of misfit in the HEXACO dataset. The structure itself is highly multidimensional, with facets that overlap conceptually (e.g., creativity and unconventionality) and items that cross-load across dimensions. Such structural complexity could be difficulty to achieve desirable fit level as this violates the assumption of simple structure that underlies many confirmatory modeling techniques, leading to inflated residuals and suppressed fit indices, even when problematic items are removed (Falk & Muthukrishna, 2023). As the number of parameters increases, so does the risk of overfitting and estimation instability, which can result in poor performance on global fit metrics such as CFI, TLI, and RMSEA, even when the model captures meaningful psychological structure (Finch & French, 2019). Additionally, data quality plays a critical role. In open-access datasets, such as the utilized HEXACO collected via public platforms, careless or disengaged responding can introduce noise that undermines the structural coherence of the model. Without mechanisms to detect and exclude such cases, even well-specified models may exhibit poor fit.
3.2. Traditional Psychometrics
3.2.1. Item Analysis
Table S8 in the Supplemental Materials outlines the psychometric properties of CIV items identified from the network psychometrics approach. The table shows point-biserial correlation (pBis), IRT a-parameter, and coefficient alpha if items are deleted. The table also includes the overall coefficient alpha of each facet and the mean a-parameter within each facet for reference.
Thirteen items contributed to an increase in their facet’s coefficient alpha (ranging from 0.001 to 0.021 increase): HSinc10, HGree2, EAnxi8, AGent2, AFlex1, APati10, COrga5, CPerf10, CPrud1, OAesA5, OInqu2, OCrea9, and OUnco10. Two items showed low CTT discrimination (pBis < 0.20): HSinc10 (pBis = 0.19) and OInqu2 (pBis = 0.195). Forty-eight items demonstrated low IRT discrimination compared to their intra-facet mean a-parameters:
- Honesty/Humility: 9 items with Δ ranges from −0.11 to −1.041 (HSinc9, 10; HFair5; HGree1, 2, 3, 8; HMode2, 3).
- Emotionality: 9 items with Δ ranges from −0.053 to −0.568 (EAnxi7, 8; EDepe6, 7, 9; ESent5, 6, 7, 8).
- Extraversion: 8 items with Δ ranges from −0.150 to −0.582 (XExpr2, 5, 10; XSocB1, 6, 10; XLive7, 10).
- Agreeableness: 9 items with Δ ranges from −0.066 to −0.869 (AForg9, 10; AGent2, 4, 9; AFlex1, 2, 4; APati10).
- Conscientiousness: 4 items with Δ ranges from −0.048 to −0.513 (COrga5, 10; CPerf3, 10).
- Openness to experience: 9 items with Δ ranges from −0.035 to −0.936 (OInqu5; OCrea3, 9, 10; OUnco4, 6, 7, 8, 9).
3.2.2. DIF Analysis
Table S9 in the Supplemental Materials presents the DIF analysis results for the CIV items. Among the 110 items identified from the network psychometrics approach, 80 items demonstrated significant DIF. Such items are as follows:
- Honesty/Humility: 15 items showed DIF (χ2 = 11.361–280.467, p < 0.05), including items from HSinc, HFair, HGree, and HMode facets.
- Emotionality: 15 items displayed DIF (χ2 = 10.615–179.562, p < 0.05), including items from EAnxi (5, 7, 9), EDepe (4, 5, 6, 7, 9), and ESent (2, 3, 5, 7, 8, 9, 10) facets.
- Extraversion: 18 items exhibited DIF (χ2 = 6.942–104.018, p < 0.05), including items from XExpr (1, 2, 3, 5, 6, 7, 8), XSocB (1, 3, 8, 9, 10), XSoci (2, 4), and XLive (3, 6, 7, 8) facets.
- Agreeableness: 12 items showed DIF (χ2 = 11.323–163.879, p < 0.05), including items from AForg (7, 10), AGent (1, 2, 4, 7, 8, 9), AFlex (2, 4, 10), and APati (6) facets.
- Conscientiousness: 9 items demonstrated DIF (χ2 = 6.877–116.98, p < 0.05), including items from COrga (1, 2, 3, 5), CDili (3, 5, 10), CPerf (3), and CPrud (1) facets.
- Openness: 11 items displayed DIF (χ2 = 7.716–302.163, p < 0.05), including items from OAesA (1, 5), OInqu (2), OCrea (1, 9, 10), and OUnco (4, 5, 6, 8, 10) facets.
3.2.3. Factor Analysis
EFA for Construct Irrelevant Items
EFA with the training dataset reveals that 42 items are misloaded onto unintended dimensions as follows:
- Honesty/Humility: 9 items misloaded (ESent8, AForg7, 8, AGent7, 10, AFlex8, 10, OInqu9, OAesA10).
- Emotionality: 14 items misloaded (APati10, CPrud7, 9, 10, HGree8, HFair5, XLive9, 10, HSinc9, 10, HMode2, 4, AFlex4, 5).
- Extraversion: 6 items misloaded (HMode7, AForg9, 10, EDepe9, HGree1, OAesA9).
- Agreeableness: 1 item misloaded (HMode1).
- Conscientiousness: 3 items misloaded (OUnco8, HMode8, HGree2).
- Openness: 9 items misloaded (EFear5, 6, 8, 9, 10, XSocB5, XLive7, AGent9, HMode3).
CFA for Model Fit and Psychometrically Redundant Items
Initial CFA of remaining items after EFA screening showed preliminary fit statistics of RMSEA = 0.05, SRMR = 0.097, CFI = 0.595, and TLI = 0.59, consistent with the baseline model estimated by the network psychometrics approach. Among 22 items flagged as redundant by UVA, 11 items showed high correlations (r > 0.70): HGree4 (r = 0.71 with HMode5), HMode2, 3 (r = 0.65–0.81 with each other and HMode4), EAnxi7 (r = −0.74 with XLive10), ESent6 (r = 0.82 with ESent3), XExpr6 (r = 0.80 with XExpr8), XLive3 (r = 0.72 with XLive1), AForg9 (r = 0.73 with AForg10), CPerf3 (r = 0.56–0.73 with CPerf1, 9), OInqu4 (r = 0.73 with OInqu8), OUnco9 (r = 0.70 with OUnco7).
The remaining 11 UVA-flagged items showed moderate correlations (r = 0.46–0.68), which are HFair1, HGree3, HMode6, AForg7, COrga1, CPerf9, CPrud3 OAesA1, OInqu5, OCrea1, 8. These items, while not meeting the strict redundancy criteria, still show significant correlations with their peers that could be considered as approaching redundancy.
3.2.4. Summary of Traditional Findings
The traditional psychometric analyses provided complementary evidence supporting the classification of many network-flagged items as construct-irrelevant. Item analysis showed that several items increased internal consistency when removed, and a substantial number demonstrated low discrimination under both classical and item response theory frameworks. DIF analysis revealed that the majority of flagged items performed differently across native and non-native English speakers, suggesting fairness concerns in addition to construct-irrelevance. Factor analyses added further evidence, with EFA showing numerous items cross-loading onto unintended factors and confirmatory factor analysis highlighting redundancy through strong pairwise correlations. Taken together, the traditional analyses corroborated the network results by confirming that many of the same items exhibited weak discrimination, redundancy, or differential functioning, reinforcing their classification as problematic.
3.3. The Comparison of CIV Items Between the Two Approaches
3.3.1. Inter-Approach Agreement
After identifying CIV items from both the network psychometrics approach and the traditional psychometrics approach, a comparison was conducted to evaluate the consistency between the network psychometrics and traditional psychometrics approaches in identifying CIV items. Out of 110 CIV items identified by the network psychometrics approach, 98 overlapped with those identified by the traditional psychometrics approach, indicating an 89% agreement. This substantial alignment suggests comparable effectiveness of both methods in detecting CIV items. Examples of items in each HEXACO dimension that were identified as CIV items by both approaches are as follows:
- Honesty-Humility: 18 items (e.g., Sinc2, HSinc7, HFair1, HGree3, HMode10).
- Emotionality: 16 items (e.g., EAnxi5, EDepe4, ESent7).
- Extraversion: 20 items (e.g., XExpr1, XSocB6, XLive8).
- Agreeableness: 14 items (e.g., AForg7, AGent4, AFlex10).
- Conscientiousness: 11 items (e.g., COrga2, CDili3, CPrud1).
- Openness to Experience: 15 items (e.g., OAesA1, OCrea9, OUnco7).
This high level of agreement implies that both approaches may be comparable in their capability to detect CIV items.
3.3.2. Inter-Approach Disagreement
For the remaining 12 items that did not achieve agreement between the two approaches, the items are HSinc3, HSinc5, XSocB2, XSocB7, XLive4, AGent5, COrga8, CPerf9, CPrud2, CPrud3, OCrea8, and OUnco2. Items CPerf9, CPrud3, and OCrea8 were flagged as redundant items by UVA. Despite not being flagged by the traditional psychometrics approach, these three items share marginally large correlations with their peers, ranging from 0.60 to 0.65. Given their marginally strong relationships with their peers, they could be considered borderline redundant items.
HSinc3 and HSinc5 were flagged as CIV items by the network approach because they were assigned to the same community as the fairness facet. The issue may lie in the variation in test takers’ response patterns, which align more closely with the fairness facet, causing these two items to be grouped in the same cluster as the fairness facet. XSocB2, XSocB7, XLive4, and AGent5 were flagged as CIV by the network approach due to low replication proportions at the higher level. The replication proportion statistics were calculated from the frequency with which these items appeared in their assigned community across bootstrap iterations. The mechanism behind these statistics may deviate from the indicator of CIV items in traditional psychometrics (e.g., coefficient alpha, DIF statistics) due to their differing methodologies.
COrga8, CPrud2, and OUnco2 were flagged as CIV items due to their assignment to minority communities. The community detection algorithm in hierarchical EGA was set to “Louvain” for lower-order community and “walktrap” for higher-order community. The Louvain method operates based on the multi-level modularity optimization algorithm (Blondel et al., 2008), while the walktrap method operates using the random walk algorithm (Pons & Latapy, 2006). These algorithms differ from traditional psychometric indicators of CIV items and, therefore, may produce results that deviate from those of the traditional psychometric approach, especially for borderline CIV items.
3.3.3. Summary of Comparison
The comparison between network and traditional approaches revealed strong convergence alongside meaningful points of divergence. Of the 110 construct-irrelevant items flagged by network psychometrics, 98 were also identified by traditional methods, indicating an 89 percent agreement rate. This high overlap suggests that problematic items often display distinctive statistical signatures that are detectable across multiple frameworks. The 12 items that were not jointly identified point to the unique sensitivities of each approach. Network analyses were more likely to flag items based on instability of community assignment or redundancy, while traditional methods were more likely to flag items through discrimination statistics or DIF. The combination of high agreement and targeted disagreement suggests that network and traditional psychometrics can be used complimentarily. Network methods provide a broad structural filter that highlights instability and redundancy, while traditional methods supply fine-grained item-level diagnostics related to reliability and fairness. Together, they provide could a more comprehensive assessment of CIV than either could achieve in isolation.
4. Discussion
The objective of this study is to test the capability of the network psychometrics approach in detecting CIV items and validate it with the traditional psychometrics approach. To address the question of How effective is the network psychometrics approach in identifying CIV items?, Network psychometrics demonstrates a robust capacity for identifying CIV items by detecting redundancies and deviations within items relative to their intended facets. Through metrics such as community assignment, replication proportion, and TEFI, network psychometrics successfully highlight items with problematic properties. Specific network-based statistics, including wTO and median dimension, enable an evaluation of item-level details, while TEFI offers a broader assessment of model fit.
Results indicate high agreement between network and traditional psychometric approaches, with nearly ninety percent of flagged items identified by both methods. This convergence suggests that CIV leaves distinctive statistical signatures detectable across very different frameworks. Redundant items, for example, violate the local independence assumption while simultaneously producing high redundancy coefficients in network analysis (Wood et al., 2023). Similarly, construct-irrelevant items that disrupt dimensional coherence are likely to emerge both as cross-loadings in factor analysis and as unstable communities in network models. In this sense, the high overlap is promising, as it indicates that the two methodological traditions, despite their different assumptions, converge on items that pose a threat to validity (Christensen & Golino, 2021a; Finch & French, 2019; Messick, 1989).
The eleven percent of items on which the two approaches disagreed is equally informative. Items flagged only by network methods tended to show structural instability or redundancy in the item network but did not exhibit poor discrimination or fairness problems under traditional metrics. Conversely, items flagged only by traditional methods were often those that showed differential functioning across native and non-native speakers or subtle reliability issues, which are features that network approaches do not directly assess. These points of divergence highlight the unique sensitivities of each approach, with network methods excel at detecting instability and redundancy at the structural level, while traditional methods provide fine-grained diagnostics of fairness and item performance (Finch & French, 2019; H. F. Golino & Epskamp, 2017).
Overall, the agreement and disagreement results indicate that the two approaches are complementary. High agreement indicates robust identification of problematic items, while disagreement points to the distinct contributions of each method. For the test development process, this implies that network psychometrics should not replace traditional methods, but rather be used alongside them to provide a more comprehensive evaluation of CIV issues for instrument refinement. These results are consistent with prior work by showing that factor-analytic and network approaches often converge on problematic items (Verkuilen et al., 2021). By leveraging the convergent strengths of both approaches and the unique contributions each brings, practitioners can more effectively enhance the validity and fairness of psychological assessments to support interpretations, decisions, and uses made from the test.
5. Conclusions
5.1. Practical Implications
The findings of this study demonstrate that the network psychometrics approach is a robust and complementary tool to traditional psychometric methods for identifying CIV items. This has important implications for both researchers and practitioners engaged in the design, evaluation, and refinement of psychological assessments.
The network psychometrics approach provides nuanced insights into both item-level properties by utilizing metrics such as community assignment, or structure-level properties such as replication proportion and TEFI. These tools allow for the precise identification of items that are redundant or deviate from their intended measurement facets. The wTO metric, for instance, categorizes redundancies into actionable groups, allowing researchers to decide whether to revise, combine, or remove problematic items based on the degree of redundancy.
The comparison between GLASSO and TMFG algorithms offers actionable guidance for selecting the appropriate network estimation method. While GLASSO demonstrates closer alignment with the theoretical HEXACO model due to its focus on partial correlations, TMFG provides greater structural stability as evidenced by lower TEFI values. Researchers can leverage these findings to make informed choices based on the specific requirements of their data and the dimensionality of their measurement models. For instance, TMFG may be preferable for achieving a stable network fit with a simple structure, while GLASSO might better capture theoretical structures in complex multidimensional models.
The adoption of network psychometrics can lead to more robust and adaptable assessment practices. By integrating this approach into the item development and validation process, researchers can achieve a more comprehensive understanding of item functioning. The ability to detect CIV items through both redundancy and deviations enhances the overall validity and reliability of assessments, reducing the risk of measurement error and improving interpretability.
5.2. Limitations and Future Directions
Despite the promising results of this study, several limitations should be acknowledged. First, the network psychometrics approach was applied exclusively to the HEXACO dataset, which may limit the generalizability of the findings to other psychological assessment tools or datasets with different structures and dimensionalities. Future studies should evaluate the utility of network psychometrics across diverse datasets and psychological constructs to establish broader applicability.
Another limitation concerns our comparison design. Traditional psychometric analyses were applied only to items flagged by the network approach, rather than to the full dataset. Although this limits the symmetry of comparison, it was necessitated by the scale of the dataset and also reflects a deliberate design choice. Item-level IRT and factor analyses rely on iterative convergence processes that become computationally prohibitive with over 5.4 million data points. At the same time, this two-stage design reflects practical realities of large-scale test development, where preliminary screening is necessary before running resource-intensive diagnostics. Future research with access to extended computational resources could apply both approaches exhaustively across entire datasets to further explore their relative sensitivity.
Furthermore, the reliance on specific algorithms, namely GLASSO and TMFG, introduces potential biases related to their underlying assumptions and operational mechanics. For instance, TMFG’s reliance on a four-node starting configuration may oversimplify representations in multidimensional models, while GLASSO’s penalization mechanism could overlook subtle relationships. Additional exploration of alternative network estimation methods, such as the Bayesian Gaussian Graphical Model, could provide a more comprehensive understanding of their comparative strengths and limitations (H. Golino et al., 2022).
Another limitation concerns model fit. Despite the removal of construct-irrelevant items, overall fit remained below conventional thresholds. The structural complexity of HEXACO made it difficult to achieve simple structure assumptions that underlie many confirmatory models (Falk & Muthukrishna, 2023). The dataset is also prone to careless or disengaged responses, which may introduce noise in the data. Future work could address these issues by examining alternative model specifications and testing dimensionality in more homogeneous samples.
Finally, we recognize that some traditional indicators such as coefficient alpha or DIF analysis may perform sub-optimally with long instrument (Cortina, 1993). This issue is inherent in the utilized datasets and is mitigated through the triangulation with multiple indices. Future studies could apply similar methods employed in this study to a wider range of psychological assessments, including those with varying levels of complexity and length, to test its robustness and generalizability. Cross-cultural validation may also provide insights into the method’s applicability in different contexts and populations. Future research should focus on examining cases where network and traditional methods yield different results. Understanding the nature of these divergences could uncover situations where one approach outperforms the other, providing a basis for targeted methodological improvements.
In conclusion, the findings highlight the practical utility of network psychometrics in psychological measurement, offering an innovative and effective approach for identifying and refining CIV items. The method’s alignment with traditional psychometric principles and its unique capabilities provide researchers and practitioners with a versatile tool for enhancing the quality of psychological assessments.
Supplementary Materials
The following supporting information can be downloaded at: https://www.mdpi.com/article/10.3390/psycholint7040088/s1. Table S1. The HEXACO-PI Item Content Measuring Six Domains and 24 Facets. Table S2. The Output of Hierarchical EGA with GLASSO Estimation in the UVA Stream. Table S3. The Output of Hierarchical EGA with TMFG Estimation in the UVA Stream. Table S4. Theoretical Fit Indices of All Item Filtering Conditions. Table S5. Empirical Fit Indices of All Item Filtering Conditions. Table S6. Network Fit Indices of the Baseline Conditions. Table S7. Network Fit Indices of Models in the UVA Stream. Table S8. Item Analysis Results of the CIV Items Identified From the Network Psychometrics Approach. Table S9. DIF Analysis Results of the CIV Items Identified From the Network Psychometrics Approach.
Author Contributions
Conceptualization, T.W.; methodology, T.W.; validation, T.W., O.B.; formal analysis, T.W.; investigation, T.W.; writing—original draft preparation, T.W.; writing—review and editing, T.W.; visualization, T.W.; supervision, O.B. All authors have read and agreed to the published version of the manuscript.
Funding
This research received no external funding.
Institutional Review Board Statement
Not applicable.
Informed Consent Statement
Not applicable.
Data Availability Statement
The data is publicly available at https://openpsychometrics.org/_rawdata/ accessed on 22 February 2025.
Conflicts of Interest
The authors declare no conflicts of interest.
Abbreviations
The following abbreviations are used in this manuscript:
| CIV | Construct-Irrelevant Variance |
| EFA | Exploratory Factor Analysis |
| CFA | Confirmatory Factor Analysis |
| DIF | Differential Item Functioning |
| CTT | Classical Test Theory |
| IRT | Item Response Theory |
| RMSEA | Root Mean Square Error of Approximation |
| SRMR | Standardized Root Mean Square Residual |
| CFI | Comparative Fit Index |
| TLI | Tucker–Lewis Index |
| EGA | Exploratory Graph Analysis |
| UVA | Unique Variable Analysis |
| TMFG | Triangulated Maximally Filtered Graph |
| GLASSO | Graphical Least Absolute Shrinkage and Selection Operator |
| TEFI | Total Entropy Fit Index |
| wTO | Weighted Topological Overlap |
| IPIP | International Personality Item Pool |
| MHRM | Metropolis-Hastings Robbins-Monro |
| BH | Benjamini-Hochberg |
| pBis | point-Biserial Correlation |
References
- Acar Güvendir, M., & Özer Özkan, Y. (2022). Item removal strategies conducted in exploratory factor analysis: A comparative study. International Journal of Assessment Tools in Education, 9(1), 165–180. [Google Scholar] [CrossRef]
- Alavi, S. M., & Bordbar, S. (2017). Differential item functioning analysis of high-stakes test in terms of gender: A Rasch model approach. Malaysian Online Journal of Educational Sciences, 5(1), 10–24. [Google Scholar]
- Ashton, M. C. (2023). Individual differences and personality (4th ed.). Academic Press. [Google Scholar]
- Ashton, M. C., Lee, K., & Goldberg, L. R. (2007). The IPIP–HEXACO scales: An alternative, public-domain measure of the personality constructs in the HEXACO model. Personality and Individual Differences, 42(8), 1515–1526. [Google Scholar] [CrossRef]
- Baba, K., Shibata, R., & Sibuya, M. (2004). Partial correlation and conditional correlation as measures of conditional independence. Australian & New Zealand Journal of Statistics, 46(4), 657–664. [Google Scholar] [CrossRef]
- Blondel, V. D., Guillaume, J.-L., Lambiotte, R., & Lefebvre, E. (2008). Fast unfolding of communities in large networks. Journal of Statistical Mechanics: Theory and Experiment, 2008(10), P10008. [Google Scholar] [CrossRef]
- Borsboom, D., Deserno, M. K., Rhemtulla, M., Epskamp, S., Fried, E. I., McNally, R. J., Robinaugh, D. J., Perugini, M., Dalege, J., Costantini, G., Isvoranu, A.-M., Wysocki, A. C., van Borkulo, C. D., van Bork, R., & Waldorp, L. J. (2021). Network analysis of multivariate data in psychological science. Nature Reviews Methods Primers, 1(1), 58. [Google Scholar] [CrossRef]
- Brown, T. A. (2015). Confirmatory factor analysis for applied research (2nd ed.). The Guilford Press. [Google Scholar]
- Bulut, O., & Suh, Y. (2017). Detecting multidimensional differential item functioning with the multiple indicators multiple causes model, the item response theory likelihood ratio test, and logistic regression. Frontiers in Education, 2, 51. [Google Scholar] [CrossRef]
- Central Intelligence Agency. (2021). Field listing—Languages. Available online: https://www.cia.gov/the-world-factbook/about/archives/2021/field/languages/ (accessed on 12 October 2023).
- Chalmers, R. P. (2012). mirt: A multidimensional item response theory package for the R environment. Journal of Statistical Software, 48(6), 1–29. [Google Scholar] [CrossRef]
- Chew, P. K. H., Dillon, D. B., & Swinbourne, A. L. (2018). An examination of the internal consistency and structure of the statistical anxiety rating scale (STARS). PLoS ONE, 13(3), e0194195. [Google Scholar] [CrossRef] [PubMed]
- Christensen, A. P., Cotter, K. N., & Silvia, P. J. (2019). Reopening openness to experience: A network analysis of four openness to experience inventories. Journal of Personality Assessment, 101(6), 574–588. [Google Scholar] [CrossRef]
- Christensen, A. P., Garrido, L. E., & Golino, H. (2023). Unique variable analysis: A network psychometrics method to detect local dependence. Multivariate Behavioral Research, 58(6), 1165–1182. [Google Scholar] [CrossRef]
- Christensen, A. P., & Golino, H. (2021a). Estimating the stability of psychological dimensions via bootstrap exploratory graph analysis: A monte carlo simulation and tutorial. Psych, 3(3), 479–500. [Google Scholar] [CrossRef]
- Christensen, A. P., & Golino, H. (2021b). On the equivalency of factor and network loadings. Behavior Research Methods, 53(4), 1563–1580. [Google Scholar] [CrossRef] [PubMed]
- Christensen, A. P., Kenett, Y. N., Aste, T., Silvia, P. J., & Kwapil, T. R. (2018). Network structure of the wisconsin schizotypy scales–short forms: Examining psychometric network filtering approaches. Behavior Research Methods, 50(6), 2531–2550. [Google Scholar] [CrossRef] [PubMed]
- Cor, M. K. (2018). Measuring social science concepts in pharmacy education research: From definition to item analysis of self-report instruments. Currents in Pharmacy Teaching and Learning, 10(1), 112–118. [Google Scholar] [CrossRef]
- Cortina, J. M. (1993). What is coefficient alpha? An examination of theory and applications. Journal of Applied Psychology, 78(1), 98. [Google Scholar] [CrossRef]
- Cronbach, L. J. (1951). Coefficient alpha and the internal structure of tests. Psychometrika, 16(3), 297–334. [Google Scholar] [CrossRef]
- De Beer, M. (2004). Use of differential item functioning (DIF) analysis for bias analysis in test construction. SA Journal of Industrial Psychology, 30(4), 52–58. [Google Scholar] [CrossRef][Green Version]
- De Champlain, A. F. (2010). A primer on classical test theory and item response theory for assessments in medical education. Medical Education, 44(1), 109–117. [Google Scholar] [CrossRef]
- Downing, S. M. (2002). Construct-irrelevant variance and flawed test questions: Do multiple-choice item-writing principles make any difference? Academic Medicine, 77(10), S103–S104. [Google Scholar] [CrossRef]
- Epskamp, S. (2017). Network psychometrics [Unpublished doctoral dissertation, University of Amsterdam]. [Google Scholar]
- Fabrigar, L. R., Wegener, D. T., MacCallum, R. C., & Strahan, E. J. (1999). Evaluating the use of exploratory factor analysis in psychological research. Psychological Methods, 4(3), 272. [Google Scholar] [CrossRef]
- Falk, C. F., & Muthukrishna, M. (2023). Parsimony in model selection: Tools for assessing fit propensity. Psychological Methods, 28(1), 123–136. [Google Scholar] [CrossRef]
- Finch, W. H., & French, B. F. (2019). Educational and psychological measurement. Routledge. [Google Scholar]
- Finch, W. H., French, B. F., & Hazelwood, A. (2023). A comparison of confirmatory factor analysis and network models for measurement invariance assessment when indicator residuals are correlated. Applied Psychological Measurement, 47(2), 014662162311517. [Google Scholar] [CrossRef]
- Flora, D. B., LaBrish, C., & Chalmers, R. P. (2012). Old and new ideas for data screening and assumption testing for exploratory and confirmatory factor analysis. Frontiers in Psychology, 3, 55. [Google Scholar] [CrossRef] [PubMed]
- Goldberg, L. R., Johnson, J. A., Eber, H. W., Hogan, R., Ashton, M. C., Cloninger, C. R., & Gough, H. G. (2006). The international personality item pool and the future of public-domain personality measures. Journal of Research in Personality, 40(1), 84–96. [Google Scholar] [CrossRef]
- Golino, H., Christensen, A., Moulder, R., Garrido, L. E., Jamison, L., & Shi, D. (2022). EGAnet: Exploratory graph analysis—A framework for estimating the number of dimensions in multivariate data using network psychometrics. Available online: https://cran.r-project.org/web/packages/EGAnet/index.html (accessed on 2 March 2025).
- Golino, H., Moulder, R., Shi, D., Christensen, A. P., Garrido, L. E., Nieto, M. D., Nesselroade, J., Sadana, R., Thiyagarajan, J. A., & Boker, S. M. (2021). Entropy fit indices: New fit measures for assessing the structure and dimensionality of multiple latent variables. Multivariate Behavioral Research, 56(6), 874–902. [Google Scholar] [CrossRef] [PubMed]
- Golino, H. F., & Epskamp, S. (2017). Exploratory graph analysis: A new approach for estimating the number of dimensions in psychological research. PLoS ONE, 12(6), e0174035. [Google Scholar] [CrossRef] [PubMed]
- Haladyna, T. M., & Downing, S. M. (2005). Construct-irrelevant variance in high-stakes testing. Educational Measurement: Issues and Practice, 23(1), 17–27. [Google Scholar] [CrossRef]
- Haladyna, T. M., & Rodriguez, M. C. (2013). Developing and validating test items. Routledge. [Google Scholar]
- Hallquist, M. N., Wright, A. G., & Molenaar, P. C. (2021). Problems with centrality measures in psychopathology symptom networks: Why network psychometrics cannot escape psychometric theory. Multivariate Behavioral Research, 56(2), 199–223. [Google Scholar] [CrossRef]
- Hambleton, R., & Jones, R. (1993). An NCME instructional module on comparison of classical test theory and item response theory and their applications to test development. Educational Measurement: Issues and Practice, 12(3), 38–47. [Google Scholar]
- Hambleton, R. K., Swaminathan, H., & Rogers, H. J. (1991). Fundamentals of item response theory (Vol. 2). Sage. [Google Scholar]
- Hladká, A., & Martinková, P. (2020). difNLR: Generalized logistic regression models for DIF and DDF detection. The R Journal, 12(1), 300. [Google Scholar] [CrossRef]
- Hu, L.-t., & Bentler, P. M. (1998). Fit indices in covariance structure modeling: Sensitivity to underparameterized model misspecification. Psychological Methods, 3(4), 424. [Google Scholar] [CrossRef]
- Hu, L.-t., & Bentler, P. M. (1999). Cutoff criteria for fit indexes in covariance structure analysis: Conventional criteria versus new alternatives. Structural Equation Modeling: A Multidisciplinary Journal, 6(1), 1–55. [Google Scholar]
- Huang, J., Dong, Y., Han, C., & Wang, X. (2023). Evaluating the language- and culture-related construct-irrelevant variance and reliability of the sense of school belonging scale: Suggestions for revision. Journal of Psychoeducational Assessment, 4(18), 852–871. [Google Scholar] [CrossRef]
- Isvoranu, A.-M., Epskamp, S., Waldorp, L. J., & Borsboom, D. (Eds.). (2022). Network psychometrics with R: A guide for behavioral and social scientists. Routledge. [Google Scholar] [CrossRef]
- Jiménez, M., Abad, F. J., Garcia-Garzon, E., Golino, H., Christensen, A. P., & Garrido, L. E. (2023). Dimensionality assessment in bifactor structures with multiple general factors: A network psychometrics approach. Psychological Methods, 30(4), 770–792. [Google Scholar] [CrossRef]
- Kane, M. T. (2013). Validating the interpretations and uses of test scores. Journal of Educational Measurement, 50(1), 1–73. [Google Scholar] [CrossRef]
- Kassim, N. L. A. (2011). Judging behaviour and rater errors: An application of the many-facet rasch model. GEMA Online™ Journal of Language Studies, 11(3), 179–197. [Google Scholar]
- Massara, G. P., Di Matteo, T., & Aste, T. (2016). Network filtering for big data: Triangulated maximally filtered graph. Journal of Complex Networks, 5(2), 161–178. [Google Scholar] [CrossRef]
- Mellenbergh, G. J. (1995). Conceptual notes on models for discrete polytomous item responses. Applied Psychological Measurement, 19(1), 91–100. [Google Scholar] [CrossRef]
- Messick, S. (1989). Validity. In R. L. Linn (Ed.), Educational measurement (pp. 13–103). American Council on Education and Macmillan. [Google Scholar]
- Mislevy, R. J., & Chang, H.-H. (2000). Does adaptive testing violate local independence? Psychometrika, 65(2), 149–156. [Google Scholar] [CrossRef]
- Morin, A. J. S., Myers, N. D., & Lee, S. (2020). Modern factor analytic techniques: Bifactor models, exploratory structural equation modeling (ESEM), and bifactor-ESEM. In G. Tenenbaum, & R. C. Eklund (Eds.), Handbook of sport psychology (1st ed., pp. 1044–1073). Wiley. [Google Scholar] [CrossRef]
- Nowick, K., Gernat, T., Almaas, E., & Stubbs, L. (2009). Differences in human and chimpanzee gene expression patterns define an evolving network of transcription factors in brain. Proceedings of the National Academy of Sciences, 106(52), 22358–22363. [Google Scholar] [CrossRef]
- Nunnally, J. C., & Bernstein, I. H. (1994). Psychometric theory. McGraw-Hill. [Google Scholar]
- Nussbeck, F. W., Eid, M., & Lischetzke, T. (2006). Analysing multitrait–multimethod data with structural equation models for ordinal variables applying the WLSMV estimator: What sample size is needed for valid results? British Journal of Mathematical and Statistical Psychology, 59(1), 195–213. [Google Scholar] [CrossRef]
- Orcan, F. (2018). Exploratory and confirmatory factor analysis: Which one to use first? Journal of Measurement and Evaluation in Education and Psychology, 9(4), 414–421. [Google Scholar] [CrossRef]
- Pons, P., & Latapy, M. (2006). Computing communities in large networks using random walks. Journal of Graph Algorithms and Applications, 10(2), 191–218. [Google Scholar] [CrossRef]
- R Core Team. (2023). R: A language and environment for statistical computing. R Foundation for Statistical Computing. Available online: https://www.R-project.org/ (accessed on 2 March 2025).
- Reise, S. P., Bonifay, W., & Haviland, M. G. (2018). Bifactor modelling and the evaluation of scale scores. In P. Irwing, T. Booth, & D. J. Hughes (Eds.), The Wiley handbook of psychometric testing (1st ed., pp. 675–707). Wiley. [Google Scholar] [CrossRef]
- Rosseel, Y. (2012). lavaan: An R package for structural equation modeling. Journal of Statistical Software, 48(2), 1–36. [Google Scholar] [CrossRef]
- Tierney, N., & Cook, D. (2023). Expanding tidy data principles to facilitate missing data exploration, visualization and assessment of imputations. Journal of Statistical Software, 105(7), 1–31. [Google Scholar] [CrossRef]
- Verkuilen, J., Bianchi, R., Schonfeld, I. S., & Laurent, E. (2021). Burnout–depression overlap: Exploratory structural equation modeling bifactor analysis and network analysis. Assessment, 28(6), 1583–1600. [Google Scholar] [CrossRef]
- Willse, J. T. (2018). CTT: Classical test theory functions. Available online: https://CRAN.R-project.org/package=CTT (accessed on 2 March 2025).
- Wood, D., Lowman, G. H., Armstrong, B. F., & Harms, P. D. (2023). Using retest-adjusted correlations as indicators of the semantic similarity of items. Journal of Personality and Social Psychology, 125(2), 437–454. [Google Scholar] [CrossRef]
- Zanon, C., Hutz, C. S., Yoo, H., & Hambleton, R. K. (2016). An application of item response theory to psychological test development. Psicologia: Reflexão e Crítica, 29(1), 18. [Google Scholar] [CrossRef]
Disclaimer/Publisher’s Note: The statements, opinions and data contained in all publications are solely those of the individual author(s) and contributor(s) and not of MDPI and/or the editor(s). MDPI and/or the editor(s) disclaim responsibility for any injury to people or property resulting from any ideas, methods, instructions or products referred to in the content. |
© 2025 by the authors. Licensee MDPI, Basel, Switzerland. This article is an open access article distributed under the terms and conditions of the Creative Commons Attribution (CC BY) license (https://creativecommons.org/licenses/by/4.0/).