Abstract
Aims: To describe and analyze trends in the utilization, spending, and average per prescription price of disease-modifying antirheumatic drugs (DMARDs) in the US Medicaid population. Methods: Using the publicly available national outpatient Medicaid State Drug Utilization Data, a retrospective, descriptive trend analysis was conducted on DMARDs from 1991 to 2022. Annual prescription counts and reimbursement amounts were calculated for nonbiologic and biologic DMARDs. Average per prescription price and Market share competition were calculated and analyzed for DMARDs. Results: Medicaid utilization of nonbiologic peaked in 2021 with 884,000 while biologic DMARDs with 688,000 prescriptions. In 2022, biologic utilization took the lead and exceed nonbiologic with 1.5 million prescriptions. Over the last 32 years, biologics captured 94% of Medicaid expenditures toward DMARDs, of which, 56% was toward adalimumab alone. On the other hand, spending on conventional DMARDs accounted for 33% while 67% accounted toward Janus Kinase Inhibitors. Biologic DMARDs average prices increased from around $800 to around $6000. However, the average adalimumab price increased 12-fold from around $1200 in 2003 to over $15,000 in 2021. Medicaid spending toward adalimumab increased by 179%. Conclusions: The substantial increase of DMARDs utilization and expenditure contributed significant burden to Medicaid budget. Introducing biosimilars into the market in the past few years is eroding the market share for several established biologics. Further cost-containment policies may be necessary for costly DMARD pharmacotherapy.
Keywords:
arthritis; rheumatoid; antirheumatic agents; DMARDs; methotrexate; adalimumab; biosimilars; Medicaid; price; utilization 1. Introduction
Rheumatoid arthritis (RA) is a chronic autoimmune disease marked by an inflammatory polyarthritis that preferentially affects small joints. Although RA is a disease of unknown origin, genetic, environmental and lifestyle factors may play a part in this disorder []. RA is estimated to affect approximately 1% of the US population and is twice as common in females [,]. Moreover, RA in the US has a high healthcare cost, which is estimated at $19.3 billion [].
Disease-modifying antirheumatic Drugs (DMARDs) are recognized as medicines that improve the signs and symptoms of RA. DMARDs preserve joint function and reduce or prevent joint damage. However, DMARDs are also used to treat other conditions, such as ankylosing spondylitis, psoriatic arthritis, and systemic lupus erythematosus []. DMARDs are categorized into nonbiologic DMARDs and biologic (b) DMARDs. Traditional or nonbiologic DMARDs are known as conventional synthetic (cs) and targeted synthetic (ts) DMARDs []. Nonbiologic DMARDs are empirically developed old DMARDs to be used in the treatment of RA, including methotrexate, sulfasalazine, leflunomide, and hydroxychloroquine. Furthermore, nonbiologic DMARDs have well-established safety and efficacy profiles []. Biologic DMARDs, on the other hand, are highly specific medicines that target a specific pathway of the immune system; thus, are considered a successful treatment strategy for moderate and high RA activity []. Biologic DMARDs are grouped based on the molecular target to tumor necrosis factor (TNF)-alpha inhibitors, T-cell activation inhibitors, CD-20 activity blockers and Janus kinase inhibitors (JAKi) [].
The goal of RA treatment is to establish and maintain remission or minimal disease activity. Regardless of the level of disease activity (low, moderate, or high), patients with early RA should begin conventional DMARD monotherapy []. Nonetheless, the American College of Rheumatology recommends combining traditional DMARD therapy (in addition to methotrexate), a TNF inhibitor, a non-TNF inhibitor biologic, or tofacitinib if no response to conventional DMARD therapy is observed [].
The increasing use of specialty medicines, which includes biologics and represents 51% in 2022, is one of the main drivers of medicine spending in the US []. Therefore, the economic burden of RA is a significant concern for both patients and payers. The direct cost of RA management, which includes drug costs, contributes significantly to the total cost of illness []. A recent meta-analysis found that the total annual cost for any patient with RA was $12,509. However, this cost increased substantially from $26,469 to $52,837 when using bDMARDs []. It is worth highlighting that compared to other developed countries, the US has the highest total medicine expenditure. For instance, in 2017, the price of adalimumab in the US was five times higher than that in the United Kingdom []. The primary reason is that the US leaves drug pricing to market competition, whereas other developed countries directly control drug prices. Therefore, the US market is the most profitable for pharmaceutical companies.
RA treatment relies heavily on DMARDs to slow disease progression and enhance patients’ quality of life. Nevertheless, the rising costs of these medications and variations in prescription practices have raised concerns regarding accessibility, affordability, and healthcare sustainability. As healthcare systems strive to balance cost-effectiveness and optimal patient care, a comprehensive understanding of the utilization trends and expenditure patterns of DMARDs is required. Thus, this study aimed to evaluate DMARDs utilization, total expenditure, and pricing trends among Medicaid beneficiaries. We believe that the findings of this study may help patients, treatment guideline development, and healthcare stockholders to understand the overall utilization and costs of DMARDs.
2. Methods
2.1. Study Design
A descriptive, retrospective data analysis was conducted between 1 January 1991, and 31 December 2022, using the National Medicaid pharmacy files maintained by the Centers for Medicare & Medicaid Services (CMS) [].
The Medicaid pharmacy claims database includes beneficiaries from 50 states and the District of Columbia. Medicaid enrollments were from low-income families in the US. There were approximately 87.5 to 89 million beneficiaries in 2023. Each file in this database contains an 11-digit National Drug Code (NDC), drug name, year and quarter of Medicaid expenditure, number of pharmacy claims, number of units (e.g., individual capsules and tablets), and total (rebate) pharmacy reimbursement amount, including drug costs and dispensation fees. The first five digits of the NDC identify the drug manufacturer and the remaining digits identify specific drug products based on strength, dose formulation, and packaging. The database includes only outpatient prescriptions separately reimbursed by Medicaid as opposed to DMARD agents dispensed during patient hospitalizations. For the current study, data from the CMS’s annual spending reports on nonbiologic and biologic DMARDs (Table 1) across all ages were retrieved and analyzed using individual national drug code (NDC) drug forms.

Table 1.
Nonbiologic and biologic disease-modifying antirheumatic drugs (DMARDs).
2.2. Data Source and Variables/Drugs
Using study drug NDC codes, all pharmacy summary data were extracted from Medicaid national files, which are large databases representing aggregated pharmacy data across all 50 states. Thus, they are subject to occasional coding errors in the raw datasets during the separation of Medicare and Medicaid dual eligible recipients, which we observed in 2006 and 2007, and corrected to the best of our ability. Therefore, we estimated these values by averaging the previous and subsequent years’ data for the 2006 and 2007 data []. An initial list was obtained from eFacts, highlighting the most commonly used DMARDs for RA treatment available in the United States []. Both nonbiologic and biologic DMARDs were categorized according to their mode of action (Table 1). The total reimbursement in US dollars and number of prescriptions were calculated by compiling data for each drug on a yearly basis. We identified the total Medicaid reimbursement and prescription claim counts as reflective of expenditure and utilization, respectively. The per-prescription payments for individual DMARD agents were calculated as the total reimbursements divided by the total number of prescriptions. Due to the lack of publicly available data, per-prescription prices may be an imprecise indicator of prescription costs because we were unable to consider additional state or nationally mandated rebates from pharmaceutical companies. As a result, the recorded payments were likely to be higher than those paid by Medicaid for all the included medications. Additionally, the percentage of utilizations (total number of prescriptions) and the percentage of expenditures (total spending) in the US Medicaid market were used to compute the market shares for DMARDs. These market shares are referred to as expenditure market share and utilization market share, respectively.
This study, however, aimed to compare trends in utilization, expenditure, and price per prescription between nonbiologic and bDMARD agents. Two groups of nonbiologic DMARDs were identified: conventional synthetic DMARDs (csDMARDs) and Janus Kinase Inhibitors (JAKi), i.e., targeted synthetic DMARDs. Biologic DMARD agents were categorized into tumor necrosis factor-α inhibitors (TNFi) and other bDMARD agents. Additionally, the available biosimilar agents were included in this study (Table 1).
2.3. Analysis
The total prescriptions and spending for generic and branded versions of the included DMARD agents were summed each year to evaluate the utilization and expenditure for each agent (Table 1). The average reimbursement per prescription was calculated by dividing the total expenditure over the total annual utilization of each drug. However, the average cost estimate per prescription did not differentiate between the various strengths or dosage forms of each agent. Furthermore, market shares were calculated when feasible to allow for a comprehensive comparison between generic, branded, biologic and biosimilar drugs. All data analyses were conducted using Statistical Analysis Software version 9.4 (SAS Institute Inc., Cary, NC, USA). Microsoft Excel 2022 (Microsoft Corporation, Redmond, WA, USA) was used to further analyze the data and create figures.
3. Results
Over the past three decades, the total Medicaid spending on DMARDs included in this analysis was $43.3 billion. Medicaid spending on biologic DMARDs accounted for 94% of the total expenditure, compared to 6% toward nonbiologic DMARDs (Table 2).
Table 2.
Annual Medicaid utilization and expenditure for nonbiologic and biologic disease-modifying antirheumatic drugs (DMARDs).
Between 1991 and 2022, Medicaid experienced a 155.62-fold increase in annual expenditure for nonbiologic DMARDs, from $4,333,028 to $674,320,409. Furthermore, the utilization increased from 78,839 prescriptions in 1991 to 1,257,258 prescriptions in 2022, a 16-fold increase. While the utilization of biologics DMARDs increased from 1050 prescriptions in 1998 to 1.5 million prescriptions in 2022, a 1437-fold increase. However, Medicaid experienced a 10,390-fold increase in annual expenditure on biologic DMARDs ($585,354 to $9.9 billion), see Table 2.
3.1. Utilization and Expenditure
From 1991 to 2004, the annual number of nonbiologic prescriptions increased to reach a first peak (78,839 to 519,132 prescriptions). However, between 2005–2008, Medicaid experienced a 60% decline in utilization of nonbiologic agents. Nevertheless, since 2009, the utilization of nonbiologic DMARDs increased gradually to reach 1,257,258 prescriptions in 2022. Similarly, the annual utilization of biologics increased to reach a peak in 2005 (1050 to 211,862 prescriptions). Moreover, Medicaid experienced a 47% drop in utilization of biologic drugs from 2006–2010. Nonetheless, in the following 12 years, the utilization increased steadily to reach a 10-fold increase (1,508,145). It is important to mention that Medicaid experienced a drop in utilization of nonbiologic as well as biologic DMARDs from 2019–2021 (Table 2).
3.1.1. Conventional Synthetic DMARDs vs. Janus Kinase Inhibitors
The total Medicaid expenditure on nonbiologic DMARDs was $2.5 billion. Medicaid spending on JAKi spending accounting for 67% of the total (Table 3).
Table 3.
Annual Medicaid utilization and expenditure for nonbiologic dMARDs (csDMARDs and JAKi)
Between 1991 and 2022, Medicaid utilization of csDMARDs increased 15-fold, rising from 78,839 to 1,139,225 prescriptions. This growth was primarily driven by the high utilization of methotrexate compared to leflunomide and methotrexate generic agents, see Figure A1 in Appendix A. On the other hand, JAKi utilization increased substantially between 2012 and 2022, from four prescriptions to 118,033. This surge was largely attributed to the high utilization of the first FDA-approved JAKi, tofacitinib (Figure A2).
3.1.2. Reference Biologics and Biosimilar Agents
The utilization and expenditure of reference biologic DMARDs and their biosimilar agents are shown in Figure 1 and Figure 2. Between 1998 and 2022, Medicaid utilization of biologic agents, Rituximab and Infliximab, increased from 124 to 102,739 prescriptions. Correspondingly, spending on reference biologics rose from $212,559 to $364,573,770, representing an approximately 1715-fold increase (Table A1).
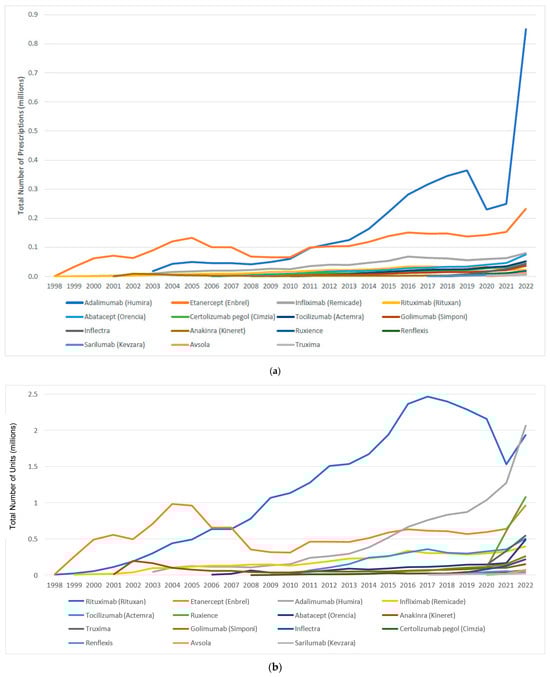
Figure 1.
(a) Medicaid utilization (number of prescriptions) for biologic and biosimilar agents, 1998–2022; (b) Medicaid utilization (number of units) for biologic and biosimilar agents, 1998–2022.
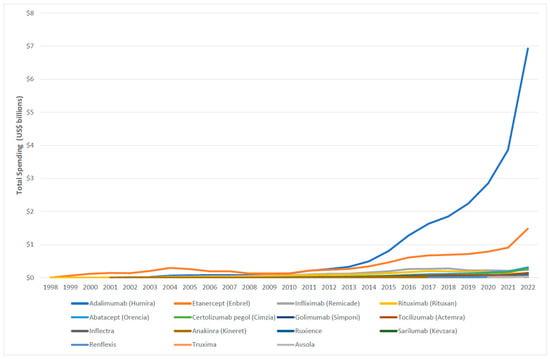
Figure 2.
Medicaid expenditure for biologic and biosimilar agents, 1998–2022.
Between 2017 and 2022, Medicaid utilization of biosimilar grew from 1061 to 89,343 prescriptions. During the same period, spending on biosimilars increased from $3,138,251 to $244,955,921, reflecting an approximately 78-fold rise (Table A1).
3.2. Unit and Prescription Price
3.2.1. Conventional Synthetic DMARDs
Over the study period, the average reimbursement per prescription for methotrexate declined from $54.96 in 1991 to $20.20 in 2022. While the average reimbursement for leflunomide peaked at $438.62 in 2015, rising from $214 in 1998, before dropping the following years to $49.36 in 2010. However, the price then increased to $140 in 2016 but subsequently dropped to $42.97 in 2022. The average drug price for Trexall gradually increased from $86.59 in 2001 and to $280.81 in 2022. Similarly, the prices of other generic agents, Otrexup and Rasuvo, increased from $587.89 and $460.94 in 2014 to $705.49 and 548.55 in 2022, respectively. The price of Xatmep, however, saw a slight decrease from $575.67 in 2017 to $553.58 in 2022. Meanwhile, the average price of RediTres increased from $297.46 in 2021 to 312.11 in 2022 (Figure 3).
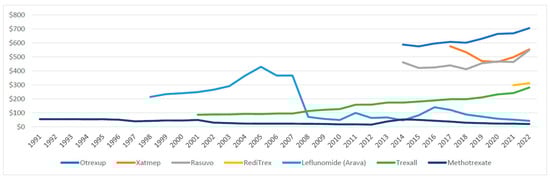
Figure 3.
Medicaid average reimbursement per prescription for csDMARDs, 1991–2022.
3.2.2. Janus Kinase Inhibitors
In 2012, the average reimbursement for tofacitinib was $2108.32, rising to $5220.97 in 2022. Similarly, the average reimbursement for baricitinib and upadacitinib increased from $2217.90 and $4950.42 to 3105.38 and 5792.60, respectively (Figure 4).
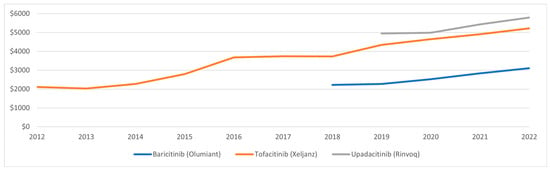
Figure 4.
Medicaid average reimbursement per prescription for JAKi, 2012–2022.
3.2.3. Biologic DMARDs and Biosimilar Agents
The average reimbursement per prescription for the included biologic and biosimilar agents is shown in Figure 5. With the exception of adalimumab, the reimbursement for biologic agents between 1998 and 2022 ranged from approximately $800 to $6000. On the other hand, the average reimbursement for adalimumab prescriptions increased 12-fold, rising from $1236.87 in 2003 to $15,498.02 in 2021. However, adalimumab price dropped by 53% in 2022, $8140.95. Despite this decline in overall prescription reimbursement, the per-unit price of adalimumab gradually increased throughout the study period, rising from $3042.52 in 2021 to $3346.46 in 2022.
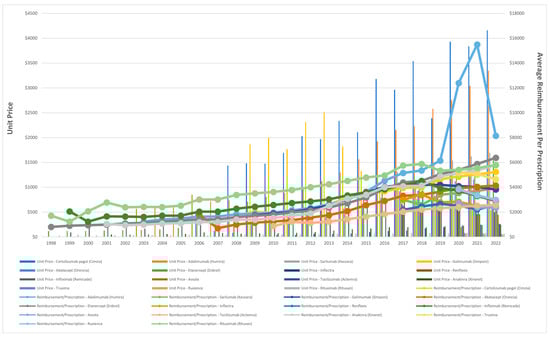
Figure 5.
Unit price and average Medicaid reimbursement per prescription for biologic and biosimilar agents, 1998–2022.
The average Medicaid reimbursement for a rituximab prescription experienced a substantial increase of 238%, rising from $1714.19 in 1998 to $5798 in 2022. While the reimbursement of its biosimilar agents, truxima and ruxience, experienced a slight decrease of 10% and 22%, respectively. Furthermore, the price of infliximab increased from $2059.29 in 1990 to $4508.16 in 2018, representing an approximate rise of 119%. However, by 2022, this price had dropped by 35.7% to $2899.77. Interestingly, in 2018, the introduction of infliximab biosimilar agents, Inflectra and Renflexis, resulted in average prescription reimbursement of $2986 and $2176.5, respectively. Avsola, another biosimilar agent, was introduced in 2020, with an average reimbursement per prescription of $2719.84. In 2022, while the reimbursement for Renflexis prescription slightly increased to $2538, the price for Inflectra and Avsola experienced slight declines, reaching $2461.11 and $2364.33, respectively (Figure 5).
3.3. Market Share
Figure 6 and Figure 7 illustrate the expenditure market share of nonbiologic and biologic DMARDs, csDMARDs and JAKi from 1991 to 2022. Prior to the introduction of bDMARDs, Nonbiologic DMARDs had a higher Medicaid expenditure market share. Since 1999, bDMARDs captured ≥70% of the reimbursement market share. However, nonbiologic DMARDs had a higher utilization market share compared to biologic agents until 2021 (Figure A3). Between 2012 and 2015, csDMARDs had a higher Medicaid expenditure market share. However, since 2016, JAKi has surpassed csDMARDs in terms of reimbursement market share. Despite this, csDMARD have consistently held a higher utilization market share compared to JAKi throughout the study period (Figure A4).
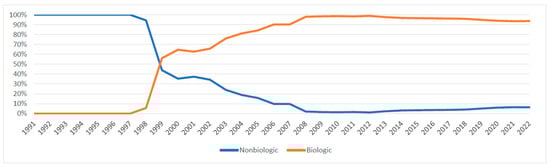
Figure 6.
Nonbiologic vs. biologic DMARDs expenditure market share.
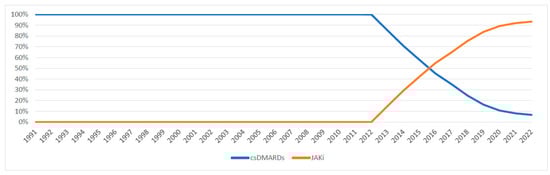
Figure 7.
csDMARDs vs. JAKi expenditure market share.
Reference biologics exhibited a greater overall higher Medicaid expenditure and utilization market share compared to biosimilar agents, as illustrated in Figure A5 and Figure A6. Nevertheless, the market share of biosimilar agents in terms of total prescription and spending increased in 2022, reaching 47% and 40%, respectively (Table A2).
4. Discussion
To the best of our knowledge, this is the first study to investigate the utilization and expenditure of nonbiologic and biologic DMARDs among Medicaid beneficiaries. The present analysis focused only on commonly prescribed DAMRD agents (Table 1) []. Hydroxychloroquine is a commonly prescribed csDMARDs; however, it was excluded because of its heavy use in COVID-19 treatment [].
During the 32-year study period, a substantial increase in Medicaid utilization and expenditure on DMARDs was observed. Our findings showed that the Medicaid utilization of biologic DMARDs was higher than that of nonbiologic agents. However, the utilization of both classes declined significantly from 2005–2013. Furthermore, our data indicated that the total Medicaid spending on nonbiologic was around $2.537 billion while it was over $40.775 billion on biologic DMARDs. Our findings also showed that Medicaid expenditure on nonbiologic DMARDs rose from $4.33 million in 1991 to $674 million in 2022. Moreover, Medicaid spending on biologic DMARDs has increased from $585 thousand in 1998 to $9.954 billion in 2022 (Table 2).
Our findings showed that Medicaid utilization for methotrexate (csDMARD) was not affected by the introduction of generic drugs into the market (Figure A1). Interestingly, expenditure on methotrexate increased significantly after 2012; nonetheless, it started to decline after 2016. This decline in methotrexate expenditure can be explained by the introduction of csDMARD generic drugs. On the other hand, leflunomide utilization decreased by 84% from 2002 to 2008. Therefore, spending on leflunomide dropped sharply, by 98%. The data indicated that the price of leflunomide per-prescription increased considerably between 2003 and 2007 to over $400, however; the price dropped by 83% the following year and kept below $100. Although leflunomide has shown significant clinical improvement among RA patients [], recent clinical RA guidelines recommend methotrexate as monotherapy or in combination with other DMARDs due to dosing flexibility and lower cost []. This could explain the decline in Medicaid leflunomide utilization. Another important reason is the risk of hepatotoxicity associated with leflunomide use. In 2010, the U.S. Food and Drug Administration (FDA) added a black box warning to leflunomide due to reports of severe liver injury [,].
It is important to highlight that Medicaid’s total utilization and reimbursement of nonbiologic and biologic DMARDs declined considerably after 2006 due to the implementation of Medicare Prescription Drug Plans (Part D). Thus, low-income seniors and individuals with long-term disabilities were moved to Medicare, accounting for 22 million patients, resulting in a 51% drop in Medicaid enrolment [].
4.1. csDMARDs vs. JAKi
Our findings suggested that Medicaid utilization for csDMARDs was substantially higher than that for JAK inhibitors. Janus Kinase (JAK) Inhibitors, small molecule-targeted agents, are the latest drug class of DMARDs for treating multilabel conditions such as rheumatoid arthritis, psoriatic arthritis, ulcerative colitis, and juvenile idiopathic arthritis []. Compared to bDMARDs, JAKi is the first oral option to achieve favorable outcomes []. Tofacitinib was the first JAKi to be approved in 2012 for the treatment of RA []. The other two JAKi agents, baricitinib and upadacitinib, were approved in 2018 and 2019 to treat patients with moderately to severely active RA who had inadequate response or intolerance to tumour TNF blockers [,]. Although Medicaid utilization for JAKi is considerably lower than that for csDMARDs, the total Medicaid spending on JAKi has significantly exceeded that on csDMARDs since 2016. We believe that this was largely driven by the higher prescription prices of JAKi agents.
4.2. Adalimumab
Our findings indicate that Medicaid utilization of biologic DMARDs is largely driven by adalimumab and etanercept (38% and 35%, respectively). However, spending on adalimumab accounted for 56% of the total Medicaid reimbursement for bDMARDs during the study period. We believe that this is driven by the increase in utilization, as well as the per-prescription prices. In 2021, the average reimbursement per prescription for adalimumab was $15,498, totaling more than $3.86 billion in Medicaid spending on biologic DMARDs. Interestingly, the data showed that the prices dropped by 47% in 2022. However, Medicaid expenditure on adalimumab alone was $6.9 billion in the same year, accounting for 70% of Medicaid expenditures on DMARDs by 2022. One possible explanation for the decrease in utilization in 2020 and 2021 while the spending increased is that patients were receiving multiple units of the medication in a single prescription during the COVID-19 pandemic. This may have skewed the average cost calculation, which may not reflect the true prices of adalimumab.
4.3. Biologics vs. Biosimilars
Biosimilar agents are highly similar to their reference biologics with comparable clinical efficacy and safety profiles. Additionally, biosimilars provide cost-effective options for improving access to biologics []. Thus, it has been shown that biosimilar products, like generic drugs, can initiate market competition and consequently lower the overall cost of treatment []. In April 2016, Inflectra was the first biosimilar to infliximab to be approved for all indications of the reference biologic, followed shortly after by Renflexis in 2017 and Avsola in 2019. Truxima was the first biosimilar to rituximab in 2018, followed by Ruxience in 2019. A study investigated the uptake of infliximab biosimilars using data from the Rheumatology Informatics Systems for effectiveness reported that infliximab biosimilars utilization reached 43.8% in 2022 for Medicaid compared to 13% in 2020 []. Furthermore, another study examined the utilization of rituximab biosimilars in Medicare and Medicaid reported a significant increase in usage—from a mere 0–7% in 2019 to 61% of all claims by 2022, Medicaid. However, the average unit price of biologic rituximab decreased by 2% in 2022 []. Our findings illustrate that the utilization market share of these biosimilar agents noticeably increased by 41% and 47% in 2021 and 2022, respectively, and their Medicaid expenditure market share grew to 40% by 2022 alone.
The successful integration of biosimilars into healthcare systems is impeded by several challenges including regulatory obstacles, varying levels of market penetration, and acceptance by physicians and patients. However, the latter may contribute significantly to the slow utilization of biosimilars []. Although the initial cost-containment policies facilitated an increase in the adoption of biosimilars, these improvements were not maintained over the long term. This was attributed to the absence of a cultural shift among healthcare practitioners regarding the use of biosimilars []. Indeed, a systematic review that evaluated the current knowledge and perception of US and European healthcare providers found that 66% of rheumatologists were likely to initiate biosimilar therapy. However, 60% were unlikely to switch from a biologic reference to a biosimilar agent []. Therefore, a bottom-up approach that actively involves healthcare providers through education is anticipated to bridge the knowledge gap and enhance trust in biosimilar agents, eventually increasing biosimilar utilization.
4.4. Limitation
This study had several shortcomings, some of which were due to the nature of the database. First, patient-specific information was not available. As a result, it was not possible to determine the exact indication, as the study medications were being used to treat indications beyond RA or if the patient filled the prescription. Due to the lack of information on the latter, it was impossible to assess some of the benefits, such as patient adherence to therapy. Second, the data do not consider any long-term changes in the product mix of medications based on the NDC codes. Third, between 2006 and 2007, there were inconsistencies in the reporting of the number of prescriptions and total spending across the database due to coding errors during the implementation of the Medicare Modernization Act and the separation of Medicaid and Medicare dual eligible recipients. This resulted in inaccurate data; hence, we used the averages from 2005 and 2008 as the prediction trend. Finally, the study findings do not necessarily represent utilization and expenditure trends across other US markets because it was specific to the Medicaid population.
5. Conclusions
Medicaid utilization of csDMARDs, JAKi, and bDMARDs has increased significantly over the past three decades, with total spending exceeding $43 billion. This substantial increase in utilization and expenditure has contributed to a considerable burden on the Medicaid budget, likely due to higher prescription rates and rising per-prescription costs. The increasing burden of prescription costs poses a risk of destabilizing the Medicaid program.
Although biosimilar DMARDs have the potential to improve patient access by lowering costs, their impact on overall Medicaid spending may remain uncertain during the study period. To address the financial strain of expensive DMARDs therapy, additional cost-containment policies, such as value-based pricing models, formulary management, and negotiated pricing mechanisms, may be necessary. Moreover, the implementation of the US Inflation Reduction Act 2022 represents a significant advancement in addressing concerns related to drug pricing. However, its long-term implications for Medicaid utilization and spending require further evaluation.
Author Contributions
The authors confirm contribution to the paper as follows: study conception and design: Z.A.A., X.Y. and J.J.G.; data extraction: J.J.G.; analysis and interpretation of results: Z.A.A.; draft manuscript preparation: Z.A.A. All authors have read and agreed to the published version of the manuscript.
Funding
The authors declared that no funding was received by any agency in this research.
Institutional Review Board Statement
Not applicable.
Informed Consent Statement
Not applicable.
Data Availability Statement
All data supporting the findings of this study are available from the Centers for Medicare & Medicaid Services (CMS): https://www.cms.gov/ (accessed on 16 July 2022).
Conflicts of Interest
J.J.G. received unrestricted educational contract research services from Abbvie and Takeda pharmaceutical companies. X.Y. is a pharmacoepidemiologist at the Abbvie Inc. and an adjunct assistant professor in UC College of Pharmacy. The authors confirm that this affiliation did not influence the study design, data collection, analysis, interpretation of results, or manuscript preparation. No financial or material support from AbbVie was provided for this research. All authors declare that there are no other competing interests related to this work.
Appendix A
Table A1.
Medicaid utilization and expenditure of reference biologics and biosimilar agents ‡.
Table A1.
Medicaid utilization and expenditure of reference biologics and biosimilar agents ‡.
| Year | Number of Prescriptions (Total Utilization) | Spending, Current-Year US$ (Total Expenditure) | ||
|---|---|---|---|---|
| Reference Biologics | Biosimilar Agents | Reference Biologics | Biosimilar Agents | |
| 1998 | 124 | - | 212,559.77 | - |
| 1999 | 1049 | - | 1,439,812.76 | - |
| 2000 | 2661 | - | 3,966,370.51 | - |
| 2001 | 4356 | - | 9,038,579.58 | - |
| 2002 | 8701 | - | 16,569,409.81 | - |
| 2003 | 14,722 | - | 27,777,921.73 | - |
| 2004 | 22,797 | - | 44,073,274.46 | - |
| 2005 | 25,674 | - | 50,653,964.68 | - |
| 2006 | 29,427 | - | 59,979,459.66 | - |
| 2007 | 29,427 | - | 69,304,954.63 | - |
| 2008 | 33,180 | - | 87,955,944.58 | - |
| 2009 | 42,181 | - | 119,382,987.29 | - |
| 2010 | 41,269 | - | 123,174,584.77 | - |
| 2011 | 54,825 | - | 170,016,949.23 | - |
| 2012 | 62,484 | - | 203,801,856.17 | - |
| 2013 | 62,209 | - | 216,315,757.93 | - |
| 2014 | 71,128 | - | 266,583,832.15 | - |
| 2015 | 81,671 | - | 327,026,108.16 | - |
| 2016 | 101,726 | - | 428,931,350.16 | - |
| 2017 | 98,034 | 1061 | 463,185,658.48 | 3,138,251.86 |
| 2018 | 94,262 | 4252 | 469,771,598.63 | 13,988,076.59 |
| 2019 | 88,598 | 10,467 | 394,737,512.19 | 28,829,903.89 |
| 2020 | 92,731 | 28,922 | 401,065,797.78 | 86,003,413.57 |
| 2021 | 85,198 | 56,253 | 331,955,213.66 | 158,222,887.22 |
| 2022 | 102,739 | 89,343 | 364,573,770.05 | 244,955,921.70 |
| Total | 1,251,173 | 190,298 | 4,651,495,228.82 | 535,138,454.83 |
‡ Reference biologic agents: Rituximab (Rituxan) and Infliximab (Remicade). Biosimilar agents: Truxima, Ruxience, Inflectra, Renflexis, and Avsola.
Table A2.
Annual Medicaid market share of reference biologics and biosimilar agents ‡.
Table A2.
Annual Medicaid market share of reference biologics and biosimilar agents ‡.
| Year | Total Prescriptions | Total Reimbursement | ||
|---|---|---|---|---|
| Reference Biologics | Biosimilar Agents | Reference Biologics | Biosimilar Agents | |
| 1998 | 100% | 0% | 100% | 0% |
| 1999 | 100% | 0% | 100% | 0% |
| 2000 | 100% | 0% | 100% | 0% |
| 2001 | 100% | 0% | 100% | 0% |
| 2002 | 100% | 0% | 100% | 0% |
| 2003 | 100% | 0% | 100% | 0% |
| 2004 | 100% | 0% | 100% | 0% |
| 2005 | 100% | 0% | 100% | 0% |
| 2006 | 100% | 0% | 100% | 0% |
| 2007 | 100% | 0% | 100% | 0% |
| 2008 | 100% | 0% | 100% | 0% |
| 2009 | 100% | 0% | 100% | 0% |
| 2010 | 100% | 0% | 100% | 0% |
| 2011 | 100% | 0% | 100% | 0% |
| 2012 | 100% | 0% | 100% | 0% |
| 2013 | 100% | 0% | 100% | 0% |
| 2014 | 100% | 0% | 100% | 0% |
| 2015 | 100% | 0% | 100% | 0% |
| 2016 | 100% | 0% | 100% | 0% |
| 2017 | 99% | 1% | 99% | 1% |
| 2018 | 96% | 4% | 97% | 3% |
| 2019 | 89% | 11% | 93% | 7% |
| 2020 | 76% | 24% | 82% | 18% |
| 2021 | 60% | 40% | 68% | 32% |
| 2022 | 53% | 47% | 60% | 40% |
| Average | 95% | 5% | 96% | 4% |
‡ Reference biologic agents: Rituximab (Rituxan) and Infliximab (Remicade). Biosimilar agents: Truxima, Ruxience, Inflectra, Renflexis, and Avsola.

Figure A1.
Medicaid utilization for csDMARDs.

Figure A2.
Medicaid utilization for JAKi.

Figure A3.
Nonbiologic vs. biologic DMARDs utilization market share.

Figure A4.
csDMARDs vs. JAKi utilization market share.

Figure A5.
Medicaid utilization for reference biologics vs. biosimilar agents, 1998–2022.

Figure A6.
Medicaid expenditure for reference biologics vs. biosimilar agents, 1998–2022.
References
- Scherer, H.U.; Häupl, T.; Burmester, G.R. The etiology of rheumatoid arthritis. J. Autoimmun. 2020, 110, 102400. [Google Scholar] [CrossRef] [PubMed]
- Marita, C.; Emma, S.; Damian, H.; Loreto, C.; Frederick, W.; Theo, V.; Benjamin, W.; Sherine, G.; Marissa, L.; Nicole, J.; et al. The global burden of rheumatoid arthritis: Estimates from the Global Burden of Disease 2010 study. Ann. Rheum. Dis. 2014, 73, 1316. [Google Scholar]
- Helmick, C.G.; Felson, D.T.; Lawrence, R.C.; Gabriel, S.; Hirsch, R.; Kwoh, C.K.; Liang, M.H.; Kremers, H.M.; Mayes, M.D.; Merkel, P.A.; et al. Estimates of the prevalence of arthritis and other rheumatic conditions in the United States. Part I. Arthritis Rheum 2008, 58, 15–25. [Google Scholar] [CrossRef] [PubMed]
- Mota, L.M.; Laurindo, I.M.; Santos Neto, L.L. General principles for treatment of early rheumatoid arthritis. Rev. Assoc. Med. Bras. (1992) 2010, 56, 360–362. [Google Scholar] [CrossRef]
- Smolen, J.S.; Landewé, R.B.M.; Bijlsma, J.W.J.; Burmester, G.R.; Dougados, M.; Kerschbaumer, A.; McInnes, I.B.; Sepriano, A.; van Vollenhoven, R.F.; de Wit, M.; et al. EULAR recommendations for the management of rheumatoid arthritis with synthetic and biological disease-modifying antirheumatic drugs: 2019 update. Ann. Rheum. Dis. 2020, 79, 685–699. [Google Scholar] [CrossRef]
- Ruderman, E.M. Overview of safety of non-biologic and biologic DMARDs. Rheumatology 2012, 51 (Suppl. S6), vi37–vi43. [Google Scholar] [CrossRef]
- Aletaha, D.; Smolen, J.S. Diagnosis and Management of Rheumatoid Arthritis: A Review. JAMA 2018, 320, 1360–1372. [Google Scholar] [CrossRef]
- Fraenkel, L.; Bathon, J.M.; England, B.R.; St. Clair, E.W.; Arayssi, T.; Carandang, K.; Deane, K.D.; Genovese, M.; Huston, K.K.; Kerr, G.; et al. 2021 American College of Rheumatology Guideline for the Treatment of Rheumatoid Arthritis. Arthritis Care Res. (2010) 2021, 73, 924–939. [Google Scholar] [CrossRef]
- IQVIA. The Use of Medicines in the U.S. 2023; IQVIA Institute for Human Data Science: Parsippany, NJ, USA, 2023. [Google Scholar]
- Hsieh, P.-H.; Wu, O.; Geue, C.; McIntosh, E.; McInnes, I.B.; Siebert, S. Economic burden of rheumatoid arthritis: A systematic review of literature in biologic era. Ann. Rheum. Dis. 2020, 79, 771. [Google Scholar] [CrossRef]
- Hresko, A.; Lin, T.C.; Solomon, D.H. Medical Care Costs Associated With Rheumatoid Arthritis in the US: A Systematic Literature Review and Meta-Analysis. Arthritis Care Res. 2018, 70, 1431–1438. [Google Scholar] [CrossRef]
- Statista. Prescription Drug Expenditure in the United States from 1960 to 2020. Available online: https://www.statista.com/statistics/184914/prescription-drug-expenditures-in-the-us-since-1960 (accessed on 16 March 2022).
- Centers for Medicare & Medicaid Services. State Drug Utilization Data. Available online: https://www.cms.gov (accessed on 16 July 2022).
- Yue, X.; Guo, J.J.; Wigle, P.R. Trends in utilization, spending, and prices of smoking-cessation medications in medicaid programs: 25 years empirical data analysis, 1991–2015. Am. Health Drug Benefits 2018, 11, 275–284. [Google Scholar] [PubMed]
- Hennekens, C.H.; Rane, M.; Solano, J.; Alter, S.; Johnson, H.; Krishnaswamy, S.; Shih, R.; Maki, D.; DeMets, D.L. Updates on Hydroxychloroquine in Prevention and Treatment of COVID-19. Am. J. Med. 2022, 135, 7–9. [Google Scholar] [CrossRef] [PubMed]
- Emery, P.; Breedveld, F.C.; Lemmel, E.M.; Kaltwasser, J.P.; Dawes, P.T.; Gömör, B.; Van Den Bosch, F.; Nordström, D.; Bjorneboe, O.; Dahl, R.; et al. A comparison of the efficacy and safety of leflunomide and methotrexate for the treatment of rheumatoid arthritis. Rheumatology 2000, 39, 655–665. [Google Scholar] [CrossRef] [PubMed][Green Version]
- FDA. FDA Drug Safety Communication: New Boxed Warning for Severe Liver Injury with Arthritis Drug Arava (Leflunomide). Available online: https://www.fda.gov/drugs/postmarket-drug-safety-information-patients-and-providers/fda-drug-safety-communication-new-boxed-warning-severe-liver-injury-arthritis-drug-arava-leflunomide#Additional_Information_for_Healthcare_Professionals (accessed on 19 October 2023).
- New boxed warning for leflunomide. React. Wkly. 2010, 1311, 6.
- Cubanski, J.; Damico, A.; Neuman, T. 10 Things to Know About Medicare Part D Coverage and Costs in 2019. Available online: https://www.kff.org/medicare/issue-brief/10-things-to-know-about-medicare-part-d-coverage-and-costs-in-2019/ (accessed on 19 June 2023).
- Radu, A.F.; Bungau, S.G. Management of Rheumatoid Arthritis: An Overview. Cells 2021, 10, 2857. [Google Scholar] [CrossRef]
- Coricello, A.; Mesiti, F.; Lupia, A.; Maruca, A.; Alcaro, S. Inside Perspective of the Synthetic and Computational Toolbox of JAK Inhibitors: Recent Updates. Molecules 2020, 25, 3321. [Google Scholar] [CrossRef]
- Markham, A. Baricitinib: First Global Approval. Drugs 2017, 77, 697–704. [Google Scholar] [CrossRef]
- Duggan, S.; Keam, S.J. Upadacitinib: First Approval. Drugs 2019, 79, 1819–1828. [Google Scholar] [CrossRef]
- Baumgart, D.C.; Misery, L.; Naeyaert, S.; Taylor, P.C. Biological Therapies in Immune-Mediated Inflammatory Diseases: Can Biosimilars Reduce Access Inequities? Front. Pharmacol. 2019, 10, 279. [Google Scholar] [CrossRef]
- Mulcahy, A.W.; Hlavka, J.P.; Case, S.R. Biosimilar Cost Savings in the United States: Initial Experience and Future Potential. Rand Health Q. 2018, 7, 3. [Google Scholar]
- Roberts, E.T.; Li, J.; Bansback, N.; Tseng, C.W.; Shiboski, S.; Schmajuk, G.; Yazdany, J. Patterns of Infliximab Biosimilar Uptake for Medicare, Medicaid, and Private Insurance from 2016 to 2022. Arthritis Rheumatol. 2024, 76, 1739–1742. [Google Scholar] [CrossRef] [PubMed]
- Qian, J. Uptake of Rituximab Biosimilars in Medicare and Medicaid in 2019–2022. Am. J. Manag. Care 2024, 30, e359–e363. [Google Scholar]
- Cross, R.K.; Stewart, A.L.; Edgerton, C.C.; Shah, B.; Welz, J.A.; Kay, J. Implementation Strategies of Biosimilars in Healthcare Systems: The Path Forward. Am. Health Drug Benefits 2022, 15, 45–53. [Google Scholar]
- Menditto, E.; Orlando, V.; Coretti, S.; Putignano, D.; Fiorentino, D.; Ruggeri, M. Doctors commitment and long-term effectiveness for cost containment policies: Lesson learned from biosimilar drugs. Clinicoecon. Outcomes Res. 2015, 7, 575–581. [Google Scholar] [PubMed]
- Leonard, E.; Wascovich, M.; Oskouei, S.; Gurz, P.; Carpenter, D. Factors Affecting Health Care Provider Knowledge and Acceptance of Biosimilar Medicines: A Systematic Review. J. Manag. Care Spec. Pharm. 2019, 25, 102–112. [Google Scholar] [CrossRef]
Disclaimer/Publisher’s Note: The statements, opinions and data contained in all publications are solely those of the individual author(s) and contributor(s) and not of MDPI and/or the editor(s). MDPI and/or the editor(s) disclaim responsibility for any injury to people or property resulting from any ideas, methods, instructions or products referred to in the content. |
© 2025 by the authors. Licensee MDPI, Basel, Switzerland. This article is an open access article distributed under the terms and conditions of the Creative Commons Attribution (CC BY) license (https://creativecommons.org/licenses/by/4.0/).