Abstract
The eleventh annual international G–CAN research symposium was held in Chicago, IL, on the 22nd and 23rd of October 2025. This hybrid meeting, a live face-to-face and virtual live symposium, was attended by 198 participants. Twenty-five research abstract submissions were received from early-career investigators for plenary oral and brief oral presentations. Here, we present the 24 accepted, lightly edited abstracts from the early-career presenters consenting to have their materials published. We thank and congratulate the presenters for their work and contributions to the meeting.
1. Progression of CPPD Burden in a Cohort of Patients with CPPD Disease: Over 1 Year Follow-Up
- Antonella Adinolfi 1, Silvia Sirotti 2,3, Greta Pellegrino 2,3, Alessandro Lucia 4, Daniele Cirillo 4, Rodolfo Fabbri 4, Laura Pezzoni 4, Piercarlo Sarzi-Puttini 2,3, Oscar Massimiliano Epis 1 and Georgios Filippou 2,3
- 1
- Rheumatology Division, Multispecialist Medical Department, ASST Grande Ospedale Metropolitano Niguarda, Milan, Italy
- 2
- IRCCS Galeazzi–Sant’Ambrogio Hospital, Rheumatology Department, Milan, Italy
- 3
- University of Milan, Department of Biomedical and Clinical Sciences, Milan, Italy
- 4
- University of Milan, Department of Clinical Sciences and Community Health, Milan, Italy.
- *
- Correspondence: antonella.adinolfi986@gmail.com
- Abstract: Background: Calcium pyrophosphate deposition (CPPD) is a complex disorder. A pathological key could be the relationship between the extent of crystal deposition and the clinical phenotypes. In 2023, the OMERACT Ultrasound (US) Working Group validated a scoring system for assessing the extent of CPPD. This system evaluates bilaterally the triangular fibrocartilage of the wrist, the knee hyaline cartilage and both menisci. Each site is graded on a 4-point scale (0–3), resulting in a score ranging from 0 to 24. The aim of this study was to investigate the relationship between crystal burden changes, evaluated with the US score, and clinical progression across the CPPD subsets. Methods: From January 2024, consecutive CPPD disease patients diagnosed according to the 2023 ACR/EULAR classification criteria were enrolled. All participants underwent a comprehensive clinical examination to classify them into one of the following phenotypes: acute arthritis, osteoarthritis (OA) with CPPD, or chronic arthritis. Disease activity was evaluated using visual analog scales (VAS) given by both the patient and physician, while medications were systematically recorded. US assessments were performed by two rheumatologists with expertise in CPPD and US, following a pre-specified scanning protocol. For each following visit, the same assessments were repeated. The statistical analysis was performed using R software v4.4.2. Statistical significance was fixed at a p-value < 0.05. Results: A total of 53 patients were enrolled in the study: 69.6% female, with a mean age of 77.9 years (±8.26 SD), 24 affected by acute CPP crystal arthritis, 16 with chronic arthritis and 10 with OA + CPPD. 3 patients were classified as asymptomatic CPPD. 31 patients ended the first year of follow-up. Over 80% started a treatment, mostly represented by colchicine, followed by methotrexate (MTX) and hydroxychloroquine (HCQ). At baseline, the VAS of the patient was 52.5 (SD ± 29), while the physician’s was 43 (SD ± 28.17). During the follow-up, these improved, respectively, to 37.4 (SD ± 26.3) and 26.3 (SD ± 24.57), both reaching statistical significance.
At baseline, the US scores were:
- -
- Acute CPP crystal arthritis: 12.41 (SD ± 3.98, median 12.5).
- -
- Chronic CPP crystal arthritis: 14.5 (SD ± 4.95, median 15.5).
- -
- OA with CPPD: 13.5 (SD ± 4.06, median 14).
After one year:
- -
- Acute CPP crystal arthritis: 12.25 (SD ± 5.46, median 12).
- -
- Chronic CPP crystal arthritis: 14 (SD ± 5.3, median 15).
- -
- OA with CPPD: 14.5 (SD ± 3.29, median 14).
No statistically significant differences were observed between groups. No correlations were found between the extent of CPPD and the other variables assessed.
Conclusion: This study represents the first longitudinal investigation to follow CPPD patients. Our findings suggest that, over a one-year period, there is no significant change in crystal load, even in cases where clinical symptoms improved following medical treatment. This indicates that the burden of crystal deposition may remain stable regardless of symptomatic relief. Further research is needed to better understand the long-term dynamics of crystal deposition and its clinical implications.
2. Detection of Future Gout Flare Using Peripheral Blood Gene Expression with Machine Learning
- Hussain Aljafer 1,*, Guanqi Lu 1, Ted R. Mikuls 2, Angelo Gaffo 3, Tony R Merriman 3, Austin M. Wheeler 2, James O’Dell 2, Jefferey Newcomb 2, Michael Pillinger 4, Robert Terkeltaub 5, Ryan Ferguson 6,7, Mary Brophy 6,8, Tuhina Neogi 7, Jeffrey C Edberg 3, Richard J Reynolds 3,†, Ana I Vazquez 1,†
- 1
- Michigan State University, East Lansing, MI, USA
- 2
- University of Nebraska Medical Center, Omaha, NE and VA Nebraska-Western Iowa Healthcare System, Omaha, NE, USA
- 3
- University of Alabama at Birmingham, Birmingham, AL, USA
- 4
- VA New York Harbor Health Care System, New York, NY, USA
- 5
- University of California San Diego, San Diego, CA. USA
- 6
- VA Boston Cooperative Studies Program Coordinating Center, Boston, MA, USA
- 7
- Boston University School of Medicine, Boston, MA, USA
- 8
- School of Medicine, VA Boston Health Care System, Boston University, Boston, MA, USA
- *
- Correspondence: aljaferh@msu.edu
- †
- Authors with equal contribution.
- Abstract: Background: Urate-lowering therapy is an effective treatment for gout if properly dosed and if serum urate levels below 6 mg/dL are achieved and maintained [1]. Nevertheless, people properly treated for gout may still flare, for reasons largely unknown. Most people with gout are unable to identify a trigger for their gout flares; hence, their unpredictable nature represents a significant therapeutic challenge [2]. If gout flares in the future were predictable, prophylactic therapy could be extended in individuals at high risk for future gout flares. Objective: To use machine learning methods and circulating transcriptomic features to predict gout flares. Methods: Our work aims to investigate the feasibility of predicting gout flares based on gene expression counts derived from peripheral blood samples. RNA and clinical data were obtained from a subgroup of the STOP Gout (NCT02579096) clinical trial [3]. The current analysis utilized RNA obtained from 174 participants sampled at week 48. For six months thereafter, flares were observed during the flare monitoring period. The primary outcome was at least one flare. We implemented and evaluated six machine learning models to predict the primary outcome. We evaluated the predictive ability of the models with AUC using 10-fold cross-validation. RNA transcripts selected for prediction (between 700 and 1000 per training set) were differentially expressed between flare and no flare groups (p-value < 0.05; independent T-test). Results: The prediction accuracy of the PyTorch v2.9.0 neural network model (a machine learning algorithm implemented in Python and developed by Meta) was the highest and XGBoost was the lowest compared to other models. Of the 174 subjects, 94 participants flared during the outcome observation period. The neural network predicted 100 flares, of which 65 predictions were correct, resulting in a positive predictive value (PPV) of 65%. XGBoost predicted 101 flares, of which 54 were correct predictions, resulting in a PPV of 53% (Figure 1; Table 1). The neural network achieved a 65.3% AUC across the average of 10 fold cross validations, outperforming other models and classification approaches tested. The PyTorch neural network model resulted in higher AUCs vs. logistic regression (59.8%), naïve Bayes (57.1%), random forest (51.1%), XGBoost (50.2%), and K-nearest neighbor (53.3%). Conclusions: This is the first application of an omics-enabled machine learning predictive tool for future gout disease activity. The results demonstrate that gene expression data contains signals predictive of the onset of gout flares. Recently obtained clinical and demographic data from Stop Gout will allow us to calculate the increase in AUC when adding omics to a base flare prediction model. The findings support the potential utility of transcriptomic biomarkers in developing predictive tools for clinical decision-making.
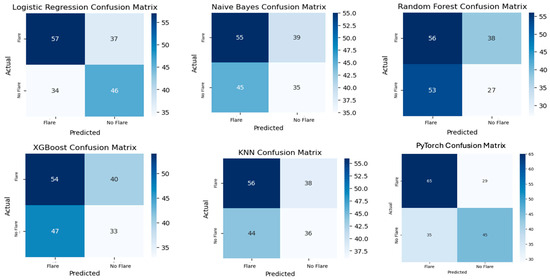 Figure 1. The confusion matrices comparing classification performance of logistic regression, naive Bayes, random forest, XGBoost, K-nearest neighbors (KNN), and a PyTorch-based neural network model in cross-validation. Each model’s performance is summarized using the four standard components of a confusion matrix: true negatives, false negatives, false positives, and true positives. These values reflect each model’s ability to correctly identify both positive and negative instances, offering insight into their respective strengths in terms of sensitivity, specificity, and overall classification accuracy. Notable variation is observed among models, particularly in the distribution of false positives and false negatives.
 Table 1. Performance metrics of the tested approaches.
References
- FitzGerald, J.D.; Dalbeth, N.; Mikuls, T.; Brignardello-Petersen, R.; Guyatt, G.; Abeles, A.M.; Gelber, A.C.; Harrold, L.R.; Khanna, D.; King, C.; et al. American college of rheumatology guideline for the management of gout. Arthritis Care Res. 2020, 72, 744–760.
- Abhishek, A.; Valdes, A.M.; Jenkins, W.; Zhang, W.; Doherty, M. Triggers of acute attacks of gout, does age of gout onset matter? A primary care based cross-sectional study. PLoS ONE 2017, 12, e0186096.
- O’Dell, J.R.; Brophy, M.T.; Pillinger, M.H.; Neogi, T.; Palevsky, P.M.; Wu, H.; Davis-Karim, A.; Newcomb, J.A.; Ferguson, R.; Pittman, D.; et al. Comparative Effectiveness of Allopurinol and Febuxostat in Gout Management. NEJM Evid. 2022, 1, evidoa2100028. https://doi.org/10.1056/evidoa2100028.
3. Unraveling a New Inflammatory Pathway: CSF1 and Its Regulatory ncRNAs in Gout
- Nils Asmann 1, Nicholas A. Sumpter 1, Brenda Kischkel 1, Ezio T. Fok 2, Riku Takei 3, Megan P. Leask 4, Jeffrey Edberg 3, Richard J. Reynolds 3, Musa M. Mhlanga 5,6, Tony R. Merriman 3,7 and Leo A. B. Joosten 1,8
- 1
- Radboud University Medical Center, Department of Internal Medicine, 6500HB, Geert Grooteplein Zuid 10, Nijmegen, The Netherlands
- 2
- Lemba Therapeutics, Nijmegen, the Netherlands
- 3
- Division of Clinical Immunology and Rheumatology, University of Alabama at Birmingham, Birmingham, Alabama, USA
- 4
- Department of Physiology, University of Otago, Dunedin, New Zealand
- 5
- Department of Human Genetics, Radboud University Medical Center, Nijmegen, the Netherlands
- 6
- Department of Cell Biology, Faculty of Science, Radboud Institute for Molecular Life Sciences, Radboud University, Nijmegen, the Netherlands
- 7
- Department of Microbiology and Immunology, University of Otago, Dunedin, New Zealand
- 8
- Iuliu Hatieganu University of Medicine and Pharmacy, Department of Medical Genetics, Cluj-Napoca, Romania
- Abstract: Background: Gout is characterized by inflammatory flares caused by intra-articular monosodium urate (MSU) crystal deposition and innate immune activation. A recent genome-wide association study (GWAS), including >120,000 gout patients, identified >350 genetic loci. Some of these variants are associated with gout but not hyperuricemia, pointing to genes involved in the immune response. We focus here on non-coding RNAs (ncRNAs) controlling the transcription of putative gout flare-related genes. A previously unidentified expression QTL identified the CSF1−CSF1R axis. The role of colony-stimulating factor 1 (CSF1) in immunity remains controversial, with both pro- and anti-inflammatory functions reported [1–3]. These dual properties may contribute to gout flare progression, making its regulatory ncRNAs (immune-priming lncRNA (IPL)) and sense and antisense enhancer RNAs (eRNA) key modulators (Figure 2). Our goal is to target these ncRNAs to modulate inflammation. Methods: We first validated a robust detection assay of IPL, eRNA, and CSF1 in PMA-stimulated THP-1 cells using digital droplet PCR (ddPCR). We then transitioned to peripheral blood mononuclear cells (PBMCs) from 10 healthy, European white males (>50 years old). These cells were stimulated with MSU crystals with and without LPS. As the negatively charged crystal surfaces interfered with commercial RNA isolation kits—causing contamination and selection bias—we established a protocol using classical Chloroform-RNA extraction followed by a bead-based clean-up. Analyses include ELISAs, total RNA sequencing, Olink proteomics, and ddPCR on subcellular fractions, with nuclear RNA subject to further division. Results: Using THP-1 cells, both the IPL and eRNA showed an initial transcription peak at 4 h, supporting a regulatory function, while their targets, CSF1 and CSF1R, became continuously upregulated over 96 h. In PBMCs, we found that 4 h MSU crystal stimulation alone upregulated CSF-1 along with its associated sense and antisense eRNA. Interestingly, this upregulation was abrogated by co-stimulation with LPS. The increase in CSF-1 was still present at 8 h, but the signal for its potential eRNAs vanished, suggesting a transient regulatory action. The IPL was consistently below the detection limit (<0.5 copies/µL) in all primary cell settings. Olink proteomics data confirmed the MSU crystal-driven regulation of CSF1 (Figure 3) and revealed novel protein hits for both MSU crystal and MSU crystal + LPS stimulation. Conclusion: This study explores CSF1 and its low-abundant ncRNAs in gout, highlighting key molecular considerations from RNA isolation to cell type. Our ongoing work with PBMCs, using RNA-seq and Olink proteomics, aims to elucidate drivers of gout. Initial Olink analysis implicates novel proteins, including CSF1, in the MSU crystal response, supporting further investigation into the CSF1 axis and its role in the inflammatory MSU crystal response and finally in gouty arthritis.
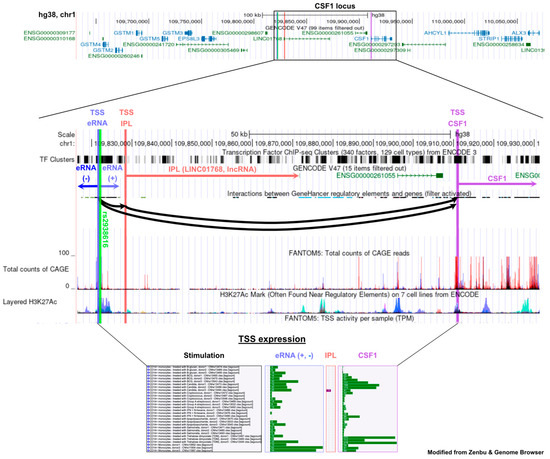 Figure 2. Genomic overview of the human CSF1 locus and associated non-coding RNAs. This figure displays the CSF1 gene, an immune-priming lncRNA (IPL), a potential enhancer RNA (eRNA), and a GWAS-identified SNP (rs2938616) on chromosome 1. A proposed regulatory model is supported by CAGE and H3K27Ac data, which indicate an active enhancer.
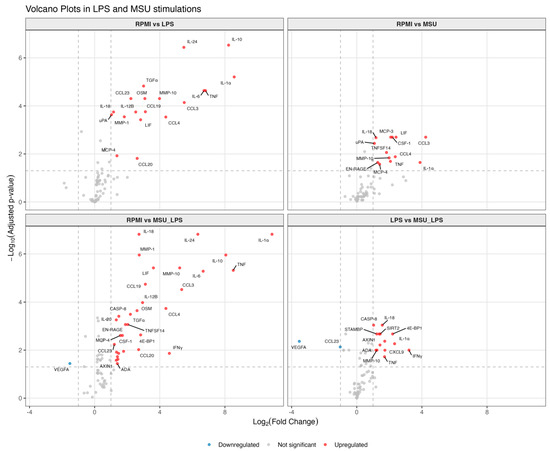 Figure 3. Volcano plots of differential protein expression in PBMCs after 24-h stimulation. Each plot, derived from Olink proteomics data, compares protein levels between different experimental conditions. Axes represent the log2 fold change (x-axis) and statistical significance as −log10-adjusted p-value (y-axis).
References
- Stanley, E.R.; Chitu, V. CSF-1 Receptor Signaling in Myeloid Cells. Cold Spring Harb. Perspect. Biol. 2014, 6, a021857.
- Chitu, V.; Stanley, E.R. Colony-stimulating factor-1 in immunity and inflammation. Curr. Opin. Immunol. 2006, 18, 39–48.
- Hume, D.A.; MacDonald, K.P.A. Therapeutic applications of macrophage colony-stimulating factor-1 (CSF-1) and antagonists of CSF-1 receptor (CSF-1R) signaling. Blood 2012, 119, 1810–1820.
4. Serum Metabolomics Reveals Dyslipidaemia in Gout and Hyperuricemia: Elucidating Inflammatory Links Through Integrative Multi-Omics
- Georgiana Cabău 1,*, Marko Barovic 2, Triantafyllos Chavakis 2, Tania O. Crișan 1,† and Leo Joosten 1,3,†
- 1
- Department of Medical Genetics, “Iuliu Haţieganu” University of Medicine and Pharmacy, Cluj-Napoca, Romania
- 2
- Institute for Clinical Chemistry and Laboratory Medicine, University Hospital, Technische Universität Dresden, Dresden, Germany
- 3
- Department of Internal Medicine, Radboudumc, Nijmegen, the Netherlands
- *
- Correspondence: georgiana.cabau@gmail.com
- †
- T.O.C and L.J. share last authorship.
- Abstract: Background & Objectives: Gout and asymptomatic hyperuricemia (AH) are characterized by both metabolic dysregulation and systemic inflammation, yet the interplay between lipid alterations and inflammatory responses remains insufficiently understood. Nuclear magnetic resonance (NMR)-based metabolomics enables the characterization of metabolite and lipid species, providing insights into metabolic disturbances associated with these conditions. While dyslipidaemia, including elevated very-low-density lipoprotein (VLDL), has been previously reported in gout and AH, its relationship with inflammatory pathways remains unclear. This study aims to: (i) identify metabolomic and lipidomic alterations distinguishing gout and AH from normouricemic controls; (ii) investigate correlations between these metabolic shifts and in vivo inflammatory responses; and (iii) experimentally validate the inflammatory potential of VLDL through in vitro human peripheral blood mononuclear cell (PBMC) stimulations, testing the hypothesis that VLDL, potentially modulated by urate exposure, might drive inflammation. Methods: Serum samples from patients with gout, AH, and normouricemic controls were analyzed using an NMR-targeted metabolomics approach to profile lipid and metabolic alterations. Principal component analysis (PCA) and partial least squares discriminant analysis (PLS-DA) were employed to identify key metabolites differentiating groups, while correlation analyses with inflammatory serum proteins (in vivo) provided insights into lipid-associated immune activation. To further explore these findings, ongoing in vitro PBMC stimulations with Toll-like receptor (TLR) ligands and VLDL are being conducted, assessing cytokine production (IL-1β, IL-1Ra, IL-6) in relation to observed lipidomic changes, thereby providing mechanistic insights into its contribution to systemic inflammation in gout and AH. Results: Preliminary analyses identified distinct dyslipidemic profiles in gout and AH, prominently featuring elevated VLDL and associated lipid species. Significant correlations were observed between these lipid profiles and serum inflammatory proteomic markers, suggesting a potential metabolic-inflammatory association. Ongoing PBMC stimulations aim to clarify whether VLDL directly contributes to inflammatory cytokine responses, potentially elucidating mechanisms linking lipid alterations to inflammation. Conclusions & Significance: This integrative multi-omics approach reveals significant dyslipidaemia associated with gout and AH, potentially linking metabolic disturbances with systemic inflammation. By combining in vivo metabolic and inflammatory profiling with targeted in vitro validation, this study seeks to clarify the role of VLDL as a pro-inflammatory mediator. Findings may offer new therapeutic targets to modulate metabolic and inflammatory pathways in hyperuricemia-associated conditions, as a strategy to improve patient outcomes.
5. Effect of Smartphone Application-Led Patient Management Model on Adult Gout Patients in China
- Zhiwei Cao * and Haibing Chen
- School of Medicine, Tongji University, 301 Yan Chang Zhong Road. Jing’an District, Shanghai 200072, China; hbchen@tongji.edu.cn
- Abstract: Background and Objectives: Current gout management in China faces challenges including low serum urate (SU) target achievement rates and suboptimal long-term disease control. While nurse-led management models can improve SU target attainment and reduce gout flares, they require high manpower costs. Smartphone applications (apps) for patient self-management have shown potential in lowering SU levels but lack comprehensive evaluation of gout and other metabolic indicators. This study evaluates a smartphone app-led patient management model for gout patients, assessing its impact on SU target achievement, gout flare reduction, and quality of life improvement. Study Design and Methods: This 6-month, single-center, open-label, superiority, parallel-group randomized controlled trial screened and recruited hyperuricemia and gout patients from Shanghai Tenth People’s Hospital between November 2023 and July 2024. Eligible participants were randomized 1:1 to either the app-management group (using the “1CARE Health” digital platform with continuous SU monitoring, tiered education, online communication, follow-up reminders, and cloud data sharing) or the conventional management group (quarterly outpatient follow-ups). The primary outcome was SU target achievement rate (<360 μmol/L). Secondary outcomes included SU levels, gout flare frequency, lipid/glucose metabolic parameters, and quality-of-life scores (SF-36 and Gout Impact Scale). Results: Among 280 enrolled male patients, 247 completed 6-month follow-up. The app-management group showed significantly higher SU target achievement (52.14% vs. 32.86%; RR 1.59, 95% CI (1.19–2.11); p = 0.002) and lower mean SU levels (349.23 ± 57.65 vs. 394.04 ± 62.96 μmol/L, p < 0.001) versus controls. Consistent improvements were observed in SU < 300 μmol/L rates, gout flare frequency, total cholesterol, LDL-C, fasting glucose, and HbA1c. The app group demonstrated better SF-36 physical functioning (76.06 ± 13.83 vs. 72.32 ± 15.52, p = 0.001) and Gout Impact Scores (30.18 ± 12.70 vs. 35.31 ± 16.85, p = 0.004). Improved adherence was evidenced by higher water intake and regular SU monitoring rates in the app group. Other secondary outcomes showed no significant differences. Conclusions: The smartphone app-led management model effectively improves health behaviors and adherence, leading to enhanced SU target achievement, reduced SU levels, decreased gout flares, better metabolic control, and improved quality of life.
6. Validation of an Allopurinol Dose Prediction Tool to Achieve Goal Serum Urate Among Patients with Gout in a Protocolized Dose Escalation Trial
- Brian W Coburn 1,2, Daniel Wright 3, Jeff A Newcomb 4,5, Mary T Brophy 6,7, Anne Davis-Karim 8, Ryan Ferguson 6, Michael H Pillinger 9,10, Tuhina Neogi 11, Paul Palevsky 12,13, Bryant England 4,5, James O’Dell 4,5, Lisa Stamp 14, Ted R Mikuls 4,5 and Joshua Baker 1,2
- 1
- University of Pennsylvania, Philadelphia, PA, USA
- 2
- Philadelphia VA Medical Center, Philadelphia, PA, USA
- 3
- University of Otago, Dunedin, New Zealand
- 4
- University of Nebraska Medical Center, Omaha, NE, USA
- 5
- VA Nebraska-Western Iowa Health Care System, Omaha, NE, USA
- 6
- Boston Cooperative Studies Program Coordinating Center, Boston, USA
- 7
- VA Boston Health Care System, Boston, MA, USA
- 8
- Wentworth Institute of Technology, Boston, MA, USA
- 9
- VA New York Harbor Health Care System, New York City, NY, USA
- 10
- NYU Grossman School of Medicine, New York City, NY, USA
- 11
- Boston University, Boston, MA, USA
- 12
- VA Pittsburgh Health Care System, Pittsburgh, PA, USA
- 13
- University of Pittsburgh, Pittsburgh, PA, USA
- 14
- University of Otago Christchurch, Christchurch, New Zealand
- *
- Correspondence: brian.coburn@pennmedicine.upenn.edu
- Abstract: Background/Purpose: Despite evidence-based recommendations, allopurinol dose escalation to goal serum urate (SU) is frequently suboptimal. The EasyAllo tool was developed to facilitate pre-planned allopurinol dose escalation by predicting the allopurinol dose needed to achieve SU < 6 mg/dL > 80% of the time and promote easier dose titration [1]. The purpose of this study was to externally validate EasyAllo among trial participants who achieved goal SU using protocolized dose escalation. Methods: We included participants in the STOP Gout trial who were randomized to the allopurinol arm, and limited our analyses to those without tophi at baseline who achieved goal SU < 6 mg/dL and completed week 48 of the study to ensure adequate dose escalation and SU capture. All participants fulfilled the 2015 ACR-EULAR gout classification criteria. The trial used protocolized allopurinol dose escalation if SU was ≥6 mg/dL through week 30. Two versions of EasyAllo exist: EasyAllo2, based on weight and creatinine clearance, and EasyAllo1, which also incorporates baseline SU. We used EasyAllo2 in the primary analysis to allow for inclusion of participants taking allopurinol at enrollment whose baseline SU reflected active treatment, and secondarily explored EasyAllo1 among those not already taking allopurinol. In primary analysis, we determined the frequency with which the study dose required to achieve the SU goal < 6 mg/dL between weeks 36 and 48 was at the EasyAllo2 predicted dose or lower. As a secondary aim, we assessed univariate associations between baseline characteristics and being at the EasyAllo predicted dose or lower. We also evaluated whether participants whose study dose was the EasyAllo2 predicted dose at the time of first achieving SU < 6 mg/dL demonstrated superior long-term maintenance of SU < 6 mg/dL compared to participants whose study dose was less than the predicted dose. Results: A total of 291 participants met the inclusion criteria for the primary analysis (Table 2). Approximately 77% (n = 224) of participants who achieved the SU goal < 6 mg/dL between weeks 36 and 48 were on the EasyAllo2 predicted dose or less (Figure 4). Younger age, lower kidney function, and higher SU were associated with requiring allopurinol doses higher than predicted by EasyAllo2 (Table 3). In secondary analysis using EasyAllo1, which includes baseline SU for prediction, younger age, higher baseline weight, and higher SU were associated with allopurinol doses higher than predicted. Considering all participants who ever achieved SU < 6 mg/dL, half (n = 207, 51%) subsequently had SU that was not at goal (≥6 mg/dL). This occurred more frequently among participants on a study dose below the EasyAllo2 predicted dose relative to participants on a study dose at or above the, though, this difference did not achieve statistical significance (55% vs. 45%, p = 0.06). Conclusion: Among participants who achieved SU < 6.0 mg/dL through protocolized allopurinol dose escalation, nearly 3 out of 4 would likely have achieved the SU goal at the EasyAllo2 predicted dose. These findings suggest that EasyAllo2 would perform well in this population with a small proportion requiring additional dose escalation.
Table 2. Baseline characteristics among Veterans Affairs participants randomized to allopurinol in the STOP-GOUT trial.
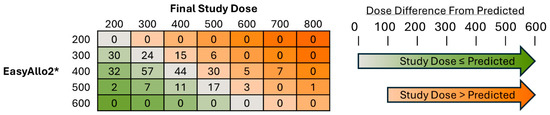 Figure 4. Final allopurinol study dose versus EasyAllo2 predicted dose among participants achieving SU goal. All doses represent mg per day of allopurinol. A total of 291 participants in the allopurinol group without baseline tophi met goal SU < 6 mg/dL between weeks 36 and 48. Green represents participants in whom the final trial dose at the time of achieving SU goal < 6 mg/dL was equal to (n = 85, 29%) or less than the EasyAllo2 predicted dose (n = 139, 48%). Orange represents participants whose final study dose was more than the EasyAllo2 predicted dose (n = 67, 23%). A total of 79% (n = 231) of participants were on a study dose within 100 of the EasyAllo2 dose prediction. The weighted kappa, a measure of agreement where doses closer together are weighted more, was 0.27 using quadratic weighting. * EasyAllo2 dose predictions were calculated using participants baseline weight and creatinine clearance. Abbreviation: serum urate (SU).
Table 3. Baseline characteristics of study participants receiving an allopurinol dose at the predicted dose or lower among participants achieving SU < 6 mg/dL.
Figure 4. Final allopurinol study dose versus EasyAllo2 predicted dose among participants achieving SU goal. All doses represent mg per day of allopurinol. A total of 291 participants in the allopurinol group without baseline tophi met goal SU < 6 mg/dL between weeks 36 and 48. Green represents participants in whom the final trial dose at the time of achieving SU goal < 6 mg/dL was equal to (n = 85, 29%) or less than the EasyAllo2 predicted dose (n = 139, 48%). Orange represents participants whose final study dose was more than the EasyAllo2 predicted dose (n = 67, 23%). A total of 79% (n = 231) of participants were on a study dose within 100 of the EasyAllo2 dose prediction. The weighted kappa, a measure of agreement where doses closer together are weighted more, was 0.27 using quadratic weighting. * EasyAllo2 dose predictions were calculated using participants baseline weight and creatinine clearance. Abbreviation: serum urate (SU).
Table 3. Baseline characteristics of study participants receiving an allopurinol dose at the predicted dose or lower among participants achieving SU < 6 mg/dL.
References
- Wright, D.F.B.; Hishe, H.Z.; Stocker, S.L.; Dalbeth, N.; Horne, A.; Drake, J.; Haslett, J.; Phipps-Green, A.J.; Merriman, T.R.; Stamp, L.K. The development and evaluation of dose-prediction tools for allopurinol therapy (Easy-Allo tools). Br. J. Clin. Pharmacol. 2024, 90, 1268–1279.
7. Macrophage Tolerance Regulates the Progression of Atherosclerosis by MSUc
- Benjamin Hemming *, Riley W. Porter, Daniel Ward Phillips, Mohnish Alishala, Xiaoxiao Geng, Stephen Calderon, Faith Inkum, Enchen Zhou, Christian K. Nickl, Kimberley Weldy, Elena Alekseeva, Calvin Yeang, Christopher K. Glass, Monica Guma, Robert Terkeltaub and Isidoro Cobo
- *
- Division of Clinical Immunology & Rheumatology, Department of Medicine, Heersink School of Medicine, The University of Alabama at Birmingham, 1825 University Blvd, Shelby 1210, Birmingham, AL 35294, USA; bhemming@uab.edu
- Abstract: Background: Gout is associated with increased cardiovascular morbidity, including atherosclerosis, yet the immunologic mechanisms remain unclear. We hypothesized that the enhanced atherosclerotic burden in gout patients is driven by local immune activation in response to monosodium urate crystal (MSUc) deposition. Methods: To investigate this, we injected MSUc or PBS into the air pouch of atherosclerosis-prone Ldlr−/− mice fed a Western diet using two injection protocols: Protocol A (Mon/Wed/Fri) and Protocol B (Mon/Tue/Fri). Results: Oil Red O staining and aortic root histology revealed significantly increased lesion area in both groups, with Protocol A inducing more extensive atherosclerosis (Figure 5). These differences occurred without changes in circulating cholesterol, implicating inflammatory timing rather than lipid burden. To assess how prior MSUc exposure alters inflammatory response to rechallenge, we performed sequential MSUc injections following rest intervals of 12 or 16 h, or 1, 2, or 3 days. Remarkably, prior exposure conferred transient protection against secondary challenge, with reduced leukocyte recruitment at 12–24 h and a return to baseline by 48–72 h (Figure 6). Similar tolerance was observed following intraperitoneal MSUc, suggesting systemic coordination. These findings indicate MSUc induces a short-lived innate immune memory response, functionally resembling macrophage tolerance that might be implicated in MSUc-enhanced atherosclerosis. To probe this tolerance mechanistically, we stimulated bone marrow-derived macrophages (BMDMs) with MSUc once or twice, separated by rest intervals ranging from 0 h to 3 weeks. We defined tolerance as reduced inflammatory gene induction upon re-stimulation, and training as amplification of gene expression. Of genes upregulated during the first MSUc exposure, 29% were tolerized and 16% trained after a second exposure (Figure 7). Trained responses diminished by day 3, while tolerance persisted and gradually returned to baseline by 1–2 weeks. Strikingly, tolerance was maintained even after four sequential 5-h MSUc stimulations, indicating a non-exhaustible regulatory program. Conclusions: These findings suggest that MSUc induces a unique state of macrophage adaptation that tempers subsequent inflammatory responses and modulates atherogenic progression. Understanding the molecular underpinnings of this tolerogenic program may uncover new therapeutic strategies aimed at promoting protective immune reprogramming to limit vascular inflammation in gout-associated atherosclerosis.
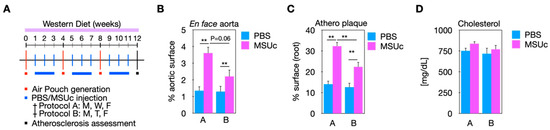 Figure 5. (A) Protocols: MSUc injected Mon/Wed/Fri (Protocol A) vs. Mon/Tue/Fri (Protocol B). (B) Oil Red O staining of aortas and (C) aortic root histology. (D) Cholesterol levels unchanged; Protocol A elicited greater lesion burden.
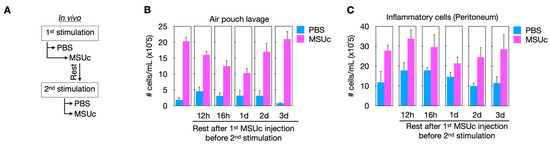 Figure 6. (A) MSUc re-challenge design with 12 h to 3-day resting intervals. (B) Inflammatory cell recruitment reduced at 12 h, peaking at 24 h, resolving by 2–3 days. (C) Intraperitoneal MSUc replicated 24 h tolerance effect.
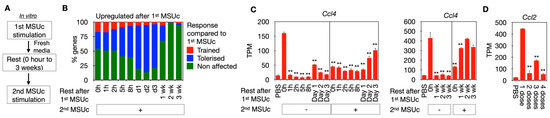 Figure 7. (A) BMDMs rested 0 h to 3 weeks between MSUc stimulations. (B) At re-stimulation, 29% of genes were tolerized, 16% trained. (C) Ccl4 among tolerized genes. (D) Tolerance persisted after four 5 h stimulations without exhaustion.
8. Colocalization of Genetic Association Signals and QTLs Reveals Insights into the Pathogenesi of Gout
- Aichang Ji 1,2,†, Riku Takei 2,†, Richard Reynolds 2, Changgui Li 1 and Tony R.Merriman 2,3,*
- 1
- Shandong Provincial Key Laboratory of Metabolic Diseases, the Affiliated Hospital of Qingdao University, Qingdao University, Qingdao, China
- 2
- Division of Clinical Immunology and Rheumatology, University of Alabama at Birmingham, Birmingham, AL, USA
- 3
- Department of Microbiology and Immunology, University of Otago, Dunedin, New Zealand
- *
- Correspondence: tony.merriman@otago.ac.nz
- †
- These authors contributed equally.
- Abstract: Introduction: Gout is triggered by an innate immune response to monosodium urate crystal deposition. While recent genome-wide association studies (GWAS) have identified numerous genetic loci associated with gout, elucidating their functional relevance remains challenging, particularly because most are located in non-coding regions of the genome. In this study, we used colocalization of genetic association signals of gout with quantitative trait loci (eQTLs), alternative splicing QTLs (sQTLs), and protein QTLs (pQTLs) to identify new pathogenic mechanisms and pathways in gout. Method: We conducted the largest GWAS to date involving 2.7 million individuals of European ancestry, including 162,361 individuals with prevalent gout. We performed genetic colocalization analyses with cis expression eQTLs, sQTLs in the Genotype-Tissue Expression (GTEx) database [1], and both cis and trans pQTLs in the UK Biobank Pharma Proteomics Project (UKB-PPP) [2]. A total of 414 lead variants were used for the colocalization analysis using the ‘coloc’ R package [3]. Colocalization analysis was performed using a 1-Mb (±500-kb) region around the lead variant, and genetic loci with posterior probability of co-localization (PPH4) ≥ 0.8 were considered significant. KEGG, Reactome and GO pathway analyses were. Results: We identified 387 loci and 414 genetically independent signals, including 165 novel loci and 193 novel signals not reported in the previous largest European study [4] (Figure 8). Among these, 38 lead variants were missense variants or in strong linkage disequilibrium (r2 > 0.98) with missense variants, mapping to 40 protein-coding genes and 12 of these genes were newly implicated in gout (Figure 9). Using genetic colocalization analysis, we identified 479 candidate genes via eQTLs and 106 via sQTLs. Enrichment analysis of 1603 unique candidate genes, including those identified by missense variants, eQTLs and sQTLs, and MAGMA gene-set analysis, revealed significant enrichment in 111 pathways. A notable new pathway identified was neutrophil extracellular trap formation (KEGG), which is important in the local immune response in gout [5] (Figure 10). We identified 904 pQTLs. Notably, trans-pQTL signals were extremely common among colocalized pQTLs (895/904 = 99%). Three lead variants, rs4766578 (ATXN2), rs879055593 (ABO), and rs1260326 (GCKR), were each associated with the levels of many proteins (205, 173, and 155, respectively). Pathway analysis of the corresponding 690 pQTL-identified proteins showed enrichment in cell adhesion, immune regulation, and cytokine-receptor interactions. Conclusion: Our integrative genomic analysis reveals the complex molecular mechanisms underlying gout. Colocalization with multiple QTL types provides functional insight into non-coding variants. In particular, the abundance of trans-pQTLs suggests they may regulate gout-related pathways on a systemic level, perhaps by modulating metabolite levels, for example, through epigenomic regulation of gene expression and/or post-translational modification and protein stability.
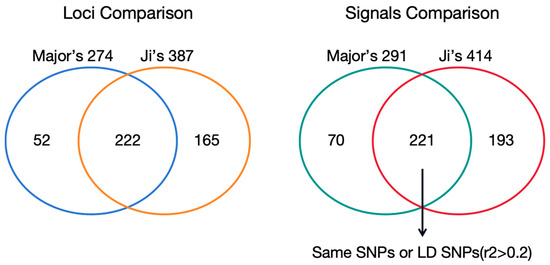 Figure 8. The comparison of the loci and signals with Major et al. loci. A locus was defined as a genomic segment with ≥1 lead variant(s) that defines a genetically independent signal. Signals, lead SNP(s) within each of the significant loci defined above, were identified by conducting LD-based clumping using PLINK version 1.9b4 with the 1000 Genomes Project reference panel (European population) and an r2 threshold of 0.01. LD, linkage disequilibrium.
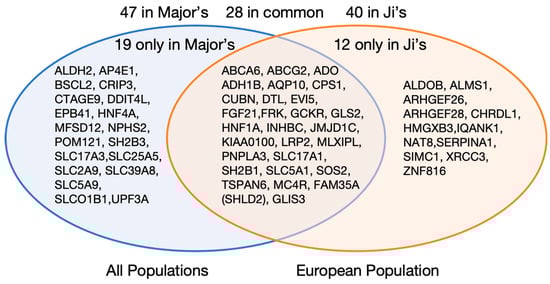 Figure 9. Comparison of the missense genes with Major et al. All populations include European, African, East Asian, and Latinx.
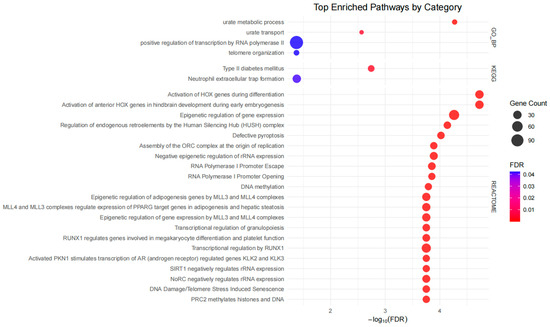 Figure 10. Functional and pathway enrichment analyses of gout candidate genes. Reactome shows the top 20 of the 105 pathways.
Reference
- Oliva, M.; Muñoz-Aguirre, M.; Kim-Hellmuth, S.; Wucher, V.; Gewirtz, A.D.H.; Cotter, D.J.; Parsana, P.; Kasela, S.; Balliu, B.; Viñuela, A.; et al. The impact of sex on gene expression across human tissues. Science 2020, 369, eaba3066.
- Sun, B.B.; Chiou, J.; Traylor, M.; Benner, C.; Hsu, Y.H.; Richardson, T.G.; Surendran, P.; Mahajan, A.; Robins, C.; Vasquez-Grinnell, S.G.; et al. Plasma proteomic associations with genetics and health in the UK Biobank. Nature 2023, 622, 329–338.
- Giambartolomei, C.; Vukcevic, D.; Schadt, E.E.; Franke, L.; Hingorani, A.D.; Wallace, C.; Plagnol, V. Bayesian test for colocalisation between pairs of genetic association studies using summary statistics. PLoS Genetics 2014, 10, e1004383.
- Major, T.; Takei, R.; Matsuo, H.; Leask, M.P.; Sumpter, N.A.; Topless, R.K.; Shirai, Y.; Wang, W.; Cadzow, M.J.; Phipps-Green, A.J.; et al. A genome-wide association analysis reveals new pathogenic pathways in gout. Nat. Genet. 2024, 56, 2392–2406.
- Schauer, C.; Janko, C.; Munoz, L.E.; Zhao, Y.; Kienhöfer, D.; Frey, B.; Lell, M.; Manger, B.; Rech, J.; Naschberger, E.; et al. Aggregated neutrophil extracellular traps limit inflammation by degrading cytokines and chemokines. Nat. Med. 2014, 20, 511–517.
9. Explaining Variation in Equitable Urate-Lowering Therapy Uptake: Findings from a Realist Synthesis to Support Context-Sensitive Implementation of Gout Interventions in Aotearoa New Zealand
- Julia Muir 1,*, Rebecca Grainger 2 and Lisa Stamp 1
- 1
- University of Otago Christchurch, Christchurch, New Zealand
- 2
- University of Otago Wellington, Wellington, New Zealand
- *
- Correspondence: julia.muir@otago.ac.nz
- Abstract: Background: Despite the availability of effective and affordable pharmacological treatments for gout, real-world uptake of urate-lowering therapy (ULT) is low. People with gout are often started on ULT but sustained use and long-term maintenance of target serum urate levels are often not maintained, exacerbating inequities in access, quality of care, and outcomes. These uptake challenges persist despite recent efforts to shift gout models of care using multidisciplinary, equitable approaches, suggesting the need to more comprehensively examine factors outside of individual adherence, and consider broader implementation dynamics. This study used a realist synthesis approach to better understand how uptake of ULT is shaped by wider clinical, interpersonal, and systemic processes, with a focus on equity-sensitive delivery contexts. Methods: A hybrid critical realist synthesis was conducted, focusing on the research question: what explains variation in equitable gout outcomes across different care settings and patient populations in interventions aimed at increasing ULT uptake in Aotearoa New Zealand? The synthesis included 48 empirical and conceptual papers from rheumatology, health psychology, and implementation science literature. Context Mechanism Outcome configurations (CMOc) were developed to explain how factors such as intervention delivery, patient experience, and health system design interact to shape equitable uptake. Results: Three key generative mechanisms influenced uptake: (1) Treatment legitimacy, shaped by how medications are introduced, framed, and situated within a patient’s broader life context; (2) Relational trust, mediated by symptom experience, and prior treatment experiences; and (3) Systemic constraint, shaped by shared decision-making, reduced decision-complexity, and redistribution of cognitive load through structured support and streamlined care delivery. These mechanisms failed to activate when services were rigid, fragmented, and/or lacked individualised, culturally responsive communication. This failure particularly impacted Māori and Pacific participants, especially those with more complex health needs or lower socioeconomic resources. Conclusions: Realist methods offer a useful lens for understanding and anticipating variation across patient populations and care settings, and for designing equity-sensitive implementation strategies. Improving uptake requires attention to how the interplay between trust, meaning, and system design shapes real-world ULT use. Moving forward, integrating relational continuity and flexible, structured support into service models may better activate key mechanisms for equitable uptake.
10. Prolonged State of Hyperuricemia Activates the Human Innate Immune System: A Two-Year Follow-Up from the GO TEST Finale Study
- Brenda Kischkel 1, Iris Rose Peeters 2, Alfons A. den Broeder 2, Noortje van Herwaarden 2 and Leo A. B. Joosten 1,3
- 1
- Department of Internal Medicine and Research Institute for Medical Innovation, Radboud University Medical Center, Nijmegen, The Netherlands. Phone: +31-06-84452806. Email: Brenda.Kischkel@radboudumc.nl. Secondary email: brendakischkel@gmail.com
- 2
- Department of Rheumatology, Sint Maartenskliniek, Nijmegen, The Netherlands
- 3
- Department of Medical Genetics, Iuliu Hatieganu University of Medicine and Pharmacy, Cluj-Napoca, Romania
- *
- Correspondence: Brenda.Kischkel@radboudumc.nl
- Abstract: Background: Long-term treatment of gout focuses on lowering serum urate (SU) concentrations to prevent the recurrence of gout flares and the formation of tophi. This is achieved primarily through urate-lowering therapy (ULT) [1]. Although EULAR/ACR guidelines recommend lifelong ULT treatment, in clinical practise 46–90% of patients choose discontinuation [2,3]. The debate on the best strategy regarding long-term ULT use is the basis for the GO TEST Finale study, a 2-year follow-up, multicentre randomised clinical trial comparing ULT continuation with ULT discontinuation (with restart in case of recurrent flares/tophi) in patients with gout in prolonged remission while using ULT [4]. Here, we report the long-term effects of ULT discontinuation on the human immune system. Results: A subgroup of patients in the discontinuation arm of the GO TEST Finale study (31 of 155 patients) were enrolled in a sub-study, which included extensive blood sampling at 3-month intervals throughout the study period. At baseline, all patients had SU concentrations below 0.36 mmol/L. Two weeks after stopping ULT, SU levels increased to 0.53 mmol/L [IQR 0.4–0.65] and remained elevated over 2 years. Exposure of primary human peripheral blood mononuclear cells (PBMCs) to monosodium urate (MSU) crystals and lipopolysaccharide (LPS) resulted in increased IL-1β, IL-6, TNF, IL-8, and IL-10 production after 15 months. In contrast, IL-1Ra levels decreased significantly after 12 months. Hematological analysis revealed no significant differences in total counts of monocytes, neutrophils, lymphocytes, basophils, or eosinophils over time. Of high interest, flow cytometry analysis uncovered an increase in the population of classical monocytes (CD14+CD16−), typically responsible for the production of pro-inflammatory cytokines. Changes in systemic inflammation were observed using proximity extension assay technology (Olink) to measure 384 inflammation-related proteins in the plasma of these patients. Differently expressed proteins were obtained by linear regression models using age and sex as covariates (Limma R package release 3.22). Patients who restarted ULT were removed from this analysis. Comparison between baseline and 1 and 2 years after ULT discontinuation identified 32 upregulated proteins and 2 downregulated, including FIS1 (p = 0.002), CXCL8 (0.005), HSPA1A (0.006), GZMA (0.012), PRDX5 (0.018), TNFRSF11A (0.029), and TNFRSF14 (0.047). These proteins are linked to processes such as inflammation, cell death, neutrophil recruitment, and antioxidant defence. Collectively, our findings demonstrate that after ULT discontinuation, PBMCs exhibit increased responsiveness over time, producing higher levels of pro-inflammatory cytokines in response to endogenous stimuli in vitro. This effect may be related to prolonged cellular exposure to urate and potential epigenetic reprogramming. Additionally, systemic changes observed in plasma after 1 and 2 years suggest the development of a persistent low-grade inflammatory state. Future directions include generating transcriptomic and epigenomic profiles and extending patient follow-up for another three years.
References
- Richette, P.; Flendrie, M.; Joosten, L.A.B.; van Herwaarden, N. Can urate lowering therapy be stopped in gout? Rationale and Design of Two Large Randomised Trials. Gout Urate Cryst. Depos. Dis. 2025, 3, 2.
- Richette, P.; Doherty, M.; Pascual, E.; Barskova, V.; Becce, F.; Castañeda-Sanabria, J.; Coyfish, M.; Guillo, S.; Jansen, T.L.; Janssens, H.; et al. 2016 updated EULAR evidence-based recommendations for the management of gout. Ann. Rheum. Dis. 2017, 76, 29–42.
- FitzGerald, J.D.; Dalbeth, N.; Mikuls, T.; Brignardello-Petersen, R.; Guyatt, G.; Abeles, A.M.; Gelber, A.C.; Harrold, L.R.; Khanna, D.; King, C.; et al. 2020 American College of Rheumatology guideline for the management of gout. Arthritis Rheumatol. 2020, 72, 879–895.
- Peeters, I.R.; den Broeder, A.A.; Taylor, W.J.; den Broeder, N.; Flendrie, M.; van Herwaarden, N. Urate-lowering therapy following a treat-to-target continuation strategy compared to a treat-to-avoid-symptoms discontinuation strategy in gout patients in remission (GO TEST Finale): study protocol of a multicentre pragmatic randomized superiority trial. Trials 2023, 24, 282.
11. Health Care Utilization Patterns Among Patients Presenting to Emergency Department for Gout Flares in Ontario, Canada: A Population-Based Retrospective Observational Study
- Timothy S.H. Kwok 1,2,*, Samantha Morais 3, Ping Li 3, William K. Silverstein 4,5, Clare L. Atzema 3,5,6,7, Gregory Choy 1, Priyanka Chandratre 8,9 and Jessica Widdifield 2,3,7
- 1
- Division of Rheumatology, Department of Medicine, University of Toronto, Canada
- 2
- Holland Bone & Joint Program, Sunnybrook Research Institute, Toronto, Canada
- 3
- ICES, Toronto, Canada
- 4
- Division of General Internal Medicine, Department of Medicine, University of Toronto, Canada
- 5
- Integrated Community Care, Sunnybrook Research Institute, Toronto, Canada
- 6
- Division of Emergency Medicine, Department of Medicine, University of Toronto, Canada
- 7
- Institute of Health Policy, Management & Evaluation, Dalla Lana School of Public Health, University of Toronto, Canada
- 8
- Division of Rheumatology, Department of Medicine, University of Ottawa, Canada
- 9
- Ottawa Hospital Research Institute, Ottawa, Canada
- *
- Correspondence: timothysh.kwok@utoronto.ca
- Abstract: Background: Gout flares can be intensely painful, leading patients to seek care in emergency departments (ED). Although gout can typically be effectively managed in outpatient settings, high rates of ED use may indicate potential gaps in ambulatory chronic disease management. To inform targeted improvements in gout healthcare delivery, we assessed annual ED visits for gout and identified patient characteristics and health services patterns that may be contributing to ED presentations. Methods: Using province-wide health administrative data, we performed a population-based retrospective observational study, identifying the annual number of gout ED visits occurring between 2014 and 2023 in Ontario, Canada’s most populous province. Annual total and incident ED gout visits were separately determined, then stratified by sex and age. Annual rates were estimated using population denominators. We described clinical and sociodemographic characteristics and assessed patient-level health care usage factors both preceding and after the gout ED visit. Repeat ED presentations and hospitalizations were determined within 90-days. Among individuals aged ≥66 years, we further assessed dispensations for flare abortive medications, urate-lowering therapy, and opioids within a 30-day window. Results: The mean age of individuals presenting to the ED was 59.7 (SD 16.4), and 77.5% were male. Annual ED gout encounters peaked in 2018 with 14,017 total encounters translating to an annual crude rate of 0.99 (95% CI: 0.97 to 1.01) and male-stratified annual rate of 1.56 (95% CI: 1.53 to 1.59) visits per 1000-persons (Figure 11). Older adults had the highest ED visit rates at 3.01 (95% CI: 2.89 to 3.15) visits per 1000-persons in the 75 to 84 age group in 2015 (Figure 12). Between 2014 and 2023, there were 125,505 gout ED visits in Ontario, including 86,824 incident visits. Patients were predominantly from lower-income neighborhoods and resided in less racially diverse areas. Patients were highly comorbid with 55.5% of patients with ≥10 Aggregated Diagnosis Groups. Common comorbidities included hypertension (57.7%), diabetes (24.0%), cardiovascular (5.8%) and renal disease (4.6%). By 30-days post-ED encounter, 28.3% and 21.3% of patients were dispensed a flare abortive medication or attended an ambulatory physician visit for gout, respectively, while 10.3% were dispensed an opioid. By 6 months, 38.1% of patients had serum urate testing (Table 4). By 90 days, 29.9% of encounters led to ED re-presentation, with 9.4% of total encounters representing specifically for gout, culminating in 6.2% (1.5% for gout) of total encounters leading to hospital admission. Findings were comparable for incident ED gout visits. Conclusion: In what is one of the first Canadian population-based assessments of acute care use for gout, our work suggests that there is a large burden of ED visits, with suboptimal post-ED health services use, marred by under-prescribing of flare medications, over-prescribing of opioids and high acute care representation rates. Quality improvement efforts should be directed at strategies to prevent upstream ED presentations for gout and enhancing appropriate follow-up care.
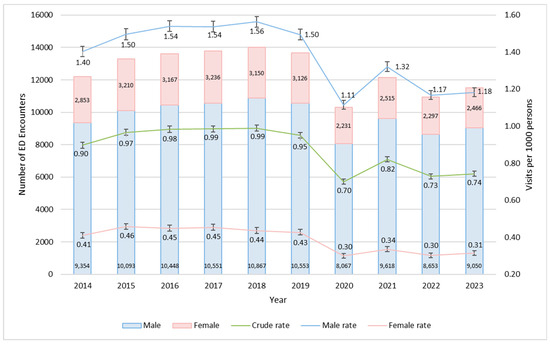 Figure 11. Annual frequency and rates of ED gout visits: overall and stratified by sex.
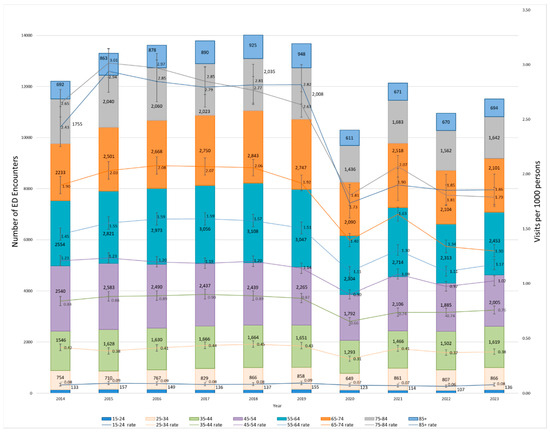 Figure 12. Annual frequency and rates of ED gout visits, stratified by age.
Table 4. Health care usage prior to and after gout ED visits by total and incident ED visits.
Figure 12. Annual frequency and rates of ED gout visits, stratified by age.
Table 4. Health care usage prior to and after gout ED visits by total and incident ED visits.
12. Epigenetic Clocks Reveal Accelerated Aging in Patients with Gout and Individuals with Hyperuricemia
- Medeea Badii 1,2, Zhaoli Liu 3, Mohamad Ballan 3, Orsolya Gaal 1,2, Georgiana Cabău 1, Valentin Nica 1, Ancuta R. Straton 1, Ioana Hotea 4, HINT Consortium, Cristina Pamfil 4, Simona Rednic 4, Radu A Popp 1, Cheng-Jian Xu 3, Tania O Crişan 1,2,* and Leo A B Joosten 1,2
- 1
- Department of Medical Genetics, Iuliu Hațieganu University of Medicine and Pharmacy, 400349 Cluj-Napoca, Romania
- 2
- Department of Internal Medicine and Radboud Institute for Molecular Life Sciences (RIMLS), Radboud University Medical Centre, 6525GA Nijmegen, The Netherlands
- 3
- Centre for Individualized Infection Medicine (CiiM), a joint venture between Hannover Medical School and Helmholtz Centre for Infection Research, 30625 Hannover, Germany
- 4
- Department of Rheumatology, Iuliu Hațieganu University of Medicine and Pharmacy, 400006 Cluj-Napoca, Romania
- 5
- Centre for Individualized Infection Medicine (CiiM), a joint venture between Hannover Medical School and Helmholtz Centre for Infection Research, 30625 Hannover, Germany
- 6
- Department of Rheumatology, Iuliu Hațieganu University of Medicine and Pharmacy, 400006 Cluj-Napoca, Romania
- *
- Correspondence: tania.crisan@gmail.com
- Abstract: Introduction: Epigenetic clocks are predictive models trained on DNA methylation at CpG sites to estimate biological age, offering valuable insights that may differ from an individual’s chronological age. These tools are central in aging research, enabling the assessment of age-related health and disease risk. Hyperuricemia is a metabolic disorder that plays a key role in the onset of gout. This study aims to explore whether hyperuricemia and gout are associated with accelerated biological aging by analyzing DNA methylation patterns and immune cell proportions in the whole blood of individuals with normouricemia, asymptomatic hyperuricemia, and gout. Methods: DNA methylation profiles were obtained using the Infinium EPIC v2 array across 150 normouricemic controls, 128 individuals with asymptomatic hyperuricemia, and 148 patients with gout. Beta values were extracted with the getBeta function from the preprocessFunnorm package in R. Epigenetic age was estimated using three established DNA methylation clocks: Horvath, Hannum and PhenoAge. DNA methylation age (DNAmAge) was estimated using the methylclock package in R. Epigenetic age acceleration (EAA) was calculated as the residuals from regressing DNAmAge on chronological age. Blood cell counts were inferred from DNA methylation data with FlowSorted.Blood.EPIC. Results: DNAmAge (expressed in years) correlated strongly with chronological age across all groups and clocks. Welch’s ANOVA with Games-Howell post hoc testing revealed significantly increased epigenetic age acceleration (EAA) in gout based on the Hannum clock (+1.75 years, p = 0.004) and in both gout and hyperuricemia based on PhenoAge (+3.38 and +3.64 years, p = 0.002) compared to controls. No significant differences were found using the Horvath clock. Significant immune cell shifts were observed in gout and hyperuricemia, including reduced CD4+ and CD8+ T cells and increased neutrophils, with monocytes elevated in gout. Across all groups, both chronological age and DNAmAge (Horvath, Hannum, PhenoAge) were inversely correlated with T cells and positively with neutrophils. We assessed whether the association between cell types and epigenetic age acceleration varied by group. In gout, neutrophils and monocytes were linked to Horvath and PhenoAge EAA; monocytes also showed associations in hyperuricemia. For Hannum, only monocytes were significant in gout. No significant effects were seen in hyperuricemia for Hannum or PhenoAge. Conclusion: These findings suggest that biological aging may be accelerated in disease states such as gout and hyperuricemia. While Hannum and PhenoAge clocks revealed significant epigenetic age acceleration (EAA) in these groups, the Horvath clock did not show group-level differences. However, interaction analyses indicated that in gout, higher neutrophil and monocyte levels were significantly associated with Horvath, suggesting that immune cell shifts may contribute to or reflect intrinsic aging processes in disease contexts. However, further analyses are warranted to validate and extend these observations.
13. Characterisation of Clinical Phenotypes in CPPD by Hierarchical Analysis in Two Large Cohorts of Patients
- Greta Pellegrino 1,*, Laurène Norberciak 2, Silvia Sirotti 1, Abhishek Abhishek 3, Mariano Andrès 4, Edoardo Cipolletta 5, Julien Damart 6, Renaud Desbarbieux 7, Pilar Diez 4, Vincent Ducoulombier 6, Hang-Korng Ea 8,9, Emilio Filippucci 5, Charlotte Jauffret 6, Augustin Latourte 8,9, Jean-Guillaume Letarouilly 10, Sébastien Ottaviani 11, Pascal Richette 8,9, Pierre Robinet 6, Georgios Filippou 1,† and Tristan Pascart 6,†
- 1
- Department of Rheumatology, IRCCS Istituto Ortopedico Galeazzi, Milan, Italy
- 2
- Department of Biostatistics and Methodology, Saint-Philibert Hospital, Lille Catholic University, Lille, France
- 3
- Academic Rheumatology, University of Nottingham, Nottingham, UK
- 4
- Department of Rheumatology, Dr Balmis General University Hospital-ISABIAL, Miguel Hernandez University, Alicante, Spain
- 5
- Rheumatology Unit, Department of Clinical and Molecular Sciences, Polytechnic University of Marche, Ancona, Italy
- 6
- Department of Rheumatology, Saint-Philibert Hospital, Lille Catholic University, Lille, France
- 7
- Department of Rheumatology, Boulogne-sur-Mer Hospital, Boulogne-sur-Mer, France
- 8
- Hôpital Lariboisière, APHP-Nord, Service de Rhumatologie, 2 rue Ambroise Paré, Paris, France
- 9
- Bioscar UMR Inserm 1132 and Université de Paris Cité, Paris, France
- 10
- Université de Lille, Centre Hospitalier Universitaire Lille, MABLab ULR 4490, Service de Rhumatologie, Lille, France
- 11
- Department of Rheumatology, Hôpital Bichat APHP Paris Nord and Université de Paris, Paris, France
- *
- Correspondence: greta.pellegrino@unimi.it
- †
- Shared co-author.
- Abstract: Background: Calcium pyrophosphate deposition (CPPD) disease is a heterogeneous condition, ranging from monoarticular to polyarticular involvement and from acute to chronic arthritis. It is frequently misdiagnosed, as it mimics other musculoskeletal disorders. In 2011, the EULAR task force proposed four phenotypes based on expert opinion. However, these phenotypes show substantial overlap and they were never validated in real-world patient cohorts. Objective: The aim of this study was to identify, for the first time using rigorous methodology, clinical phenotypes of CPPD disease by integrating real-world data from two datasets. Methods: Data from the COLCHICORT randomised controlled trial and CHRONIC-CPPD European observational cohort were analysed. Multiple Correspondence Analysis (MCA) was employed to evaluate and visualize the association between modalities of qualitative variables. Hierarchical Clustering on Principal Components (HCPC) obtained from MCA identified clusters based on the Ward agglomeration method with Euclidean distance. A bivariate analysis between clusters was then performed to characterize the clusters numerically. Results: A total of 227 patients were included in the analysis, 98 patients from the COLCHICORT study and 129 patients from the CHRONIC CPPD study. Due to missing data, the final analysis was conducted on 134 patients. A 4-cluster partition emerged from the visual analysis of the dendrogram (Figure 13). The distribution of patients across these clusters was as follows: Cluster-1 (43.3%), Cluster-2 (17.9%), Cluster-3 (19.4%), and Cluster-4 (19.4%). The demographic, clinical, laboratory and imaging characteristics are shown in Table 5 and summarized in Figure 14. Two phenotypes demonstrated predominantly monoarticular involvement: Cluster-1, corresponding to the EULAR-defined “acute CPP crystal arthritis”, and Cluster-2, which does not fully align with any EULAR-defined phenotype. In Clusters-3 and -4, there were the most clinically burdened group of patients, with a higher number of affected joints and persistent arthritis. Cluster-3 could be considered equivalent to the “chronic CPP crystal arthritis” phenotype proposed by EULAR, as it is characterized by polyarticular arthritis, particularly involving the wrist and knee joints. Cluster-4 represents the most intriguing finding of our study, as it includes patients with a high frequency of polyarticular involvement, affecting the shoulders and the spine in a large proportion of patients. It mostly affects males and younger patients and CRP values are frequently elevated. Cluster-4 appears to be a “new” cluster that in many cases could be mistaken for Polymyalgia Rheumatica with synovitis. Conclusions: In conclusion, by using for the first time a robust, data-driven methodology based on real-world data, two clusters similar to the EULAR phenotypes “acute CPP crystal arthritis” and “chronic CPP crystal inflammatory arthritis” were confirmed, but in addition, two more clusters that do not correspond to any existing EULAR phenotypes were also identified. Future research should aim to validate these findings in larger prospective cohorts or registries to further refine CPPD phenotypes.
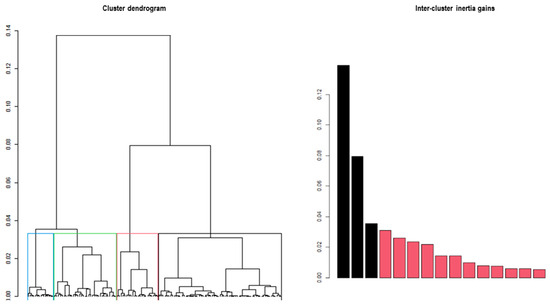 Figure 13. Dendrograms of the hierarchical clustering by principal component, and inter-cluster inertia gains histograms derived from four-cluster partitions chosen for the purpose of the study. Legend: The dendrogram represents the hierarchical tree generated by the HCPC method. The branch height is proportional to the distance between the merged elements. Each leaf corresponds to an individual object, and moving up the tree, similar objects are progressively grouped into branches, which are then merged at higher levels.
Table 5. Results from the comparison analyses of demographic, clinical and imaging data between the population divided into the four different clusters.
Figure 13. Dendrograms of the hierarchical clustering by principal component, and inter-cluster inertia gains histograms derived from four-cluster partitions chosen for the purpose of the study. Legend: The dendrogram represents the hierarchical tree generated by the HCPC method. The branch height is proportional to the distance between the merged elements. Each leaf corresponds to an individual object, and moving up the tree, similar objects are progressively grouped into branches, which are then merged at higher levels.
Table 5. Results from the comparison analyses of demographic, clinical and imaging data between the population divided into the four different clusters.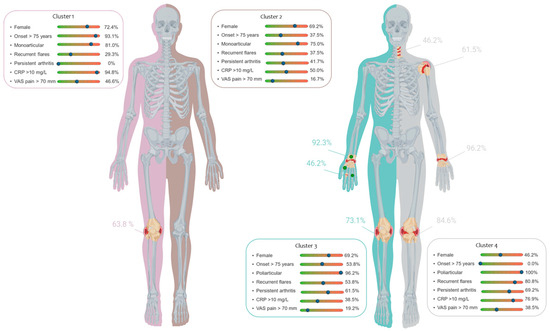 Figure 14. Visual representation of joint involvement across clusters with key demographic and clinical characteristics for each cluster. The humanized cartoon illustrates the most frequently (>45%) involved joints in the different clusters. Cluster 2 represents the cluster with the greatest heterogeneity in joint involvement: no predominant site was identified. The green dot sites on the wrist, MCP and STT joint of Cluster 3 indicate the three joints most affected (with a frequency > 45%) by radiographic signs of OA.
14. Local MSUc Gout Inflammation Accelerates Atherosclerosis in Ldlr−/− Mice by Expanding an EMP1+ Monocyte Population Systemically via DNMT3A and Type-I IFN Signaling
- Daniel Ward Phillips 1,*, Benjamin Hemming 1, Riley W. Porter 1, Mohnish Alishala 2, Xiaoxiao Geng 3, Stephen Calderon 2, Faith Inkum 1, Enchen Zhou 2, Christian K. Nickl 2, Kimberley Weldy 4, Elena Alekseeva 4, Calvin Yeang 4, Christopher K. Glass 5, Monica Guma 6,7, Robert Terkeltaub 8 and Isidoro Cobo 1,3,9
- 1
- Division of Clinical Immunology & Rheumatology, Department of Medicine, Heersink School of Medicine, University of Alabama at Birmingham, AL, USA
- 2
- Department of Cellular and Molecular Medicine, University of California San Diego, San Diego, La Jolla, CA, USA
- 3
- Department of Biomedical Engineering, School of Medicine, The University of Alabama at Birmingham, AL, USA
- 4
- Division of Cardiology, Department of Medicine, University of California San Diego, La Jolla, CA, USA.
- 5
- Department of Cellular and Molecular Medicine, University of California San Diego, San Diego, La Jolla, CA, USA
- 6
- Division of Rheumatology, Allergy, and Immunology. UCSD School of Medicine, 9500 Gilman Drive, La Jolla, CA, USA
- 7
- Department of Medicine, Autonomous University of Barcelona, Plaça Cívica, 08193 Bellaterra, Barcelona, Spain
- 8
- Division of Rheumatology, Allergy and Immunology, Department of Medicine, University of California, 9500 Gilman Drive, San Diego, La Jolla, CA, 92093, USA
- 9
- CAMBAC (Comprehensive Arthritis, Musculoskeletal, Bone and Autoimmunity Center), University of Alabama at Birmingham, AL, USA
- *
- Correspondence: dp2201@uab.edu
- Abstract: The role of gout in driving atherosclerosis progression remains unclear. Monocyte–macrophage lineage cells respond to monosodium urate crystals (MSUc) by producing inflammatory cytokines, contributing to a heightened immune state. To model this in vivo, we utilized the air pouch system to induce gouty inflammation in Ldlr−/− mice fed with a Western diet. Mice received intra-pouch injections of MSUc or PBS (control) three times weekly for twelve weeks (Figure 15A). Oil Red O staining of aortas revealed significantly increased lesion area in MSUc-treated animals (Figure 15B,C). Histological examination of the aortic root using H&E staining confirmed greater plaque burden in the MSUc group, despite no significant changes in serum cholesterol (Figure 15D,E). These results indicate that MSUc-mediated local inflammation can potentiate atherosclerosis independent of systemic lipid alterations. To evaluate broader immune effects, we performed bulk RNA sequencing on peripheral blood mononuclear cells (PBMCs), comparing them to bone marrow (BM) cells, Kupffer cells (KCs), and microglia (MG) after MSUc treatment. PBMCs were the only cell type to exhibit both significant transcriptional changes and upregulated inflammatory signaling pathways (Figure 16A,B), underscoring their unique systemic role following local MSUc exposure. Key upregulated genes included inflammatory chemokines (Ccl2, Ccl7, Cxcl3), tissue remodeling factors (Mmp19), immune modulators (Dab2, Clec7a, Ms4a4a), and Emp1 (Figure 16C). Notably, Emp1 expression was significantly increased in circulating monocytes isolated from MSUc-injected mice assessed by single-cell RNA-Seq (Figure 16D). Interestingly, Emp1 is among the genes upregulated during monocyte-to-macrophage differentiation, suggesting that the systemic inflammatory response to MSUc primes monocytes toward an activated, macrophage-like phenotype (Figure 16E). We next investigated DNMT3A, a gene frequently mutated in clonal hematopoiesis and associated with both gout and atherosclerosis, as a regulator of EMP1. Knockdown of DNMT3A in primary human monocytes or monocyte-derived macrophages (MDM) using antisense oligonucleotides (ASOs) led to a marked increase in EMP1 expression (Figure 17A,B). Notably, DNMT3A binds to the EMP1 promoter by ChIP-Seq, indicating direct regulation (Figure 17C). Additionally, modulation of interferon signaling—which is upregulated in DNMT3A-mutant settings—further influenced EMP1 levels (Figure 17D). Our study demonstrates that gout-like inflammation driven by MSUc can accelerate atherosclerosis through systemic activation of PBMCs and upregulation of EMP1. This response is amplified by loss of DNMT3A and altered interferon signaling, highlighting a potential mechanistic link between clonal hematopoiesis, gouty inflammation, and cardiovascular disease progression.
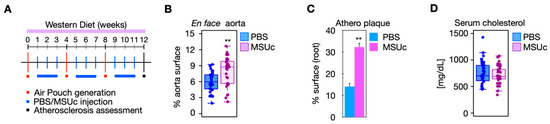 Figure 15. Local MSUc-induced inflammation accelerates atherosclerosis without affecting circulating cholesterol levels. Schematic representation of the experimental model (A) showing increased atherosclerosis assessed by en face aorta (B) or quantification of atherosclerosis events in the aortic root (C) or Ldlr−/− mice without altering cholesterol levels (D). 25 mice/group were used.
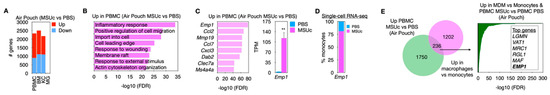 Figure 16. MSUc-enhanced atherosclerosis is accompanied by systemic immune cell activation with expansion of EMP1+ monocyte population. RNA-Seq of PBMC, BM, KC or MG isolated from mice injected with MSUc in the air pouch (A), showing upregulation of inflammatory pathways in PBMCs (B), with Emp1 as top-most significant gene (C). Emp1 is represented in monocytes from MSUc-injected mice (D) and upregulated in activated macrophages compared to monocytes (E). 3–5 mice/group were used.
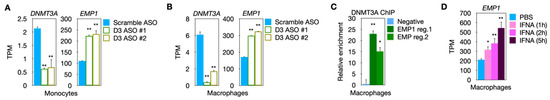 Figure 17. EMP1 expression is inhibited by DNMT3A and upregulated by IFN signaling. RNA-seq analyses of monocytes (A) or monocyte-derived macrophages (B). (C) DNMT3A ChIP-Seq. (D) EMP1 expression in macrophages exposed to IFNA. 3–5 mice/group were used.
15. Molecular Mechanisms Driving Divergent Response to Monosodium Urate Crystals in Genetically Distinct Macrophages Driven by PPARG
- Riley W. Porter *, Benjamin Hemming, Daniel W. Phillips, Zeyang Shen and Isidoro Cobo
- Division of Clinical Immunology & Rheumatology, Department of Medicine, Heersink School of Medicine, The University of Alabama at Birmingham, AL, USA; rwporter@uab.edu
- Abstract: The influence of noncoding genetic variation on macrophage gene expression is not yet fully understood, but it is widely recognized as a major factor shaping phenotypic diversity and disease susceptibility. In our study, we analyzed four inbred mouse strains to determine how their genetic variations affect macrophage responses to monosodium urate crystals (MSUc), which trigger the acute inflammatory response characteristic of gout. We chose C57, BALB, NOD and DBA, as combined they provide over 2 million ins/del/SNPs based on our previous publication [1]. Across the four strains, MSUc treatment dysregulated over 5000 genes by more than two-fold, yet only 16% of those genes were shared across all strains (Figure 18A–D). Similarly, of the more than 75,000 enhancer regions showing at least a two-fold change in response to MSUc assessed by H3K27ac ChIP-Seq, fewer than 10% were common to every strain (Figure 18E–H). DBA macrophages displayed the largest overall transcriptional shift, both under basal conditions and upon MSUc stimulation, suggesting heightened susceptibility. In contrast, the C57 and NOD strains exhibited more restrained responses, with fewer differentially expressed genes and enhancers, indicating variability in inflammatory potential driven by genetic background (Figure 18). By examining histone modifications in macrophages from each strain, we identified distinct combinations of transcription factors governing strain-specific responses to MSUc, contributing to unique gene-expression patterns and phenotypic diversity. DBA macrophages uniquely upregulated genes linked to nitric oxide signaling, inflammatory cytokine regulation, and transcriptional networks. BALB macrophages activated genes involved in tissue remodeling and extracellular matrix organization. NOD macrophages were enriched for cytoskeletal reorganization, immune-complex handling, and complement pathways, whereas C57 macrophages emphasized apoptosis, cell migration, and adhesion (Figure 19). Importantly, by cross-referencing our mouse data with a recently published gout genome-wide association study (GWAS), we identified a significant overlap between strain-specific transcriptional responses and human genetic susceptibility to gout, particularly in Nuclear Receptor Peroxisome Proliferator-Activated Receptor Gamma, which lies at the core of the GWAS gene regulatory network associated with increased expression and higher enhancer activity (Figure 20). This integrative analysis suggests that gout-associated genetic variants contribute to divergent transcriptional responses in macrophages upon MSUc stimulation. In particular, the distinct inflammatory and metabolic signatures observed highlight the critical role of genetic background in modulating disease susceptibility and pathogenesis. Our data clearly indicates that the Nuclear Receptor family, particularly PPARG, is a novel transcriptional regulator of macrophage response to MSUc, whose genomic regions confer gout susceptibility as defined in the latest gout GWAS [2].
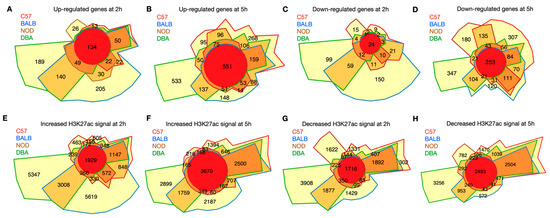 Figure 18. Genetically distinct macrophages display distinct transcriptional and enhancer responses to MSUc. Chow–Ruskey plots of RNA-Seq expression analyses (A–D) or enhancer analyses by H3K27ac ChIP-Seq (E–H) of C57, BALB, NOD and DBA macrophages showing distinct responses to MSUc after 2 h or 5 h of stimulation. In this Figure, n > 5/timepoint/strain.
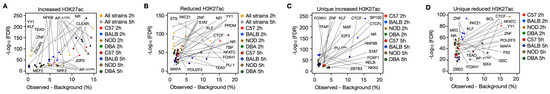 Figure 19. Genetically distinct macrophages display distinct Transcription Factor binding properties. Graphical representation of Transcription Factor motifs identified in the H3K27ac dysregulated enhancers of C57, BALB, NOD and DBA macrophages showing distinct responses to MSUc after 2 h or 5 h of stimulation. (A,B) increased or reduced H3K27Ac; (C,D) uniquely increased or reduced H3K27ac. In this Figure, n > 5/timepoint/strain.
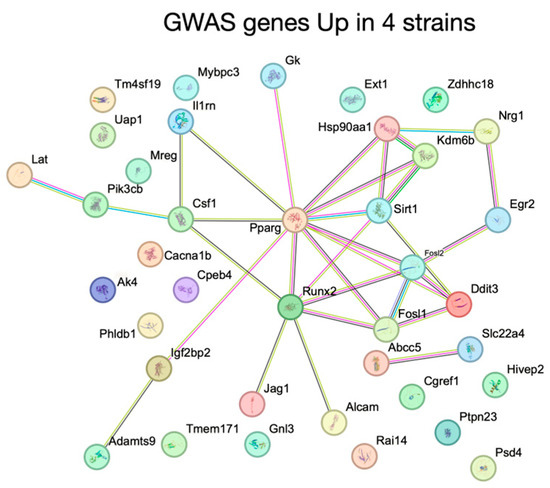 Figure 20. PPARG is a novel transcriptional regulator associated with gout disease susceptibility. Node plot of genes associated with gout susceptibility by GWAS and associated with increased expression assessed by RNA-Seq and increased enhancer activation assessed by H3K27ac ChIP-Seq in C57, BALB, NOD and DBA macrophages showing distinct responses to MSUc after 2 h or 5 h of stimulation.
References
- Hoeksema, M.A.; Shen, Z.; Holtman, I.R.; Zheng, A.; Spann, N.J.; Cobo, I.; Gymrek, M.; Glass, C.K. Mechanisms underlying divergent responses of genetically distinct macrophages to IL-4. Sci. Adv. 2021, 7, eabf9808.
- Major, T.J.; Takei, R.; Matsuo, H.; Leask, M.P.; Sumpter, N.A.; Topless, R.K.; Shirai, Y.; Wang, W.; Cadzow, M.J.; Phipps-Green, A.J.; et al. A genome-wide association analysis reveals new pathogenic pathways in gout. Nat. Genet. 2024, 56, 2392-2406.
16. Exploring the Role of the Gut Microbiome in Gout: Prospective Analysis of Dietary Fiber Intake and the Risk of Gout
- Sharan K. Rai 1,2,3,4, Natalie McCormick 1,2,3,4, Chio Yokose 1,2,3, Robert A. Terkeltaub 5, Dylan Dodd 6,7, Lama Nazzal 8, Huilin Li 9, Gary C. Curhan 2,10,11, Qi Sun 2,10,12,13,† and Hyon K. Choi 1,2,3,4,10,†
- 1
- Division of Rheumatology, Allergy, and Immunology, Massachusetts General Hospital, Boston, MA, USA
- 2
- Department of Medicine, Harvard Medical School, Boston, MA, USA
- 3
- The Mongan Institute, Department of Medicine, Massachusetts General Hospital, Boston, MA, USA
- 4
- Arthritis Research Canada, Vancouver, BC, Canada
- 5
- Division of Rheumatology, Autoimmunity and Inflammation, Department of Medicine, University of California San Diego, La Jolla, CA, USA
- 6
- Department of Pathology, Stanford University School of Medicine, Stanford, CA, USA
- 7
- Department of Microbiology and Immunology, Stanford University School of Medicine, Stanford, CA, USA
- 8
- Division of Nephrology, Department of Medicine, NYU Grossman School of Medicine, New York, NY, USA
- 9
- Division of Biostatistics, Department of Population Health, New York University Grossman School of Medicine, New York, NY, USA
- 10
- Channing Division of Network Medicine, Department of Medicine, Brigham and Women’s Hospital and Harvard Medical School, Boston, MA, USA
- 11
- Division of Renal (Kidney) Medicine, Department of Medicine, Brigham and Women’s Hospital, Harvard Medical School, Boston, MA, USA
- 12
- Department of Nutrition, Harvard T.H. Chan School of Public Health, Boston, MA, USA
- 13
- Department of Epidemiology, Harvard T.H. Chan School of Public Health, Boston, MA, USA
- *
- Correspondence: srai1@mgh.harvard.edu
- †
- Co-senior authors.
- Abstract: Background/Objectives: The role of the gut microbiome has been increasingly implicated in the pathogenesis of gout. For instance, gout patients have shown depletion of bacteria that lower urate levels or produce anti-inflammatory short-chain fatty acids (SCFAs). Dietary fiber is fermented by the gut microbiota and produces beneficial microbial metabolites, including SCFAs [1]. Accordingly, greater dietary fiber (particularly cereal fiber) intake is also associated with lower levels of inflammatory biomarkers [2], which may be particularly relevant to gout. Indeed, prior work has found that a pro-inflammatory diet that is low in dark leafy and yellow vegetables as well as high in refined grains is associated with a nearly two-fold increased risk of gout among women [3]. Taken together, these data suggest that dietary fiber may play a role in gout prevention through the modulation of gut microbiota and the corresponding inflammatory pathway. We aimed to prospectively examine whether long-term dietary fiber intake is associated with the risk of gout among women over 34 years of follow-up. Methods: We analyzed data from 80,175 women in the Nurses’ Health Study with complete dietary data who were free from gout at baseline. We used a validated food frequency questionnaire to collect repeated measures of usual intake of 130+ food and beverage items every four years. We calculated dietary fiber intakes for all participants using the Harvard University Food Composition Database. In addition to total fiber, we calculated individual intakes of fiber sourced from cereals, fruits, vegetables, and legumes. Every two years, we collected updated data on relevant covariates as well as new confirmed cases of incident gout. We used multivariable Cox proportional hazard models to evaluate the associations between quintiles of dietary fiber intake and incident gout. Results: We documented 1117 gout cases over 2,218,527 person-years of follow-up. At baseline, women consuming more total fiber tended to be older (Q1 vs. Q5: 49.3 vs. 53.3 years), be more physically active (Q1 vs. Q5: 10.5 vs. 19.0 metabolic equivalent of task hours/week), and consume less alcohol (Q1 vs. Q5: 11.5 vs. 4.2 g/day). After multivariable adjustment, greater intake of total dietary fiber was associated with a 31% lower risk of incident gout, comparing extreme quintiles (hazard ratio [HR] = 0.69 (95% confidence interval: 0.56 to 0.87); p for trend = 0.001) (Table 6). This protective association was primarily driven by cereal fiber (from food sources such as cold cereals, dark breads (e.g., rye, pumpernickel, wheat, oatmeal, or other whole grain breads), cooked oatmeal, and added bran) (multivariable HR comparing extreme quintiles = 0.61 (0.50 to 0.76); p for trend < 0.001) and fruit fiber (multivariable HR comparing extreme quintiles = 0.81 (0.65 to 1.00); p for trend = 0.009) (Table 6). Conclusion: Long-term dietary intake of fiber, particularly fiber sourced from cereals and fruits, is independently associated with a lower risk of incident gout among women. These findings support a role for fiber in the pathogenesis of gout, potentially by modulating the gut microbiome.
Table 6. Multivariable-adjusted associations between dietary fiber intake and incident gout among women in the Nurses’ Health Study (1984–2018).
References
- Sawicki, C.M.; Livingston, K.A.; Obin, M.; Roberts, S.B.; Chung, M.; McKeown, N.M. Dietary Fiber and the Human Gut Microbiota: Application of Evidence Mapping Methodology. Nutrients 2017, 9, 125. PMID: 28208609.
- Shivakoti, R.; Biggs, M.L.; Djoussé, L.; Durda, P.J.; Kizer, J.R.; Psaty, B.; Reiner, A.P.; Tracy, R.P.; Siscovick, D.; Mukamal, K.J. Intake and Sources of Dietary Fiber, Inflammation, and Cardiovascular Disease in Older US Adults. JAMA Netw Open. 2022, 5, e225012. PMID: 35357453.
- Rai, S.K.; Choi, H.K.; Lu, N.; Yokose, C.; Lin, K.; Lee, D.H.; Tabung, F.K.; McCormick, N. Proinflammatory Dietary Pattern and the Risk of Female Gout: Sex-Specific Findings From Three Prospective Cohort Studies. Arthritis Rheumatol. 2025, 77, 1077–1086. PMID: 39866115.
17. Hospital Burden of Crystal-Related Arthritis in Spain: A Nationwide Dataset of 214,635 Inpatients
- Cristina Rodríguez-Alvear 1, Fernando Borrás 2 and Mariano Andrés 3
- 1
- Rheumatology Section, Virgen de la Peña General Hospital, Fuerteventura, Spain
- 2
- Rheumatology Section, Dr. Balmis General University Hospital, Miguel Hernandez University, Alicante, Spain
- 3
- Statistics, Mathematics and Informatics, Miguel Hernández University, San Juan de Alicante, Spain
- *
- Correspondence: rodriguezalvearcristina@gmail.com
- Abstract: Introduction/Purpose: Gout and calcium pyrophosphate crystal deposition (CPPD) disease are frequent in hospital settings. In Spain, the last available data (2005–2015) indicated that 0.48% of hospital discharges had a gout diagnosis, with rising prevalence and mortality within the period [1]. Conversely, no national studies exist for CPPD disease. We aimed to analyze prevalence, hospital stays, mortality, and costs of inpatients with gout or CPPD disease in Spain between 2016 and 2023. Methods: We audited the Minimum Basic Data Set (MBDS) of the National Health Service for adult patients with coded diagnoses of either primary or secondary gout (ICD-10-ES M10.X or M1A.X) or CPPD disease (M11.X), admitted to public hospitals between 2016 and 2023. Prevalence with 95% confidence intervals (CIs) was calculated over annual discharges. Differences in age, sex, mean stay, mortality, and costs (based on All Patient Refined Diagnosis-Related Groups) were analyzed between patients with gout and CPPD, stratified by being primary or secondary diagnoses. Results: We retrieved 214,635 hospitalizations with gout or CPPD disease over the 2016–2023 period. Gout prevalence was 0.71% (n = 196,643/27,508,613; 95% CI 0.71–0.72%), coded as primary diagnosis in 6030 (3.07%) and secondary in 190,613 (96.93%). Meanwhile, the prevalence of CPPD disease was 0.06% (n = 16,997/27,508,613; 95% CI 0.06–0.06%), mostly as secondary diagnoses (95.21%, n = 16,182). The hospitalizations with gout and CPPD disease increased over the period, in particular as secondary diagnoses (Table 7; Figure 21). A total of 995 patients (0.46%) had both crystal diagnoses. Compared to patients with gout, those with primary or secondary CPPD disease were older (74.5 0± 14.4 vs. 70.9 ± 14.3 years, p < 0.001; 79.9 ± 10.8 vs. 74.9 ± 12.1 years, p < 0.001) with a female predominance (53.4% vs. 16.2%, p < 0.001; 60.1% vs. 16.6%, p < 0.001). The average age steadily increased up to +2.0 years in gout (p = 0.005) and +3.8 years (p = 0.001) in CPPD disease as primary diagnoses during the study period. Mean hospital stay was significantly longer in gout (6.4 ± 6.9 vs. 5.5 ± 5.1 days, p < 0.001). The stay decreased for secondary groups (Gout: −0.95 days, p < 0.001; CPPD disease: −0.32 days, p = 0.001). The intra-hospital mortality rate in cases with primary diagnosis of gout or CPPD disease were 0.7% and 0.1%, respectively (p < 0.001). A similar figure was noted for secondary diagnoses (6.1% vs. 4.9%, p < 0.001). Mortality increased significantly in gout diagnoses (Primary: +0.2%, p = 0.002; Secondary: +1.4%, p < 0.001) and secondary CPPD disease diagnoses (+2.3%, p < 0.001). Costs were similar in gout and CPPD disease-related hospitalizations (3677.11 € vs. 3692.00 €), but higher in the case of secondary diagnoses of gout (5385.08 € vs. 5003.57 €, p < 0.001). In all cases, mean costs increase progressively. Conclusions: The updated nationwide hospital prevalence of gout is higher than earlier reports. The first national CPPD disease data is provided. Despite CPPD disease predominating in older patients and women, hospital stays and intrahospital mortality were notably higher in gout. Hospitalizations, admission ages, costs, and mortality rates progressively increased during the study period. Thus, crystal-related arthritis still carries a significant hospital burden.
Table 7. Annual hospitalization rate per 1000 discharges in Spain according to the MBDS database.
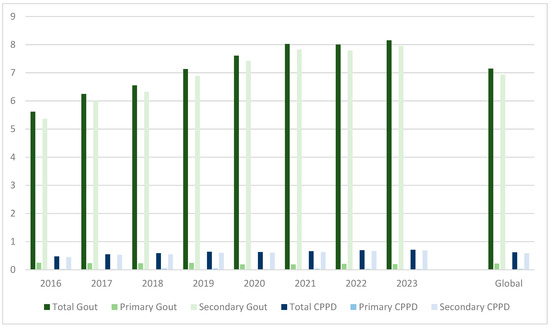 Figure 21. Annual hospitalization rate per 1000 discharges in Spain according to the MBDS database, displayed as a bar chart.
References
- Benavent, D.; Peiteado, D.; Martinez-Huedo, M.Á.; Hernandez-Hurtado, M.; Balsa, A.; de Miguel, E. Healthcare-related impact of gout in hospitalized patients in Spain. Sci. Rep. 2021, 11, 13287.
18. Proteomic Signature in Hyperuricemic People Living with HIV
- Ancuta R. Straton 1,*, Nicholas A. Sumpter 2, Nadira Vadaq 2,3, Jéssica C. dos Santos 2, André J.A.M. van der Ven 2, Tania O. Crisan 1,2 and Leo A.B. Joosten 1,2
- 1
- Department of Medical Genetics, Iuliu Hațieganu University of Medicine and Pharmacy, Cluj-Napoca, Romania
- 2
- Department of Internal Medicine and Research Institute for Medical Innovations (RIMI), Radboud University Medical Center, Nijmegen, The Netherlands
- 3
- Division of Tropical Medicine and Infectious Disease, Department of Internal Medicine, Cipto Mangunkusumo Hospital, Jakarta, Indonesia
- *
- Correspondence: anca.straton1@gmail.com
- Abstract: Background: People living with HIV (PLHIV) under viral remission following treatment with antiretroviral therapy (ART) are exposed to persistent inflammation, which increases their susceptibility to non-AIDS comorbidities, such as cardiovascular disease. Elevated urate concentrations, often associated with inflammation and metabolic dysregulation, may play a key role in exacerbating these conditions and contributing to chronic inflammatory profile. This study investigates the proteomic signature of hyperuricemia in virally suppressed PLHIV. Methods: We analyzed data from 1866 participants enrolled in the 2000HIV cohort, a Dutch multicenter, longitudinal study involving people living with HIV (PLHIV) who are virally suppressed and receiving antiretroviral therapy (ART). The analysis focused on a subset of 1404 individuals of White ethnicity. To account for sex imbalance and treatment-specific effects observed in the cohort, we applied a linear regression model adjusting for sex, body mass index (BMI), and treatment regimen. Rather than relying on categorical thresholds, serum urate concentrations were analyzed as a continuous variable. Biological samples were collected at study entry, with initial laboratory assessments followed by additional analyses of urate and creatinine levels in both plasma and urine. Proteomic profiling was conducted using the Olink® Explore platform, covering 2367 circulating proteins, which were compared between PLHIV with and without hyperuricemia (defined as serum urate ≥ 7 mg/dL). Results: We conducted a proteome-wide analysis of serum urate concentrations across 2367 proteins, identifying 233 differentially expressed proteins (DEPs) using an adjusted p-value threshold of <0.05. Among the most positively associated proteins were N-acetylneuraminate pyruvate lyase (NPL), immunoglobulin superfamily member 9 (IGSF9), and oxytocin (OXT), while Erb-B2 receptor tyrosine kinase 4 (ERBB4), paraoxonase 3 (PON3), and uromodulin (UMOD) showed the strongest negative associations (Figure 22). To replicate our findings, we applied a similar analytical model to the UK Biobank cohort, which has a substantially larger sample size. The increased statistical power resulted in a greater number of significant DEPs, supporting the robustness of our initial findings (Figure 23). To assess consistency, we compared effect estimates across cohorts in a scatter plot, yielding a Spearman correlation coefficient of 0.7. This strong concordance reinforces the reproducibility and biological relevance of the observed protein–urate associations (Figure 24). Conclusion: This proteomics-based study reveals a distinct urate-related molecular profile in individuals living with HIV, implicating broader systemic pathways beyond traditional associations with gout. The identification of 233 urate-associated proteins and their replication in the UK Biobank (Spearman r = 0.7) underscores the strength and reliability of our findings. These results point to a potential role for urate in immune regulation and chronic inflammation. Although limited by a cross-sectional design and single time-point measurements, our findings offer a valuable foundation for future investigations into urate as a biomarker or therapeutic target in related inflammatory conditions.
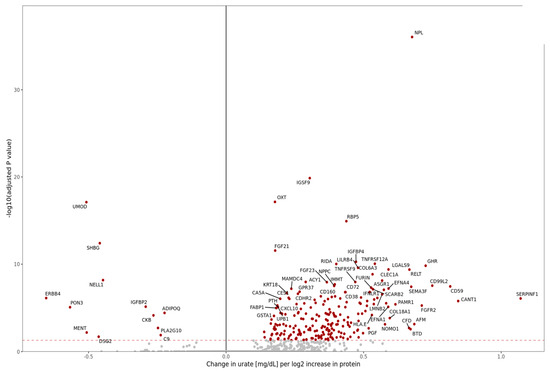 Figure 22. Serum proteomic signatures of hyperuricemia vs. normouricemia in the 2000HIV cohort.
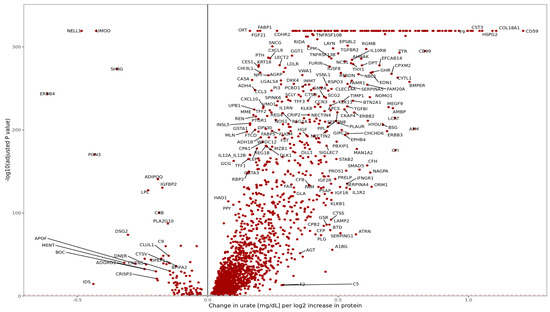 Figure 23. Serum proteomic signatures of hyperuricemia vs. normouricemia in the UK Biobank.
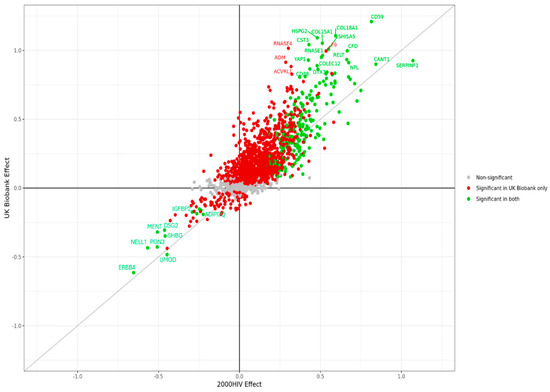 Figure 24. Comparing effects between cohorts.
19. Genetic Analysis of the Synergistic Cytokine Response of Monosodium Urate Crystals and Palmitate Identifies a New Role for the SFMBT1 Locus
- Nicholas A Sumpter 1,*, Riku Takei 2, Tony R Merriman 2, Mihai Netea 1, Tania O Crisan 3 and Leo A B Joosten 1,3
- 1
- Department of Internal Medicine, Radboud University Medical Center, Nijmegen, Netherlands
- 2
- Division of Clinical Immunology and Rheumatology, Department of Medicine, University of Alabama at Birmingham, Birmingham, Alabama, USA
- 3
- Department of Medical Genetics, Iuliu Hatieganu University of Medicine and Pharmacy, Cluj-Napoca, Romania
- *
- Correspondence: nicholas.sumpter@radboudumc.nl
- Abstract: Introduction: Gout flares are characterized by an inflammatory response to monosodium urate crystals (MSUc) that occurs via activation of the NLRP3 inflammasome, with the crystals contributing the second signal for activation of caspase-1 and release of IL-1β. Stimulation assays in human peripheral blood mononuclear cells (PBMCs) have found that crystals synergize with TLR agonists to drive the release of IL-1β. Here, we utilized large cohort data (Ntotal = 1301) to investigate this synergistic response, with a subset of the data (N = 149) being used to test the role of common genetic variation in this response. Methods: We used the 24 h PBMC stimulation assay results from 7 cohorts (200FG 2011, 200FG 2017, 300DM, 300OB, HINT Control, HINT Gout, and HINT Hyperuricemic Control; N = 138, 152, 234, 302, 269, 137, and 69 respectively). Stimulations of interest were RPMI (control), C16:0 fatty acid (palmitate, a TLR2 agonist), MSUc, and MSUc + C16. Cytokines of interest were IL-1β, IL-6, TNF, and IL-1RA. For each cohort, we calculated the synergistic response as the ratio of IL-1β production upon MSUc + C16 stimulation compared to C16 alone. A genome-wide association study (GWAS) of this ratio was performed in the 200FG 2017 cohort (N = 149), adjusting for age, sex, lymphocyte: monocyte ratio, and stimulation batch. Follow-up eQTL analyses were performed using the GTEx and eQTLgen databases. Results: We found evidence of synergy between MSUc and C16 fatty acid in all cohorts for both IL-1β and IL-6 production (Figure 25). We found no genome-wide significant associations with the IL-1β synergistic response. When using a suggestive significance threshold (p < 10−5), we identified 19 loci. The most significant association was for the rs6445559 variant at the SFMBT1 locus (Figure 26; p = 4.4 × 10⁻⁷), with the same variant having previously been associated with gout and urate (Pgout = 3.0 × 10−76; Purate = 4.0 × 10−87). The urate-raising and gout risk allele (A) was associated with increased synergistic response to MSUc. Interestingly, the variant was not associated with IL-1β production upon MSUc + C16 stimulation (p = 0.81), only associating with the synergistic response compared to C16 alone. The variant is associated with expression of several genes in various tissues (Table 8), for example, the urate-raising and gout risk allele associated with reduced expression of SFMBT1. Conclusion: This study provides further evidence that MSUc robustly synergizes with the TLR2 agonist C16 fatty acid to activate the NLRP3 inflammasome and release mature IL-1β in primary human cells. This synergy is dependent on the genetics of the individual. The genetic analysis identified the SFMBT1 locus as important for follow-up analyses, suggesting a complex pleiotropic role of this genetic region in gout. Though it is possible that the role of the variant in urate regulation is influencing the response to MSUc, it is likely that there are other pleiotropic effects of this variant, and it suggests that other urate-associated variants could be further investigated for roles in gouty inflammation.
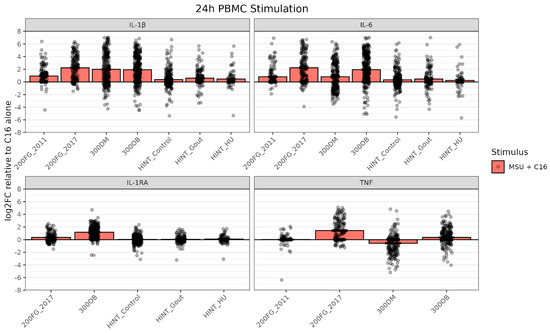 Figure 25. Synergy of MSUc + C16 co-stimulation compared to C16 alone.
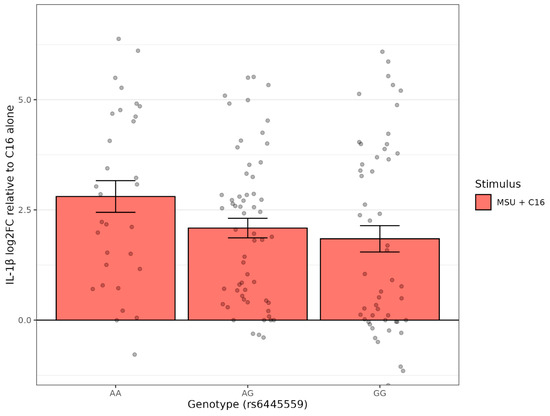 Figure 26. Association of the SFMBT1 locus SNP rs6445559 with synergistic response in the 200FG 2017 cohort. The AA genotype was required for maximal synergy.
Table 8. Table of candidate genes at the SFMBT1 locus identified by eQTL analysis. Direction = direction of gene expression change with gout risk allele. HPA = human protein atlas. ER = endoplasmic reticulum.
Figure 26. Association of the SFMBT1 locus SNP rs6445559 with synergistic response in the 200FG 2017 cohort. The AA genotype was required for maximal synergy.
Table 8. Table of candidate genes at the SFMBT1 locus identified by eQTL analysis. Direction = direction of gene expression change with gout risk allele. HPA = human protein atlas. ER = endoplasmic reticulum.
20. Updated Case Definition of Calcium Pyrophosphate Deposition (CPPD) Disease Identifies Novel Genetic Loci in the MVP Cohort
- Riku Takei 1,2, Ann Rosenthal 3,4, Tristan Pascart 5, Richard Reynolds 1,2, Tuhina Neogi 6, Robert Terkeltaub 7, Sara Tedeschi 8 and Tony Merriman 1,2,9
- 1
- Birmingham Department of Veterans Affairs Health Care System, Birmingham, AL, USA
- 2
- Division of Clinical Immunology and Rheumatology, Department of Medicine, University of Alabama at Birmingham, Birmingham, AL, USA
- 3
- Medical College of Wisconsin, Milwaukee, WI, USA
- 4
- Zablocki Veterans Affairs Medical Center, Milwaukee, WI, USA
- 5
- Department of Rheumatology, Lille Catholic University, Saint-Philibert Hospital, Lille, France
- 6
- Section of Rheumatology, Boston University Chobanian & Avedisian School of Medicine, Boston, MA, USA
- 7
- Division of Rheumatology, Autoimmunity and Inflammation, UC San Diego, La Jolla, CA, USA
- 8
- Division of Rheumatology, Inflammation and Immunity, Brigham and Women’s Hospital and Harvard Medical School, Boston, MA, USA
- 9
- Department of Microbiology and Immunology, University of Otago, Dunedin, New Zealand
- Abstract: Background: A previous genome-wide association study (GWAS) of chondrocalcinosis (CC) in the Veterans Affairs (VA) Million Veteran Program (MVP) cohort revealed two genetic loci, ENPP1 and RNF144B, in European (EUR) and African (AFR) ancestries [1]. CC had been defined based on Phecode 274.21 with ≥2 matching ICD codes (536 and 2468 cases in AFR and EUR, respectively), the sensitivity of which is unknown. Objective: Investigate the genetic association of CPPD disease in AFR, Admixed American (AMR), and EUR ancestries in the MVP cohort using a previously-published algorithm [2] to identify symptomatic CPPD in a VA dataset (positive predictive value 91% for CPPD), including sex-specific analyses. Methodology: The phenotype of MVP participants was accessed through VA Informatics and Computing Infrastructure (Table 9). CPPD disease cases were defined by ≥1 of the following ICD9/10 codes [2]: 712.1 (Chondrocalcinosis due to dicalcium phosphate crystals), 712.2 (Chondrocalcinosis due to pyrophosphate crystals), 712.3 (Chondrocalcinosis cause unspecified), 275.49 (Other disorders of calcium metabolism), M11.1 (Familial chondrocalcinosis), M11.2 (Other chondrocalcinosis), E83.59 (Disorders of calcium metabolism, unspecified). Of these ICD codes, 275.49 and E83.59 are not included in Phecode 274.21. Genetic ancestry was determined using previous classification [3]. GWAS was conducted using REGENIE [4], adjusted by sex, age, and the first 10 genetic principal components. Results: We identified >10,000 CPPD disease cases in the MVP. Previously identified ENPP1 and RNF144B loci were replicated in the combined sexes and male-specific AFR and EUR analyses, and only RNF144B was genome-wide significant in the male-specific AMR analysis. There was no genome-wide significant association in the female-specific analyses in all ancestries. New genetic loci associated with CPPD were identified in combined sexes and male-specific AFR (1 locus) and EUR ancestry (3 loci) (p ≤ 5 × 10⁻⁸) (Table 10). The three new EUR loci were at MUC1/TRIM46, CARMIL1, and IL11, and the AFR locus was at ARSL. While there was no significant signal at the ANKH or TNFRSF11B loci, there was a suggestive signal at the ANKH locus in EUR at the OTULIN gene (Figure 27). While not genome-wide significant, there was a second signal at this locus above ANKH (rs826355) that associates with the expression and splicing of ANKH. Conclusions: CPPD diagnosis codes identified more cases than did Phecodes for the radiographic finding of CC, resulting in the identification of novel genetic loci associated with symptomatic CPPD in the MVP. Of note, the MUC1/TRIM46 locus has previously been identified as a gout locus; the ARSL (encodes arylsulfatase E) locus is AFR specific (rs5982943 1000 Genomes [5] MAFAFR = 0.458 and MAFEUR = 0.003) and also found in male-specific AFR analysis, and is a causal gene of chondrodysplasia punctate, X-linked recessive; and the lead variant at the IL11 locus (rs4252548) is a missense variant (R112H) that has been implicated in osteoarthritis. This is the first GWAS of symptomatic CPPD with sex-stratified analysis and findings from this study will need to be replicated in other cohorts.
Table 9. Sample sizes of European, African, and Admixed American ancestry cohorts.
Table 10. Genome-wide significant lead variants from the loci identified from the combined sexes African and European ancestry GWAS.
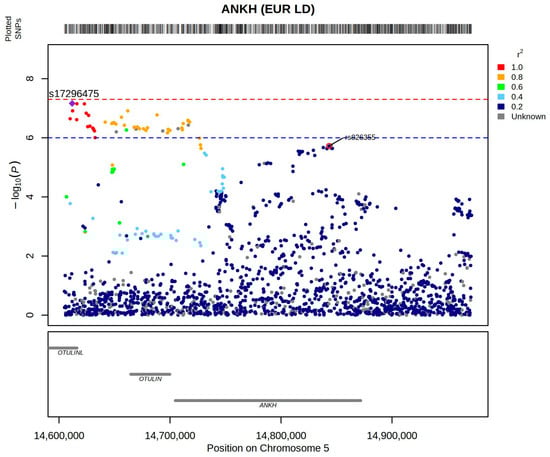 Figure 27. LocusZoom plot of the ANKH locus in combined sexes, European ancestry GWAS. Each point represents a genetic variant and the color represents the linkage disequilibrium (calculated using PLINK with 1000 Genomes Project EUR data) with the lead variant (purple diamond). rs826355 (red circle) is highlighted to show the position of the variant in relation to the ANKH gene. The y-axis is the negative log10 of the p-value, and the x-axis is the genomic position. The plot was generated using a modified “locuszoom” code using R version 4.3.1.
References
- Takei, R.; Rosenthal, A.; Pascart, T.; Reynolds, R.J.; Tedeschi, S.K.; Merriman, T.R. Genome-wide association study in chondrocalcinosis reveals ENPP1 as a candidate therapeutic target in calcium pyrophosphate deposition disease. medRxiv 2024, 2024.10.10.24315203. https://doi.org/10.1101/2024.10.10.24315203.
- Bartels, C.M.; Singh, J.A.; Parperis, K.; Huber, K.; Rosenthal, A.K. Validation of Administrative Codes for Calcium Pyrophosphate Deposition: A Veterans Administration Study. J. Clin. Rheumatol. 2015, 21, 189–192.
- Verma, A.; Huffman, J.E.; Rodriguez, A.; Conery, M.; Liu, M.; Ho, Y.L.; Kim, Y.; Heise, D.A.; Guare, L.; Panickan, V.A.; et al. Diversity and scale: Genetic architecture of 2068 traits in the VA Million Veteran Program. Science 2024, 385, eadj1182.
- Mbatchou, J.; Barnard, L.; Backman, J.; Marcketta, A.; Kosmicki, J.A.; Ziyatdinov, A.; Benner, C.; O’Dushlaine, C.; Barber, M.; Boutkov, B.; et al. Computationally efficient whole-genome regression for quantitative and binary traits. Nat. Genet. 2021, 53, 1097–1103.
- 1000 Genomes Project Consortium; Auton, A.; Brooks, L.D.; Durbin, R.M.; Garrison, E.P.; Kang, H.M.; Korbel, J.O.; Marchini, J.L.; McCarthy, S.; McVean, G.A.; et al. A global reference for human genetic variation. Nature 2015, 526, 68–74.
21. MSU Crystal Exposure Is Associated with Limited Transcriptional Changes in Human Primary PBMCs
- Valentin Nica 1, Orsolya Gaal 1,2, Medeea Badii 1,2, Georgiana Cabău 1, Maartje Cleophas 2, Andreea-Manuela Mirea 1, Ioana Hotea 3, HINT Consortium, Cristina Pamfil 3, Simona Rednic 3, Radu A. Popp 1, Yang Li 2,4,5, Tania O. Crișan 1,2 and Leo A.B. Joosten 1,2
- 1
- Department of Medical Genetics, UMF “Iuliu Hatieganu”, Cluj-Napoca, Romania
- 2
- Department of Internal Medicine, Radboud University Nijmegen Medical Center, Nijmegen, The Netherlands
- 3
- Department of Rheumatology, UMF “Iuliu Hatieganu”, Cluj-Napoca, Romania
- 4
- Department of Computational Biology for Individualised Medicine, Centre for Individualised Infection Medicine (CiiM), Hannover, Germany
- 5
- TWINCORE, a joint venture between the Helmholtz-Centre for Infection Research (HZI) and Hannover Medical School (MHH), Hannover, Germany
- Abstract: Introduction: Monosodium urate (MSU) crystals are the cause of gout and are formed when the serum concentration of urate reaches a saturation point. The literature on MSU crystals and inflammatory changes is mixed, with reports ranging from very limited inflammatory effects to substantial reprogramming induced by MSU crystals alone. This type of variability can, in part, be due to experimental conditions, cell types and organism studied. In this study, we examine the IL-1β production patterns and the transcriptomic signature in response to MSU crystals in freshly isolated primary human peripheral blood mononuclear cells (PBMCs). Materials and Methods: PBMCs were isolated by density gradient centrifugation and were stimulated for 24 h with palmitate (C16) 50 μM in the presence or absence of 300 μg/mL MSU crystals. Cytokine production was measured in 2 independent cohorts using ELISA: controls (181 and 132 subjects) and patients with gout (123 and 148 subjects). Two bulk RNA-sequencing analyses were performed independently. Following the same experimental conditions as previously described, cells were stored in TRIzol. The first analysis included a discovery (n = 4) and a replication experiment (n = 3) using PBMCs of patients with gout stimulated with medium control, C16 and LPS (10 ng/mL) in the presence or absence of MSU crystals. The second analysis included PBMCs from four healthy donors, using the C16 and MSU crystals under experimental conditions. Results: MSU crystals alone induced a small but significant increase in IL-1β production in human PBMCs. IL-1β production was significantly increased when PBMCs were stimulated with C16 and this was further amplified by the C16-MSU crystals combination. Interestingly, C16 and LPS induced a similar transcriptomic signature. MSU crystals alone or in combination with other stimuli caused no significant transcriptomic alterations. Conclusions: We confirm in several large cohorts that MSU crystals have a synergistic effect with C16 that leads to higher IL-1β production, an effect that was previously documented. While in most cases MSU crystals did not induce IL-1β production on their own, there are statistically significant differences suggesting that, in a minority of individuals, MSU crystals do induce IL-1β release. The transcriptomic analysis shows that the MSU crystal-induced IL-1β production in human PBMCs is not associated with major transcriptional changes. This suggests that, in primary human PBMCs, the production of IL-1β in response to MSU crystals may largely be regulated at the post-transcriptional level, with MSU crystals potentially leading to rapid pro-IL-1β synthesis and secretion.
22. The Effect of Prophylactic Colchicine Use on Gene Expression in Gout
- Austin M. Wheeler 1,2, Guanqi Lu 3, Ana I. Vazquez 3, Jeff Edberg 3, Angelo Gaffo 3, Tate M. Johnson 1,2, Michael J. Duryee 1,2, James R. O’Dell 1,2, Jeff Newcomb 1,2, Michael Pillinger 4, Robert Terkeltaub 5, Ryan Ferguson 6,7, Mary Brophy 6,8, Tuhina Neogi 7, Bryant R. England 1,2, Ted R. Mikuls 1,2, Tony R. Merriman 9 and Richard J. Reynolds 9
- 1
- VA Nebraska-Western Iowa Healthcare System, Omaha, NE, USA
- 2
- University of Nebraska Medical Center, Omaha, NE, USA
- 3
- Michigan State University, East Lansing, MI, USA
- 4
- VA New York Harbor Health Care System, New York, NY, USA
- 5
- University of California San Diego, San Diego, CA, USA
- 6
- VA Boston Cooperative Studies Program Coordinating Center, Boston, MA, USA
- 7
- Boston University School of Medicine, Boston, MA, USA
- 8
- School of Medicine, VA Boston Health Care System, Boston University, Boston, MA, USA
- 9
- University of Alabama at Birmingham, Birmingham, AL, USA
- Abstract: Background/Purpose: Colchicine is recommended for the treatment and prophylaxis of gout flares and approved for secondary prevention of ischemic cardiovascular disease (CVD). While its primary anti-inflammatory mechanism is thought to be tubulin disruption, other biological pathways are likely impacted. This study evaluated the effect of prophylactic colchicine on gene expression among individuals with gout enrolled in the STOP Gout clinical trial [1]. Methods: STOP Gout participants (N = 940) met classification criteria for gout, were randomized to treat-to-target allopurinol or febuxostat, and received anti-inflammatory prophylaxis (90% colchicine). Prophylaxis was stopped at 24 weeks but could be continued up to week 48 if desired or clinically indicated. This study was limited to those with whole blood RNA PaxGene (BD Biosciences) tube samples at 24 and/or 48 weeks (N = 259). Those identified as in active flare or with a 0–10 pain score > 3 at the time of lab draw were excluded (N = 45). Sequencing libraries were prepared from extracted RNA using Illumina Stranded Total RNA Prep with Ribo-Zero™ Plus rRNA Depletion + Globin Reduction. Sequence reads were aligned and counted via STAR aligner software v2.7.0. Normalized counts were generated using DESeq2. Differential expression was evaluated using mixed effects negative binomial regression with subject-specific random intercepts accounting for repeated measures in the GLMMseq package (R 4.4.1). For each gene, hypothesis tests of fixed effects were made for colchicine use status, timepoint, and colchicine–time interaction. Genes were filtered for false discovery rate-adjusted p-value < 0.1, |log2 fold change| > 0.2, and absence of time interaction. Results: Of 214 participants included, 165 had samples at one timepoint and 49 at both (total 263 samples). At 24 weeks, 98 of 132 samples (74.2%) were on colchicine, whereas 33 of 131 (25.1%) were on colchicine at 48 weeks. There were 29 genes associated with colchicine use (Figure 28; 16 under-expressed and 13 overexpressed). Nineteen had a described function on NIH Gene or literature review and were descriptively classified, most commonly as related to innate immunity (Table 11). Delta hemoglobin (HBD) was suppressed on colchicine, consistent with its known potential for anemia. Long non-coding RNA LINC02470, described as a correlate of transforming growth factor (TGF)-β-mediated inhibition of the innate immune response, was the most overexpressed gene on colchicine. SLC2A5, a requisite gene in dietary fructose-induced hypertension, and TNNT1, a troponin subunit that regulates myocardial contraction, were under-expressed on colchicine. Conclusion: This study identifies potential mechanisms underlying the systemic impact of colchicine in individuals with gout. The most overexpressed gene, LINC02470, is a novel finding in gout but has been shown to correlate with innate immune inhibition and is also in close proximity to CLEC12A, which is known to bind monosodium urate crystals and suppress immune response. SLC2A5 is essential for fructose-induced hypertension, and its reduced expression with colchicine suggests one potential link to CVD risk reduction.
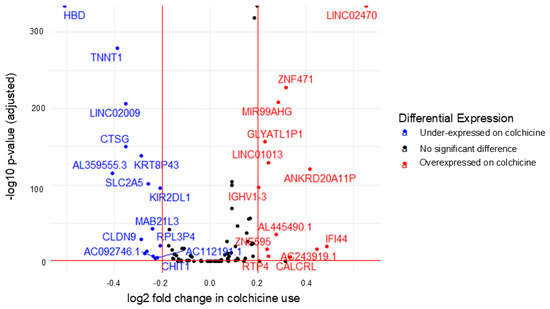 Figure 28. Gene expression differences by colchicine use among STOP Gout participants at 24 and 48 weeks. Cut-offs for significance defined as absolute log2 fold change > 0.2 and adjusted p-value < 0.1.
Table 11. Description of genes differentially expressed on colchicine with functional classification.
Figure 28. Gene expression differences by colchicine use among STOP Gout participants at 24 and 48 weeks. Cut-offs for significance defined as absolute log2 fold change > 0.2 and adjusted p-value < 0.1.
Table 11. Description of genes differentially expressed on colchicine with functional classification.
References
- O’Dell, J.R.; Brophy, M.T.; Pillinger, M.H.; Neogi, T.; Palevsky, P.M.; Wu, H.; Davis-Karim, A.; Newcomb, J.A.; Ferguson, R.; Pittman, D.; et al. Comparative Effectiveness of Allopurinol and Febuxostat in Gout Management. NEJM Evid. 2022, 1, evidoa2100028. https://doi.org/10.1056/evidoa2100028.
23. TREM2 Deficiency Ameliorates Hyperuricemic Nephropathy by Inhibiting Rap1-Mediated Macrophage Migration
- Mian Wu 1, Yu Zhao 1 and Haibing Chen 2
- 1
- Department of Endocrinology and Metabolism, The Affiliated Suzhou Hospital of Nanjing Medical University, Suzhou Municipal Hospital, Suzhou, China
- 2
- Department of Endocrinology andMetabolism, Shanghai 10th People’s Hospital, School of Medicine Tongji University, Shanghai, China
- Abstract: Hyperuricemic nephropathy (HN) is a global metabolic disorder characterized by dysfunction in urate metabolism. Urate crystals activate the innate immune system and trigger the release of pro-inflammatory factors, leading to renal tubulointerstitial damage and deterioration of renal function. However, the mechanisms by which urate regulates the immune system remain incompletely elucidated. In this study, we identified a subset of macrophages characterized by high expression of trigger receptor expressed on myeloid cells 2 (Trems) in a rat HN model (Figure 29). Serum soluble TREM2 (sTREM2) levels were significantly elevated in hyperuricemic patients and correlated with kidney function parameters. Macrophage-specific Trem2 knockout improved renal function and reduced macrophage infiltration and renal inflammation in HN mice (Figure 30). Mechanistically, Trem2 knockdown in immortalized bone marrow-derived macrophages (BMDMs) impaired migratory capacity and suppressed polarization toward the M1 phenotype. Transcriptomic analysis revealed that Trem2 deletion downregulated the Rap1 signaling pathway, which coordinates cytoskeletal reorganization to drive cell migration (Figure 31). Our findings expand the understanding of macrophage-related inflammation in HN and reveal TREM2 as a critical regulator of macrophage function that may provide a potential therapeutic target for HN.
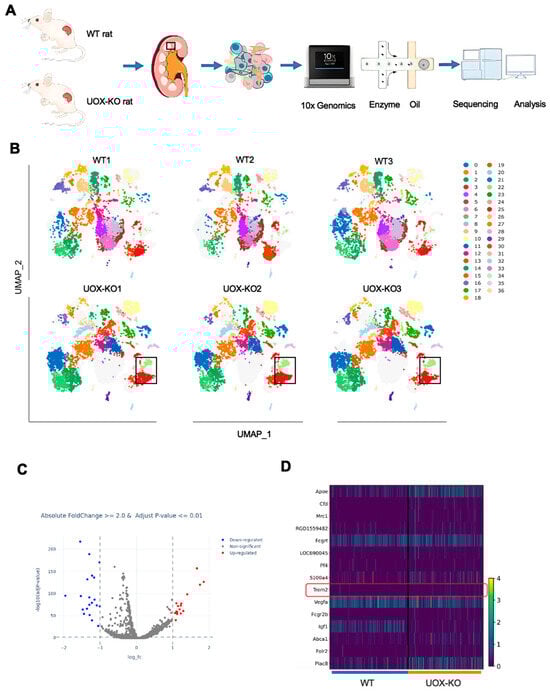 Figure 29. TREM2 was specifically enriched in macrophages in the kidney of UOX-KO rats based on scRNA-seq. (A) Animal experimental workflow; (B) single-cell RNA sequencing; (C) volcano plot showing number of over- and under-expressed genes; (D) expression of specific genes in WT vs. Uox-KO.
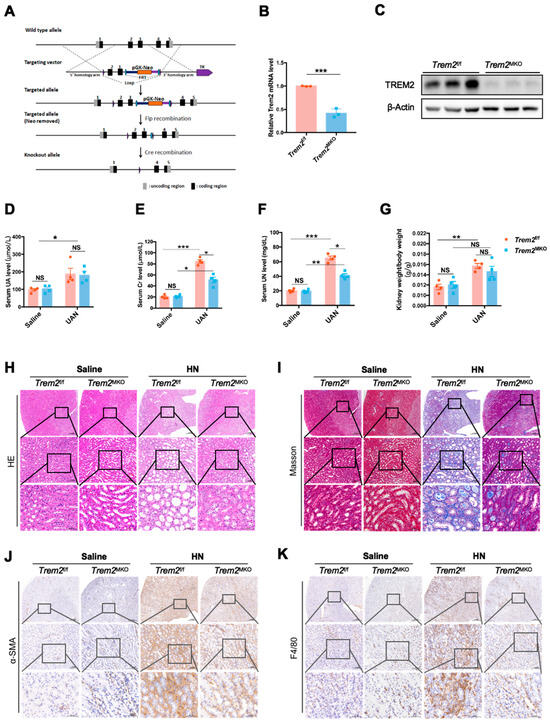 Figure 30. Macrophage-specific Trem2 knockout improved renal function and reduced macrophage infiltration and renal inflammation in HN mice. (A) Trem2 knockout strategy; (B,C) Trem2 expression in WT and KO mice; (D–G) biochemical analysis in WT and KO mice; (H–K) histological analysis of WT and KO mice.
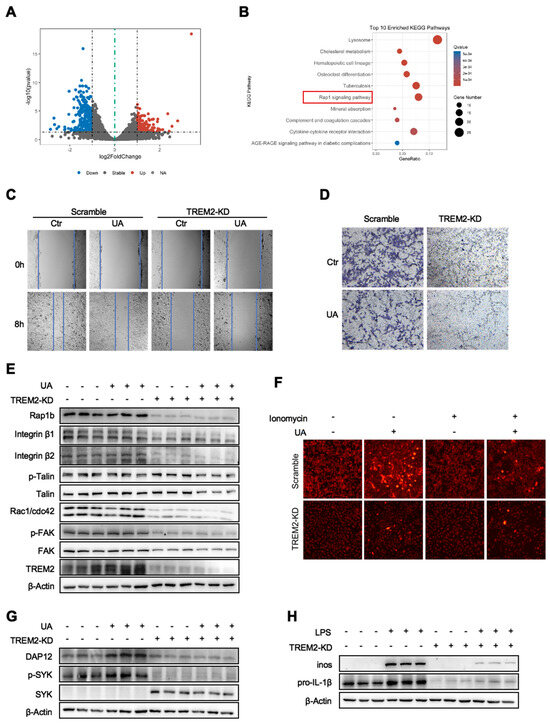 Figure 31. TREM2 deletion downregulated the Rap1 signaling pathway, which coordinates cytoskeletal reorganization to drive cell migration. (A) Volcano plot showing number of over- and under-expressed genes in WT and KO mice; (B) enriched pathways in WT vs. KO mice; (C,D) knockdown of Trem2 in immortalized BMDMs; (E,G) expression of macrophage proteins in BMDMs with and without Trem2 knockdown with and without exposure to urate; (F,H) expression of macrophage proteins in BMDMs with and without Trem2 knockdown with and without exposure to LPS.
24. Characteristics of Gout Flares over Time with Treat-to-Target Urate-Lowering Therapy Use
- Jason D. Yang 1,*, Ted R. Mikuls 2,3, Harlan Sayles 4, Michael H. Pillinger 5,6, Jeff A. Newcomb 2,3, Bridget Kramer 2,3, Anne Davis-Karim 7, Mary T. Brophy 8,9, Ryan Ferguson 8, Paul M. Palevsky 10,11, James R. O’Dell 2,3 and Tuhina Neogi 1
- 1
- Boston University School of Medicine, Boston, MA, USA
- 2
- Veterans Affairs (VA) Nebraska-Western Iowa Health Care System, Omaha, NE, USA
- 3
- Department of Internal Medicine, University of Nebraska Medical Center, Omaha, NE, USA
- 4
- Department of Biostatistics, University of Nebraska Medical Center, Omaha, NE, USA
- 5
- VA New York Harbor Health Care System, New York, NY, USA
- 6
- NYU Grossman School of Medicine, New York, NY, USA
- 7
- VA Cooperative Studies Program Clinical Research Pharmacy Coordinating Center, Albuquerque, NM, USA
- 8
- VA Boston Cooperative Studies Program Coordinating Center, Boston, MA, USA
- 9
- Boston University School of Medicine, VA Boston Health Care System, Boston, MA, USA
- 10
- VA Pittsburgh Health Care System, Pittsburgh, PA, USA
- 11
- University of Pittsburgh School of Medicine, Pittsburgh, PA, USA
- *
- Correspondence: Jason.Yang@bmc.org
- Abstract: Background: Gout flares are an important treatment outcome in gout. Although flares are typically assessed by occurrence (yes/no) or a simple count in trials of urate-lowering therapy (ULT), it is possible that certain flare characteristics could also serve as a measure of ULT efficacy. We evaluated gout flare characteristics among trial participants who were started on treat-to-target ULT and assessed the extent to which achievement of the serum urate (SU) goal impacted flare characteristics. Methods: We performed a post-hoc analysis of the STOP Gout trial, a non-inferiority, randomized, double-blind, placebo-controlled trial of allopurinol vs. febuxostat [1]. In Phase 1 (0–24 weeks), ULT dose was adjusted to achieve SU goal (i.e., <6 mg/dL or <5 mg/dL with tophi) and prophylaxis was provided (NSAIDs, colchicine, glucocorticoids). In Phase 2 (25–48 weeks), a single ULT dose adjustment was allowed to achieve the SU goal. Prophylaxis was discontinued prior to Phase 3 (49–72 weeks). Flares were identified throughout the trial using a modification of validated criteria. Flare characteristics were assessed as pain intensity, number of joints involved, and duration. For those experiencing a flare during all 3 study Phases, characteristics of the first flare in each Phase were compared via generalized linear mixed models with random effects for participants. We next compared characteristics of the first flare in Phase 3 (when participants were off prophylaxis) based upon SU goal achievement at the end of Phase 2. We repeated these analyses, limiting to those without baseline tophi, because the flare criteria may be less sensitive in those with tophi. Results: Of the 940 STOP Gout participants, 602 (64%) had ≥1 flare during the 72-week study (99% male, mean baseline SU 8.6 mg/dL, 19% with tophi). Flare characteristics were similar across the 3 Phases among the 113 participants with ≥1 flare in each of Phase 1–3 (Figure 32); these results did not change after excluding those with tophi (not shown). Of 835 participants with SU measured at the end of Phase 2, 239/648 (37%) who achieved the SU goal and 61/187 (33%) who did not achieve the SU goal had ≥1 flare in Phase 3. Flares in those who achieved the SU goal had significantly lower mean pain intensity, but similar durations and number of joints involved than in those who did not (Figure 33). Among those without baseline tophi, both flare pain intensity and symptom duration were significantly lower with SU goal achievement (vs. not) (Figure 33). Conclusion: In those who experienced ≥1 flare in all three study phases, the flare characteristics did not change meaningfully over time. However, achievement of the SU goal was associated with significantly lower pain intensity and shorter symptom duration among those without tophi. With prior reports suggesting that ≥2 years of oral ULT may be required to meaningfully reduce flare counts, these results suggest that the inclusion of flare characteristics such as pain intensity and symptom duration into trial outcomes could potentially provide insights into the efficacy of ULT in a shorter amount of time than conventional studies utilizing flare counts as the outcome.
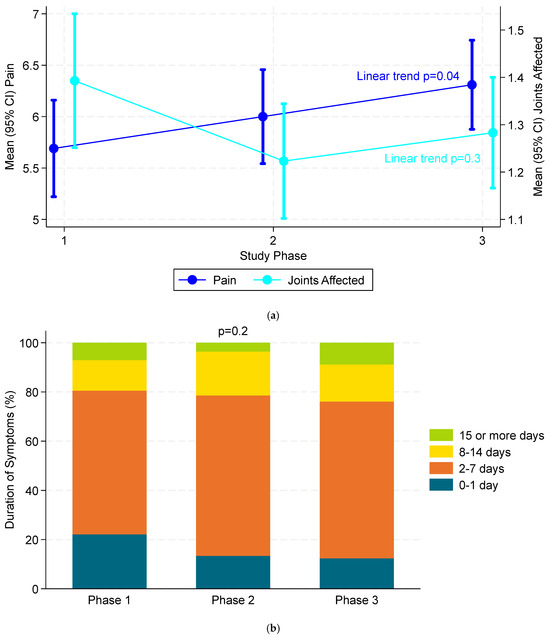 Figure 32. (a) Mean pain intensity and mean of joints involved for the 1st flare within each phase in those who experienced ≥1 flare in all three phases (n = 113). (b) Duration of flare symptoms for the 1st flare within each phase in those who experienced ≥1 flare in all three phases (n = 113).
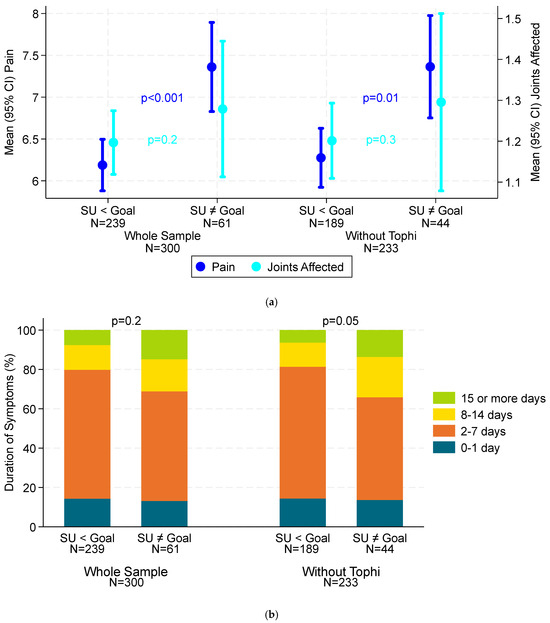 Figure 33. (a) Comparison of mean pain intensity and mean of joints affected for the 1st flare in Phase 3 based on SU goal achievement in the whole sample (n = 300) and in those without baseline tophi (n = 233). (b) Comparison of duration of flare symptoms for the 1st flare in Phase 3 based on SU goal achievement in the whole sample (n = 300) and in those without baseline tophi (n = 233).
References
- Helget, L.N.; England, B.R.; Roul, P.; Sayles, H.; Petro, A.D.; Neogi, T.; O’Dell, J.R.; Mikuls, T.R. Cause-Specific Mortality in Patients with Gout in the US Veterans Health Administration: A Matched Cohort Study. Arthritis Care Res. 2023, 75, 808–816.
Conflicts of Interest
The authors declare no conflict of interest.


Disclaimer/Publisher’s Note: The statements, opinions and data contained in all publications are solely those of the individual author(s) and contributor(s) and not of MDPI and/or the editor(s). MDPI and/or the editor(s) disclaim responsibility for any injury to people or property resulting from any ideas, methods, instructions or products referred to in the content. |
© 2026 by the author. Published by MDPI on behalf of the Gout, Hyperuricemia and Crystal Associated Disease Network. Licensee MDPI, Basel, Switzerland. This article is an open access article distributed under the terms and conditions of the Creative Commons Attribution (CC BY) license.