Abstract
Fumarate, succinate, maleate, dihydroxyfumarate, D–tartarate, L–tartarate, DL–tartarate, L-malate, D-malate, oxaloacetate, citrate, and DL-isocitrate in the 5–100 μM concentration range were incubated in 12.5 mM HEPES/25 mM TRIS base containing 200 μM Eu3+–tetracycline and 60% (v/v) formamide (pH unadjusted). After 30 min of incubation, they were separated at 4 °C by capillary electrophoresis utilizing laser-induced luminescence detection with 12.5 mM HEPES/25 mM TRIS base containing 60% formamide as the running buffer. All analytes yielded peaks, with the exception of fumarate, succinate, and maleate. L-Malate was detected down to 100 nM. The main component of this study was the analysis of malate. The objective was to develop a stereoselective methodology for the detection of L-malate. This was achieved by varying the formamide concentration and separation temperature. When the temperature was increased to 22 °C and the formamide concentration decreased to 40%, the sensitivity for L-malate was diminished about 10-fold, but that for D-malate was eliminated. This combination of conditions allowed for the stereospecific analysis of L-malate.
1. Introduction
Succinate (1,4-butanedioate) is an intermediate in Kreb’s cycle. Derivatives of this compound include fumarate, L-malate, and oxaloacetate, all of which are also Kreb’s metabolites. Malate exists in both the L- and D-isomers. Other derivatives of succinate include maleate, dihydroxyfumarate, and tartarate. The latter has two chiral centers and exists in the D-, L-, and meso isoforms. Two tricarboxylic acids are also Kreb’s cycle intermediates: citrate and DL-isocitrate (Figure 1).
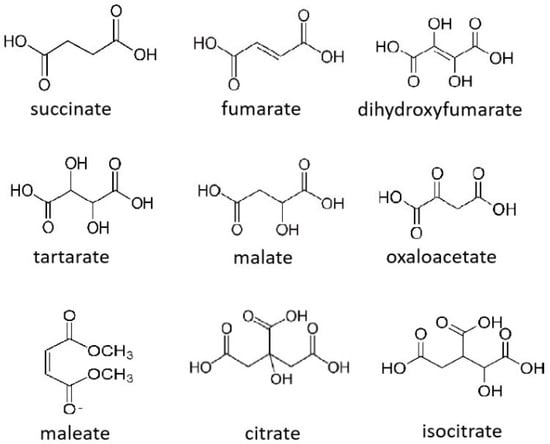
Figure 1.
Structures of succinate and its derivatives, citrate, and isocitrate.
Of the two stereoisomers of malate, L-malate is the predominantly naturally existing form, although D-malate has also been found to be metabolically active [,]. In addition to Kreb’s cycle, L-malate is an important metabolite in the Calvin cycle as well as in anapleurotic reactions. Commercially, it is widely used in processed food, metal cleaning, textile finishing, pharmaceuticals, cosmetics, and chemical syntheses [].
L-Malate has been detected using a coupled enzyme assay. In the presence of malate dehydrogenase and NAD+, it is converted into oxaloacetate and NADH. The NADH is then used by the enzyme diaphorase to reduce resazurin into the fluorescent product resorufin. This method yielded a detection limit of 10 μM []. However, in biological samples, this system will be subjected to interference from other reactions that involve dehydrogenases. Other methodologies employing malate dehydrogenase have also been reported [,,], providing detection limits down to 63 nM []. The measurement of D-malate using D-malate dehydrogenase, providing a detection limit of 10 nM, has also been reported [].
Methods for the separation of D- and L-malate using derivatization and separation by liquid chromatography have been developed [,]. Stereoselective receptors for D- and L-malate, which provide a change in fluorescent signal upon ligand binding, have also been reported [].
Eu3+ is luminescent, and its strongest emission is associated with a 7F0–6 ← 5D0 transition, providing a red color []. This luminescence is modified by chelation with ligands which include tetracycline []. Eu3+–tetracycline luminescence can be further modulated by the replacement of water ligands with additional ligands. This has been used as a means of detection of many different analytes of biological interest, some of which are not easily detected directly using absorbance or fluorescence spectroscopy. These analytes include coenzyme A [], NADPH [], ATP and other mononucleotides [], glycolysis and Kreb’s cycle intermediates [], H2O2 [,], serum albumin [], heparin [], and lecithin []. Measurement of the formation of some of these analytes has also been used as the basis of enzyme assays []. In these studies, separations of mixtures of analytes were not performed. Measurement of metabolites after complexation with Eu3+–tetracycline and separation using capillary electrophoresis have been described [,,].
D- and L-malate have both been found to form a complex with Eu3+–tetracycline. However, the luminescent signals from them are indistinguishable. The different complexes were found to have different luminescence half-lives and could be distinguished using time-resolved luminescence [].
Eu3+ has been incorporated into nanoparticles, providing an enhanced signal due to the particles acting as antennae [,], and used to detect tetracycline [,] and other antibiotics [,]. Eu3+ has also been incorporated into portable test strips for use in the detection of tetracycline in food samples [].
In this study, luminescent complexes were made between Eu3+–tetracycline and succinate and nine of its derivatives. The complexes were analyzed using capillary electrophoresis. Some of these analytes have been previously detected when the assay was performed at room temperature []. However, a later study showed that detectability was increased when the assay was performed at 4 °C []. Here, a wide range of dicarboxylic acids were assayed at 4 °C in order to determine which species could be detected and to illuminate what structural features are required. Citrate and isocitrate were also tested in order to determine if separation of the complexes containing dicarboxylic acids and tricarboxylic acids results in different mobilities. The remaining portion of this study was focused on the development of a method for the stereoselective detection of L-malate.
2. Materials and Methods
Reagents: D-Malate was supplied by Fluka (Morris Plains, NJ, USA). All other reagents and solvents were obtained from Sigma-Aldrich (St. Louis, MO, USA).
Capillary electrophoresis (CE) instrument: Separations were performed using an in-laboratory-constructed CE instrument which utilizes post-column laser-induced luminescence detection within a sheath flow cuvette. Details of the instrument, including a schematic, have been published previously []. The injection end of a 25 cm long uncoated fused silica capillary with inner and outer diameters of 10 and 145 μm, respectively, as well as a 0.5 mm diameter platinum wire connected to a high-voltage power supply were placed into a vessel containing buffer situated in the injection carousel. Approximately 1 mm of external polyamide coating was removed by flame from the detection end of the capillary before its insertion into a quartz sheath flow cuvette containing a 250 × 250 µm inner bore (Hellma, Markham, ON, Canada). The polyimide coating fluoresces strongly, greatly increasing the background signal, and it is for this reason it was removed from the detection end. The capillary was grounded through the sheath flow buffer within the cuvette. The 10 mW output at 407 nm of a solid-state laser (Coherent, Santa Clara, CA, USA) was focused using a 6.3×, N.A. 0.2 microscope objective (Melles Griot, Carlsbad, CA, USA) approximately 10 µm below the detection end of the capillary. Emission was collected at 90° using a 60×, N.A. 0.7 microscope objective (Universe Kogaku, Oyster Bay, NY, USA) and then passed through a 615DF45 optical filter (Omega Optical, Brattleboro, VT, USA) and a slit and onto a photomultiplier tube (PMT, Hamamatsu model 1477, Shizuoka, Japan). The analog signal was collected at 25 Hz and digitized using a Pentium 4 computer through a PCI-MIO-16XE I/O board utilizing LabViewTM software (V 7.0, National Instruments, Austin, TX, USA). The same board was used to control the electrophoresis voltage and set the PMT bias, which, unless otherwise specified, was at 1100 V. The buffer flowing through the sheath flow cuvette was 12.5 mM HEPES containing 25 mM TRIS base (pH unadjusted, ~8.0). The running buffer was 12.5 mM HEPES containing 25 mM TRIS base and 40% to 60% (v/v) formamide (pH unadjusted). Sample buffer was the same as the running buffer except it also contained 200 μM Eu3+–tetracycline. Since formamide hydrolyses slowly, fresh running and sample buffers were made daily by diluting formamide into stock HEPES/TRIS buffer. Samples were electrokinetically injected into the capillary for 5 s at an electrical field of 200 V/cm and separated at an electrical field of 800 V/cm (injection end positive). Data were analyzed using IgorProTM (WaveMetrics, Lake Oswego, OR, USA), and peak heights were determined using PeakFitTM (Systat Software, San Jose, CA, USA).
In order to control the separation temperature, the entire length of the capillary, as well as the sample carrousel and the sheath flow cuvette, was contained within an insulated box. Within the box, approximately 30 m of coiled 6.35 mm inner diameter Cu tubing was placed. Coolant from a recirculation heater/cooler unit continuously flowed through the coil. The cooler was set to −15 °C, and this maintained the interior of the box at 4 to 7 °C. The temperature within the box on a given day was maintained to within 1 °C, but it varied slightly from day-to-day. The air within the box was continuously circulated using an electric fan.
3. Results and Discussion
Previous studies have shown that the peak height obtained from CE separations of complexes of tartaric acid and Eu3+–tetracycline is dependent upon the concentration of organic additive in the sample, running buffer, and the temperature used in the separation. Maximum peak height was obtained when the sample and running buffers contained 60% formamide [].
Succinate and nine of its derivatives were assayed in order to determine what structural elements are required for detection using this method. In addition, citrate and isocitrate were also tested in order to demonstrate that the di- and tricarboxylic acid complexes had different mobilities. Different analytes were incubated in sample buffer containing 60% (v/v) formamide. Samples were separated at 4 °C using running buffer containing 60% v/v formamide. Some of these compounds have been assayed in a similar manner previously; however, this was performed at room temperature [,]. Upon the construction of a temperature control unit for the instrument, it was found that some analytes could be detected when separated at low-temperature conditions but not at room temperature []. Figure 2 shows the resultant electropherograms for (a) blank, (b) 100 μM fumarate, (c) 100 μM succinate, (d) 100 μM maleate, (e) 100 μM dihydroxyfumarate, (f) 10 μM D–tartarate, (g) 10 μM L–tartarate, (h) 20 μM DL–tartarate, (i) 10 μM L-malate, (j) 20 μM D-malate, (k) 5 μM oxaloacetate, (l) 5 μM citrate, and (m) 20 μM DL-isocitrate. Fumarate, maleate, dihydroxyfumarate, tartarate, malate, and oxaloacetate are all derivatives of succinate. Fumarate, succinate, and maleate yielded no peak under these conditions, which, of all the conditions tried, yielded the largest peaks for the other analytes. It is interesting that of all the dicarboxylic acids tested, it is only the ones that do not have an oxygen attached to either C-2 or C-3 which yielded no signal. This suggests that the presence of such an oxygen is required to yield a peak using this methodology, presumably due to its presence allowing for a longer-lasting complex with Eu3+–tetracycline. All of the dicarboxylic acids separated had indistinguishable migration time. Citrate and DL-isocitrate, both tricarboxylic acids, also had indistinguishable migration times, albeit distinct from that of the dicarboxylic acids. The tricarboxylic acids, having an extra negative charge, provided complexes which had a longer migration time than that for the dicarboxylic acids. Future work includes optimization of the separation conditions to allow for resolution of the dicarboxylic acids, as well as the tricarboxylic acids, from each other.
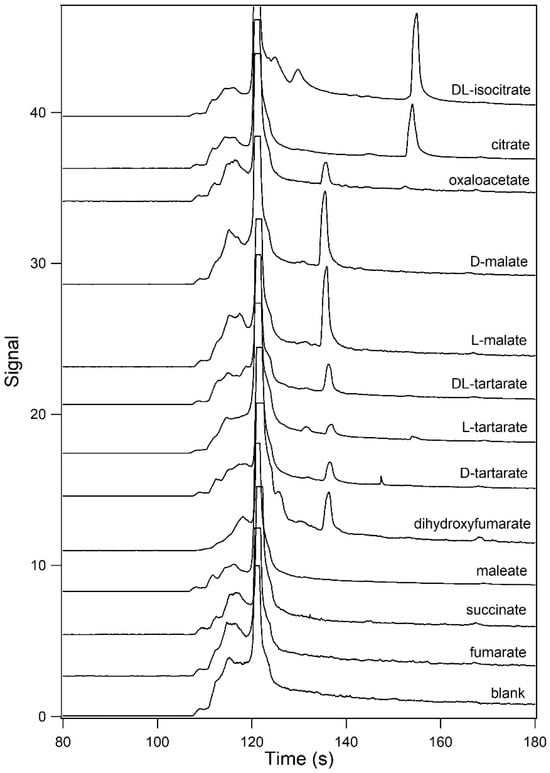
Figure 2.
Analysis of dicarboxylic and tricarboxylic acids. Analytes were incubated in 12.5 mM HEPES containing 25 mM TRIS base, 60% (v/v) formamide, and 200 μM Eu3+–tetracycline (pH unadjusted). Samples were analyzed by capillary electrophoresis at 4 °C using 12.5 mM HEPES containing 25 mM TRIS base and 60% (v/v) formamide (pH unadjusted) as the running buffer. From the bottom trace towards the top, the resultant electropherograms for a blank, 100 μM fumarate, 100 μM succinate, 100 μM maleate, 100 μM dihydroxyfumarate, 10 μM D–tartarate, 10 μM L–tartarate, 20 μM DL–tartarate, 10 μM L-malate, 20 μM D-malate, 5 μM oxaloacetate, 5 μM citrate, and 20 μM DL-isocitrate are shown.
Previously, it was shown that CE separations of D–, L–, and DL–tartarate complexes with Eu3+–tetracycline yielded different peak heights. Molecular modeling was not successful in explaining these observed differences based on the stability of the complexes formed. Similarly, in this study, molecular modeling was not able to explain the observed differences in the signals obtained for the dicarboxylic acids or between the tricarboxylic acids tested.
In the absence of a separation, the fluorescent signals obtained for the different tartarate isomers were indistinguishable. It was shown that the differences in the peak heights obtained during separations were due the complexes between the tartarate and Eu3+–tetracycline dissociating at different rates. Separation conditions were optimized such that the Eu3+–tetracycline–D–tartarate complex was detected but the complex with the L-isomer fully dissociated before reaching the detector []. The remainder of this study was undertaken to determine the conditions whereupon the L-malate complex can be detected, but the complex with the D-isomer fully dissociates before reaching the detector, yielding no peak.
Samples containing 40 μM D- or L-malate in sample buffer containing 40–60% (v/v) formamide were incubated for 30 min. The samples were then analyzed using CE at room temperature (22 °C) with running buffer containing 40–60% (v/v) formamide. The resultant electropherograms are shown in Figure 3. The top panel shows the electropherograms for L-malate, where the formamide concentrations in both the sample and running buffers were 40, 50, and 60% (v/v). The formamide concentration in the blank was 50%. In all runs, there is peak migrating at 62 s which was due to the excess Eu3+–tetracycline. In the presence of the L-malate, a second peak was noted at 70 s. This peak was found to increase in height with increasing formamide concentration. In the lower panel, the samples contained D-malate. A small peak for the complex with D-malate was noted in the presence of 60% formamide and a smaller peak was barely noticeable at 50%. No peak was noted at 40%. The peak height at 60% formamide for L-malate was about 30 times the height of that for D-malate.
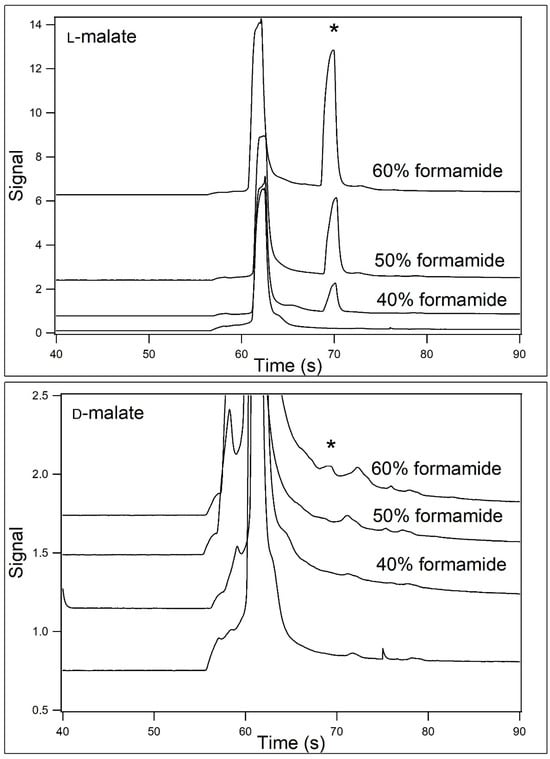
Figure 3.
Analysis of L- and D-malate at 22 °C when [formamide] was varied. Samples contained 40 μM L- (top panel) or D-malate (bottom panel) in 12.5 mM HEPES/25 mM TRIS base containing 200 μM Eu3+–tetracycline and 40–60% (v/v) formamide (pH unadjusted). The samples were then analyzed by capillary electrophoresis at 22 °C using 12.5 mM HEPES/25 mM TRIS base (pH unadjusted) containing 40–60% (v/v) formamide (2nd from the bottom, 2nd from the top, and top traces) as the running buffer. The formamide concentration in the blank (bottom trace) was 50%. The position of the malate peaks is demarked with an asterisk.
Figure 4 is similar to that of Figure 3, with the exception that the CE separations were performed at 7 °C. Peak migration times were longer due to the decreased electroosmotic flow at the lower temperature. Electropherograms for the analysis of both L- (upper panel) and D-malate (lower panel) containing samples are shown. The concentrations are identical to those shown in Figure 2. It is noteworthy that a peak is observed for D-malate in the presence of 40% formamide, whereas when the separation was performed at 22 °C, no such peak was observed. The differences in the peak heights in 60% formamide between D- and L-malate at 7 °C were about 7-fold.
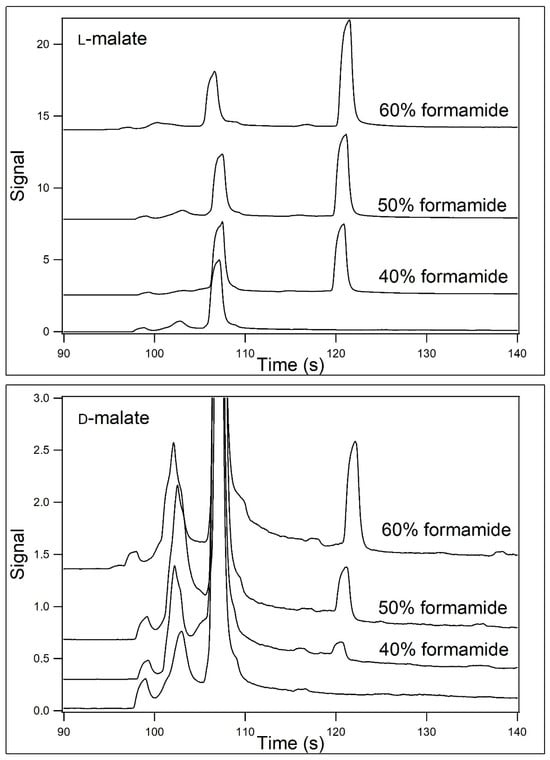
Figure 4.
Analysis of L- and D-malate at 7 °C when [formamide] was varied. Samples contained 40 μM L- (top panel) or D-malate (bottom panel) in 12.5 mM HEPES/25 mM TRIS base containing 200 μM Eu3+–tetracycline and 40–60% (v/v) formamide (pH unadjusted). The samples were then analyzed by capillary electrophoresis at 7 °C using 12.5 mM HEPES/25 mM TRIS base (pH unadjusted) containing 40–60% (v/v) formamide (2nd from the bottom, 2nd from the top, and top traces) as the running buffer. The formamide concentration in the blank (bottom trace) was 50%. The position of the malate peaks is demarked with an asterisk.
Peak heights between Figure 3 and Figure 4 cannot be directly compared. In Figure 3, the PMT bias was maintained at 1000 V, whereas in Figure 4, it was maintained at 900 V. On the instrument used, an increase in bias from 900 to 1000 V resulted in an approximate doubling of the signal. A similar effect occurred when the PMT bias was increased to 1100 V. In addition, the instrument response varied by up to approximately 10% from day-to-day.
In the absence of any formamide in the sample and running buffers, no peaks were observed for either L- or D-malate when analyzed at both 7 and 22 °C. Peaks were, however, detected for oxaloacetate in the absence of formamide in the samples or running buffer []. Since the dicarboxylic acids all had indistinguishable mobilities, the absence of formamide can be used to distinguish oxaloacetate from malate.
L- and D-malate were incubated in sample buffer containing 40% (v/v) formamide and the samples separated at 22 °C using running buffer containing 40% (v/v) formamide (Figure 5). A peak was observed when the sample contained 40 μM L-malate, but no peak was observed when the sample contained 500, 1000, or 2000 μM D-malate. Together Figure 3, Figure 4 and Figure 5 demonstrate that assays performed at 22 °C and in the presence of 40% formamide were stereospecific for L-malate. However, the sensitivity under these conditions was diminished relative to that obtained at the optimum conditions of 7 °C in the presence of 60% formamide. That sensitivity is increased at lower temperatures, and differences in temperature can be used to provide stereoselectivity, which is consistent with a previous study using tartaric acid [].
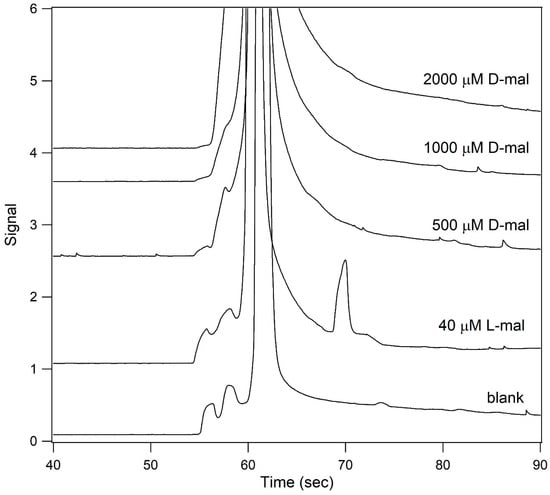
Figure 5.
Analysis of L- and D-malate under conditions that were stereospecific for the L-isomer. Samples containing 40 μM L-malate (2nd from the bottom trace), 500 μM D-malate (middle trace), 1 mM D-malate (2nd from the top trace), and 2 mM D-malate (top trace) were incubated in 12.5 mM HEPES/25 mM TRIS base containing 200 μM Eu3+–tetracycline and 40% (v/v) formamide (pH unadjusted). The bottom trace is that of a blank. The samples were then analyzed by capillary electrophoresis at 22 °C using 12.5 mM HEPES/25 mM TRIS base containing 40% (v/v) formamide (pH unadjusted) as the running buffer.
Stereoselective conditions were used for the separation of samples containing varying concentrations of L-malate (Figure 6). The main panel shows the resultant electropherograms for a blank and for samples containing 1, 2, 5, 10, and 25 μM L-malate. The inset shows the electropherograms for samples containing 50 and 100 μM L-malate. Figure 7 shows the relationship between signal and concentration.
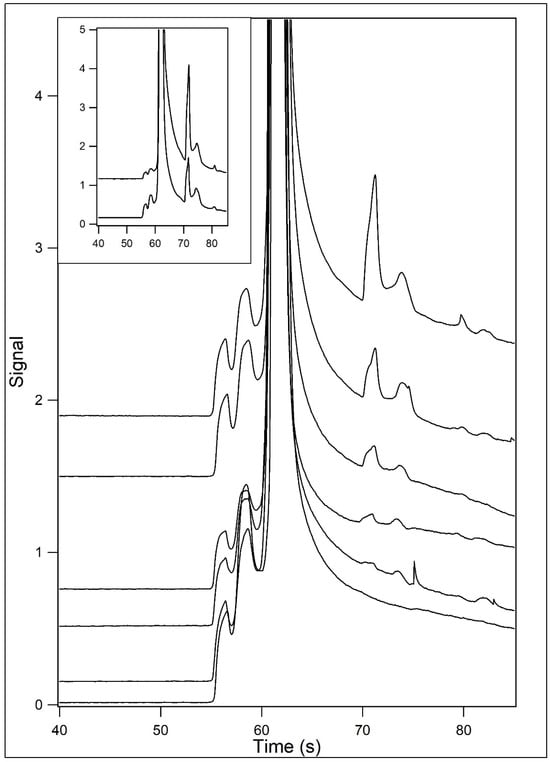
Figure 6.
Analysis of L-malate and varying concentrations under stereospecific conditions. Samples containing L-malate were incubated in 12.5 mM HEPES/25 mM TRIS base containing 200 μM Eu3+–tetracycline and 40% (v/v) formamide (pH unadjusted). The samples were then analyzed by capillary electrophoresis at 22 °C using 12.5 mM HEPES/25 mM TRIS base containing 40% (v/v) formamide (pH unadjusted) as the running buffer. L-malate concentrations were 1 (2nd from bottom), 2 (3rd from bottom), 5 (3rd from top), 10 (2nd from top), and 25 μM (top). The bottom trace is that of a blank. In the inset, traces for 50 (bottom) and 100 μM (top) L-malate are shown.
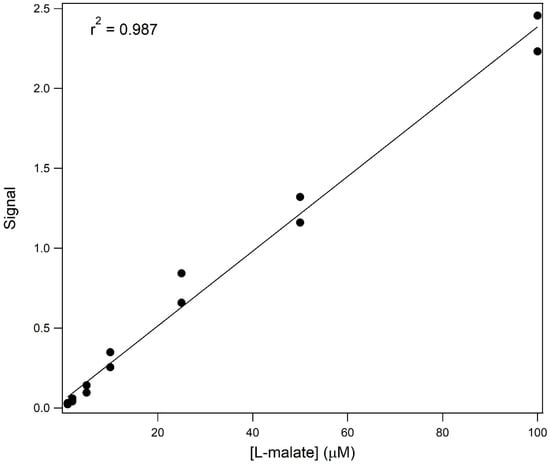
Figure 7.
Signal vs. concentration for the analysis of L-malate and varying concentrations under stereospecific conditions. The response curve for 1 to 100 μM L-malate is shown.
Figure 8 shows the resultant electropherograms for the separation at 5 °C of samples containing varying concentrations of L-malate when the running and sample buffers contained 60% (v/v) formamide. These conditions are not stereospecific for the L-isomer but have a higher sensitivity. The main panel shows the electropherograms for the CE separation of a blank and samples containing 100 nM, 250 nM, 500 nM, 1 μM, and 2 μM L-malate. The inset shows the electropherograms for samples containing 5 and 10 μM L-malate. Figure 9 shows the relationship between signal and concentration. These non-stereoselective conditions allow for the detection of L-malate at a concentration of one-tenth that of the stereoselective conditions.
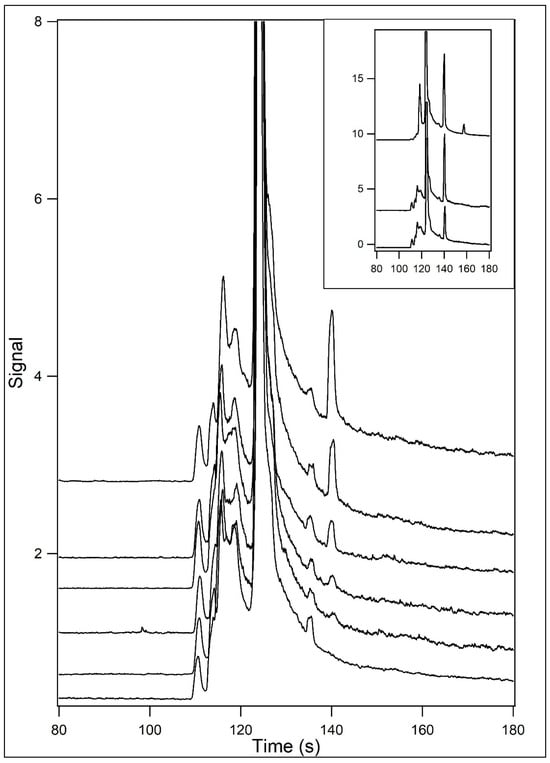
Figure 8.
Analysis of L-malate and varying concentrations under optimum conditions. Samples containing L-malate were incubated in 12.5 mM HEPES/25 mM TRIS base containing 200 μM Eu3+–tetracycline and 60% (v/v) formamide (pH unadjusted). The samples were then analyzed by capillary electrophoresis at 5 °C using 12.5 mM HEPES/25 mM TRIS base containing 60% (v/v) formamide (pH unadjusted) as the running buffer. L-malate concentrations were 100 nM (2nd from bottom), 250 nM (3rd from bottom), 500 nM (3rd from top), 1 μM (2nd from top), and 2 μM (top). The bottom trace is that of a blank. In the inset, traces for 5 (bottom) and 10 μM (top) L-malate are shown.
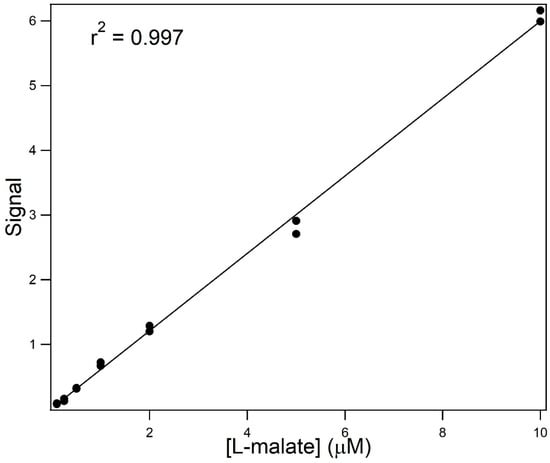
Figure 9.
Signal vs. concentration for the analysis of L-malate and varying concentrations under optimum conditions. The response curve for 100 nM to 10 μM L-malate is shown.
The internal volume of a 25 cm long, 10 μm internal diameter capillary is 20 nL. The sample injection volumes were 180 pL. For the 100 nM L-malate sample, this corresponded to 18 attomoles of analyte.
4. Summary
Europium–tetracycline forms luminescent complexes with different analytes, including many organic polyprotic acids. This has been used as a means of detection of said analytes. Succinate (1,4-butanedioate) and nine of its derivatives, as well as citrate and isocitrate, were incubated in 12.5 mM HEPES containing 25 mM TRIS base, 60% (v/v) formamide, and 200 μM Eu3+–tetracycline (pH unadjusted). Samples were analyzed at 4 °C by capillary electrophoresis utilizing post-column laser-induced luminescence detection using 12.5 mM HEPES containing 25 mM TRIS base, 60% (v/v) formamide (pH unadjusted) as the running buffer. Of the dicarboxylic acids, only those that contained at least one oxygen atom attached to C-2 or C-3 yielded a peak in the resultant electropherograms. Two of these dicarboxylic acids, L- and D-malate, were selected for further study. It was found that under these conditions, L-malate was measurable down to 100 nM. With an injection volume of 180 pL, this corresponded to 18 attomoles. D-malate also produced a signal, albeit much weaker than that for the L-isoform. The conditions were optimized to allow for the stereoselective detection of L-malate. It was found that incubation of analyte in 12.5 mM HEPES/25 mM TRIS base containing 200 μM Eu3+–tetracycline and 40% (v/v) formamide (pH unadjusted) and separation at 22 °C using 12.5 mM.
HEPES/25 mM TRIS base containing 40% (v/v) formamide (pH unadjusted) yielded a peak for L-malate but not for D-malate. However, under these conditions, the L-malate sensitivity was reduced by about 10-fold.
Past studies have involved the incubation of Eu3+–tetracycline with various analytes followed by measurement of the luminescent signal. No separations were used [,,,,,,,,]. Such a signal from multiple analytes, if present, could not be discerned. The introduction of capillary electrophoresis separations allowed for the detection of more than one analyte in a given sample []. However, in this study, it was found that the dicarboxylic acids had near-identical migration times, although they differed from that of the tricarboxylic acids, indicating that further optimization of the separations is required. However, discernment of some dicarboxylic acids could be achieved using different separation conditions.
Author Contributions
Conceptualization, D.B.C.; methodology, D.B.C.; software, D.B.C. and J.W.H.; validation, D.B.C.; formal analysis, D.B.C., S.A., B.K.R., W.P., and J.W.H.; investigation, D.B.C., S.A., B.K.R., W.P., and J.W.H.; resources, D.B.C. and J.W.H.; data curation, D.B.C., S.A., B.K.R., W.P., and J.W.H.; writing—original draft preparation, D.B.C.; writing—review and editing, S.A., B.K.R., W.P., and J.W.H.; visualization, D.B.C.; supervision, D.B.C. and J.W.H.; project administration, D.B.C.; funding acquisition, D.B.C. and J.W.H. All authors have read and agreed to the published version of the manuscript.
Funding
We acknowledge the support of the Natural Sciences and Engineering Research Council of Canada (NSERC), 110839.
Institutional Review Board Statement
Not applicable.
Informed Consent Statement
Not applicable.
Data Availability Statement
All data that support the reported results are contained within the manuscript.
Conflicts of Interest
The authors declare no conflicts of interest.
References
- Stern, J.R.; Hegre, C.S. Inducible D-Malic Enzyme in Escherichia coli. Nature 1966, 212, 1611–1612. [Google Scholar] [CrossRef]
- Asano, Y.; Ueda, M.; Yamada, H. Microbial production of D-malate from maleate. Appl. Environ. Microbiol. 1993, 59, 1110–1113. [Google Scholar] [CrossRef]
- Jiang, Y.; Zheng, T.; Ye, X.; Xin, F.; Zhang, W.; Dong, W.; Ma, J.; Jiang, M. Metabolic engineering of Escherichia coli for L-malate production anaerobically. Microb. Cell Factories 2020, 19, 165. [Google Scholar] [CrossRef]
- Shapiro, F.; Silanikove, N. Rapid and accurate determination of malate, citrate, pyruvate and oxaloacetate by enzymatic reactions coupled to formation of a fluorochromophore: Application in colorful juices and fermentable food (yogurt, wine) analysis. Food Chem. 2011, 129, 608–613. [Google Scholar] [CrossRef] [PubMed]
- Gallarta, F.; Sáinz, F.J.; Sáenz, C. Fluorescent sensing layer for the determination of L-malic acid in wine. Anal. Bioanal. Chem. 2007, 387, 2297–2305. [Google Scholar] [CrossRef] [PubMed]
- Vargas, E.; Ruiz, M.A.; Ferrero, F.J.; Campuzano, S.; Montiel, V.R.-V.; Reviejo, A.J.; Pingarrón, J.M. Automatic bionalyzer using an integrated amperometric biosensor for the determination of L-malic acid in wines. Talanta 2016, 158, 6–13. [Google Scholar] [CrossRef] [PubMed]
- Röhlen, D.L.; Pilas, J.; Schöning, M.J.; Selmer, T. Development of an Amperometric Biosensor Platform for the Combined Determination of L-Malic, Fumaric, and L-Aspartic Acid. Appl. Biochem. Biotechnol. 2017, 183, 566–581. [Google Scholar] [CrossRef]
- Giménez-Gómez, P.; Gutiérrez-Capitán, M.; Capdevila, F.; Puig-Pujol, A.; Fernández-Sánchez, C.; Jiménez-Jorquera, C. Robust L-malate bienzymatic biosensor to enable the on-site monitoring of malolactic fermentation of red wines. Anal. Chim. Acta 2017, 954, 105–113. [Google Scholar] [CrossRef]
- Mori, H.; Shiraki, S. Determination of D-Malate Using Immobilized D-Malate Dehydrogenase in a Flow System and its Application to Analyze the D-Malate Content of Beverages. J. Health Sci. 2008, 54, 72–75. [Google Scholar] [CrossRef]
- Mei, X.; Lu, D.; Yan, X. Separation and determination of D-malic acid enantiomer by reversed-phase liquid chromatography after derivatization with (R)-1-(1-naphthyl) ethylamine. Braz. J. Pharm. Sci. 2022, 58, e19247. [Google Scholar] [CrossRef]
- Fransson, B.; Ragnarsson, U. Separation of enantiomers of α-hydroxy acids by reversed-phase liquid chromatography after derivatization with 1-(9-fluorenyl)ethyl chloroformate. J. Chromatogr. A 1998, 827, 31–36. [Google Scholar] [CrossRef]
- Qing, G.-Y.; He, Y.-B.; Chen, Z.-H.; Wu, X.-J.; Meng, L.-Z. Sensitive fluorescent sensors for malate based on calix[4]arene bearing anthracene. Tetrahedron Asymmetry 2006, 17, 3144–3151. [Google Scholar] [CrossRef]
- Shriver, D.; Weller, M.; Overton, T.; Rourke, J.; Armstrong, F. Inorganic Chemistry, 6th ed.; WH Freeman and Company: New York, NY, USA, 2014. [Google Scholar]
- Lin, Z.; Wu, M.; Schaeferling, M.; Wolfbeis, O.S. Fluorescent imaging of citrate and other intermediates in the citric acid cycle. Angew. Chem. 2004, 43, 1735–1738. [Google Scholar] [CrossRef]
- Peng, Q.; Ge, X.; Jiang, C. A new spectrofluorometric probe for the determination of trace amounts of CoA in injection, human serum and pig livers. Anal. Sci. 2007, 23, 557–561. [Google Scholar] [CrossRef]
- Peng, Q.; Hou, F.; Ge, X.; Jiang, C.; Gong, S. Fluorimetric study of the interaction between nicotinamide adenine dinucleotide phosphate and tetracycline-europium complex and its application. Anal. Chim. Acta 2005, 549, 26–31. [Google Scholar] [CrossRef]
- Schaferling, M.; Wolfbeis, O.S. Europium tetracycline as a luminescent probe for nucleoside phosphates and its application to the determination of kinase activity. Chemistry 2007, 15, 4342–4349. [Google Scholar] [CrossRef]
- Da Silva, F.R.; Courrol, L.C.; Tarelho, L.V.G.; Gomes, L.; Vieira, N.D. Enhancement of europium luminescence in tetracycline-europium complexes in the presence of urea hydrogen peroxide. J. Fluoresc. 2005, 15, 667–671. [Google Scholar] [CrossRef]
- Durkop, A.; Wolfbeis, O.S. Nonenzymatic direct assay of hydrogen peroxide at neutral pH using the Eu3Tc fluorescent probe. J. Fluoresc. 2005, 15, 755–761. [Google Scholar] [CrossRef] [PubMed]
- Jiang, C.Q.; Luo, L. Spectrofluorometric determination of human serum albumin using a tetracycline-europium complex. Anal. Lett. 2004, 37, 1129–1137. [Google Scholar] [CrossRef]
- Zhu, X.J.; Wang, X.L.; Jiang, C.Q. Spectrofluorometric determination of heparin using a tetracycline-europium probe. Anal. Biochem. 2005, 341, 299–307. [Google Scholar] [CrossRef] [PubMed]
- Wang, T.; Jiang, C.Q. Spectrofluorimetric determination of lecithin using a tetracycline-europium probe. Anal. Chim. Acta 2006, 561, 204–209. [Google Scholar] [CrossRef]
- Craig, D.B.; Hiebert, Z. Analysis of Complexes of Metabolites with Europium Tetracycline Using Capillary Electrophoresis Coupled with Laser-Induced Luminescence Detection. BioMetals 2017, 30, 449–458. [Google Scholar] [CrossRef]
- Lischynski, J.R.; Goltz, D.M.; Craig, D.B. Measurement of Phosphate in Small Samples Using Capillary Electrophoresis with Laser-Induced Luminescence Detection. J. Liq. Chromatogr. Relat. Technol. 2019, 41, 1092–1097. [Google Scholar] [CrossRef]
- Craig, D.B.; Lischynski, J.R.; Cardoso, I.C.C. Citrate Analysis Using Capillary Electrophoresis and Complexation with Eu3+-Tetracycline. BioMetals 2018, 31, 1043–1049. [Google Scholar] [CrossRef]
- Lin, Z.; Wu, M.; Wolfbeis, O.S. Time-resolved fluorescent chirality sensing and imaging of malate in aqueous solution. Chirality 2005, 17, 464–469. [Google Scholar] [CrossRef]
- Bai, Y.; He, Y.; Wang, Y.; Song, G. Nitrogen, boron-doped Ti3C2 MXene quantum dot-based ratiometric fluorescence sensing platform for point-of-care testing of tetracycline using an enhanced antenna effect by Eu3+. Mikrochim. Acta 2021, 188, 401. [Google Scholar] [CrossRef] [PubMed]
- Pacheco, M.E.; Chimeno-Trinchet, C.; Fernández-González, A.; Badía-Laíño, R. New europium-doped carbon nanoparticles showing long-lifetime photoluminescence: Synthesis, characterization and application to the determination of tetracycline in waters. Spectrochim. Acta Part A Mol. Biomol. Spectrosc. 2023, 284, 121756. [Google Scholar] [CrossRef] [PubMed]
- Long, Q.-H.; Hong, L.-N.; Han, C.; Li, X.-Y.; Liao, Y.-J.; Yan, X.-L.; Mai, X.; Li, N. Eu3+-functionalized covalent organic framework for ratiometric fluorescence detection and adsorption of tetracycline and information steganography. Mikrochim. Acta 2024, 191, 519. [Google Scholar] [CrossRef] [PubMed]
- Li, X.; Fan, K.; Yang, R.; Du, X.; Qu, B.; Miao, X.; Lu, L. A long lifetime ratiometrically luminescent tetracycline nanoprobe based on Ir(III) complex-doped and Eu3+-functionalized silicon nanoparticles. J. Hazard. Mater. 2020, 386, 121929. [Google Scholar] [CrossRef]
- Zhu, Z.; Xu, J.; Chen, X.; Li, Y.; Zhang, L.; Jia, L.; Li, J.; Zhu, T.; Zhao, T. Intelligent detection and classification of tetracycline drugs by rare earth fluorescence sensing platform based on deep learning algorithm and STM32 microcontroller. Sens. Actuators B Chem. 2025, 445, 138638. [Google Scholar] [CrossRef]
- Hijaz, F.; Nehela, Y.; Gonzalez-Blanco, P.; Killiny, N. Development of europium-sensitized fluorescence-based method for sensitive detection of oxytetracycline in citrus tissues. Antibiotics 2021, 10, 224. [Google Scholar] [CrossRef] [PubMed]
- Gan, Z.; Hu, X.; Xu, X.; Zhang, W.; Zou, X.; Shi, J.; Zheng, K.; Arslan, M. A portable test strip based on fluorescent europium-based metal-organic framework for rapid and visual detection of tetracycline in food samples. Food Chem. 2021, 354, 129501. [Google Scholar] [CrossRef] [PubMed]
- Craig, D.B.; Hollett, J.W.; Abas, S.; Riehl, B.K. Stereoselective Analysis of Tartaric Acid Using Complexation with Eu3+-Tetracycline and Capillary Electrophoresis. J. Pharmacol. Clin. Toxicol. 2023, 11, 1176. [Google Scholar]
- Craig, D.B.; Arriaga, E.A.; Banks, P.; Zhang, Y.; Renborg, A.; Palcic, M.M.; Dovichi, N.J. Fluorescently-based enzymatic assay by capillary electrophoresis laser-induced fluorescence detection for the determination of a few β-galactosidase molecules. Anal. Biochem. 1995, 226, 147–153. [Google Scholar] [CrossRef]
Disclaimer/Publisher’s Note: The statements, opinions and data contained in all publications are solely those of the individual author(s) and contributor(s) and not of MDPI and/or the editor(s). MDPI and/or the editor(s) disclaim responsibility for any injury to people or property resulting from any ideas, methods, instructions or products referred to in the content. |
© 2025 by the authors. Licensee MDPI, Basel, Switzerland. This article is an open access article distributed under the terms and conditions of the Creative Commons Attribution (CC BY) license (https://creativecommons.org/licenses/by/4.0/).