Abstract
A large proportion of the existing building stock in northern Europe is facing energy renovation in the coming years. In this process, existing architecture in cold and temperate climates, originally designed for natural ventilation, is renovated, implementing mechanical ventilation with heat recovery, in the belief that mechanical ventilation performs better than natural ventilation. Yet, can natural ventilation outperform mechanical ventilation when comparing life cycle carbon emissions, cost, and indoor environmental parameters? This study compares two different ventilation strategies in a full-scale renovation of two identical Danish residential buildings: (1) natural ventilation with passive controlled NOTECH ventilation and two-layered high-transmittance windows vs. (2) mechanical ventilation with heat recovery and three-layered low energy windows. The study compares energy performance, life cycle carbon footprint, capital cost investments, payback period, and indoor environmental quality (IEQ). Under the observed conditions, the results show that natural ventilation outperforms mechanical ventilation when it comes to energy consumption for heating (MWh), global warming potential (t. CO2-equivalent), and total costs, while mechanical ventilation has a slightly higher indoor environmental quality. The study shows that two-layered windows and natural ventilation, based on passive solar heating, can reduce the global warming potential and act as a viable alternative to three-layered windows and mechanical ventilation when renovating existing building stock.
1. Introduction
In the industrialized world, most building regulations require that the energy consumption of buildings be reduced in the coming years, avoiding unnecessary energy consumption in all phases of construction, as well as operation. The European Union has implemented comprehensive measures to enhance the energy efficiency of buildings, aiming for a fully decarbonized building stock by 2050. The Energy Performance of Buildings Directive (EPBD) mandates that all new buildings constructed from 2021 onwards must be nearly net-zero-energy buildings (NZEBs) [1].
To address the existing building stock, which accounts for approximately 40% of the EU’s energy consumption and over one-third of its greenhouse gas emissions, the EU introduced the Renovation Wave strategy in 2020 [2]. This initiative aims to at least double the annual energy renovation rate of buildings by 2030, prioritizing the poorly performing structures and promoting deep renovations. The directive also sets minimum energy performance standards (MEPS) for both residential and non-residential buildings, ensuring that the poor-performing buildings are prospectively upgraded. EU-wide strategies and directives provide a framework that Member States [3], including Denmark, must integrate into their national building regulations. Danish building codes incorporate these EU mandates by setting stringent energy consumption limits, requiring comprehensive documentation of energy performance, and specifying minimum insulation standards for various building components, including ventilation system efficiency.
Although the existing building stock in Denmark originally was designed for natural ventilation, strict demands on airtightness implemented recently in the regulations result in renovation solutions based on mechanical ventilation with heat recovery, changing not only the building physics and architecture of the historical buildings [4], but also the carbon footprint of the buildings [5]. Since building requirements tend to focus on energy consumption, they rarely address specific differences in the embedded carbon impact [6]. This means that requirements, intended to limit the energy use of buildings, may, in fact, do more harm to the environment and counter the overall goals of renovation initiatives set out by the EU carbon reduction initiatives, which revolve around mitigating the effects of global warming. Hence, mechanical ventilation with heat recovery is typically chosen over natural ventilation to reduce the estimated energy consumption for heating in buildings, e.g., the Passive house movement [7]. Second to this, best practices tend to be based on nationally defined practices, meaning national building codes affect the solutions that are possible to implement in the first place. For Denmark, this is no exception, and when focusing on the difference in the carbon impact of a ventilation strategy between two solutions, Danish buildings must be ventilated to ensure satisfactory air quality and humidity conditions. The requirements for ventilation in residential buildings, such as those applied in this study, specify a minimum fresh air supply of 0.3 L/s per m2 of heated floor area, for new buildings and for renovations. However, such requirements have been widely debated as reliable indicators of indoor environmental quality. Several studies have shown that air change rate (ACH) is a poor measure of indoor air contamination and distribution of pollutants [8,9], as well as of humidity and moisture effects [10,11]. Moreover, the broader environmental impact of mechanical ventilation systems, particularly their efficiency and contribution to climate change, has been questioned [12]. The perceived quality of the indoor environment is also influenced by other factors such as daylight availability [13], and detailed CFD analyses of cold airflows in schools have demonstrated the importance of control strategies [14].
Previous studies comparing natural and mechanical ventilation in milder climates have shown that air change rate (ACH) alone provides a limited basis for evaluating indoor air quality [15]. Although higher ACH values generally reduce the concentration of indoor contaminants, they also lead to increased heating energy demand. Therefore, Danish regulations, in line with EU Regulation 1253/2014 [16] and similar to those found in other Nordic countries, require mechanical ventilation systems to include heat recovery with a minimum efficiency of 73% in addition to meeting the prescribed ACH.
If natural ventilation is used as an alternative, it must still comply with regulations ensuring that the primary energy consumption of the building does not exceed a defined threshold [17]. These requirements focus exclusively on operational energy and do not consider life cycle environmental impacts. In practice, the thresholds are set at levels that make the implementation of natural ventilation very difficult, both when it comes to renovation projects and new constructions. In addition, Danish building codes require all kitchens and bathrooms to be equipped with manually controlled mechanical exhaust systems that ventilate directly to the outside [18]. This requirement applies regardless of the primary ventilation strategy, meaning that fully natural ventilation is not permitted.
As a result, natural ventilation systems are rarely implemented in Denmark. Moreover, data comparing the actual, measured performance of natural vs. mechanical systems is scarce, which is why the latter is currently regarded as best practice for Danish building renovations. Given this perspective, this study, comparing a passive, filter-based natural ventilation system combined with high-transmittance double-glazed windows with a mechanical ventilation system using low-energy triple-glazed windows, seems to be important and relevant.
2. Background
In the coming decades, a large share of existing building stock in the EU will undergo energy renovations. Many of these buildings were originally designed for natural ventilation but are now being retrofitted with mechanical ventilation systems, recessed ceilings, highly insulated façades, and replacement of two-layer high-transmittance windows with three-layer low-energy glazing. These measures are widely promoted through EU and national renovation frameworks as cost-effective means to achieve significant reductions in operational energy use. The underlying assumption is that long-term energy savings will outweigh the additional upfront investment in materials, installation, and maintenance.
However, studies mainly outside the EU (see Table 1) show that the capital cost payback period for such renovation strategies varies greatly depending on climate, building typology, and energy pricing. As a result, it remains unclear which combinations of short-term interventions and long-term reductions are most cost-effective, leaving developers and investors with considerable uncertainty in decision-making.

Table 1.
Overview of the varying payback periods across specific renovation strategies.
The payback period is crucial for the perspective dealing only with return on investment; however, an arguably more important investment in the future may be the environmental investment measured in climate mitigation. Global warming potential (GWP). Few studies have assessed the GWP payback period for common building renovation measures. The existing literature tends to focus either on energy systems, such as photovoltaics [27] and heat pumps [28], or on specific construction materials, like insulation [29]. Studies that have attempted to quantify the environmental impact often use the term greenhouse gas emission payback time (GHGPBT), which was originally developed for comparing energy-generation systems such as wind and nuclear power [30]. Instead, the building sector has adopted different ways of comparing GWP of building products and buildings over a fixed, normalized period (often 50 y) following the ISO 14040:2006 [31] and, in Europe, EN 15978 [32]. Together, these serve as frameworks for comparing building-related mitigations, which form the foundation for comparing mitigation strategies related to buildings. Yet, for less common technologies and concepts, such as alternative ventilation systems, the comparative environmental benefits remain poorly understood.
In temperate and cold climates, natural ventilation is generally perceived as inferior to constant air volume (CAV) or variable air volume (VAV) mechanical systems with heat recovery, due to concerns about inadequate airflow control, thermal losses, and inconsistent indoor air quality. Consequently, mechanical ventilation with heat recovery has become the dominant regulatory and technical standard for energy renovation across Europe.
However, more recent research suggests that these assumptions should be revisited. Southall [33] demonstrated that supply-side demand-controlled ventilation could effectively regulate natural ventilation flow patterns while reducing domestic space-heating consumption. Zhang et al. [34] applied machine learning algorithms to improve window control for natural ventilation, showing promising results in terms of air quality and energy optimization. Hamada et al. [35] modeled demand-controlled ventilation in office buildings and found that intelligent natural ventilation could maintain healthy indoor environments while achieving high energy efficiency, even in warm climates. Similarly, Scheuring and Weller [36] experimentally investigated controlled natural ventilation in non-residential buildings and showed that adjusting opening durations can substantially improve both indoor air quality and energy performance.
Together, these studies indicate that demand-controlled or sensor-assisted natural ventilation could rival the performance of conventional mechanical systems under specific conditions, particularly in buildings originally designed for natural airflow. Despite this, such systems remain underrepresented in national renovation strategies, which tend to prioritize mechanical heat-recovery solutions.
In summary, current renovation policies and practices across the EU promote strategies that emphasize:
- Improved envelope performance (insulation, airtightness, high-efficiency glazing)
- Mechanical ventilation with heat recovery and high-efficiency components
- Replacement of technical systems to minimize operational energy use
However, these strategies often overlook:
- Life cycle environmental impacts and embodied energy in materials
- The potential of advanced natural ventilation systems as low-energy, low-impact alternatives
As a result, natural ventilation is rarely considered a viable strategy in contemporary renovation projects, despite emerging evidence that it may offer both environmental and economic advantages under certain conditions.
3. Methods
This study sets out to investigate the performance of two different ventilation strategies: a demand-controlled natural ventilation (N-Tech) with two-layered high-transmittance glass vs. a mechanical ventilation (M-Tech) with heat recovery and three-layered low-energy glass. Based on two identical, terraced buildings, the study compares the heat demand and capital cost investment as well as the carbon impact of the two solutions. The article explores how the two solutions perform in a temperate climate (Denmark) in terms of three parameters:
- Energy performance (heating consumption)
- Carbon footprint (life cycle stages A1–A3, B4, C3, C4, and D)
- Capital cost investments (payback period)
- Indoor environmental quality (IEQ) (CO2, air temperatures, and relative air humidity, %RH)
The study is an intervention-based study, first implementing the two different ventilation strategies as part of a total renovation of a public housing, then collecting and analyzing summer and winter data over a 12-month period, from January 2024 to January 2025. The full-scale study analyzes data from two identical apartment rows, each consisting of eight apartments renovated according to the M-Tech specifications and eight apartments renovated according to the N-Tech specifications (See Table 2). The study compares heating consumption (based on heating meters) for 16 apartments and indoor environmental quality parameters (IEQ) for 8 apartments, comparing 4 apartments renovated with NOTECH natural ventilation and 4 identical apartments renovated to mechanical ventilation, respectively (See Figure 1). Capital costs are compared for the total investments leading up to the renovation projects.
Table 2.
Overview of ventilation strategy and window properties for each apartment.
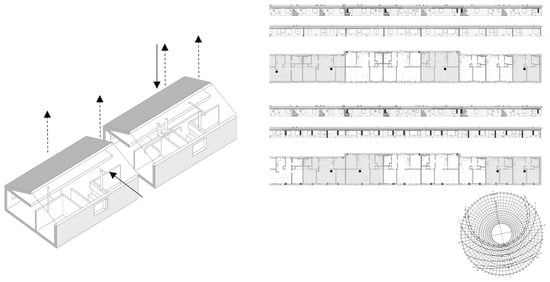
Figure 1.
Building 1 and Building 2 plan and façades of the two implemented solutions. M-Tech state-of-the-art mechanical ventilation and 3-layered windows in 8 apartments (top right). NOTECH ventilation and 2-layered high-transmittance windows in 8 apartments (bottom right). Isometric view with air intakes (arrows) and outlets (dotted arrows) for balanced mechanical ventilation (top left) and NOTECH ventilation (bottom left). NB. Selected test apartments marked in the plan drawings (light gray). NB. Placement of MiniNodes, see black circles.
3.1. Case Study Setup
The study collected empirical data from Munkevænget 63–111, a public terraced housing complex completely renovated in cooperation with the Ramboll Group.
Each building consisted of eight apartments with a total floor area of 603 m2. Indoor environmental quality sensors are placed in four of the eight apartments, while energy meters are measuring each building (See Figure 1). Data was collected using online data based on wireless MiniNodes [38] comparing the indoor environmental quality between the apartments. Methodically, the indoor environmental quality and energy performance were monitored in eight apartments, four apartments with the NOTECH solution and four identical apartments with the mechanical ventilation solution, during one calendar year; January 2024–January 2025. Each MiniNode is placed on a wall in the largest room (H = 1.8 m), details of the setup shown in Figure 1 and Table 2.
Both ventilation solutions are dimensioned to satisfy the minimum required air quality for residential buildings in Denmark. Furthermore, the N-Tech system is adjusted over the year, reducing the ventilation rate during the winter (November–April) and allowing passive cooling during summer (May–October) (see Table 3).
Table 3.
Overview of design values for the ventilation strategy and window properties for each apartment. * N-Tech dimensioning is based on [39], the other setpoints are based on [40].
The detailed system parameters for the case study are found in Table 4.
Table 4.
System parameters for N-Tech and M-Tech setup.
3.1.1. Natural Ventilation System Strategy, N-Tech
The natural ventilation system, NOTECH, is a façade-mounted motor-controlled opening (similar to, but not a window), and consists of a filter based on eelgrass and an insulated wind screen. The automation of this system consists of a timer-based control, which is designed to adjust the fraction of opening to summer and winter situations, respectively.
Each room has one NOTECH element for the fresh air intake, with outtake through ducts in the roof, in the kitchen, and in the bathroom See Figure 2. The eelgrass filter has multiple functions as the material is self-cleaning, reduces outdoor noise, balances relative humidity, and reduces the risk of draft. The properties of the eelgrass filter include being fire-resistant due to its saline properties, meaning that the required maintenance and filter change is reduced compared to the mechanical solution. The filter in the NOTECH system is expected to last at least >5 times longer [46].
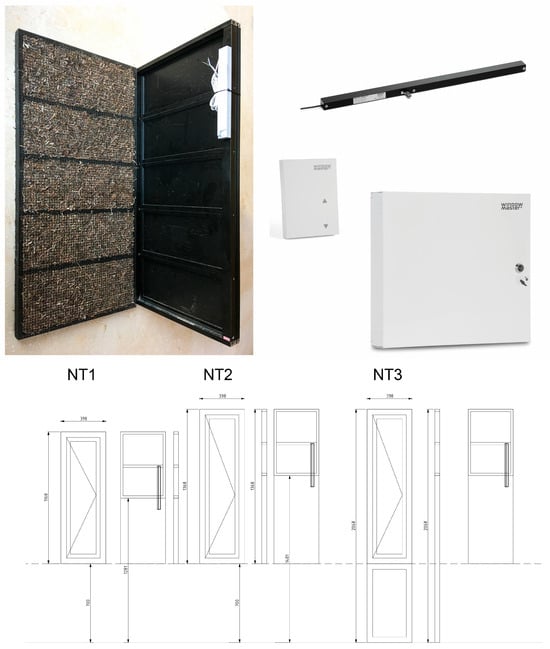
Figure 2.
NOTECH. Pictures and technical drawings of NOTECH intake (NT1) and the three different sizes of NOTECH intakes at Munkevænget (NT1, NT2, and NT3).
3.1.2. Mechanical Ventilation System Strategy, M-Tech
The mechanical ventilation is an active ventilation principle, regulated through sealed ducts and valves by central or decentral mechanical units, creating a constant, negative pressure in the system (CAV). The implemented mechanical solution is driven by a Genvex ECO 360 R with a potential heat recovery of up to 86% and supplied with M5 filters that need to be changed at a yearly frequency [37].
The ventilation unit has a rotating heat exchanger, able to recover moisture from the exhaust, reducing the risk of too low relative air humidity (%RH)—a humidity measurement constantly regulates the humidity conditions. The system is also able to passively cool during the summer by bypassing the unit, opening the intake directly.
Mechanical ventilation works on the same overall principle as natural ventilation. Fresh air is provided via ducts to living spaces, and with air outtake/exhausts in the moist bathrooms and kitchen. Air exchange is ensured by mechanical fans controlled automatically, with heat recovery in order to avoid potential heat loss [40].
3.1.3. Daylight Strategy for N-Tech—Two-Layered High-Transmittance Glazing
The NOTECH solution is part of a larger solution, including the utilization of passive solar heating. The solution is based on high-transmittance two-layered low-iron glazing (SHGC = 0.77) (see Table 4 for more details). The reason for using this type of glazing is that the glazing contributes to an increased amount of daylight and passive solar heat during the winter/heating season. Excessive heat from the high-transmittance glass during summer is designed to be passively ventilated through the NOTECH panels. The risk of overheating during the summer is mitigated by passive cooling during the night [39].
3.1.4. Daylight Strategy for M-Tech—Three-Layered Low Transmittance Glazing
The mechanical system is also part of a larger indoor environment and energy design strategy, which ensures good daylight conditions. The high-efficiency mechanical ventilation solution is based on low-transmittance three-layered windows (SHGC = 0.53), designed to reduce the need for active cooling demand using mechanical ventilation (cooling coils are thus avoided). As a result of low-e-glazing, less passive solar heat and less spectral light are transmitted through the windows, meaning larger windowpanes are used to guarantee good daylight conditions in the rooms.
4. Results
In the following, results are presented with emphasis on indoor environmental quality (IEQ) and heating energy consumption, global warming potential (GWP), including embedded emissions from materials, and finally an analysis of capital costs and payback time of the two systems.
4.1. Energy Consumption and Indoor Environment
Energy-metered data from the district heating supplier formed the dataset for the cumulative heating consumption of the two buildings. The data reveals that the N-Tech system, utilizing natural ventilation with a demand-controlled eelgrass filter, consistently outperforms the M-Tech system, which employs mechanical ventilation with heat recovery. Despite M-Tech’s theoretically superior thermal performance, it practically demonstrates close to 20% (0.508 MWh) higher heating demand. This discrepancy is especially intriguing considering both systems are installed in otherwise identical buildings, with differences only in the ventilation method and window properties. Specifically, the N-Tech building features windows with a higher SHGC (allowing more solar gain) but a higher U-value (providing less insulation), while M-Tech uses better-insulated glazing, but with lower solar gain. Total heating demand, including hot water consumption in 2024, was measured at 42.10 MWh for N-Tech and 45.18 MWh for M-Tech. Room heating alone reduces the value down to 25.90 MWh for N-Tech and 30.91 MWh for M-Tech, for the entire year of 2024.
The higher solar heat gain coefficient (SHGC) in N-Tech likely plays a role in reducing the need for heating by capturing more passive solar energy during the day, compensating for its higher thermal transmittance. While the coldest months, January and February (see Figure 3), had nearly identical consumption, the spring months gradually required less heating in the non-mechanical apartments, which indicates an increasing effect of passive solar gains. Additionally, the demand-controlled nature of N-Tech’s ventilation allows it to minimize unnecessary air exchange, conserving indoor heat when external conditions do not necessitate ventilation. In contrast, M-Tech’s continuous or semi-continuous operation, designed to maintain stable indoor air quality and comfort, likely results in greater overall ventilation-driven heat loss, even if partially recovered.
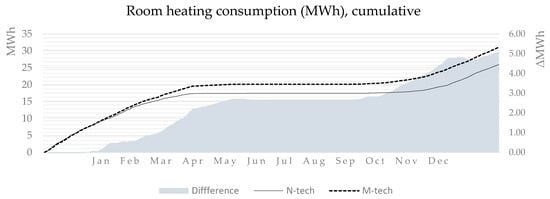
Figure 3.
Room heating consumption (kWh), cumulative. N-Tech and M-Tech consumption during the heating season from Jan to Dec in 2024. As seen in the figure, from May to mid-Aug, the room heating consumption is 0 as the district heating supply is switched off.
While M-Tech buildings consumed more energy for heating over the same period, the PMV analysis (see Figure 4 and Table 5 as well in Appendix A Table A1 for detailed IEQs) reveals that this additional energy use translated into a more stable indoor thermal environment in the heating season. For a large portion of the year, particularly in early spring and autumn, M-Tech units remained closer to the “No Thermal Stress”/Neutral band, with fewer excursions into “Slight Cold” or “Slight Heat.” N-Tech units, on the other hand, showed more frequent and deeper dips into “Slight Cold,” especially during colder months. However, these deviations were generally within tolerable thresholds and did not consistently reach uncomfortable extremes. Both systems show below-neutral PMV averages in January to April and October to November, meaning PMV as a model may undershoot the comfortable parameters, as the users in the building have full control of their thermostat settings. The implication here is that N-Tech provides a slightly looser, but still acceptable, thermal comfort profile—while consuming significantly less heating energy. Another important thing to notice is the relative comfort between the systems, and one central difference is the more stable climate in N-Tech from May to September, where M-Tech seems to fluctuate and show signs of overheating.
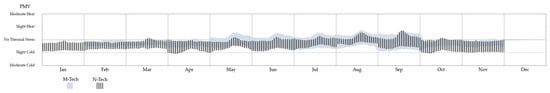
Figure 4.
PMV comfort profile of the two buildings. Min-and-max values shown for all apartments during 2024. The figure shows the min-and-max values of the PMV from all apartments based on the sensor data collected throughout the period. As seen, N-Tech generally has lower comfort values, and the M-Tech shows greater variance throughout the year. A lower bound of comfort range is shown with a dotted line for “slight cold stress” according to the PMV-method.
Table 5.
Average IEQ (PPD, PMV, CO2-concentrations). Detailed IEQs is shown in Appendix A.
This contrast between stability and efficiency raises several plausible reasons why M-Tech requires more heating despite being equipped with a heat recovery system and better-insulated windows. M-Tech’s mechanical system may be delivering more air than needed, either by design or a lack of occupant control. Even with heat recovery, high ventilation rates increase heating demand, particularly during colder months.
N-Tech’s demand-controlled natural system likely reduces air change rates more effectively in response to indoor conditions, conserving energy. N-Tech units benefit from high SHGC (0.77), allowing more passive solar heat/radiation to enter the space and supplement heating, while M-Tech’s lower SHGC (0.53) reduces these passive solar gains. This design choice, while likely beneficial in preventing overheating, also means M-Tech relies more heavily on active heating during winter and transitional seasons. Interestingly, we see slight thermal discomfort in the summer (at least relatively more than for the N-Tech), even with the low-e-glazing. One of the key unknowns in the dataset is the actual indoor setpoint temperature behavior. The thermostats were manually controlled by occupants, and no data was collected on real-time setpoints or system output. It is therefore unknown whether the heating systems ever approached their maximum design capacities or if user behavior significantly influenced heating demand. This uncertainty makes it difficult to separate system behavior from occupant preferences. Mechanical systems, like M-Tech, typically have fast-reacting controls that seek to maintain stable temperatures, responding quickly to any perceived deviation. This behavior can result in energy inefficiencies, especially in transitional weather where short-term swings in outdoor temperature lead to frequent heating cycles. N-Tech, with its more passive and dampened response to thermal change, may allow for greater fluctuation without triggering energy-intensive responses. Table 6 summarizes the most important differences in comfort and energy performance.
Table 6.
System comfort performance summarization.
It is possible to assess thermal performance per apartment by comparing PMV trends with associated heating use. This cross-analysis shows that some N-tech units delivered comfort at significantly lower energy levels, suggesting that slight thermal fluctuations may be acceptable, or in some cases, even preferable in the context of energy-efficient design. Moreover, it raises important questions about whether perfect thermal stability is necessary or desirable, especially when it carries a higher energy cost.
Ultimately, the PMV data, alongside cumulative heat consumption, reinforces the idea that comfort can be decoupled from constant thermal neutrality. By allowing occupants to adapt within a tolerable range and leveraging building design features like solar gain and controlled ventilation, N-Tech demonstrates a potentially more sustainable thermal strategy. It highlights the value of flexible systems that intelligently balance energy input with comfort outcomes, rather than prioritizing one at the expense of the other. To refine this analysis further, future studies should monitor indoor temperatures, system output levels, and occupant behavior in real time to understand the interplay between control, comfort, and consumption more precisely.
4.2. Life Cycle Analysis, GWP Comparison
To effectively compare the two ventilation strategies, it is essential to clarify the purpose and boundary conditions of the Life Cycle Analysis (LCA). In this analysis, the mechanical and natural ventilation systems represent the primary points of differentiation. However, as windows have been shown to significantly influence both energy demand and occupant comfort, they are also included in the evaluation. It is assumed that the frames, mullions, and other window components used in the manufacturing and disposal of each row are identical; therefore, these elements are excluded from the analysis. The primary difference in the window design is the area and number of panes used in the solution.
The assessment included data that showed the energy required to heat the building is ~20% less for the naturally ventilated system (N-Tech) compared to the mechanically ventilated system (M-Tech), based on the findings presented in the preceding chapter. This difference in energy consumption, when considering the average CO2 emissions extracted from district heating records in 2023 [46], corresponds to a reduction of 274 kg CO2-equivalent per year (M-tech; 1673, N-Tech; 1399 CO2 eq/year).
Each Genvex Eco 360 R unit is, according to their specifications, using between 100 and 180 Watt at average flow rates. When running 24/h, this equates to 876 to 1.577 kWh a year per unit. With six units, this was an average CO2 emission in 2023 of an additional 121 kg CO2-equivalent per year.
Although it is unlikely that the energy mix or climatic conditions will remain constant over the next 50 years, we can estimate that, if current usage patterns persist, the reduction in CO2 emissions attributable solely to heating would amount to approximately 13.7 t. of CO2-equivalent over that period for district heating, and 36.4 t. of CO2-equivalent for the electricity consumed by the six mechanical units over the same 50-year span. A more reasonable and conservative estimate would consider the expected gradual decarbonization of the energy sector. For example, if the carbon intensity of district heating were reduced by 50–75% over the next 30 years (given Denmark implements its own climate reduction plans as set out in their current national climate reduction law [47]). If driven by the increased integration of renewable energy and improved system efficiencies, the corresponding emissions savings would be approximately 4 to 5 t. of CO2-equivalent over the 50-year period for district heating alone. In a more optimistic scenario for the electricity mix (for supplying the electricity, not heating), with an 80–90% reduction in CO2 emissions over the next 50 years, the total net emissions from operating the mechanical ventilation system (M-Tech) would be reduced to approximately 10–12 t. of CO2-equivalents.
Even under these more conservative (and optimistic) and forward-looking assumptions, the analysis continues to demonstrate a significant long-term environmental benefit associated with the natural ventilation strategy. This reinforces its viability as a more sustainable approach in the context of life cycle environmental performance. Regarding upfront emissions and those associated with the replacement of system components, the results present a different picture. The building with natural ventilation was renovated with five NT1 units and seventeen NT2/3 units, and a total of 69.1 m2 of windows were replaced with high-transmittance two-layered glass. In contrast, the other building was equipped with six Genvex Eco 360 R units, and 71.8 m2 three-layered glass low-emissivity (low-e) windows were installed.
Assuming that the renovation processes for both rows are similar and therefore excluded from the analysis, and that emissions related to window frames are also disregarded, the total global warming potential (GWP) over a 50-year period, covering stages A1–A3, B4, and C2–C4, is estimated as follows:
- N-Tech: 6.9 (+/− 0.36) t. CO2 eqv
- M-Tech: 49.7 (+/− 0.79) t. CO2 eqv
This results in a net difference of 42.8 t. CO2-equivalent in favor of the natural ventilation solution (N-Tech). When the B6 phase (operational energy use) is also taken into account, an additional saving of approximately 10–12 t. CO2-equivalents (for running the mechanical system more than the N-Tech system) can be observed over the same 50-year period. Without any form of progressive energy mix changes, the savings are expected to build up to 56.5 t. CO2-equivalents, and normalized per m2 per year equate to GWP:
- N-Tech: 2.55 (+/− 0.59) CO2 eqv per m2/year
- M-Tech: 4.42 (+/− 0.96) CO2 eqv per m2/year
In total, the cumulative emissions savings from renovating with N-Tech amount to more than almost half the GWP of the mechanical systems combined with three-layered windows, even when including the discount for the very optimistic energy mix in the future. This result underscores the significant environmental advantage of more passive controlled natural ventilation over the mechanical ventilation alternative.
4.3. Capital Cost, Payback Period Comparison
The two buildings are analyzed for up-front costs and expected costs for maintenance, and replacements of subcomponents over a period of 50 y. Table 7 sums up the relevant differences in cost between N-Tech and M-Tech.
Table 7.
Overview of cost-related parameters.
The payback period is calculated with the energy savings before and after renovation. The two buildings were identical before the renovation procedure; their savings from the average heating consumption, in the period 2020–2021, were 86.7 MWh (average for all buildings in the period). This equates to 17.4 EUR/m2 per year, meaning that yearly savings amount to 8.9 EUR/m2 per year for N-Tech and 8.3 EUR/m2 per year for M-Tech.
The investment in N-Tech has a payback period of PBP (Equation (1))/DPBP (Equation (2)) of 2.8/9.0 years, whereas M-Tech has a period of 7.45/11.8 years. With a 5% discount rate over 50 years (typical for social housing), both N-Tech (IRR ≈ 35%) and M-Tech (IRR ≈ 13%) show up as attractive investments when measuring the Internal Rate of Return (IRR/Equation (3)). From a pure financial perspective, the cost of installing M-Tech far exceeds the N-Tech setup, with upfront costs being most dominant, but it is worthwhile to notice the “hidden” cost in maintenance and additional cost for the higher energy use.
5. Discussion
The results show that N-Tech provides a slightly looser, but still acceptable, thermal comfort profile, while consuming significantly less heating energy. The results show that N-Tech reduces energy consumption for heating by 20% when compared to M-Tech during the study period of one year. When it comes to the total global warming potential (GWP) for both systems over a 50-year period, the results show significant differences between systems, with the N-Tech system having 6.9 (+/− 0.36) t. CO2 eqv vs. M-Tech: 49.7 (+/− 0.79) t. CO2 eqv, resulting in a net difference of 42.8 t. CO2-equivalent in favor of the natural ventilation solution. When the operational energy use (B6 phase) is also taken into account, the results show an additional saving of approximately 10–12 t. CO2 eqv. Without any form of progressive energy mix changes, the savings normalized per m2 per year for N-Tech equate: 2.55 (+/− 0.59) CO2 eqv per m2/year, when compared with M-Tech: 4.42 (+/− 0.96) CO2 eqv per m2/year, resulting in a total reduction in GWP of 42%.
The results of the study show that N-Tech has a significantly lower installation cost (2.8 EUR/m2) when compared to M-Tech (5.3 EUR/m2), resulting in a reduction of 47% in installation costs mainly due to the much simpler system requiring fewer expert installation procedures and time.
The data also suggest that M-Tech achieves marginally better avoidance of thermal cold stress, especially in colder months, but at the cost of significantly higher energy use. The M-Tech outperforms the N-Tech in terms of delivering a continuous fresh air supply. With an average 2-sigma (97th percentile) below 1000 ppm, M-Tech guarantees a stable air exchange rate. However, in terms of average numbers, both systems are within the range of an acceptable indoor climate. Interestingly, the N-Tech varies more, also in the lowest percentile, meaning flow rates are often higher than the M-Tech can deliver, if the apartments had been used in the same manner. The trade-off challenges the assumption that mechanical ventilation with heat recovery is universally more efficient and emphasizes the importance of system integration, including passive design strategies, when evaluating building performance. While the data shows clear tendencies in all its analysis parameters, it is important to notice that this study is “only” performed on 2 × 8 apartments, and more data over longer periods of time may shift the results.
The analysis results of this study underscore the importance of integrating passive solar gains and adaptive ventilation control into building systems design. It also suggests that under certain climatic and usage conditions, a well-optimized natural ventilation system with intelligent controls can rival or even surpass mechanical systems in energy performance, despite having less efficient envelope components.
The study does not include advances in control systems able to dynamically respond to human needs or basic schedules. Other studies, e.g., [48], have shown the benefits of using demand-controlled ventilation systems, the importance of human detection systems, sensor controls, and model predictive control that can take weather forecasts into account. These advances in control strategies can be applied to both mechanical and naturally ventilated systems and may further improve either of the benefits laid out in this study. Another important final note is the recent review paper [49], which confirms the lack of studies, specifically addressing mechanical ventilation systems, and the impact this has against natural ventilation systems. There is little real-life recorded evidence that mechanical ventilation is superior to natural ventilation in aspects of comfort and energy demand. More real-life experimental setups that can compare best practices and innovative systems to one another outside a lab or simulated setting are rare, especially in cold and temperate climates.
6. Limitations of the Study
Although this study compares two identical buildings with different ventilation and window system designs over a one-year period (1 January 2023–31 December 2024), the results derive from apartments occupied by different residents. Consequently, the findings reflect not only the influence of the two ventilation systems and their respective heat and energy balances under varying glazing properties, but also the impact of differing user behaviors. Energy performance and derived impacts are therefore partly dependent on occupant habits.
The study did not attempt to record variations in occupant behavior and cannot determine how specific actions may have affected the results. However, as indicated in the Supplementary Materials, the data show considerable variance, suggesting differences in preferred setpoint temperatures and in manual window ventilation (possible in both buildings). This variation is not exclusive to either building or design strategy, as similar inconsistencies are observed across both cases. As a result, the uncertainty in air-change rates is likely increased by differences in building use, but we have not been able to say to what degree.
To mitigate such limitations, a follow-up study could include tracer gas measurements, behavioral monitoring (e.g., window-opening frequency and temperature preferences), and controlled measurements of air-change rates in unoccupied conditions. Extended monitoring over several years could further enhance understanding. Ideally, interchanging residents between the two buildings would allow for a more equitable comparison—though such an approach would be ethically and practically unfeasible.
Nonetheless, following identical apartments in the residential buildings over one year makes the results robust and representative for two “as built” scenarios in the real world, which is highly relevant, bridging the performance gap between estimated, calculated energy performance and real, measured energy consumption, when renovating existing buildings. This performance gap is often forgotten and/or neglected in calculations, estimations, and scientific lab tests.
The design requirements, such as setpoints and ventilation rates of both the mechanical and natural systems, have not been fully documented in this study, meaning that some systems may have been installed or operated suboptimally. Combined with variations in occupant behavior, this could have influenced the results. Nevertheless, the renovation procedures and operational data for both buildings were rigorously monitored and shared between the research team and the client at Munkevænget. To the researchers’ knowledge, no irregularities or deviations beyond standard installation practices were observed or reported.
Disadvantages expected from natural ventilation, such as air pollution from internal and external sources, acoustic pollution from the exterior, or long-term effects from the dynamics of moisture and water content in the filters, were not measured in this study. The NOTECH system provides both filtration of particles and reduction in outdoor noise, when compared to classic natural ventilation systems through façades; however, this was not monitored as part of this study.
While this study provides valuable insights into the performance of natural and mechanical ventilation systems in the real world, several limitations should be acknowledged. Firstly, the mechanical system calibrations and sensor placements were limited, which may have influenced measured airflows, temperatures, and indoor air quality data. A denser sensor network covering additional rooms and heights could provide a more detailed understanding of spatial variations. Second, the monitoring period covered only a one-year seasonal cycle, limiting the ability to capture year-to-year climatic variations or longer-term system drift. The study also lacked dedicated energy meters on the ventilation units and fine-grained sub-metering of radiator heating, making it difficult to separate ventilation-related energy consumption from overall heating demand. Third, the sample size was constrained to a limited number of apartments. A larger dataset would strengthen the generalizability of the results. In addition, microclimate measurements and occupant interviews would have provided valuable context for understanding any behavioral effects and perception of comfort. Finally, the study did not explore variations in the dimensioning and sizing of either ventilation system, which could influence both energy performance and indoor environmental quality. Addressing these limitations in future research would improve calibration accuracy, data resolution, and the overall reliability of comparisons between natural and mechanical ventilation strategies.
7. Conclusions
Based on a one-year comparative case study of two similar buildings, this article concludes that, in this specific case, passive-controlled natural ventilation can match the performance of mechanical ventilation in renovating existing buildings in temperate and cold climates. Contrary to preceding expectations, this study shows that a renovation strategy based on a passive-controlled natural ventilation system outperforms a mechanical ventilation strategy with heat recovery by 20% when it comes to energy consumption for room heating. Combining the effects of demand-controlled natural ventilation and two-layer high transmittance glazing, the NOTECH system shows significant benefits compared to the mechanical design strategy based on high efficiency heat recovery rates in combination with three-layer low-e glazing. When it comes to global warming potential, the natural ventilation strategy has at least a 42% reduced climate impact when compared to the mechanical counterpart. In terms of payback period, the mechanical ventilation strategy takes 7.45 years vs. 2.8 years for the demand-controlled natural ventilation strategy to return the investment. The mechanical ventilation strategy outperforms the natural system, delivering stable fresh air flow during the winter period, which results in better IEQ stats, such as 10.7% average lower CO2-concentrations and 35.5% fewer people expected to feel slight cold stress. In the summer period, the natural ventilation system showed slightly lower heat stress (PPD) and lower CO2-concentrations than the mechanical system. The study indicates that passive solar design strategies, particularly those employing high-transmittance double glazing, should be reconsidered and potentially reintroduced in renovation practice. Despite the study’s limited duration and scale, and the possibility of influence from user behavior or unintentional installation irregularities, the results point toward important performance benefits under real-life conditions. Passive solar gain can significantly reduce heating demand when combined with passive-controlled natural ventilation systems such as NOTECH. In contrast, low-transmittance triple glazing may reduce active cooling needs but limits the potential for passive solar gain during the transitional seasons.
Overall, the results highlight the importance of integrating ventilation, glazing, and daylight planning as interconnected design parameters, which can enhance both energy performance and indoor environmental quality. Buildings originally designed for natural ventilation should perhaps not be retrofitted with mechanical systems by default. Context-sensitive architectural solutions integrating natural ventilation and passive solar design may provide equal or even superior outcomes in terms of cost, comfort, daylight quality, energy performance, and global warming potential.
Supplementary Materials
The following supporting information can be downloaded at: https://www.mdpi.com/article/10.3390/air3040031/s1, M-tech 81-01237A5OB9DE4C59EE.pdf, M-tech 95-012332666FF72250EE.pdf, M-tech 105-01230C7A7OCE275AEE.pdf, M-tech 111-123847CEBCCDB5AEE.pdf, N-tech 63-0123A5E47088D66EEE.pdf, N-tech 65-0123DA7A0093A948EE.pdf, N-tech 73-0123536AF8103EA2EE.pdf, N-tech 75(ryger)-012364AC66AFC8COEE.pdf.
Author Contributions
Conceptualization, C.V. and K.N.; methodology, C.V. and K.N.; data curation, 1 January 2023–31 December 2024; writing—original draft preparation, C.V. and K.N.; writing—review and editing, C.V. and K.N.; visualization, C.V. and K.N. All authors have read and agreed to the published version of the manuscript.
Funding
This research received no external funding.
Institutional Review Board Statement
Not applicable.
Informed Consent Statement
Not applicable.
Data Availability Statement
The original contributions presented in this study are included in the article/Supplementary Materials. Datasets can be sent per request to the first author.
Use of Artificial Intelligence
AI or AI-assisted tools were not used in drafting any aspect of this manuscript. AI tools have been used to structure tables and figures.
Acknowledgments
The authors would like to thank and acknowledge Stefan Vestergaard at Alfabo and Rambøll A/S for sharing data and helping the authors during the process, from the early start of the project, the implementation of systems on site at Munkevænget 63–111 in Kolding, Denmark, the workshops with architects and engineers, the meeting with residents, and the collection of data in the test apartments, as well as providing incurred expenses and costs for both systems, maintenance, etc. During the preparation of the study, the authors used the programs Ladybug tools for the purposes of modeling the PMV comfort parameters. The authors have reviewed and edited the output and take full responsibility for the content of this publication.
Conflicts of Interest
The authors declare no conflicts of interest. This study was carried out in a close collaboration with Alfabo. Alfabo had no role in the design of the study; in the collection, analyses, or interpretation of data; in the writing of the manuscript; or in the decision to publish the results. As an architect, Carlo Volf designed and developed the system NOTECH together with the Technological Institute, and together with commercial partners WindowMaster and Skjern Vinduer. In his role and in this process, Carlo Volf was a researcher and a project leader of this separate research developing project, funded by Green Power Denmark in 2021. Kristoffer Negendahl works as an engineer at Danish Technical University and, during this project, he collected and analyzed the data in the study.
Abbreviations
The following abbreviations are used in this manuscript:
| IEQ | Indoor environmental quality |
| GWP | Global warming potential |
| PBT | Payback time |
| PV | Photovoltaics |
| GHGPBT | Green house gas protocol payback time |
| CAV | Constant air ventilation |
| VAV | Variable air ventilation |
| U-value | Thermal transmittance (W/m2 K) |
| SHGC | Solar heat gain coefficient (%) |
| PBP | Payback period |
| PPD | Percentage of people dissatisfied |
| PMV | Predicted mean vote |
| LCA | Life cycle analysis |
| LCI | Life cycle inventory |
Appendix A
Table A1.
Table showing building ID, System ID and IEQ indicators per apartment unit.
Table A1.
Table showing building ID, System ID and IEQ indicators per apartment unit.
| Building/Tech | ID | Key Numbers |
|---|---|---|
| A/N-Tech | A1 | PPD: 12.7 Neutral: 47.8% Slight Heat Stress: 1.4% Slight Cold Stress: 50.8% CO2 PPM (2σ,avg, −2σ): 541, 798, 1522 |
| A/N-Tech | A2 | PPD: 22.2 Neutral s: 25.6% Slight Heat Stress: 3.1% Slight Cold Stress: 71.4% CO2 PPM (2σ,avg, −2σ): 449, 710, 1169 |
| A/N-Tech | A3 | PPD: 10.4 Neutral: 61.6% Slight Heat Stress: 0.6% Slight Cold Stress: 37.7% CO2 PPM (2σ,avg, −2σ): 449, 777, 1351 |
| A/N-Tech | A4 | PPD: 13.4 Neutral: 43.9% Slight Heat Stress: 1.5% Slight Cold Stress: 54.6% CO2 PPM (2σ,avg, −2σ): 473, 993, 1787 |
| B/M-Tech | B1 | PPD: 12.8 Neutral: 51.7% Slight Heat Stress: 0% Slight Cold Stress: 48.3% CO2 PPM (2σ,avg, −2σ): 462, 656, 880 |
| B/M-Tech | B2 | PPD: 12.9 Neutral: 35.9% Slight Heat Stress: 1.8% Slight Cold Stress: 62.2% CO2 PPM (2σ,avg, −2σ): 554, 807, 1067 |
| B/M-Tech | B3 | PPD: 8.7 Neutral: 76.1% Slight Heat Stress: 12.1% Slight Cold Stress: 11.8% CO2 PPM (2σ,avg, −2σ): 538, 741, 943 |
| B/M-Tech | B4 | PPD: 7.3 Neutral: 91.8% Slight Heat Stress: 2% Slight Cold Stress: 6.2% CO2 PPM (2σ,avg, −2σ): 485, 632, 779 |
| A/N-Tech | Average, A1–A3 | Avg PPD: 14.7 Avg Neutral: 44.7% Avg Slight Heat Stress: 1.7% Avg Slight Cold Stress: 53.6% CO2 PPM (2σ,avg, −2σ): 478, 820, 1457 |
| B/M-Tech | Average, B1–B4 | Avg PPD: 10.4 Avg Neutral: 63.9% Avg Slight Heat Stress: 4.0% Avg Slight Cold Stress: 18.1% CO2 PPM (2σ,avg, −2σ): 510, 732, 917 |
References
- European Commission. Comprehensive Study of Building Energy Renovation Activities and the Uptake of Nearly Zero-Energy Buildings in the EU; European Commission: Brussels, Belgium, 2019.
- European Commission. Renovation Wave. 2025. Available online: https://energy.ec.europa.eu/topics/energy-efficiency/energy-efficient-buildings/renovation-wave_en (accessed on 15 April 2025).
- European Parliament and Council. Directive (EU) 2024/1275 of 24 April 2024 on the Energy Performance of Buildings (Recast) (Text with EEA Relevance). 2024. Available online: https://eur-lex.europa.eu/eli/dir/2024/1275/oj/eng (accessed on 15 April 2025).
- Volf, C. Light, Air and Natural Surroundings—Different Hospital Typologies. In Proceedings of the ARCH 17: 3rd International Conference on Architecture, Research, Care and Health, Copenhagen, Denmark, 26–28 April 2017; Aalborg University’s Research Portal: Aalborg, Denmark, 2017; pp. 203–226. [Google Scholar]
- Zimmermann, R.K.; Andersen, C.M.E.; Kanafani, K.; Birgisdottir, H. SBI 2020:04—Klimapåvirkning fra 60 Bygninger—Muligheder for Udformning af Referenceværdier til LCA for Bygninger; Statens Byggeforskningsinstitut: Hørsholm, Denmark, 2020. [Google Scholar]
- Bygningsreglementet. BR18, §298. 2020. Available online: https://www.bygningsreglementet.dk/Tekniske-bestemmelser/11/Krav/297_298#:~:text=Klimap%C3%A5virkningen%20skal%20opg%C3%B8res%20i%20kg%20CO2-%C3%A6kvivalenter%20pr.%20m2,-%20Vurdering%20af%20bygningers%20milj%C3%B8m%C3%A6ssige%20kvalitet%20-%20Beregningsmetode (accessed on 15 April 2025).
- Schnieders, J.; Hermelink, A. CEPHEUS results: Measurements and occupants’ satisfaction provide evidence for Passive Houses being an option for sustainable building. Energy Policy 2006, 34, 151–171. [Google Scholar] [CrossRef]
- Chung, K.C.; Hsu, S.P. Effect of ventilation pattern on room air and contaminant distribution. Build. Environ. 2001, 36, 989–998. [Google Scholar] [CrossRef]
- Novoselac, A.; Srebric, J. Comparison of air exchange efficiency and contaminant removal effectiveness as IAQ indices. ASHRAE Trans. 2003, 109, 339–349. [Google Scholar]
- Wolkoff, P.; Kjærgaard, S.K. The dichotomy of relative humidity on indoor air quality. Environ. Int. 2007, 33, 850–857. [Google Scholar] [CrossRef] [PubMed]
- Byggeindustrien. Innlegg: VVS—Den Skjulte Klimakjempen—Hvorfor vi må Kutte Utslippene Fra VVS Raskt. Available online: https://www.bygg.no/innlegg-vvs-den-skjulte-klimakjempen-hvorfor-vi-ma-kutte-utslippene-fra-vvs-raskt/2330913 (accessed on 15 April 2025).
- European Parlement and Council. Commission Regulation (EU) 2024/1781 of 13 June 2024, Establishing a Framework for Setting Ecodesign Requirements for Sustainable Products and Repealing Directive 2009/125/EC (Ecodesign for Sustainable Products Regulation). Official Journal of the European Union, L 202. Available online: https://eur-lex.europa.eu/legal-content/EN/TXT/?uri=CELEX:32024R1781 (accessed on 15 April 2025).
- Volf, C.; Petersen, P.M.; Thorseth, A.; Vestergaard, S.; Martiny, K. Daylight quality: High-transmittance glass versus low transmittance glass—Effects on daylight quality, health, comfort and energy consumption. Ann. Med. 2024, 56, 2297273. Available online: https://www.tandfonline.com (accessed on 15 April 2025). [CrossRef] [PubMed]
- Angelopoulos, C.; Cook, M.; Iddon, C.; Porritt, S. Evaluation of Thermal Comfort in Naturally Ventilated School Classrooms During the Heating Season Using CFD; Loughborough University: Loughborough, UK, 2017; Available online: https://publications.ibpsa.org/conference/paper/?id=bs2017_128 (accessed on 5 September 2023).
- Gil-Baez, M.; Barrios-Padura, Á.; Molina-Huelva, M.; Chacartegui, R. Natural ventilation systems to enhance sustainability in buildings: A review towards zero energy buildings in schools. E3S Web Conf. 2017, 22, 00053. [Google Scholar] [CrossRef]
- European Union. Commission Regulation (EU) No 1253/2014. 2014. Available online: https://eur-lex.europa.eu/legal-content/EN/TXT/?uri=CELEX%3A32014R1253 (accessed on 15 April 2025).
- Bygningsreglementet. BR18, §443, Paragraph 2. 2020. Available online: https://www.bygningsreglementet.dk/tekniske-bestemmelser/22/vejledninger/version-2-generel_vejledning/kap-1_5/ (accessed on 15 April 2025).
- Bygningsreglementet. BR18, §443, Subsection 3. 2020. Available online: https://www.bygningsreglementet.dk/Tekniske-bestemmelser/22/Krav/443_446 (accessed on 15 April 2025).
- Huang, H.; Wan Mohd Nazi, W.I.B.; Yu, Y.; Wang, Y. Energy performance of a high-rise residential building retrofitted to passive building standard—A case study. Appl. Therm. Eng. 2020, 181, 115902. [Google Scholar] [CrossRef]
- AlFaris, F.; Juaidi, A.; Manzano-Agugliaro, F. Energy retrofit strategies for housing sector in the arid climate. Energy Build. 2016, 131, 158–171. [Google Scholar] [CrossRef]
- Hu, X.; Xiang, Y.; Zhang, H.; Lin, Q.; Wang, W.; Wang, H. Active–passive combined energy-efficient retrofit of rural residence with non-benchmarked construction: A case study in Shandong province, China. Energy Rep. 2021, 7, 1360–1373. [Google Scholar] [CrossRef]
- Amoah, B.O.K.; Nguyen, V.T.; Najafi, H. A multi-facet retrofit approach to improve energy efficiency of existing class of single-family residential buildings in hot-humid climate zones. Energies 2020, 13, 1178. [Google Scholar] [CrossRef]
- Ji, Y.; Li, G.; Su, F.; Chen, Y.; Zhang, R. Retrofit analysis of city-scale residential buildings in the hot summer and cold winter climate zone. Energies 2023, 16, 6152. [Google Scholar] [CrossRef]
- Han, T.; Liu, P.; Niu, C.; Li, Q. Evaluation of energy-saving retrofit projects of existing rural residential envelope structures from the perspective of rural residents: The Chinese case. Environ. Dev. Sustain. 2023, 25, 8419–8446. [Google Scholar] [CrossRef]
- Kadrić, D.; Aganovic, A.; Martinović, S.; Delalić, N.; Delalić-Gurda, B. Cost-related analysis of implementing energy-efficient retrofit measures in the residential building sector of a middle-income country—A case study of Bosnia and Herzegovina. Energy Build. 2022, 257, 111765. [Google Scholar] [CrossRef]
- Huang, Y.; Niu, J.-L.; Chung, T.-M. Energy and carbon emission payback analysis for energy-efficient retrofitting in buildings—Overhang shading option. Energy Build. 2012, 44, 94–103. [Google Scholar] [CrossRef]
- Malode, S.; Prakash, R.; Mohanta, J.C. Sustainability assessment of rooftop solar photovoltaic systems: A case study. Environ. Impact Assess. Rev. 2024, 108, 107609. [Google Scholar] [CrossRef]
- Rehman, O.A.; Palomba, V.; Frazzica, A.; Cabeza, L.F. Analysis of a heat pump-based energy system exploiting a low GWP refrigerant in different European climates. E3S Web Conf. 2023, 414, 03012. [Google Scholar] [CrossRef]
- Gigasari, A.R.; Cárcel-Carrasco, J.; Iglesias, L.M.P.; Amani, N. Evaluating carbon payback time by optimizing insulation materials for different orientations: A cradle-to-gate life cycle assessment. Energy Environ. 2025, 36, 1290–1308. [Google Scholar] [CrossRef]
- Tremeac, B.; Meunier, F. Life cycle analysis of 4.5 MW and 250 W wind turbines. Renew. Sustain. Energy Rev. 2009, 13, 2104–2110. [Google Scholar] [CrossRef]
- ISO 14040:2006; 2006 Environmental Management—Life Cycle Assessment—Principles and Framework. International Organization for Standardization: Geneva, Switzerlan, 2006. Available online: https://www.iso.org/standard/37456.html (accessed on 15 April 2025).
- EN 15978:2011; Sustainability of Construction Works. Assessment of Environmental Performance of Buildings. Calculation Method. CEN: Brussels, Belgium, 2011. Available online: https://webshop.ds.dk/standard/M240512/ds-en-15978-2012 (accessed on 15 April 2025).
- Southall, R.G. An assessment of the potential of supply-side ventilation demand control to regulate natural ventilation flow patterns and reduce domestic space heating consumption. Energy Build. 2018, 168, 201–214. [Google Scholar] [CrossRef]
- Zhang, W.; Wu, W.; Yan, B.; Malkawi, A. Applying machine learning for building natural ventilation control. In Proceedings of the 16th Conference of the International Society of Indoor Air Quality and Climate: Indoor Air, Seoul, Republic of Korea, 20–24 July 2020. [Google Scholar]
- Hamada, A.A.; Hong, S.; Mumovic, D.; Raslan, R. Towards healthy and energy-efficient buildings in the context of Egypt: Modelling demand-controlled ventilation to improve the indoor air quality in a generic office space in Cairo. J. Phys. Conf. Ser. 2023, 2600, 102017. [Google Scholar] [CrossRef]
- Scheuring, L.; Weller, B. Energy-efficient controlled natural ventilation in nonresidential buildings—Experimental investigation of opening durations. Bauphysik 2021, 43, 113–124. [Google Scholar] [CrossRef]
- METRO THERM, ECO 360 R ventilationsanlæg. Available online: https://www.genvex.com/produkter/ventilationsanlaeg/eco-360-r-ventilationsanlaeg (accessed on 15 April 2025).
- Leapcraft. Wireless Sensor from Leapcraft. Available online: https://www.leapcraft.com (accessed on 15 April 2025).
- NOTECH. Fuldskala Afprøvning og Dokumentation af NOTECH-Systemet i en Skoleklasse, og i Lab på TI. Available online: https://realdania.dk/publikationer/faglige-publikationer/notech (accessed on 15 April 2025).
- Bygningsreglementet. BR18 General Requirements for Mechanical Systems. 2020. Available online: https://www.bygningsreglementet.dk/tekniske-bestemmelser/22/krav/421_429/#78c2af6e-fe56-4728-8249-a612cc4289d3 (accessed on 15 April 2025).
- Ökobau.dat: 8.2.01 Building Service Engineering/Air Conditioning and Ventilation/Ventilation System UUID: 690f1fb5-b209-4530-8b5e-2ca5acfe30d2. Available online: https://oekobaudat.de/OEKOBAU.DAT/datasetdetail/process.xhtml?uuid=690f1fb5-b209-4530-8b5e-2ca5acfe30d2&version=20.24.070&stock=OBD_2024_I&lang=en (accessed on 15 April 2025).
- Ökobau.dat: 8.2.03 Building Service Engineering/Air Conditioning and Ventilation/Accessory UUID: 40edb030-3b81-47f6-a24f-acd8b2be0d20. Available online: https://oekobaudat.de/OEKOBAU.DAT/datasetdetail/process.xhtml?uuid=40edb030-3b81-47f6-a24f-acd8b2be0d20&version=20.24.070&stock=OBD_2024_I&lang=en (accessed on 15 April 2025).
- Søuld/Eelgrass. Available online: https://www.sould.dk/performance (accessed on 15 April 2025).
- Ökobau.dat: 7.1.05 Components for Windows and Curtain Walls/Frames/Profiles/Aluminium UUID: d0e0f205-2f4d-4c7f-b63a-23a9abd6e60a. Available online: https://oekobaudat.de/OEKOBAU.DAT/datasetdetail/process.xhtml?uuid=d0e0f205-2f4d-4c7f-b63a-23a9abd6e60a&version=20.24.070&stock=OBD_2024_I&lang=en (accessed on 15 April 2025).
- Ökobau.dat: 7.2.01 Components for Windows and Curtain Walls/Infill/Transparent Infill. Available online: https://oekobaudat.de/OEKOBAU.DAT/datasetdetail/process.xhtml?uuid=ba58d8b9-945b-4428-b4e0-aecda8b3df18&version=20.24.070&stock=OBD_2024_I&lang=en (accessed on 15 April 2025).
- Danish Energy Agency. Available online: https://ens.dk/analyser-og-statistik/noegletal-om-energiforbrug-og-forsyning (accessed on 15 April 2025).
- Danish Law on Environmental Impact of Buildings. Available online: https://www.retsinformation.dk/eli/lta/2021/2580 (accessed on 15 April 2025).
- Borodinecs, A.; Zemitis, J.; Palcikovskis, A. HVAC System Control Solutions Based on Modern IT Technologies: A Review Article. Energies 2022, 15, 6726. [Google Scholar] [CrossRef]
- Sara, A. Sharbaf, Patricia Schneider-Marin, Cost-benefit analysis of sustainable upgrades in existing buildings: A critical review. Energy Build. 2025, 328, 115142. [Google Scholar] [CrossRef]


Disclaimer/Publisher’s Note: The statements, opinions and data contained in all publications are solely those of the individual author(s) and contributor(s) and not of MDPI and/or the editor(s). MDPI and/or the editor(s) disclaim responsibility for any injury to people or property resulting from any ideas, methods, instructions or products referred to in the content. |
© 2025 by the authors. Licensee MDPI, Basel, Switzerland. This article is an open access article distributed under the terms and conditions of the Creative Commons Attribution (CC BY) license (https://creativecommons.org/licenses/by/4.0/).