Abstract
Flow cytometry is widely applied to infer the ploidy and genome size (GS) of plant nuclei. The conventional approach of sample preparation, reliant on fresh plant material to release intact nuclei, often results in poor yields of nuclei in conditions when a plant material cannot be kept fresh due to logistical constraints. Previous attempts to use frozen plant material were mainly limited to ploidy analysis and relied on chopping methods, which restrict the material input and often result in poor nuclei yield, especially in frozen samples, due to incomplete disruption. Here, we present a modified protocol for GS estimation using frozen plant material that facilitates larger volumes of tissue to be processed while improving debris removal. Nuclei isolated from this protocol can also be used for DNA or RNA extraction. Genome size estimates from frozen material are similar to those from fresh material, with a reduction in error range, although not always significant (p > 0.05). In certain species, frozen samples can yield substantially more nuclei than fresh material. With the addition of specific debris compensation algorithms, coefficient of variation (CV%) can be maintained below 5%. This method has special value in estimating the GS of samples collected from remote locations and frozen for use in plant genome sequencing. Freezing preserves high-quality DNA and RNA, enabling the same sample to be used for both flow cytometry and genome sequencing.
Keywords:
flow cytometry; FCM; genome size; picograms; plant genome; frozen plant material; nuclei isolation 1. Introduction
Flow cytometry (FCM) is widely used to estimate genome size (GS) and ploidy in plants. The method involves the preparation of a suspension of intact nuclei, labeling the nuclei with a fluorochrome that binds to nucleotides, and measuring the fluorescence intensity of each nucleus [1,2]. The conventional method for sample preparation involves releasing intact nuclei by chopping fresh plant material in a compatible buffer [1,2]. Leaf material is always co-chopped with another plant species of known GS and ploidy, to calculate the relative difference in fluorescence and hence GS [1,2,3]. Genome size is expressed and measured as a “C-value”, which is the entire DNA content of a nucleus [4]. The DNA content of a haploid nucleus, in its unreplicated state, is referred to as the ‘1C-value’, and it is measured in units of picograms (pg) or million base pairs (Mbp) [4,5]. One picogram of DNA is equivalent to 978 Mbp [5].
It is becoming more common to use FCM to estimate GS prior to sequencing plant genomes [2,6]. In instances where plant materials are sourced from remote and geographically distant locations, the challenge arises in maintaining the freshness of the specimens over extended periods. The inherent difficulty in preserving plant material under such conditions renders it impractical for prolonged storage, consequently impeding the feasibility of GS estimation. The logistical constraints pose a significant obstacle to the preservation of plant material integrity, thereby limiting the scope and reliability of plant material for FCM [7]. A few studies have previously used fixed material, either ethanol preserved, paraffin fixed, or frozen material for ploidy and GS estimation of plants [8,9,10,11,12,13,14,15,16]. Despite this, preserved plant material is not generally used for FCM in the estimation of ploidy and GS due to the potential effect of the preservation method on fluorescence [2,7]. Frozen plant tissue has shown potential for ploidy analysis; however, its application in GS estimation remains limited due to challenges such as increased debris and higher coefficients of variation (CV), which may affect measurement accuracy [10,11]. These concerns are primarily based on qualitative observations, including poor histogram resolution, excessive debris [11], and high CV values [10], which have discouraged its use for GS estimation. Notably, these evaluations lacked direct statistical comparisons with fresh tissue; thus, the suitability of frozen plant material for GS estimation remains uncertain.
To address issues related to lower nuclei yield, maintain CV values within acceptable range and, most importantly, evaluate if GS estimates from frozen material are comparable to those from fresh material, this study presents a novel protocol for nuclei isolation from frozen plant material. Unlike earlier attempts that relied on chopping frozen material, which often resulted in incomplete disruption and low nuclei yield, this method allows the use of larger volumes of frozen plant material for GS estimation. This method is based on protocols originally developed for the extraction of high-quality DNA from frozen material [17,18,19]. It involves homogenization of plant material through physical disruption (grinding and blending) and chemical disintegration of the cell wall (by detergents and buffers) to isolate intact nuclei [17,18,19]. Depending on leaf chemistry, this can facilitate the use of larger amounts of leaf material for higher nuclei yield, as mechanical homogenization allows efficient processing of bulk tissue, overcoming the volume limitations associated with manual chopping. This improves sample throughput and ensures sufficient nuclei for both genome size estimation and downstream DNA extraction. The combination of several washing steps, use of buffers, filtration, and centrifugation in this method helps to eliminate debris in the form of intact cells and tissue residues [19]. Furthermore, with the use of debris compensation algorithms [9,20], the impact of debris on peak resolution and CV% can be minimized. The proposed method can complement genome studies where plant material is frozen for sequencing purposes. Extracting DNA from isolated intact nuclei minimizes the presence of cellular contaminants, thereby improving DNA purity and integrity [18,19,21], which is an essential requirement for long-read sequencing platforms [22,23].
The method reported here was applied to four plant species and fluorescence parameters were compared for the nuclei isolated from frozen and fresh preparations. The fluorescence data from both preparations were subjected to the conventional histogram analysis and debris-compensated peak modeling approach to assess the accuracy of GS estimates.
2. Materials and Methods
2.1. Plant Material
Four species, Adenanthos sericeus var. sericeus Labill., Hollandaea sayeriana (F. Muell.) L.S.Sm., Macadamia tetraphylla L.A.S. Johnson, and Macadamia jansenii C.L. Gross & P.H. Weston, with GS varying approximately 2.5 times within the same plant family, were selected for comparison of fresh and frozen methods [24,25]. Information about the chromosome number, ploidy, genome size, and whole genome sequence for all species was retrieved from the literature [25,26,27,28,29,30]. Young plants of H. sayeriana and A. sericeus were sourced from local nurseries and kept in glasshouse conditions at the University of Queensland. Leaf material for M. tetraphylla and M. jansenii was collected from Mt Coot-tha Botanical Gardens, Brisbane. Oryza sativa subsp. japonica cv. ‘Nipponbare’ (1C = 388.8 Mbp/0.397 pg) [3,31] was used as the internal standard and grown in glasshouse conditions at the University of Queensland. Nipponbare rice is one of the commonly used internal with a verified genome size [3]. In addition, high-quality genome assemblies are available for this cultivar [31,32,33], further supporting its use in GS estimation studies.
2.2. Pretreatment of Leaf Material
For frozen preparations, sufficient liquid nitrogen and dry ice were carried during field sample collection to prevent thawing, ensuring the leaves were safely transported back to the lab and stored in a −80 °C freezer to maintain sample integrity. Young, fully expanded, healthy leaves of the plants were collected in labeled perforated plastic bags. Each bag contained two water-resistant and frost-resistant labels. After collection of leaves, bags were secured with rubber bands. To minimize physical damage to the leaves, the wrapped bags were promptly snap-frozen in liquid nitrogen, ensuring freezing was complete when bubbling ceased and stabilized. The bags were promptly stored in dry ice and transported to the lab, where they were kept in a −80 °C freezer until being processed for nuclei isolation. For fresh preparations, fresh, fully expanded young leaves were sampled in a plastic bag with a moist paper towel and processed for nuclei isolation on the same day of the collection.
2.3. Reagents and Buffers
- Woody plant buffer (WPB) [as per 25,34]: 0.2 M Trizma hydrochloride (Sigma, Merck Life Science Pty Ltd., Bayswater, VIC, Australia, Product No. 93363-50G), 0.04 M Magnesium chloride hexahydrate (Sigma, Merck Life Science Pty Ltd., Bayswater, VIC, Australia, M2670-100G), 0.02 M ethylene diamine tetra acetic acid disodium salt dihydrate (EDTA.Na2, Chem Supply Australia, Gillman, SA, Australia, Product code: Product code: EA023-500G), 86 mM Sodium chloride (Sigma, Merck Life Science Pty Ltd., Bayswater, VIC, Australia, Product No. 71380-500G), 10 mM Sodium metabisulfite (Sigma, Merck Life Science Pty Ltd., Bayswater, VIC, Australia, S9000-500G), 1% Triton X-100 (Chem Supply Australia, Gillman, SA, Australia, Product code: TL125-P), UltraPure DNase/RNase free distilled water (Invitrogen, Thermo Fisher Scientific Inc., Waltham, MA, USA, Cat. No. 10977-015, 300 mL), 3% Polyvinylpyrrolidone-10 (Sigma, Merck Life Science Pty Ltd., Bayswater, VIC, Australia, Product No. PVP10).
- Staining buffer (20 µL per 400 µL of sample): 100 µL propidium iodide (PI, 1 mg/mL, Sigma, Merck Life Science Pty Ltd., Bayswater, VIC, Australia, Product ID P4864-10ML), 1 µL of RNase 10 mg/mL (Stock Solution 20mg/mL, Invitrogen, Thermo Fisher Scientific Inc., Waltham, MA, USA, Cat. No. 12091021). The buffer was kept on ice and covered with aluminum foil due to the light-sensitive nature of PI.
- 10× Homogenization buffer (HB) for frozen preparations: 0.1 M Trizma Base (Sigma, Merck Life Science Pty Ltd., Bayswater, VIC, Australia, Product No. 93362-500G), 0.8 M Potassium chloride (Chem Supply Australia, Gillman, SA, Australia, Product code: PA054-500G), 0.1 M ethylene diamine tetra acetic acid (Sigma, Merck Life Science Pty Ltd., Bayswater, VIC, Australia, Product No. E6758-500G), 17 mM spermidine (Sigma, Merck Life Science Pty Ltd., Bayswater, VIC, Australia, Product No. 85558-5G), 17 mM spermine (Sigma, Merck Life Science Pty Ltd., Bayswater, VIC, Australia, Product No. 85590-5G), 10 M NaOH (Chem Supply Australia, Gillman, SA, Australia, Product code: SA178) to adjust pH to 9. The solution can be stored in a glass bottle at 4 °C for up to one year.
- 100 mL Triton sucrose buffer (TSB) for frozen preparations: Triton X-100 (20%), 10× HB (10%), 0.5 M sucrose (Sigma, Merck Life Science Pty Ltd., Bayswater, VIC, Australia, Product No. S0389-500G), volume was made up to 100 mL with distilled water. The solution can be stored in a glass bottle at 4 °C for up to one year.
- 1000 mL 1× Homogenization buffer (HB) for frozen preparations: 10× HB (10%), Sucrose (0.5 M). Volume was made up to 1 L with distilled water.
- 50 mL/sample Nuclei Isolation Buffer (NIB) for frozen preparations: 1× HB (48.75 mL), TSB (1.25 mL), 0.5gm polyvinylpyrrolidone-360 (Sigma, Merck Life Science Pty Ltd., Bayswater, VIC, Australia, Product No. PVP360-100G). Add 125 µL of 2-mercaptoethanol (Sigma, Merck Life Science Pty Ltd., Bayswater, VIC, Australia, Product No. 63689-100ML-F) before use and keep NIB on ice.
2.4. Equipment
2.4.1. For Fresh Preparations
A 47 mm diameter Petri dish (Advantec MFS Inc, Dublin, CA, USA, Product ID PD-47A, 42004A00), single-edge razor blades (Personna, Shelton, CT, USA, Product ID 94-120-2), 40 µm polypropylene framed cell strainers (Biologix Corporation, Jinan, Shandong, China, Product ID 15-1040), 5 mL (12 × 75 mm) polystyrene round bottom tubes (Corning Life Sciences, Tewksbury, MA, USA, Product ID 0587866).
2.4.2. For Frozen Preparations
Sterilized mortar and pestle, refrigerated centrifuge equipped with fixed angle rotor (Sigma Laborzentrifugen GmbH, Osterode am Harz, Germany, Model 4-16K), Steriflip vacuum-driven filtration system with a 20 µm nylon net filter (Merck Millipore, Cat. no. SCNY00020), 40 µm polypropylene framed cell strainers (Biologix Corporation, Jinan, Shandong, China, Product ID 15-1040), Pasteur pipettes (20 µL, 200 µL, 1000 µL, 5000 µL), 50 mL conical bottom centrifuge tubes (Corning Life Sciences, Tewksbury, MA, USA, Product ID 430304), 1.5 mL microfuge tubes, 5 mL (12 × 75 mm) polystyrene round bottom tubes (Corning Life Sciences, Tewksbury, MA, USA, Product ID PID0587866).
2.5. Nuclei Isolation
For fresh preparations, a one-step protocol was used as described in Doležel, Greilhuber and Suda [2]. For each replicate, 40 mg of young fully expanded leaves of the test species was co-chopped with 15 mg of the internal standard (O. sativa) in a petri dish using a single-edge razor blade in 500 µL ice-cold modified woody plant buffer (WPB) [25,34]. The homogenate was filtered through a pre-soaked 40 µm nylon filter [2]. A 20 µL measure of staining buffer (containing 100 µL of propidium iodide (1 mg/mL) and 1 µL of RNase (1 mg/µL) were added to 400 µL of nuclei filtrate, and the sample was kept on ice until processed.
For frozen leaf material, the nuclei extraction method [19] was followed with modifications for this study. The detailed protocol is provided in the Supplementary Materials (Supplementary Note). In summary, 2 gm of frozen leaf tissue (including 10% internal standard) was ground in a pre-cooled mortar with liquid nitrogen for approximately 5 min until a fine powder was obtained. The homogenized tissue was suspended in ice-cold nuclei isolation buffer (NIB), mixed gently, and filtered through a 20 µm vacuum filter. This filtrate was centrifuged at 7000× g for 20 min at 4 °C (or 3000 g for species with GS > 1000 Mbp). The resulting pellet was washed two additional times with NIB using identical centrifugation conditions to reduce cytoplasmic debris. Nuclei were finally resuspended in 500 µL of ice-cold modified WPB, filtered through a 40 µm nylon filter, stained with propidium iodide, and treated with RNase before flow cytometric analysis.
2.6. Flow Cytometry
Nuclei labeled with propidium iodide were excited by a blue laser (488 nm) and fluorescence was measured with a detector configured with a 695/40 nm bandpass filter on the Becton Dickinson LSR Fortessa X20 Cell Analyzer (BD Biosciences, San Jose, CA, USA). Fluorescence data were recorded on a linear scale of 256 channels [35]. The leading trigger threshold was set to 5000. Fluorescence data for 400 µL of nuclei suspension were acquired for 20 min at a low rate (12 µL/min), which delivered 10–20 events/s for fresh preparations and 100–150 events/s for frozen preparations. Post-acquisition amplification of the signal was acquired by setting the forward scatter (FSC) detector voltage/gain to 320, side scatter (SSC) detector voltage to 179, and fluorescence detector voltage to 488 to position the internal standard peak at 1/5 of the distance from the left end of the x-axis [35]. Forward scatter and side scatter were recorded on a logarithmic scale and used to identify the fluorescence peak. Instrument settings, including voltages and flow rates, were kept constant throughout the experiment. All replicates were prepared and analyzed on the same day to avoid technical variation caused by instrument drift. Additional quality control steps included maintaining consistent sample-to-standard ratios [36], filtering freshly prepared buffers to reduce particulates, and performing staining procedures in low-light conditions to prevent fluorochrome degradation [37]. Prior to fluorescence measurements, nuclear integrity was verified by fluorescence microscopy to confirm suitability for flow cytometric analysis. Nuclear integrity was assessed using a LEICA M205 FA fluorescent dissection microscope (Leica Microsystems Pty Ltd., Wetzlar, Germany) equipped with a DMC450 camera (Serial No. 0067500217). Imaging was performed at 94.8× magnification with a field of view (FOV) of 2.43 mm. For bright field (BF) imaging, exposure was set to 5 ms, TL brightness at 60%, and nA illumination at 100%. For the RFP-LP fluorescence channel, exposure was set to 400 ms, using the RFP-LP filter, with FIM at 100%. Images were acquired in black and white mode at a resolution of 1.2 MP (1290 × 960 pixels), with a binning of 2 × 2, and digital zoom at 0.8×. Live format settings matched acquisition resolution (1280 × 960 pixels, bin 2 × 2). Gain was set to 1.5, digital magnification to 1×, and iris control to 53%.
2.7. Conventional Histogram Analysis
For conventional histogram analysis, gating based on pulse analysis was used to separate single particles from aggregates in BD FACS DIVA software (v 8.0). Fluorescence pulse width on the y-axis was plotted against fluorescence pulse height on the x-axis to remove aggregates and debris (Figures S2, S4, S6, S8, S10, S12, S14 and S16). By consistent manual gating of the plot, we manually removed debris from all replicates of each species to identify sample peaks. For gating of the sample peaks, our strategy was to select events in the middle of the population distribution, aiming to capture the most representative and homogenous portion of the population. The recommended limit of CV (i.e., <5%) was also considered for gating of the histograms [38]. In addition, considering the debris level, minimum requirements for accurate GS estimation were followed as 2000 events in total and 600 events per peak [35]. However, despite the lower event count, the estimation of GS was still pursued for comparative purposes, acknowledging that the data obtained may provide valuable insights and contribute to the broader understanding of variations between the two methods of nuclei isolation and data analysis. GS was estimated as per Equation (1), in picograms (pg). A 1 pg measure was considered equivalent to 978 Mbp [5].
GS (1C/pg) = (Mean fluorescence of sample/Mean fluorescence of standard) × 1C value (pg) of standard
2.8. Histogram Modeling and Debris Compensation-Based Analysis
In this approach, data were subjected to peak modeling algorithms implemented in the ‘flowploidy’ package (v. 1.25.2) of R (v.4.2.3) [20,39]. This modeling approach is based on the histogram-dependent non-linear least-squares algorithm for peak identification [9,20,35]. Here, single-nucleus events were isolated from aggregates and debris using the gating of the clusters of differential fluorescence based on particle size (Figures S3, S5, S7, S9, S11, S13, S15 and S17). The ratio of forward scatter pulse height and fluorescence pulse height was plotted on the y-axis against fluorescence pulse height on the x-axis to identify the single-nucleus clusters (Figures S3, S5, S7, S9, S11, S13, S15 and S17). This package facilitated a non-linear regression function to fit a model, which was assessed for goodness of fit based on residual chi-square (χ2) value (RCS) [20]. After peak identification, data were processed, with debris compensation accomplished through single-cut and multiple-cut algorithms implemented in the flowploidy package [9,20]. RCS values between 0.7 and 4 for the best-fit model and recommended limits of CV (i.e., <5%) were considered when gating to isolate debris and aggregates [9,20,36,38].
2.9. Experimental Setup
Five biological replicates were prepared for fresh and frozen preparations. For statistical comparison, data for four species (A. sericeus, H. sayeriana, M. tetraphylla, and M. jansenii), two nuclei preparation methods (conventional fresh preparation and proposed frozen preparation), and two data analysis approaches (debris-compensated (including histogram modeling and debris compensation) and non-compensated (including conventional histogram analysis and no debris compensation)) were collected in one experiment.
2.10. Statistical Analysis
The average of the genome size from five biological replicates was subjected to three-way ANOVA (species × nuclei preparation × debris compensation) in the ggplot2 (v 3.4.1) package of R. Post hoc comparisons were conducted using the Benjamini–Hochberg false discovery rate in R (v 4.2.3). Three-way interactions between species, method, and compensation were tested for significance (CI-95%) on genome size. For the significance of the unequal variance, Levene’s test was used in R. Each combination of three variables was subjected to one-way ANOVA (CI-95%) coupled with post hoc comparison supported by false discovery rate (FDR) correction. Analysis was conducted in R (v 4.2.3) [40].
3. Results
Two-way interactions between nuclei preparation and data analysis approach for genome size were not significant (p < 0.05) for all species (Table 1 and Table 2). One-way ANOVA further confirmed the significance of different combinations of nuclei preparation and data analysis approaches (Table S1). The average CV varied from 2.7% to 4.59% across the species and different combinations of nuclei isolation and data analysis, except for 5.3% in frozen preparations with debris-compensated analysis of M. jansenii. The average number of events per peak ranged from 62 to 11,520 across the species, nuclei preparation, and data analysis approaches (Table 2).

Table 1.
Results of two-way interactions for nuclei preparation method and data analysis in genome size estimation.
Table 2.
Average genome size estimates, single-nucleus events per peak, and CV% using fresh and frozen leaf preparations.
3.1. Genome Size Estimates for Adenanthos sericeus
With conventional histogram analysis without debris compensation, the difference between the average 1C estimate 0.47 ± 0.001 pg from frozen nuclei was not significantly different (p = 1) to 0.47 ± 0.005 pg of fresh nuclei (Figure 1, Table 2).
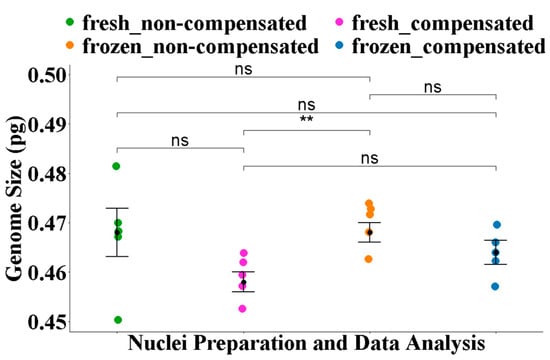
Figure 1.
Comparison of the average 1C estimates for A. sericeus derived using different nuclei isolation and data analysis approaches. Statistical analyses were conducted using Fisher’s ANOVA followed by a post hoc comparison using the Benjamini–Hochberg false discovery rate (FDR) correction. Significance levels are annotated as follows: ns = not significant (p > 0.05), ** = p < 0.01.
Debris compensation did not affect the results significantly for A. sericeus. With debris compensation, the average 1C estimate of 0.46 ± 0.003 pg from fresh preparations was not significantly (p = 0.23) different from the average estimate from non-compensated analysis (Figure 1, Table 2). Similarly, the average 1C estimate of 0.47 ± 0.000 pg from frozen preparations and debris compensation was not significantly (p = 0.36) different from the average estimate from non-compensated analysis (Figure 1).
3.2. Genome Size Estimates for Hollandaea sayeriana
Using conventional histogram analysis, the mean 1C estimate from frozen nuclei (1.09 ± 0.001 pg) did not differ significantly (p = 0.35) from that of fresh preparations (1.10 ± 0.009 pg) (Figure 2).
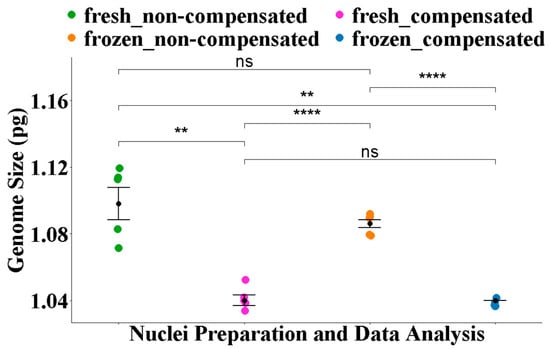
Figure 2.
Comparison of the average 1C estimates for H. sayeriana derived using different nuclei isolation and data analysis approaches. Statistical analyses were conducted using Fisher’s ANOVA followed by a post hoc comparison using the Benjamini–Hochberg false discovery rate (FDR) correction. Significance levels are annotated as follows: ns = not significant (p > 0.05), ** = p < 0.01, **** = p < 0.0001.
With debris compensation, the average GS estimate of 1.04 ± 0.001 pg from frozen nuclei was significantly lower (p = 1.40 × 10⁻⁴) than the average estimate of 1.08 ± 0.001 pg from non-compensated analysis (Figure 2). Similarly, the difference between average 1C estimate of 1.04 ± 0.003 pg from fresh nuclei preparation and debris-compensated analysis was significant (p = 5.20 × 10⁻³) from the 1C estimate of 1.10 ± 0.009 pg with non-compensated analysis. However, the difference between average GS estimate from fresh and frozen preparations was not significant (p = 1) (Figure 2, Table 2). Moreover, the average 1C-value of 1.04 ± 0.001 pg from frozen preparations and debris compensation was more precise (p = 0.1, CI = 90%) than estimates from other methods (Table 2).
3.3. Genome Size Estimates for Macadamia tetraphylla
With conventional histogram analysis, the difference between the average 1C estimate of 0.86 ± 0.012 pg from fresh preparations and 0.88 ± 0.017 pg from frozen preparations was not significant (p = 0.18) (Figure 3, Table 2).
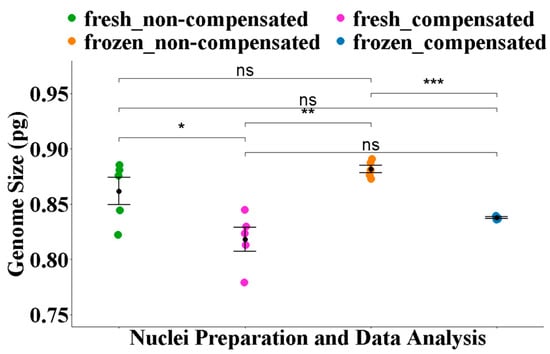
Figure 3.
Comparison of average 1C estimates for M. tetraphylla derived using different nuclei isolation and data analysis approaches. Statistical analyses were conducted using Fisher’s ANOVA followed by a post hoc comparison using the Benjamini–Hochberg false discovery rate (FDR) correction. Significance levels are annotated as follows: ns = not significant (p > 0.05), * = p < 0.05, ** = p < 0.01, *** = p < 0.001.
With debris compensation, the average 1C estimate of 0.82 ± 0.011 pg from fresh preparation was significantly different (p = 0.05) from the average 1C estimate of 0.86 ± 0.012 pg with non-compensated analysis (Figure 3). Similarly, the effect of debris compensation was evident for frozen preparations. The average 1C estimate of 0.84 ± 0.000 pg from frozen preparations was significantly lower (p = 8.10 × 10⁻⁴) than the average 1C estimate of 0.88 ± 0.003 pg from non-compensated, conventional histogram-based analysis (Figure 3). However, the difference between GS estimate from frozen and fresh nuclei was not significant (p = 0.18) (Figure 3, Table 2).
3.4. GS Estimates for Macadamia jansenii
Without debris compensation, the average 1C estimate of 0.88 ± 0.005 pg from frozen preparations was not significantly (p = 0.03) different to the average 1C estimate of 0.86 ± 0.017 pg from fresh preparations (Figure 4, Table 2).
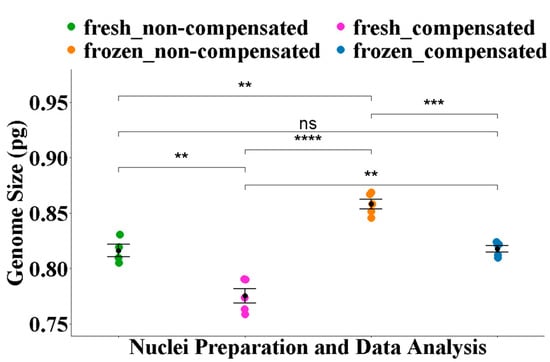
Figure 4.
Comparison of the average 1C estimates for M. jansenii derived using different nuclei isolation and data analysis approaches. Statistical analyses were conducted using Fisher’s ANOVA followed by a post hoc comparison using the Benjamini–Hochberg false discovery rate (FDR) correction. Significance levels are annotated as follows: ns = not significant (p > 0.05), ** = p < 0.01, *** = p < 0.001, **** = p < 0.0001.
With debris compensation, the average 1C estimate of 0.82 ± 0.003 pg from the frozen preparations was significantly (p = 3.90 × 10⁻⁴) lower than the average 1C estimate of 0.86 ± 0.005 pg from non-compensated analysis (Figure 4). Similarly, debris compensation led to a reduction in the 1C estimate for fresh preparations. With debris compensation, the average 1C estimate from fresh preparations 0.78 ± 007 pg was significantly (p = 0.28) different to the average estimate from non-compensated analysis (Figure 4, Table 2).
4. Discussion
The constraints of plant material storage and preservation, combined with the absence of immediate FCM analysis, frequently result in compromised nuclei integrity prior to processing, making GS estimation challenging [7,41,42]. In addition, conventional nuclei isolation from fresh material remains ineffective in many recalcitrant species [2,3,37]. This study demonstrates that frozen plant material, when processed under optimized conditions, can yield GS estimates that are comparable to those obtained from fresh material. For some species, nuclei yields can far outweigh those obtained from fresh material, while the CV% with debris compensation algorithms can be maintained below 5%.
Across the species examined, conventional histogram analysis without debris compensation resulted in similar GS estimates for both fresh and frozen nuclei. For example, A. sericeus produced an average 1C estimate of approximately 0.47 pg from both sample types (p = 1), and the inclusion of debris compensation did not alter this outcome. In species with robust nuclear integrity, indicated by high event counts per peak (e.g., >10,000), these results suggest that fresh and frozen tissues are interchangeable for GS estimation. Moreover, the use of frozen material combined with debris compensation analysis resulted in lower standard errors and a reduced range of GS estimates. However, these differences were not always statistically significant (p > 0.05). The reduced variability observed in frozen preparations may be partly attributed to the fact that all five replicates were prepared within a single-nucleus extraction batch, and the data analysis was conducted in one session under consistent parameters. In contrast, fresh preparations involved independent biological replicates, each derived from separately processed material. Variations in chopping efficiency and tissue condition during each preparation may have introduced slight inconsistencies in GS estimates, contributing to the higher range observed in the fresh samples.
In contrast, for species with comparatively lower nuclear integrity or fewer events counts per peak, the data analysis approach can significantly influence GS estimates. In H. sayeriana, while conventional analysis showed no significant difference between fresh (1.10 pg) and frozen (1.09 pg) samples, the introduction of debris compensation reduced the average 1C estimate to 1.04 pg for both tissue types. Similar trends were observed in Macadamia tetraphylla and M. jansenii, where debris compensation consistently reduced the 1C estimates from both fresh and frozen preparations. For example, in M. tetraphylla, the fresh sample estimate decreased from 0.86 pg to 0.82 pg (p = 0.05), and the frozen sample from 0.88 pg to 0.84 pg (p = 8.10 × 10⁻⁴), with debris compensation. In M. jansenii, debris compensation led to a significant reduction in the frozen sample estimate (from 0.88 pg to 0.82 pg, p = 3.90 × 10⁻⁴), with a similar, though not statistically significant trend in fresh samples. This reduction in GS estimate is potentially linked with the effects of unresolved debris or fragmented nuclei, which may interfere with the fluorescence signal by adhering to surface of intact nuclei or causing clogs. Therefore, without debris compensation, GS estimates for certain species are inflated. Species with higher levels of secondary metabolites may contribute to increased debris, which generates background fluorescence and interferes with peak resolution. The compensation algorithm mitigates this effect by excluding lower-intensity events associated with debris, resulting in more conservative and potentially more accurate GS estimates.
Previously, FCM-based GS estimates for three of the four selected species were calibrated against Pisum sativum cv. Torstag (1C = 4.75 pg) [25], resulting in values that differed by up to 35% from the estimates reported here. Previous 1C estimates for A. sericeus (0.59 pg), H. sayeriana (1.36 pg), and M. tetraphylla (1.14 pg) were overestimated by 25%, 31%, and 35%, respectively. Recent calibration studies suggest an overestimation of 20% in GS of Torstag pea [43,44,45]. Using this recalibrated value of Torstag pea (3.8 pg/1C), the recalculated GS estimates for A. sericeus (0.47 pg), H. sayeriana (1.09 pg), and M. tetraphylla (0.91 pg) align well with the measurements reported here. Furthermore, consensus genomes for M. tetraphylla and M. jansenii assembled with long-read data suggest 1C-values around 0.81 pg and 0.80 pg, respectively [28,30], supporting the validity of our estimates from frozen material.
This optimized protocol, which includes rapid freezing and processing at low temperatures using liquid nitrogen, preserves nuclear integrity effectively. This is supported by our fluorescence microscopy observations (Figure S18) and by the comparable GS estimates between fresh and frozen preparations. Other studies have observed intact nuclei despite several steps of mechanical and chemical disintegration of the frozen tissue [17,18,21,46] and after the freezing/thawing process [16,47]. Moreover, the similarity of GS estimates from frozen and fresh preparations further indicated the preservation of nuclear integrity. The preservation of nuclear integrity is critical, as thawing damage (caused by ice crystal formation in intra- and extracellular fluids) can alter fluorescence and thereby affect GS estimation [47]. Thawing damage is largely dependent on the thawing conditions [47]. By maintaining low temperatures throughout nuclei isolation, our approach minimizes enzymatic activity and thawing-related damage.
Notably, previous attempts to use frozen leaf material for GS and ploidy estimation employed the conventional chopping approach in a suitable buffer to release nuclei [10,11,12,14]. However, employing a mortar and pestle has been shown to yield a higher number of nuclei [18,21]. Additionally, this technique enables the processing of larger quantities of leaf material, ensuring effective disruption and homogenization while preserving nuclear integrity under cryogenic conditions. In addition, several washes with buffers facilitate the removal of contaminants. In earlier studies, frozen plant samples produced a low signal-to-noise ratio, and results were disregarded [2,7,11,13,41]. The absence of comparative studies on the results of frozen and fresh nuclei has limited the adoption of frozen material for flow cytometry (FCM) applications.
GS estimates from frozen plant material can be a good aid to genome sequencing studies, where the sample is frozen after retrieval, or fresh plant material is not available. After genome estimation, isolated nuclei can be used for DNA extractions, as the protocol is optimized for reducing the impact of the secondary metabolites for high-quality DNA extractions for sequencing [18,19,21,48]. This dual use of the same material can streamline workflows and reduce the time and resources needed for plant genomic research.
While the method demonstrated reproducibility across the four eudicot species tested, its applicability may vary in plants with abundant secondary metabolites. Future studies should evaluate its performance across a broader range of taxa. In this study, nuclei were analyzed the day after freezing; however, previous studies using alternative protocols have reported a decline in nuclear integrity with prolonged storage. These reports noted increased debris, lower nuclei counts, and higher CV, indicating that extended freezing durations may compromise data quality [11]. Further research is required to evaluate the impact of extended storage on nuclei quality, CV, and fluorescence signal stability. In addition, further research can be directed towards optimizing the lysis buffers to reduce debris content.
5. Conclusions
This study provides statistically validated demonstrations that frozen plant tissues, when processed using an optimized protocol, can yield GS estimates comparable to those from fresh material. Furthermore, the incorporation of debris compensation effectively reduces the influence of fragmented nuclei and debris, helping to maintain CVs within an acceptable range and minimizing fluorescence interference, thereby improving the accuracy of GS estimates. Although not always statistically significant, debris compensation also resulted in lower standard errors, indicating improved precision in GS estimation. This advancement broadens the utility of FCM for genome studies, especially in scenarios where sample collection occurs in remote or logistically constrained environments. The protocol also holds value for dual-purpose workflows, where nuclei are needed for both genome sizing and downstream DNA sequencing. With further testing across diverse taxa and storage durations, this method could significantly enhance field-based and conservation genomics efforts.
Supplementary Materials
The following supplementary data can be accessed online from the database titled “A flow cytometry protocol for measurement of plant genome size using frozen material” at https://doi.org/10.5281/zenodo.14873353 (Accessed on 1 April 2025). Table S1: Results of one-way ANOVA for all combinations of species, nuclei extraction method, and debris compensation on genome size estimation. Figure S1. The process of nuclei isolation from frozen leaf material. Figure S2. Conventional histogram analysis for the fluorescence data of fresh preparations of Oryza sativa (P1) and Adenanthos sericeus (P2). Figure S3. Peak modeling and debris compensation analysis for the fluorescence data of the fresh preparation of Oryza sativa (A) and Adenanthos sericeus (B). Figure S4. Conventional histogram analysis for the fluorescence data of frozen preparations of Oryza sativa (P1) and Adenanthos sericeus (P2). Figure S5. Peak modeling and debris compensation analysis for the fluorescence data of the frozen preparation of Oryza sativa (A) and Adenanthos sericeus (B). Figure S6. Conventional histogram analysis for the fluorescence data of fresh preparations of Oryza sativa (P1) and Hollandaea sayeriana (P2). Figure S7. Peak modeling and debris compensation analysis for the fluorescence data of the fresh preparation of Oryza sativa (A) and Hollandaea sayeriana (B). Figure S8. Conventional histogram analysis for the fluorescence data of frozen preparations of Oryza sativa (P1) and Hollandaea sayeriana (P2). Figure S9. Peak modeling and debris compensation analysis for the fluorescence data of the frozen preparation of Oryza sativa (A) and Hollandaea sayeriana (B). Figure S10. Conventional histogram analysis for the fluorescence data of fresh preparations of Oryza sativa (P1) and Macadamia tetraphylla (P2). Figure S11. Peak modeling and debris compensation analysis for the fluorescence data of the fresh preparation of Oryza sativa (A) and Macadamia tetraphylla (B). Figure S12. Conventional histogram analysis for the fluorescence data of frozen preparations of Oryza sativa (P1) and Macadamia tetraphylla (P2). Figure S13. Peak modeling and debris compensation analysis for the fluorescence data of the frozen preparation of Oryza sativa (A) and Macadamia tetraphylla (B). Figure S14. Conventional histogram analysis for the fluorescence data of fresh preparations of Oryza sativa (P1) and Macadamia jansenii (P2). Figure S15. Peak modeling and debris compensation analysis for the fluorescence data of the fresh preparation of Oryza sativa (A) and Macadamia jansenii (B). Figure S16. Conventional histogram analysis for the fluorescence data of frozen preparations of Oryza sativa (P1) and Macadamia jansenii (P2). Figure S17. Peak modeling and debris compensation analysis for the fluorescence data of the frozen preparation of Oryza sativa (A) and Macadamia jansenii (B). Figure S18. Fluorescent microscopy of the PI-stained frozen nuclei of H. sayeriana.
Author Contributions
A.S.: conceptualization, data collection, data analysis, drafting the manuscript, review and editing the manuscript, L.C.: conceptualization, manuscript review and editing, A.F.: conceptualization and manuscript review and editing, R.J.H.: conceptualization, funding application, manuscript review and editing. All authors have read and agreed to the published version of the manuscript.
Funding
The ARC Centre of Excellence for Plant Success in Nature and Agriculture provided funding (CE200100015). A.S. was awarded a Ph.D. Scholarship and R.J.H. was funded by the ARC Centre of Excellence for Plant Success in Agriculture and Nature (Grant CE200100015). L.C. was supported by a University of Queensland Retention Fellowship.
Informed Consent Statement
Not applicable.
Data Availability Statement
The dataset generated during the current study is available in the “Genome size estimation of plants using frozen plant material” flow repository database at http://flowrepository.org/id/FR-FCM-Z6M4 (Accessed on 21 August 2024). The data supporting the conclusions of this article are included within the article and its additional files. The protocol is available online at https://doi.org/10.17504/protocols.io.e6nvwdq27lmk/v1 (Accessed on 3 March 2025).
Acknowledgments
The authors gratefully acknowledge Shaun Walters for his assistance with access to the flow cytometry facilities at the School of Molecular Bioscience, University of Queensland. Additionally, thanks are extended to Pauline Okemo and Phoung Hoang from the ARC Centre of Excellence for Plant Success in Agriculture and Nature for their efforts in cultivating the Oryza sativa used in this study.
Conflicts of Interest
The authors declare no conflicts of interest.
Abbreviations
The following abbreviations are used in this manuscript:
| FCM | Flow cytometry |
| GS | Genome size |
| pg | Picograms |
| CV | Coefficient of variance |
| ANOVA | Analysis of variance |
| nls | Non-linear least squares |
| RCS | Residual chi-square |
References
- Galbraith, D.W.; Harkins, K.R.; Maddox, J.M.; Ayres, N.M.; Sharma, D.P.; Firoozabady, E. Rapid flow cytometric analysis of the cell cycle in intact plant tissues. Science 1983, 220, 1049–1051. [Google Scholar] [CrossRef] [PubMed]
- Doležel, J.; Greilhuber, J.; Suda, J. Estimation of nuclear DNA content in plants using flow cytometry. Nat. Protoc. 2007, 2, 2233–2244. [Google Scholar] [CrossRef] [PubMed]
- Temsch, E.M.; Koutecký, P.; Urfus, T.; Šmarda, P.; Doležel, J. Reference standards for flow cytometric estimation of absolute nuclear content in plants. Cytom. Part A 2022, 101, 710–724. [Google Scholar] [CrossRef] [PubMed]
- Greilhuber, J.; Dolezel, J.; Lysák, M.A.; Bennett, M.D. The origin, evolution and proposed stabilization of the terms ‘genome size’ and ‘C-value’ to describe nuclear DNA contents. Ann. Bot. 2005, 95, 255–260. [Google Scholar] [CrossRef]
- Doležel, J.; Bartoš, J.; Voglmayr, H.; Greilhuber, J. Nuclear DNA content and genome size of trout and human. Cytom. Part A 2003, 51, 127–128. [Google Scholar] [CrossRef]
- Nakandala, U.; Masouleh, A.K.; Smith, M.W.; Furtado, A.; Mason, P.; Constantin, L.; Henry, R.J. Haplotype resolved chromosome level genome assembly of Citrus australis reveals disease resistance and other citrus specific genes. Hortic. Res. 2023, 10, uhad058. [Google Scholar] [CrossRef]
- Čertner, M.; Lučanová, M.; Sliwinska, E.; Kolář, F.; Loureiro, J. Plant material selection, collection, preservation, and storage for nuclear DNA content estimation. Cytom. Part A 2022, 101, 737–748. [Google Scholar] [CrossRef]
- Jarret, R.L.; Ozias-Akins, P.; Phatak, S.; Nadimpalli, R.; Duncan, R.; Hiliard, S. DNA contents in Paspalum spp. determined by flow cytometry. Genet. Resour. Crop Evol. 1995, 42, 237–242. [Google Scholar] [CrossRef]
- Bagwell, C.B.; Mayo, S.W.; Whetstone, S.D.; Hitchcox, S.A.; Baker, D.R.; Herbert, D.J.; Weaver, D.L.; Jones, M.A.; Lovett, E.J. DNA histogram debris theory and compensation. Cytometry 1991, 12, 107–118. [Google Scholar] [CrossRef]
- Nsabimana, A.; Van Staden, J. Ploidy investigation of bananas (Musa spp.) from the National Banana Germplasm Collection at Rubona–Rwanda by flow cytometry. S. Afr. J. Bot. 2006, 72, 302–305. [Google Scholar] [CrossRef]
- Cires, E.; Cuesta, C.; Peredo, E.L.; Revilla, M.Á.; Prieto, J.A.F. Genome size variation and morphological differentiation within Ranunculus parnassifolius group (Ranunculaceae) from calcareous screes in the Northwest of Spain. Plant Syst. Evol. 2009, 281, 193–208. [Google Scholar] [CrossRef]
- Dart, S.; Kron, P.; Mable, B.K. Characterizing polyploidy in Arabidopsis lyrata using chromosome counts and flow cytometry. Can. J. Bot. 2004, 82, 185–197. [Google Scholar] [CrossRef]
- Xavier, P.L.; Senhorini, J.A.; Pereira-Santos, M.; Fujimoto, T.; Shimoda, E.; Silva, L.A.; Dos Santos, S.A.; Yasui, G.S. A flow cytometry protocol to estimate DNA content in the yellowtail tetra Astyanax altiparanae. Front. Genet. 2017, 8, 131. [Google Scholar] [CrossRef] [PubMed]
- Halverson, K.; Heard, S.B.; Nason, J.D.; Stireman, J.O. Origins, distribution, and local co-occurrence of polyploid cytotypes in Solidago altissima (Asteraceae). Am. J. Bot. 2008, 95, 50–58. [Google Scholar] [CrossRef]
- Kolář, F.; Lučanová, M.; Těšitel, J.; Loureiro, J.; Suda, J. Glycerol-treated nuclear suspensions—An efficient preservation method for flow cytometric analysis of plant samples. Chromosome Res. 2012, 20, 303–315. [Google Scholar] [CrossRef]
- Hopping, M.E. Preparation and preservation of nuclei from plant tissues for quantitative DNA analysis by flow cytometry. N. Z. J. Bot. 1993, 31, 391–401. [Google Scholar] [CrossRef]
- Sikorskaite, S.; Rajamäki, M.-L.; Baniulis, D.; Stanys, V.; Valkonen, J.P. Protocol: Optimised methodology for isolation of nuclei from leaves of species in the Solanaceae and Rosaceae families. Plant Methods 2013, 9, 31. [Google Scholar] [CrossRef]
- Zhang, H.B.; Zhao, X.; Ding, X.; Paterson, A.H.; Wing, R.A. Preparation of megabase-size DNA from plant nuclei. Plant J. 1995, 7, 175–184. [Google Scholar] [CrossRef]
- Workman, R.; Timp, W.; Fedak, R.; Kilburn, D.; Hao, S.; Liu, K. High Molecular Weight DNA Extraction from Recalcitrant Plant Species for Third Generation Sequencing. 2018. Available online: https://www.researchsquare.com/article/nprot-6785/v1 (accessed on 23 November 2023).
- Smith, T.W.; Kron, P.; Martin, S.L. flowPloidy: An R package for genome size and ploidy assessment of flow cytometry data. Appl. Plant Sci. 2018, 6, e01164. [Google Scholar] [CrossRef]
- Givens, R.M.; Mesner, L.D.; Hamlin, J.L.; Buck, M.J.; Huberman, J.A. Integrity of chromatin and replicating DNA in nuclei released from fission yeast by semi-automated grinding in liquid nitrogen. BMC Res. Notes 2011, 4, 499. [Google Scholar] [CrossRef]
- Gladman, N.; Goodwin, S.; Chougule, K.; McCombie, W.R.; Ware, D. Era of gapless plant genomes: Innovations in sequencing and mapping technologies revolutionize genomics and breeding. Curr. Opin. Biotechnol. 2023, 79, 102886. [Google Scholar] [CrossRef] [PubMed]
- Espinosa, E.; Bautista, R.; Larrosa, R.; Plata, O. Advancements in long-read genome sequencing technologies and algorithms. Genomics 2024, 116, 110842. [Google Scholar] [CrossRef] [PubMed]
- Leitch, I.J.; Johnston, E.; Pelicer, J.; Hidalgo, O.; Bennett, M.D. Angiosperm DNA C-Values Database (Release 7.1, Apr 2019). 2019. Available online: https://cvalues.science.kew.org (accessed on 3 January 2024).
- Jordan, G.J.; Carpenter, R.J.; Koutoulis, A.; Price, A.; Brodribb, T.J. Environmental adaptation in stomatal size independent of the effects of genome size. New Phytol. 2015, 205, 608–617. [Google Scholar] [CrossRef] [PubMed]
- Rao, C.V. Cyto-Taxonomic Studies in the Proteaceae. Ph.D. Thesis, University of Tasmania, Tasmania, Australia, 1957. [Google Scholar]
- Ramsay, H.P. Chromosome numbers in the proteaceae. Aust. J. Bot. 1963, 11, 1–20. [Google Scholar] [CrossRef]
- Sharma, P.; Murigneux, V.; Haimovitz, J.; Nock, C.J.; Tian, W.; Kharabian Masouleh, A.; Topp, B.; Alam, M.; Furtado, A.; Henry, R.J. The genome of the endangered Macadamia jansenii displays little diversity but represents an important genetic resource for plant breeding. Plant Direct 2021, 5, e364. [Google Scholar] [CrossRef]
- NCBI. BioProject. Bethesda (MD): National Library of Medicine (US), National Centre of Biotechnology Information; [1988]—BioProject PRJNA694456, Horticulture Tree Genomics. 2023. Available online: https://www.ncbi.nlm.nih.gov/bioproject/694456 (accessed on 1 August 2023).
- Sharma, P.; Masouleh, A.K.; Constantin, L.; Topp, B.; Furtado, A.; Henry, R.J. Genome sequences to support conservation and breeding of Macadamia. Trop. Plants 2024, 3, e035. [Google Scholar] [CrossRef]
- Sasaki, T. The map-based sequence of the rice genome. Nature 2005, 436, 793–800. [Google Scholar] [CrossRef]
- Abdullah, M.; Furtado, A.; Masouleh, A.K.; Okemo, P.; Henry, R.J. An improved haplotype resolved genome reveals more rice genes. Trop. Plants 2024, 3, e009. [Google Scholar] [CrossRef]
- Shang, L.; He, W.; Wang, T.; Yang, Y.; Xu, Q.; Zhao, X.; Yang, L.; Zhang, H.; Li, X.; Lv, Y. A complete assembly of the rice Nipponbare reference genome. Mol. Plant 2023, 16, 1232–1236. [Google Scholar] [CrossRef]
- Loureiro, J.; Rodriguez, E.; Doležel, J.; Santos, C. Two new nuclear isolation buffers for plant DNA flow cytometry: A test with 37 species. Ann. Bot. 2007, 100, 875–888. [Google Scholar] [CrossRef]
- Koutecký, P.; Smith, T.; Loureiro, J.; Kron, P. Best practices for instrument settings and raw data analysis in plant flow cytometry. Cytom. Part A 2023, 103, 953–966. [Google Scholar] [CrossRef] [PubMed]
- Sliwinska, E.; Loureiro, J.; Leitch, I.J.; Šmarda, P.; Bainard, J.; Bureš, P.; Chumová, Z.; Horová, L.; Koutecký, P.; Lučanová, M.; et al. Application-based guidelines for best practices in plant flow cytometry. Cytom. Part A 2022, 101, 749–781. [Google Scholar] [CrossRef] [PubMed]
- Loureiro, J.; Kron, P.; Temsch, E.M.; Koutecký, P.; Lopes, S.; Castro, M.; Castro, S. Isolation of plant nuclei for estimation of nuclear DNA content: Overview and best practices. Cytom. Part A 2021, 99, 318–327. [Google Scholar] [CrossRef] [PubMed]
- Loureiro, J.; Suda, J.; Doležel, J.; Santos, C. FLOWER: A Plant DNA Flow Cytometry Database. In Flow Cytometry with Plant Cells: Analysis of Genes, Chromosomes and Genomes; Wiley Online Library: Hoboken, NJ, USA, 2007; pp. 423–438. [Google Scholar]
- Ihaka, R.; Gentleman, R. R: A language for data analysis and graphics. J. Comput. Graph. Stat. 1996, 5, 299–314. [Google Scholar] [CrossRef]
- Wickham, H. ggplot2. Wiley Interdiscip. Rev. Comput. Stat. 2011, 3, 180–185. [Google Scholar] [CrossRef]
- Greilhuber, J.; Temsch, E.M.; Loureiro, J.C. Nuclear DNA content measurement. In Flow Cytometry with Plant Cells: Analysis of Genes, Chromosomes and Genomes; Wiley Online Library: Hoboken, NJ, USA, 2007; pp. 67–101. [Google Scholar]
- Galbraith, D.; Loureiro, J.; Antoniadi, I.; Bainard, J.; Bureš, P.; Cápal, P.; Castro, M.; Castro, S.; Čertner, M.; Čertnerová, D.; et al. Best practices in plant cytometry. Cytom. Part A 2021, 99, 311–317. [Google Scholar] [CrossRef]
- Soni, A.; Henry, R.J. Re-calibration of flow cytometry standards for plant genome size estimation. bioRxiv 2024. [Google Scholar] [CrossRef]
- Šmarda, P.; Bureš, P.; Horová, L.; Leitch, I.J.; Mucina, L.; Pacini, E.; Tichý, L.; Grulich, V.; Rotreklová, O. Ecological and evolutionary significance of genomic GC content diversity in monocots. Proc. Natl. Acad. Sci. USA 2014, 111, E4096–E4102. [Google Scholar] [CrossRef]
- Veselý, P.; Bureš, P.; Šmarda, P. Nutrient reserves may allow for genome size increase: Evidence from comparison of geophytes and their sister non-geophytic relatives. Ann. Bot. 2013, 112, 1193–1200. [Google Scholar] [CrossRef]
- Jiao, Y.; Leebens-Mack, J.; Ayyampalayam, S.; Bowers, J.E.; Mckain, M.R.; Mcneal, J.; Rolf, M.; Ruzicka, D.R.; Wafula, E.; Wickett, N.J.; et al. A genome triplication associated with early diversification of the core eudicots. Genome Biol. 2012, 13, R3. [Google Scholar] [CrossRef]
- Kratochvílová, I.; Kopečná, O.; Bačíková, A.; Pagáčová, E.; Falková, I.; Follett, S.E.; Elliott, K.W.; Varga, K.; Golan, M.; Falk, M. Changes in Cryopreserved Cell Nuclei Serve as Indicators of Processes during Freezing and Thawing. Langmuir 2019, 35, 7496–7508. [Google Scholar] [CrossRef]
- Cushman, J.C. Isolation of nuclei suitable for in vitro transcriptional studies. In Methods in Cell Biology; Elsevier: Amsterdam, The Netherlands, 1995; Volume 50, pp. 113–128. [Google Scholar]
Disclaimer/Publisher’s Note: The statements, opinions and data contained in all publications are solely those of the individual author(s) and contributor(s) and not of MDPI and/or the editor(s). MDPI and/or the editor(s) disclaim responsibility for any injury to people or property resulting from any ideas, methods, instructions or products referred to in the content. |
© 2025 by the authors. Licensee MDPI, Basel, Switzerland. This article is an open access article distributed under the terms and conditions of the Creative Commons Attribution (CC BY) license (https://creativecommons.org/licenses/by/4.0/).