Abstract
Oil, as a key commodity in international markets, bears an importance for both producers and consumers. For oil-exporting countries, periodic fluctuations have a considerable impact on the economic status and the way monetary and fiscal policies should be conducted in the future. While most of academic efforts tried to link low-frequency real exchange rate with macroeconomic fundamentals for medium-/long-term inference, they omitted to gauge the volatile and complex high-frequency linkage between oil prices and exchange rate fluctuations. The inherent non-linear characteristics of such time series preclude the use of traditional tools or aggregated schemes based on lower frequencies for inference purposes. This work investigates the scale-based volatile linkage between daily international oil fluctuations and nominal exchange rate variations of an oil-exporting country, namely Algeria, by adopting a fractal regression approach to uncover the power-law, time-varying transmission and track its incidence in the short and long runs. Results show the absence of any short-term transmission mechanism from oil prices to the exchange rate, as the two variables remain decoupled but exhibit an increasing negative correlation when long scales are considered. Furthermore, the multiscale regression analysis confirms the existence of a scale-free, two-state Markov switching regime process generating short- and long-term impacts with sizeable amplitudes. The findings confirm the usefulness of monetary policy interventions to stabilize the local currency, as the source of Dollar–Dinar multifractality was found to be the probability distribution of observations rather than long-range correlations specific to oil prices.
1. Introduction
Time series data were first seen as the realizations of stochastic processes that could be modeled using a variety of techniques borrowed from statistics and mathematics, mostly under the normal distribution assumption.
The complexity of many economic phenomena, coupled with the abundance of data sources, permitted the modeling of a wide range of economic variables. Yet difficulties rose when the data generating process was not statistically stable and exhibited noticeable variations, proper to financial data [].
Financial time series is the most evident example of complexity and difficulties economists usually encounter to explain variations or to make predictions. Sustained efforts to explain the stochasticity of such data generating processes improved the econometric literature and shifted the interest of researchers to non-linear techniques. Memory-based analyses [] were found to better handle non-linearities of many observed phenomena in life and provided a formalism for what was thought to be purely random realizations. While there was a consensus on adopting Brownian motion as the basis of time series analysis, Mandelbrot and van Ness [] found frequency-independent patterns when analyzing cotton prices on daily, monthly and quarterly bases, leading to the idea of fractional Brownian motion.
The advent of self-similar patterns, called fractals [], paved the way to new directions in time series analysis and popularized the earlier work of Hurst [] which designed a single memory measurement method while working on the Nile river flooding, known as Rescaled Range Analysis. Due to the growing complexity of financial data, a spectrum of multiple fractal dimensions was found to better explain long-range correlations and fat-tailed data [], rather than a unique dimension.
Exchange rate remains a pillar of modern macroeconomic policy analysis and a substantial effort has been made to assess the impact of exchange rate fluctuations on different macroeconomic aggregates. Particularly, most oil-exporting countries do not adopt floating exchange rate regimes and they closely monitor international oil prices because the latter have significant impact on currency determination, and thus, incidence on the implementation of monetary and fiscal policies.
The exchange rate–oil price nexus was mainly considered under a macroeconomic perspective using the term “trade channel” [], while the wealth and portfolio channels focus, respectively, on short-term and medium-/long-term effects of oil prices on the nominal exchange rate []. The latter effects were mostly investigated using linear techniques, overlooking the highly complex price formation of oil in international markets. Meanwhile, oil-exporting countries have always tried to protect their currencies from external shocks by adopting flexible exchange rate regimes to intervene, when necessary, to offset any adverse shock affecting macroeconomic stability.
While many macroeconomists use the term “trade channel”, linking real oil prices to real exchange rates, the availability of daily observations allows us to test hypotheses about the time-varying effects on the Algerian Dinar that originate from international prices. The exchange rate regime adopted by the country’s central bank is flexible, with the de jure classification being managed floating, while the de facto exchange regime is classified as a stabilized arrangement []. The parity Dollar–Dinar remains a key variable in financial planning and its variability affects main macroeconomic aggregates as well as the oil and non-oil sectors, due to the country’s heavy reliance on oil exports [].
This work attempts to investigate the short- and long-term impact of international oil price fluctuations on the nominal exchange rate US Dollar–Algerian Dinar during the period 2003–2024, by adopting a bivariate fractal analysis that measures a scale-dependent link between the two series. It starts from the expectation channel hypothesis, which establishes causalities between the nominal exchange rate and the nominal oil prices [], in the sense that the Dollar–Dinar parity is impacted by international oil prices, knowing that Algeria is a small, open oil-exporting country, whose production does not weigh much in the international oil market and yet has shown a stabilization of its main macroeconomic aggregates over recent years [].
Investigating power-law multiscale dependence between the two variables necessitates a simultaneous assessment of short- and long-term impacts of international oil prices on the exchange rate, by running scale-dependent regression analysis (MRA) [,]. This methodology was designed to estimate scale-varying regression parameters under the assumption of bivariate power-law correlations [], using noise-free transformed scale-dependent signals. Consequently, we can simultaneously assess the short- and long-term impact of oil price variations on the Dollar–Dinar exchange rate, without running two separate analyses considering different time scales. Additionally, the MRA offers details on potential fractality transmission between the two series.
The use of latent states to model fractality originates from an earlier work on the use of Markov switching multifractal [] as a return volatility model, where the multiscale transition between hidden states follows a power-law. This works assumes that the MRA coefficients are the realizations of two intertwined hidden Markov states, taken as proxies of a latent transmission mechanism.
The findings confirm the power-law characteristics of both time series, with a pronounced non-linearity in international oil prices, as measured by the OPEC basket. The time-varying impact on the exchange rate Dollar–Dinar was approached using a two-state Hidden Markov Model. One state was found to have a reduced impact and could be used as a proxy of short-term effect for scales lower than three months, while the second state is more variable and has a pronounced impact on the exchange rate.
Over the short term, a one percent increase in international oil prices may lead to an average 1.1% appreciation in the Dollar–Dinar value, while the long-term effect may jump threefold to 3.4%.
An apparent short-term decoupling between the two variables appears to support the flexible exchange rate regime adopted by Algeria, as a safeguard of the Dinar value vis à vis the US Dollar, especially during sudden stops or sharp moves of international markets. This finding is confirmed by a limited fractality transfer from oil prices to the exchange rate, thus a reduced non-linearity embedded in the exchange rate series, compared to oil prices.
The effectiveness of monetary policy interventions helps offsetting the Dinar from short-term international shocks. However, such interventions appear to be limited over the long run, where pronounced trends in oil prices have a sizable impact that cannot be easily neutralized. This occurs during long episodes of receding oil prices where monetary authorities are concerned with macroeconomic equilibria and potential twin deficit situation.
Aside from the time-varying effects, the study demonstrates the importance of multiscale analysis when dealing with a high-frequency bivariate linkage, and the usefulness of scale-wise effect transmission to study the fractal causality. The variability of the obtained scale-wise parameters could be seen as the realization of a random process embedded with latent states.
The remainder of this paper is as follows. Section 2 details the theoretical foundations behind the fractal analysis and the study of the exchange rate–oil price nexus. Section 3 implements the MRA on the exchange rate series Dollar–Dinar vs. the OPEC oil prices to investigate the intrinsic properties of the resulting coefficients using a two-state Hidden Markov Model (HMM).
2. Theoretical Developments
The relationship between oil prices and exchange rates has been intensively investigated by macroeconomists using a variety of techniques, ranging from econometrics to advanced statistical physics. Beckmann et al. [] surveyed the research paths used to model this relationship, and separated the impact assessments, depending on the predictability, into short-run and long-run methods. While the surveyed techniques are based on low-frequency data, the use of high-frequency data fosters the employment of time series analysis to model the exchange rate series, rather than explaining it using other variables. The availability of a large time series makes it easier to investigate high-order behaviors, with the help of multifractal analysis [,], which detects power-law behaviors in a given time series. Kristoufek [] extended the single variable multifractality to a regression-like analysis, where the time-varying effects between two variables are investigated using correlations of noise-free data.
Fractal Analysis
Mandelbrot studied irregular objects and tried to find repeated shapes when using different scales, known as self-similar patterns []. This gave birth to the fractal analysis as a research field in geometry, which has a wide range of applications, from physics to hydrology. The fractal theory is intrinsically linked to the definition of the fractal dimension, a hidden variable quantifying the irregularity of shapes that could be estimated via several methods depending on the field of study.
Earlier fractal approach applied to time series was featured in the study of Nile river floodings. Hurst [] designed the Rescaled Range Analysis and quantified the Hurst exponent as a measure of a time series memory, later corrected by Mandelbrot and extended to the fractional Brownian motion [] when studying cotton prices.
Due to increasing variability of many complex phenomena in life, the existence of a fractal dimension was relaxed to consider a spectrum of fractal dimensions. The multifractal analysis [,,] adds flexibility by investigating local fractal dimensions that may explain the variability observed in many phenomena. In finance, the multifractal approach was used to model the volatility of financial assets [] and in specific applications for exchange rate [] and oil prices [].
In time series analysis, the multifractal spectrum is particularly useful to analyze the behavior of small and large fluctuations separately, under varying conditions of autocorrelation and stationarity. This is in contrast to unifractal models, which consider a unique fractal dimension for the whole sample. Peng et al. [] introduced detrended cross-correlation analysis (DCCA) [], consisting of a DFA applied separately on two non-stationary time series to provide a symmetric estimate of the strength and direction of a relationship between two variables []. Kantelhardt et al. [] established the multifractal detrended fluctuation analysis (MFDFA) to analyze the local variations of the Hurst exponent and evaluate the hypothesis of multiple scaling relationships and interactions across scales.
Venema et al. [] introduced a stochastic-adjusted Fourier transform (Iterated Amplitude-Adjusted Fourier Transform, IAAFT) to help generate robust copies of the original times series, called surrogates, that preserve the statistical properties of the original time series for amplitude and autocorrelations. This development is useful to determine potential causes of multifractality in the data.
Sources of multifractality in time series data could be of two types []: (i) broad probability distribution (density function) exhibiting a multifractal spectrum even when data are randomly shuffled or (ii) different long-term correlations of small and large fluctuations, where shuffled time series exhibit a monofractal spectrum. If the two sources of multifractality are both present, shuffled series will demonstrate a weaker spectrum than the original series [].
Kristoufek [] introduced the Multiscale Regression Analysis (MRA) as a bivariate multifractal analysis consisting of asymmetric estimates of the multiscale-based regression. For time series , a profile is constructed and then split into non-overlapping intervals of length s. In each box between j and , the linear (or quadratic or any other polynomial) fit of a time trend is estimated for . Fluctuation function is then defined for each box (interval) of length s as
The fluctuation is further averaged over all boxes of length s to obtain
For bivariate series and , the procedure is parallel and we get
which is again averaged over all boxes with scale s to obtain the following: In the case when is not an integer, we average the fluctuations of boxes that are both split from the beginning and the end of the series so that we obtain boxes [].
The scale-characteristic fluctuations and can be seen as scale-dependent estimates of the variance and covariance, respectively. We thus stop in the middle of the DFA and DCCA procedures as our ultimate goal is not to obtain the scaling exponents but only the detrended variances and covariances. We can obtain a reformulation of the standard regression framework to obtain the MRA estimates for each s in the sample:
3. Application
Daily series of the Algerian Dinar vis à vis the US Dollar (www.investing.com/currencies/usd-dzd-historical-data accessed on 30 July 2025) and the OPEC oil prices (www.opec.org/basket/basketDayArchives.xml accessed on 30 July 2025) are plotted in Figure 1. The oil price series exhibits non-linear patterns found in financial time series, while the exchange rate series is less volatile, showing a steady depreciation of the Dinar currency against the US Dollar since 2015.
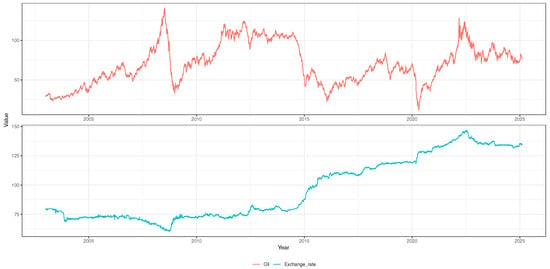
Figure 1.
Original time series.
Daily variations of both series have different characteristics, as shown in Figure 2. Oil price variations exhibit repeated clusters of volatility with sizable jumps during the 2008 financial crisis, and then a decrease in intensity starting from 2015. On the other hand, the daily Dollar–Dinar variations do not demonstrate high variability, except during earlier months of 2020, coinciding with the pandemic. Both series of daily exchange rate and oil variations are free from chaotic patterns, as their maximum Lyapunov exponents [] are still inferior to 0 (respectively −3.379 and −4.818), meaning that they stem from stochastic systems despite the high complexity of their data generating mechanisms.
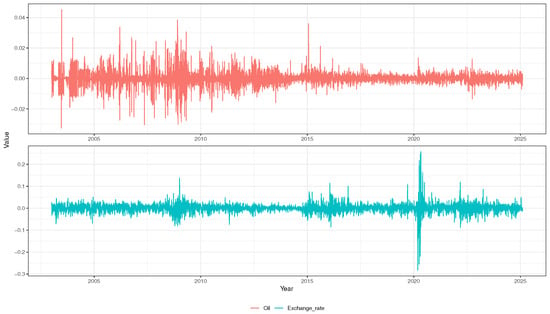
Figure 2.
Daily variations of the original time series.
Daily variations are taken as the basis of the analysis, first by rolling the MFDFA to determine the degree of multifractality and identify its origin. For this aim, we define 23 intervals whose lengths follow a power-law, used to compute the variations of Hurst exponent regarding the qth order moments as natural numbers contained in the interval [−10, +10]. For each MFDFA estimate, nineteen (19) surrogates were generated as reshuffled original data from the IAAFT transformation [] and a 95% confidence interval is constructed to test whether the multifractal spectrum stems from long-term correlations of the small and large fluctuations in the series.
Figure 3 shows the MFDFA result when applied on the Dollar–Dinar series and confirm multifractality as is not independent from q. Small values of q are associated with a persistent behavior as > 0.5, while large values exhibit a mild anti-persistent effect close to a white noise (∼ 0.5). This indicates that small variations in the Dollar–Dinar have significant long-range correlations, contrary to large variations, which are weakly correlated and slightly anti-persistent. The multifractal spectrum of the original series is contained in the 95% interval generated by surrogate data, displayed as dash lines in Figure 3, suggesting the probability distribution of data being the source of multifractality, rather than the long-range correlation of large and small fluctuations.
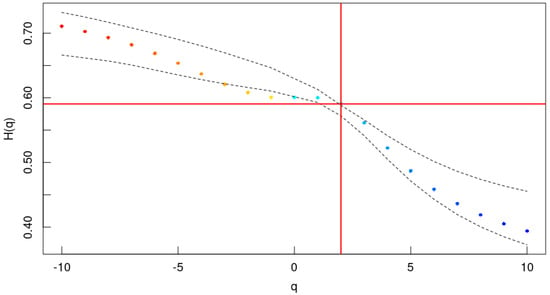
Figure 3.
MFDFA estimates for the Dollar–Dinar series. Dashed lines are the 95% confidence interval of surrogate data []. Points colored in red and blue indicate high and low persistency respectively.
The oil price series exhibits a rich multifractal spectrum, as shown in Figure 4, compared to the exchange rate series. Small fluctuations are linked to a more persistent behavior close to the pink noise [], while large fluctuations are close to random walk properties, while the wide range of denotes a pronounced multifractality having as origin both probabilistic properties of data as well as long-range correlations of small and large fluctuations. This different scaling behavior could be explained by extreme events, such as oil shocks and sudden developments in international markets, being more or less correlated than typical events [].
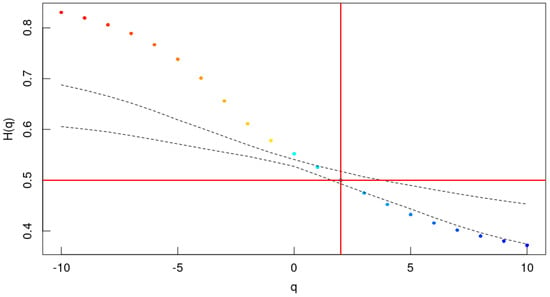
Figure 4.
MFDFA estimates for the OPEC oil prices series. Dashed lines are the 95% confidence interval of surrogate data []. Points colored in red and blue indicate high and low persistency respectively.
From the MFDFA, we can assert that there is an absence of a direct fractality transmission from oil prices to the exchange rate. In both series, large fluctuations could be assumed to follow a standard random walk; however, small fluctuations of oil prices have a higher persistence degree if compared to those of the Dollar–Dinar series.
The multiscale regression analysis (MRA) is performed as a combination of DFA [] with ordinary least square regression (OLS), known as fractal regression. The aim is to detail the transmission mechanism and estimate scale-wise effects as regression results.
Figure 5 shows the effect of oil price variations on the Dollar–Dinar exchange rate when considering different time scales. Overall, the effect exhibits a downward trend and has a negative magnitude, meaning that an increase in oil prices is linked to an appreciation of the exchange rate, and the inverse is also correct. This effect is weak, volatile and mostly comprises the interval when considering scales inferior to 120 days, roughly three months. However, the impact grows in magnitude for scales greater than 240 days (8 months) and stabilizes at around −0.05 for scales exceeding 1.5 years.
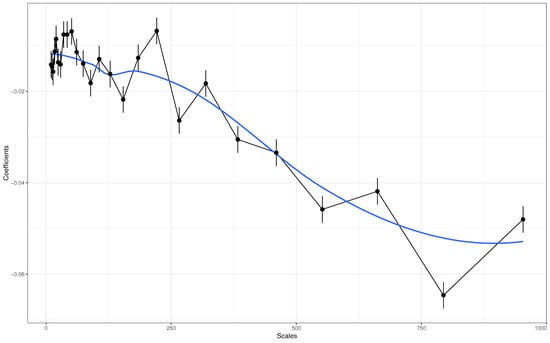
Figure 5.
Estimates of the multiscale regression analysis (MRA). Blue line indicates the loss curves.
The time series of MRA coefficients plotted in Figure 5 was used to estimate a Hidden Markov Model (HMM) with two trend-free, latent states to potentially detect unobservable trends in the MRA. This resulted in the matrix displayed in Figure 6. The first state (S1) is associated with a lower impact of −1.1%, while the second (S2) reaches threefold, to −3.4%.
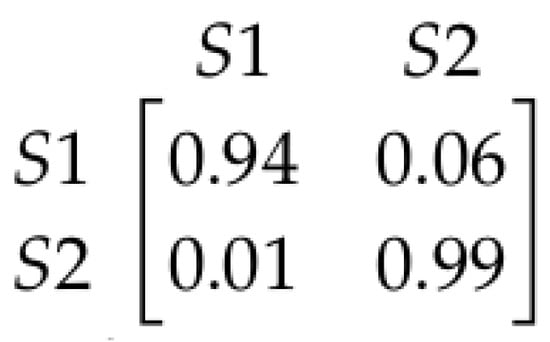
Figure 6.
Transition matrix of a two-state HMM on MRA results.
Both S1 and S2 are absorbing states, respectively, taken as proxies of the short-term and long-term impact of oil prices on the Algerian exchange rate. Figure 7 displays the probabilities of both states and concludes that a transition cutoff occurs at a scale of 108 days (approximately 3.5 months). This cutoff could be interpreted as a latent threshold separating short- and long-term impacts.
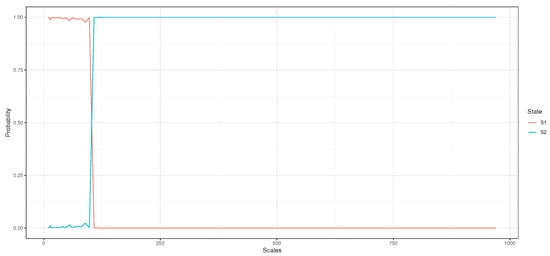
Figure 7.
Transition probabilities of HMM states (S1 and S2), based on MRA results.
4. Conclusions
Oil price variations are a subject of frequent scrutiny by macroeconomic researchers, underscoring their importance in modern economics, although oil remains an energy commodity. Particularly, oil producers are predominantly concerned with price levels and outlooks in order to better adapt their monetary and fiscal policies in case of negative developments. While oil data have been studied from a univariate perspective and were found to have a highly complex data generation mechanism, most linear tools fail to provide insights on how oil variations affect exchange rates. The use of fractal analysis helps understanding the behavior of complex time series, known to manifest self-similar patterns. Oil prices, as measured by the OPEC basket, remain highly non-linear due to both probability distribution and the long-range correlation patterns. This multifractality was identified in the Dollar–Dinar exchange rate series to be solely based on probabilistic properties and not related to long-range correlations. Daily variations of both exchange rate and oil prices, taken as the basis for the analysis, did not demonstrate chaotic patterns, while oil prices entered a stabilization phase after the 2008 financial crisis. The fractal regression scheme revealed a weak impact of oil variations on the exchange rate when considering short time intervals; however, its magnitude may increase threefold when considering long time scales. This confirms the usefulness of the prudent exchange rate regime adopted by Algeria to decouple the Dinar parity from oil prices’ volatility, while appreciation/depreciation episodes operate gradually over the long run. This assertion is further substantiated by the relative macroeconomic stability that the country experienced during oil price booms. The use of advanced bivariate fractal analysis schemes demonstrates the utility of scale-wise power-law patterns and the importance of investigating intrinsic properties using Hidden Markov Models, to reveal unobservable patterns of time-varying fractal regressions.
Author Contributions
S.D. and R.T. contributed equally to this work. All authors have read and agreed to the published version of the manuscript.
Funding
This research received no external funding.
Institutional Review Board Statement
Not applicable.
Informed Consent Statement
Not applicable.
Data Availability Statement
Dollar/Dinar exchange rate series (www.investing.com/currencies/usd-dzd-historical-data accessed on 30 July 2025) and OPEC oil prices (www.opec.org/basket/basketDayArchives.xml accessed on 30 July 2025).
Conflicts of Interest
The authors declare no conflicts of interest.
Abbreviations
The following abbreviations are used in this manuscript:
| DFA | Detrended Fluctuation Analysis |
| IAAFT | Iterated Amplitude Adjusted Fourier Transform |
| MFDFA | Multifractal Detrended Fluctuation Analysis |
| MRA | Multifractal Regression Analysis |
| OPEC | Organization of the Petroleum Exporting Countries |
References
- Kutergin, A.; Filimonov, V. On the Modeling of Financial Time Series; Springer International Publishing: Berlin/Heidelberg, Germany, 2015; pp. 131–151. [Google Scholar] [CrossRef]
- Mandelbrot, B.B. The Fractal Geometry of Nature; W. H. Freeman and Comp.: New York, NY, USA, 1982. [Google Scholar]
- Mandelbrot, B.B.; van Ness, J.W. Fractional Brownian motions, fractional noises and applications. SIAM Rev. 1968, 10, 422–437. [Google Scholar] [CrossRef]
- Hurst, H.E. Long-term storage capacity of reservoirs. Trans. Am. Soc. Civ. Eng. 1951, 116, 770–799. [Google Scholar] [CrossRef]
- Mandelbrot, B.B.; Fisher, A.J.; Calvet, L.E. A multifractal model of asset returns. Available online: https://elischolar.library.yale.edu/cowles-discussion-paper-series/1412/ (accessed on 27 August 2024).
- Beckmann, J.; Czudaj, R.L.; Arora, V. The relationship between oil prices and exchange rates: Revisiting theory and evidence. Energy Econ. 2020, 88, 104772. [Google Scholar] [CrossRef]
- IMF. 2023 Article IV Consultation-Press Release; Staff Report; and Statement by the Executive Director for Algeria; Technical Report; International Monetary Fund. Middle East and Central Asia Department: Washington, DC, USA, 2024. [Google Scholar]
- Kristoufek, L. Detrended fluctuation analysis as a regression framework: Estimating dependence at different scales. Phys. Rev. E 2015, 91, 022802. [Google Scholar] [CrossRef] [PubMed]
- Likens, A.D.; Amazeen, P.G.; West, S.G.; Gibbons, C.T. Statistical properties of Multiscale Regression Analysis: Simulation and application to human postural control. Phys. A Stat. Mech. Appl. 2019, 532, 121580. [Google Scholar] [CrossRef]
- Kantelhardt, J.W.; Zschiegner, S.A.; Koscielny-Bunde, E.; Havlin, S.; Bunde, A.; Stanley, H. Multifractal detrended fluctuation analysis of nonstationary time series. Phys. A Stat. Mech. Appl. 2002, 316, 87–114. [Google Scholar] [CrossRef]
- Ihlen, E.A. Introduction to Multifractal Detrended Fluctuation Analysis in Matlab. Front. Physiol. 2012, 3, 141. [Google Scholar] [CrossRef] [PubMed]
- Ning, Y.; Han, C.; Wang, Y. The multifractal properties of Euro and Pound exchange rates and comparisons. Phys. A Stat. Mech. Appl. 2018, 509, 578–587. [Google Scholar] [CrossRef]
- Wang, F.; Ye, X.; Wu, C. Multifractal characteristics analysis of crude oil futures prices fluctuation in China. Phys. A Stat. Mech. Appl. 2019, 533, 122021. [Google Scholar] [CrossRef]
- Peng, C.K.; Buldyrev, S.V.; Havlin, S.; Simons, M.; Stanley, H.E.; Goldberger, A.L. Mosaic organization of DNA nucleotides. Phys. Rev. E 1994, 49, 1685–1689. [Google Scholar] [CrossRef] [PubMed]
- Podobnik, B.; Stanley, H.E. Detrended Cross-Correlation Analysis: A New Method for Analyzing Two Nonstationary Time Series. Phys. Rev. Lett. 2008, 100, 084102. [Google Scholar] [CrossRef] [PubMed]
- Venema, V.; Ament, F.; Simmer, C. A Stochastic Iterative Amplitude Adjusted Fourier Transform algorithm with improved accuracy. Nonlinear Process. Geophys. 2006, 13, 321–328. [Google Scholar] [CrossRef]
- Kantelhardt, J.W. Fractal and Multifractal Time Series. In Mathematics of Complexity and Dynamical Systems; Meyers, R.A., Ed.; Springer: New York, NY, USA, 2011; pp. 463–487. [Google Scholar] [CrossRef]
- Rosenstein, M.T.; Collins, J.J.; De Luca, C.J. A practical method for calculating largest Lyapunov exponents from small data sets. Phys. D Nonlinear Phenom. 1993, 65, 117–134. [Google Scholar] [CrossRef]
Disclaimer/Publisher’s Note: The statements, opinions and data contained in all publications are solely those of the individual author(s) and contributor(s) and not of MDPI and/or the editor(s). MDPI and/or the editor(s) disclaim responsibility for any injury to people or property resulting from any ideas, methods, instructions or products referred to in the content. |
© 2025 by the authors. Licensee MDPI, Basel, Switzerland. This article is an open access article distributed under the terms and conditions of the Creative Commons Attribution (CC BY) license (https://creativecommons.org/licenses/by/4.0/).