Abstract
A two-dimensional plasma–wave interaction model, which is based on the cold collisional plasma dielectric tensor, is applied to investigate the wave propagation and power depositions under different magnetic configurations in helicon plasmas. The varied magnetic configurations are formed by changing the radius of the magnetic coil. When the magnetic coil was positioned closer to the plasma, the magnetic field within the plasma became stronger and more curved. Consequently, the simulation results show that the wave propagation and power deposition in plasmas follow the curved magnetic field lines. In the axial direction, the periodic distribution of wave fields and power deposition are clearly observed and keep consistency in helicon plasmas due to the eigenmodes of helicon waves. Furthermore, a concave dark area where the wave cannot propagate is observed in the closest magnetic coil case and leads to limited power deposition.
1. Introduction
Electric propulsion has become one of the most widely used technologies in space propulsion due to its advantages of long lifetime, high reliability and low cost [1,2,3]. A prominent type of electric propulsion is the helicon plasma thruster, which represents a novel electrodeless system [4,5,6,7,8,9,10,11]. This propulsion system consists of a helicon plasma source and a magnetic nozzle. The helicon plasma source is primarily responsible for the ionization of the propellant gas, while the magnetic nozzle facilitates plasma acceleration, resulting in the generation of thrust [12,13].
The helicon source of thrusters utilizes RF antennas to emit electromagnetic waves in a background magnetic field for the purpose of ionizing neutral gas [14,15,16]. Due to its distinctive physical mechanism, it can achieve remarkably high ionization efficiency [17]. This property was first discovered in the experiments by Boswell in 1980s [18] and was a key factor in its suitability as a plasma source for electric propulsion. Moreover, it also has broad application prospects in the fields of material processing, plasma etching and fusion-relevant processes [17,19]. Therefore, extensive studies for the helicon source have been carried out by numerous researchers. The wave propagation, the mechanism of power deposition and plasma transport in helicon sources have been extensively investigated [17,20,21]. It is found that there are two branches of waves existing in helicon plasmas [14,22,23]. One is the helicon mode, which is a fast wave with long wavelength. And the other one is the Trivelpiece–Gould (TG) mode, which is a slow wave with small wavelength compared with the helicon mode. These two coupling modes propagating in plasmas are one of reason for the high ionization rate of the helicon source and the mode conversion between them could be the main mechanism of power deposition [17,20]. Furthermore, the experimental results show that the helicon plasma source can operate in three distinct modes: capacitive (E mode), inductive (H mode) and helicon-wave mode (W mode) [24]. The mode transition can be observed with increasing power or magnetic field, and a density jump occurs from one mode to another. In general situation, the W mode can produce higher plasma density than others. And in recent study, it was found that there is a special discharge mode called ‘blue core’ in the helicon-wave mode that can further enhance the plasma density and the plasma can present a very bright core of blue lights [25].
The influence of background magnetic fields plays a vital role in determining the performance of helicon sources [26]. Traditionally, theoretical and numerical studies have predominantly assumed the applied magnetic fields to be homogeneous, aiming to simplify their inherent complexity. Arnush and Chen [27] developed a plasma–wave interaction model based on the uniform magnetic field to investigate the property of wave propagation in different parameter regimes. Cho also established a 1D self-consistent model of helicon plasmas to calculate the coupling of the plasma–wave interaction and plasma transports [28]. Nevertheless, it is crucial to recognize that magnetic fields in helicon discharges are inherently non-uniform, and this non-uniformity would lead a substantial influence on both wave propagation and plasma transport. Therefore, Kinder and Kushner [29,30] developed a two-dimensional Hybrid Plasma Equiqment Model (HPEM) to study the power absorption and plasma transport in helicon source with considering the non-uniform magnetic field. Similarly, the other self-consistent model, which can deal with 2D non-uniform properties, was introduced by Bose et al. [31]. It is concluded that the propagation of waves is enhanced in the downstream by increasing the electromagnet coil current ratio (CCR) and this is accompanied by a increase in power absorption in the downstream. In order to simulate the physical processes in a linear helicon device, Naulin [32] established a 3D global fluid model, which considered the inhomogeneous magnetic field. The phenomenon of turbulent fluctuations are observed in numerical results and the results agree well with the experiments. Magarotto et al. [33,34] presented a numerical tool named 3D-VIRTUS, which consists of an Electro-Magnetic Module and a Fluid Module to simulate the helicon plasma sources with inhomogeneous plasma density and magnetic field. This code has been validated against other well-established numerical approaches and experimental measurements. A two-dimensional fully kinetic particle-in-cell model coupling with the electromagnetic wave module was introduced by Emoto [35] to investigate the thrust generation of a magnetic nozzle in a helicon plasma thruster. It is found that the diamagnetic effect plays a significant role in the thruster generation. In addition, a hybrid PIC/fluid transport model combined with a frequency-domain electromagnetic field model was introduced by Jiménez [36] to analyze the helicon discharge with a cusped magnetic configuration in helicon thrusters. It is concluded that the cusp plays a central role in determining the plasma losses to the walls.
Thus, the non-uniformity of magnetic fields is a crucial problem of helicon discharges. In this paper, the wave propagation and power deposition with different magnetic configurations in helicon plasmas are investigated by a 2D plasma–wave interaction model. The wave pattern and the distribution of power density are discussed to analyze the characteristics of wave propagation in different distributions of magnetic fields.
2. Model Description
Figure 1 sketches the typical helicon source system inside a conducting vacuum chamber of length L and radius . The cylindrical coordinate is considered in this model. The helicon source of radius , located in the center of chamber, is made of a cylindrically dielectric tube where the plasma is generated and heated. The thickness of the dielectric tube is not taken into account. The plasma in the tube is confined by the background magnetic field , which is produced by the external magnetic coil. Here, a single magnetic coil is considered to produce the magnetic field and the magnetic configuration is varied by changing the radius of the magnetic coil . Thus, the distribution of magnetic fields is given as [37]
where is the local angle between the magnetic field and the axis. In the helicon source, the plasma density is nonuniform and considered to be as a function of . The antenna with the radius wrapped around the plasma source emits the electromagnetic radiation of frequency . The EM wave propagates in the plasma and the angle between the wavenumber and the magnetic field is defined as .
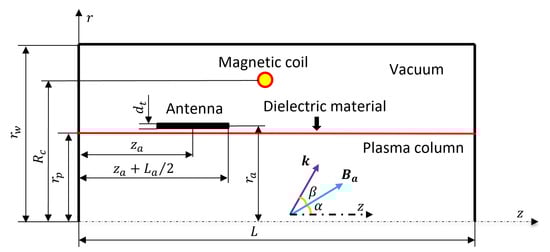
Figure 1.
Typical geometry of helicon sources.
Therefore, Maxwell equations, which govern the plasma wave response, are given in the frequency domain
where and represent the induced electromagnetic field. is the external current density, which is determined by the geometry of specific antenna types. is the electric displacement field and the expression is written as [19]
Here, is the permittivity in the vacuum and is a general dielectric tensor in the medium. Considering the applied magnetic field, the general dielectric tensor takes the form [37,38]
where () is the component of the dielectric tensor and can be written as [39]
where and are the cyclotron and plasma angular frequencies for ions and electrons (). is the particle collision frequency and is the sign of the electric charge. It is noted that we consider the helicon plasma is cold and low temperature. Thus, the thermal effect of particles like Landau damping is not taken into account.
Then, all variables are assumed to vary as , the general Maxwell equations can be expanded for each azimuthal m mode [37]
Considering the helicon source is enclosed in a metallic vacuum chamber, the boundary condition in this model is mainly determined by the ideally conducting walls and the smooth condition in the symmetric axis. Therefore, the boundary conditions are written as [40,41]
and at the symmetric axis
Therefore, this equation system can be solved by applying the finite difference method and Yee’s scheme coupling the boundary conditions to obtain all components of EM fields. The Yee’s scheme is a well-known staggered grids method to discretize the calculation domain for the electromagnetic wave propagation problems [42]. The different components of EM fields are positioned in different grids. The advantages of this method are convenient to deal with boundary conditions and reduce the calculation time. This algorithm has been well described in Refs. [37,40,41].
Once all EM fields have been determined, the power deposition in plasmas can be calculated. The time-averaged power density in plasmas for each m mode is [26,37]
Here, is the current density of plasmas. The asterisk represents the complex conjugate. It is assumed that the antenna is a perfect conductor and no power is loss in it. All RF energy is deposited in the plasma. Therefore, the total power absorbed by plasmas is
where is the volume of plasmas. The antenna impedance Z can be calculated by [27]
where represents the volume of antenna. is the amplitude of the antenna current. Thus, the antenna resistance and reactance are and , respectively.
3. Results and Discussion
In this section, the numerical results of different magnetic configurations in helicon plasmas are discussed. The numerical simulations are carried out by the two-dimensional plasma–wave interaction model, and the geometric setup of the helicon source is depicted in Figure 1. The source system which has a radius of 1 cm, is immersed in a cylindrical vacuum chamber with the length 10 cm and the radius 2 cm. A typical antenna type named ‘Nagoya III’ is applied to emit RF electromagnetic waves with a frequency of MHz for ionizing and heating the plasma. It is assumed that the antenna wire is an ideal thin conductor. The radial component of the current density can be neglected. Thus, the expression of current density for the Nagoya III antenna is written as [37,40]
Here, and are the position of the axial ends of the antenna. H is the Heaviside step function and is given as a Gaussian function profile in order to deal with the singularity at the antenna border [37]. The azimuthal component of current density is calculated by satisfying the divergence free of the antenna current. For Nagoya III antenna, the main contribution of azimuthal modes m has been proved to be mode [37,40,41]. It can be higher than . Therefore, only mode is taken into account in the simulation.
In this work, we focus on the wave propagation in different magnetic configurations. Thus, in order to reduce the complexity due to the process of the plasma transport, the fluid process of plasmas is not taken into account. The plasma parameters is given as an input data. It is assumed that the plasma density in helicon source is axially uniform and satisfies a Gaussian distribution in radial direction [37,43]. The reference density is set at the position of center. The particle collision in plasmas is considered to be dominated by the electron–ion collision and the electron collision frequency is . It can be written as
where n is the plasma density and is the electron temperature. is the parameter depending on the electron density and temperature.
In this model, the magnetic coil is used to produce the background magnetic field to confine the plasmas. The magnetic configurations is implemented by varying the radius of magnetic coil. We set that a single magnetic coil is axially located at the center of the plasma source and the current on the magnetic coil is unchanged. The resulting magnetic configuration can be determined by the radius of magnetic coil and calculated by Ampere’s law [44,45]. All parameters of the source system in simulations are given in Table 1.

Table 1.
Numerical parameters used in the simulations.
In addition, the finite different method with Yee’ s scheme is applied on a uniform Cartesian grid in to discretize Equations (9)–(14) into a matrix problem, which is then solved numerically for and on the grid nodes with a direct serial solver. Each of staggered regular grid used here has nodes, which for the chamber geometry gives a cell size with m, m. Therefore, the calculation time for this setting is about two hours per case in this work.
Figure 2 shows the spatial distribution of magnetic field produced by a single magnetic coil in this source structure when the radius of coil is 3 cm. The yellow light point is the position of the current loop of magnetic coil. The magnetic field streamlines are represented by the black solid line and the red solid line gives the bound between the vacuum and plasmas. It is known, based on Ampere’s law, that the produced magnetic field near the coil is stronger. Therefore, the magnitude and curvature of magnetic fields in plasmas become larger when the radius of the coil decreases, which means that the magnetic coil is much closer to the plasmas. Based on these simulation setting, the uniform magnetic field and different magnetic configuration by varying the radius of magnetic coil are presented and discussed.
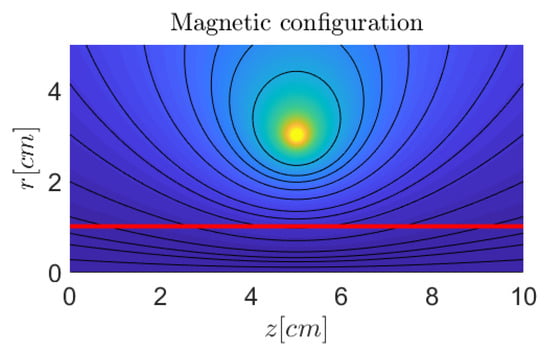
Figure 2.
The spatial distribution of magnetic field when the radial position of magnetic coil is cm. The black lines represent the magnetic lines and the red line is the bound between the plasma and vacuum.
3.1. The Uniform Magnetic Configuration
The uniform magnetic field applying in the plasma source, which are given as a nominal simulation case to compare with other magnetic configuration cases, are investigated in this part. The 2D distribution contour of magnetic field in plasmas are described in Figure 3. Because of the uniformity, the magnitude of magnetic field is a constant and equal to 150 G. Moreover, the magnetic lines are completely axial. It is noticed that the uniform magnetic configuration is equivalent to the case that the radius of magnetic coil is located at infinity.
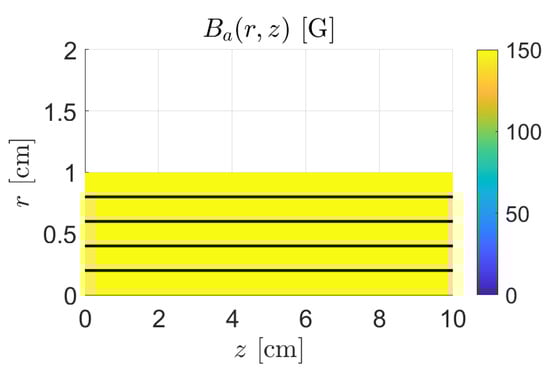
Figure 3.
The spatial distribution of magnetic field for uniform magnetic configuration case. The black solid lines represent the magnetic lines.
Figure 4 shows the absolute values of electromagnetic fields and induced by the antenna when the applied magnetic field is homogeneous. The results reveal that the magnitude of EM fields in vacuum space is trivial except for the location of the RF antenna. However, the EM fields are significantly enhanced in the plasma region and exhibits a periodic distribution in axial direction. This results mention that the main RF energy emitting by the antenna deposits in the plasma region and can be proved by the results of power density in Figure 5. And, the periodic phenomenon is due to the dominant parallel eigenmode of helicon waves in axial direction. According to the dispersion relation of non-uniform helicon plasmas, we have the relation [40,46]
where c is the speed of light. is the parallel wavenumber, with the axial wavelength . Therefore, the square of axial wavelength is proportional to the strength of the applied magnetic field. In addition, the small wavelength mode (TG mode) coupling to the helicon mode can be observed in the variation of in radial direction. The TG mode mainly concentrates propagating near the boundary of plasmas, whereas the long-wavelength helicon mode propagates in the bulk region of plasmas. In addition, the influence of reflection of boundaries are also observed in Figure 4.
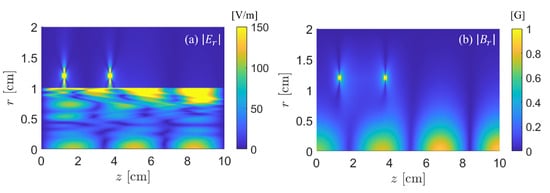
Figure 4.
The spatial distribution of induced electromagnetic fields for uniform magnetic field case.
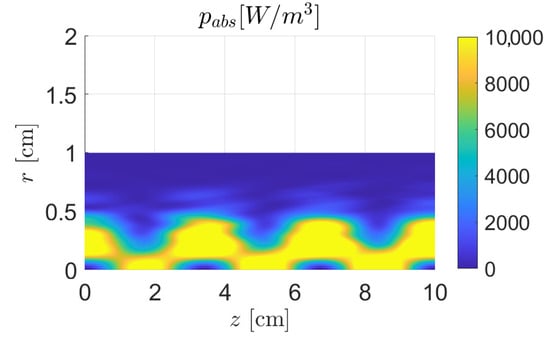
Figure 5.
The spatial distribution of power density for uniform magnetic configuration case.
The absorbed power density in plasmas for the uniform magnetic field case is given in Figure 5. The axially periodic distribution for the “hot regions” where the local maximum power density occurs is also observed and it is consistent with the results of wave fields in Figure 4. This further proves that the main parallel eigenmode dominates the wave propagation and power deposition in helicon plasmas. Moreover, the ‘hot regions’ mainly concentrate in the center of plasmas and the power density decreases significantly in the radial direction due to the reduction of plasma density and collision frequency.
3.2. The Non-Uniform Magnetic Configuration
Different configurations of magnetic fields applied in helicon plasmas can significantly affect the wave propagation and power depositions. In this part, four magnetic field distributions, which are formed by varying the position of magnetic coil, are investigated. The spatial wave patterns and power density in plasmas are described and discussed.
Figure 6 shows the 2D contour map of magnetic fields when different radii of magnetic coil are changing. When the radius of magnetic coil is sufficiently large, as cm, it produces an almost uniform magnetic field distribution, with the magnetic field lines in the plasma source being nearly parallel to the axis. As decreases, the magnetic coil is closer to the plasma source. The strength of magnetic field is higher in the center and gradually goes down on both sides. The magnetic field lines also become more curved in the center and divergent to both ends.
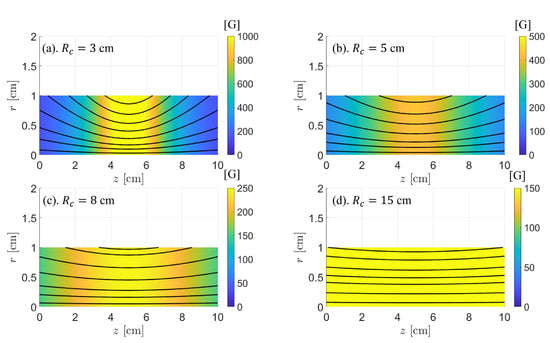
Figure 6.
The spatial distribution of magnetic field for different magnetic configurations. The black solid lines represent the magnetic lines.
When the radial of magnetic coil is cm, the local maximum magnetic field strength in the center is higher than 1000 G. The wave propagation in space are given in Figure 7. It is shown that the wave propagation is suppressed in a concave region of plasmas where it is near the location of magnetic coil and leads to a dark area in the contour map. This is because the RF wave cannot propagate into plasmas due to a very strong magnetic field in this region. Additionally, it can be clearly seen that the wave propagation follows the magnetic field lines. The curved distributions of wave fields keep consistency with the trends of magnetic field lines. With increasing , the curvature of magnetic field lines gradually become small and the wave still propagates in plasmas along the magnetic lines, which shows in Figure 7b–d. The TG mode can be clearly observed near the boundary when the radius of magnetic coil is large. The periodic structure along the axial direction still exists and the wavelength becomes small with increasing the radius of magnetic coil. This is because the strength of magnetic fields reduces when the magnetic coil is far away from the plasma. Moreover, the distribution of wave fields in the results suggests that the reflection of wave occurs in the plasma due to the conducting ends and plasma boundary and it is enhanced by the curved magnetic fields.
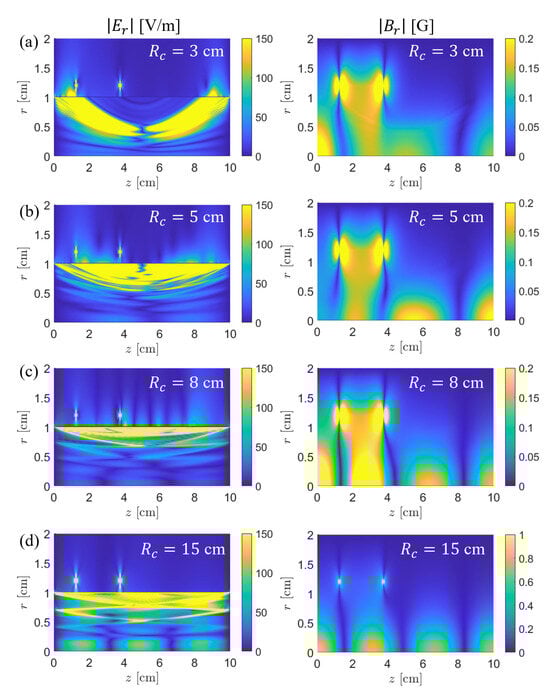
Figure 7.
The spatial distribution of induced electromagnetic fields for different magnetic configurations. The absolute values of (left column) and (right column) are given, respectively. The radial position of magnetic coil is varied from cm to cm.
Consequently, the power absorbed density shown in Figure 8 also exhibits the trends that follow the magnetic field lines. Moreover, in the high magnetic field region at the axial center in the case of cm, a concave “cold zone” can be observed due to the suppression of wave propagation in this region. As increases, the curvature and strength of the magnetic field decrease, making the axial periodic structure more evident. It further confirms that wave propagation and power deposition in plasmas follow the variation of magnetic field lines. When cm, the magnetic field distribution tends to be uniform. Hence, the resulting EM filed distribution and power density is similar with the uniform case, except the region where the curvature of magnetic lines is enhanced near the plasma boundary. Table 2 gives the antenna impedance for different magnetic configurations. The uniform magnetic field case has the maximum antenna resistance and suggests that it leads to the optimal plasma–wave coupling in these configurations. The plasma resistance of the case cm is close to the uniform case. This further confirms the results of Figure 8. And, the resistance is small when the magnetic coil is quite near the plasma. For the antenna reactance, it is observed that the magnetic configurations influences the reactance slightly.
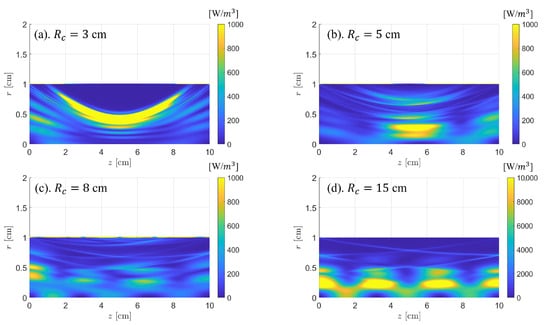
Figure 8.
The spatial distribution of power density for different magnetic configurations.
Table 2.
The antenna impedance of different magnetic configurations.
4. Conclusions
The wave propagation and power deposition with different magnetic configurations in helicon plasmas have been investigated. The two-dimensional plasma–wave interaction model, which is based on the finite difference method and Yee’s scheme, has been introduced. The magnetic configurations are varied by changing the radial position of the magnetic coil. As suggested by Ampere’ s law, it is shown that the magnetic field in plasmas is stronger and more curved when the magnetic coil is closer to the plasmas.
Therefore, the wave propagation and power absorption in different magnetic configurations including the uniform case have been simulated. It is concluded that the axially periodic distribution of wave pattern due to the eigenmodes of helicon waves is clearly observed and the “hot regions”, which are the local maximum of power density, keeps consistency with the distribution of electromagnetic waves. When the radius of the magnetic coil becomes small, the wave propagation and power density would be curved alone with the magnetic field lines and the axially periodic phenomenon still exits. The reflection of wave due to the conducting ends can also be seen and it is enhanced by the curved magnetic lines. When the magnetic coil is much closer to the plasmas, with the radius cm, a saddle type of magnetic configuration, which has much stronger strength of magnetic fields in the center of plasmas, are formed. Thus, a concave dark area in plasmas where the wave cannot propagates and hardly be deposited is shown. This leads to very small plasma resistance and is not beneficial for plasma–antenna coupling.
Author Contributions
Methodology, B.T.; Validation, S.-L.Y.; Investigation, B.A. and J.W.; Writing—original draft, B.T.; Writing—review & editing, B.T.; Supervision, K.X. and Y.C. All authors have read and agreed to the published version of the manuscript.
Funding
This work was supported by the National Natural Science Foundation of China (No. 51907039) and Chengdu Technology Project (No. 2023-JB00-00034-GX). Yong Cao’s contribution was supported by Guangdong Basic and Applied Basic Research Foundations (No. 2023A1515010137) and Shenzhen Technology Projects (Nos. ZDSYS201707280904031 and GJHZ20220913143010019).
Data Availability Statement
Dataset available on request from the authors.
Conflicts of Interest
The authors declare no conflicts of interest.
References
- Goebel, D.M.; Katz, I. Fundamentals of Electric Propulsion: Ion and Hall Thrusters; Wiley: New York, NY, USA, 2008; Volume 1. [Google Scholar]
- Ahedo, E. Plasmas for space propulsion. Plasma Phys. Control. Fusion 2011, 53, 124037. [Google Scholar] [CrossRef]
- Martinez-Sanchez, M.; Pollard, J.E. Spacecraft electric propulsion-an overview. J. Propuls. Power 1998, 14, 688–699. [Google Scholar] [CrossRef]
- West, M.D.; Charles, C.; Boswell, R.W. Testing a helicon double layer thruster immersed in a space-simulation chamber. J. Propuls. Power 2008, 24, 134–141. [Google Scholar] [CrossRef]
- Batishchev, O.V. Minihelicon plasma thruster. IEEE Trans. Plasma Sci. 2009, 37, 1563–1571. [Google Scholar] [CrossRef]
- Takahashi, K.; Komuro, A.; Ando, A. Effect of source diameter on helicon plasma thruster performance and its high power operation. Plasma Sources Sci. Technol. 2015, 24, 055004. [Google Scholar] [CrossRef]
- Takahashi, K. Magnetic nozzle radiofrequency plasma thruster approaching twenty percent thruster efficiency. Sci. Rep. 2021, 11, 2768. [Google Scholar] [CrossRef] [PubMed]
- Takahashi, K. Thirty percent conversion efficiency from radiofrequency power to thrust energy in a magnetic nozzle plasma thruster. Sci. Rep. 2022, 12, 18618. [Google Scholar] [CrossRef] [PubMed]
- Coppola, G.; Panelli, M.; Battista, F. Preliminary design of helicon plasma thruster by means of particle swarm optimization. AIP Adv. 2023, 13, 055209. [Google Scholar] [CrossRef]
- Navarro-Cavalle, J.; Wijnen, M.; Fajardo, P.; Ahedo, E.; Gomez, V.; Giménez, A.; Ruiz, M. Development and characterization of the helicon plasma thruster prototype HPT05M. In Proceedings of the 36th International Electric Propulsion Conference, Vienna, Austria, 15–20 September 2019. IEPC-2019-596. [Google Scholar]
- Diaz, F.R.C. Recent Progress on the VASIMR Engine. In Proceedings of the 37th International Electric Propulsion Conference, Boston, MA, USA, 19–23 June 2022. IEPC-2022-525. [Google Scholar]
- Ahedo, E.; Navarro-Cavallé, J. Helicon thruster plasma modeling: Two-dimensional fluid-dynamics and propulsive performances. Phys. Plasmas 2013, 20, 043512. [Google Scholar] [CrossRef]
- Takahashi, K. Helicon-type radiofrequency plasma thrusters and magnetic plasma nozzles. Rev. Mod. Plasma Phys. 2019, 3, 3. [Google Scholar] [CrossRef]
- Shamrai, K.P.; Taranov, V.B. Resonance wave discharge and collisional energy absorption in helicon plasma source. Plasma Phys. Control. Fusion 1994, 36, 1719. [Google Scholar] [CrossRef]
- Chen, F.F.; Boswell, R.W. Helicons-the past decade. IEEE Trans. Plasma Sci. 1997, 25, 1245–1257. [Google Scholar] [CrossRef]
- Aliev, Y.M.; Kramer, M. Propagation of guided modes in strongly non-uniform helicon-produced plasma. Phys. Plasmas 2014, 21, 013508. [Google Scholar] [CrossRef]
- Chen, F.F. Helicon discharges and sources: A review. Plasma Sources Sci. Technol. 2015, 24, 014001. [Google Scholar] [CrossRef]
- Boswell, R.W. Very efficient plasma generation by whistler waves near the lower hybrid frequency. Plasma Phys. Control. Fusion 1984, 26, 1147. [Google Scholar] [CrossRef]
- Lieberman, M.A.; Lichtenberg, A.J. Principles of Plasma Discharges and Materials Processing, 2nd ed.; Wiley: Hoboken, NJ, USA, 2005. [Google Scholar]
- Shinohara, S. Helicon high-density plasma sources: Physics and applications. Adv. Phys. X 2018, 3, 1420424. [Google Scholar] [CrossRef]
- Isayama, S.; Shinohara, S.; Hada, T. Review of helicon high-density plasma: Production mechanism and plasma/wave characteristics. Plasma Fusion Res. 2018, 13, 1101014. [Google Scholar] [CrossRef]
- Cho, S. The field and power absorption profiles in helicon plasma resonators. Phys. Plasmas 1996, 3, 4268–4275. [Google Scholar] [CrossRef]
- Shamrai, K.P.; Taranov, V.B. Volume and surface rf power absorption in a helicon plasma source. Plasma Sources Sci. Technol. 1996, 5, 474. [Google Scholar] [CrossRef]
- Ellingboe, A.R.; Boswell, R.W. Capacitive, inductive and helicon-wave modes of operation of a helicon plasma source. Phys. Plasmas 1996, 3, 2797–2804. [Google Scholar] [CrossRef]
- Corr, C.S.; Boswell, R.W. High-beta plasma effects in a low-pressure helicon plasma. Phys. Plasmas 2007, 14, 122503. [Google Scholar] [CrossRef]
- Tian, B.; Merino, M.; Wan, J.; Hu, Y.; Cao, Y. Investigation of radial heat conduction with 1D self-consistent model in helicon plasmas. Plasma Sci. Technol. 2023, 25, 015401. [Google Scholar] [CrossRef]
- Arnush, D.; Chen, F.F. Generalized theory of helicon waves. II. Excitation and absorption. Phys. Plasmas 1998, 5, 1239–1254. [Google Scholar] [CrossRef]
- Cho, S.; Lieberman, M.A. Self-consistent discharge characteristics of collisional helicon plasmas. Phys. Plasmas 2003, 10, 882–890. [Google Scholar] [CrossRef]
- Kinder, R.L.; Kushner, M.J. Noncollisional heating and electron energy distributions in magnetically enhanced inductively coupled and helicon plasma sources. J. Appl. Phys. 2001, 90, 3699–3712. [Google Scholar] [CrossRef]
- Kinder, R.L.; Ellingboe, A.R.; Kushner, M.J. H-to W-mode transitions and properties of a multimode helicon plasma reactor. Plasma Sources Sci. Technol. 2003, 12, 561. [Google Scholar] [CrossRef]
- Bose, D.; Govindan, T.R.; Meyyappan, M. Modelling of magnetic field profile effects in a helicon source. Plasma Sources Sci. Technol. 2004, 13, 553. [Google Scholar] [CrossRef]
- Naulin, V.; Windisch, T.; Grulke, O. Three-dimensional global fluid simulations of cylindrical magnetized plasmas. Phys. Plasmas 2008, 15, 012307. [Google Scholar] [CrossRef]
- Magarotto, M.; Melazzi, D.; Pavarin, D. 3D-VIRTUS: Equilibrium condition solver of radio-frequency magnetized plasma discharges for space applications. Comput. Phys. Commun. 2020, 247, 106953. [Google Scholar] [CrossRef]
- Magarotto, M.; Di Fede, S.; Souhair, N.; Andrews, S.; Ponti, F. Numerical suite for cathodeless plasma thrusters. Acta Astronaut. 2022, 197, 126–138. [Google Scholar] [CrossRef]
- Emoto, K.; Takahashi, K.; Takao, Y. Numerical investigation of internal plasma currents in a magnetic nozzle. Phys. Plasmas 2021, 28, 093506. [Google Scholar] [CrossRef]
- Jiménez, P.; Zhou, J.; Navarro, J.; Fajardo, P.; Merino, M.; Ahedo, E. Analysis of a cusped helicon plasma thruster discharge. Plasma Sources Sci. Technol. 2023, 32, 105013. [Google Scholar] [CrossRef]
- Tian, B.; Merino, M.; Ahedo, E. Two-dimensional plasma-wave interaction in an helicon plasma thruster with magnetic nozzle. Plasma Sources Sci. Technol. 2018, 27, 114003. [Google Scholar] [CrossRef]
- Sánchez-Villar, Á.; Zhou, J.; Ahedo, E.; Merino, M. Coupled plasma transport and electromagnetic wave simulation of an ECR thruster. Plasma Sources Sci. Technol. 2021, 30, 045005. [Google Scholar] [CrossRef]
- Stix, T.H. Waves in Plasmas; Springer Science Business Media: Berlin/Heidelberg, Germany, 1992. [Google Scholar]
- Chen, G.; Arefiev, A.V.; Bengtson, R.D.; Breizman, B.N.; Lee, C.A.; Raja, L.L. Resonant power absorption in helicon plasma sources. Phys. Plasmas 2006, 13, 123507. [Google Scholar] [CrossRef]
- Chang, L.; Hole, M.J.; Caneses, J.F.; Chen, G.; Blackwell, B.D.; Corr, C.S. Wave modeling in a cylindrical non-uniform helicon discharge. Phys. Plasmas 2012, 19, 083511. [Google Scholar] [CrossRef]
- Yee, K. Numerical solution of initial boundary value problems involving Maxwell’s equations in isotropic media. IEEE Trans. Antennas Propag. 1966, 14, 302–307. [Google Scholar]
- Kramer, M. Propagation and damping of m = +1 and m = -1 helicon modes in an inhomogeneous plasma column. Phys. Plasmas 1999, 6, 1052–1058. [Google Scholar] [CrossRef]
- Merino, M.; Ahedo, E. Two-dimensional quasi-double-layers in two-electron-temperature, current-free plasmas. Phys. Plasmas 2013, 20, 023502. [Google Scholar] [CrossRef]
- Mario Merino Mariomerinomartinez/Magnetic_Field: First Release 2017. Available online: https://zenodo.org/records/496131 (accessed on 20 February 2024).
- Breizman, B.N.; Arefiev, A.V. Radially localized helicon modes in nonuniform plasma. Phys. Rev. Lett. 2000, 84, 3863. [Google Scholar] [CrossRef]
Disclaimer/Publisher’s Note: The statements, opinions and data contained in all publications are solely those of the individual author(s) and contributor(s) and not of MDPI and/or the editor(s). MDPI and/or the editor(s) disclaim responsibility for any injury to people or property resulting from any ideas, methods, instructions or products referred to in the content. |
© 2024 by the authors. Licensee MDPI, Basel, Switzerland. This article is an open access article distributed under the terms and conditions of the Creative Commons Attribution (CC BY) license (https://creativecommons.org/licenses/by/4.0/).