Article

Analysis of Blade Aspect Ratio’s Influence on High-Speed Axial Compressor Performance

1
Department of Mechanics and Maritime Sciences, Chalmers University of Technology, 412 96 Gothenburg, Sweden
2
Turbomachines Department, Aeronautics Institute of Technology, São José dos Campos 12228-900, SP, Brazil
3
GKN Aerospace, 461 81 Trollhättan, Sweden
*
Author to whom correspondence should be addressed.
Aerospace 2024, 11(4), 276; https://doi.org/10.3390/aerospace11040276
Submission received: 16 January 2024 / Revised: 15 March 2024 / Accepted: 27 March 2024 / Published: 31 March 2024

Abstract

:
The ratio between blade height and chord, named the aspect ratio (AR), plays an important role in compressor aerodynamic design. Once selected, it influences stage performance, blade losses and the stage stability margin. The choice of the design AR involves both aerodynamic and mechanical considerations, and an aim is frequently to achieve the desired operating range while maximizing efficiency. For a fixed set of aerodynamic and geometric parameters, there will be an optimal choice of AR that achieves a maximum efficiency. However, for a state-of-the-art aero-engine design, optimality means multi-objective optimality, that is, reaching the highest possible efficiency for a number of operating points while achieving a sufficient stability margin. To this end, the influence of the AR on the performance of the first rotor row of a multistage, multi-objective, high-speed compressor design is analyzed. A careful setup of the high-speed aerodynamic design problem allows the effect of the AR to be isolated. Close to the optimal AR, only a modest efficiency variation is observed, but a considerable change in compressor stability margin (SM) is noted. Decreasing the AR allows for increasing efficiency, but at the expense of a reduced surge margin. This allows the designer to trade efficiency for stability. Increasing the AR, however, is shown to reduce both the surge margin and efficiency; hence, a distinct optimality in stability is observed for the analyzed rotor blade row. In this work, optimality in the surge margin with respect to the AR is observed, whereas there is a close to optimal efficiency. The predicted range from AR = 1.10 to AR = 1.64 is only indicative, considering that the definition of multi-objective optimality requires balancing efficiency and the surge margin and that the choice of balancing these two criteria requires making a design choice along a pareto optimal front.

1. Introduction

In the gas turbine industry, the compressor designer usually aims to achieve a high work output per stage while retaining a good efficiency [1]. However, increasing the stage load affects the compressor aerodynamics through increased diffusion and reduced efficiency, hence posing a conflicting requirement for the designer [2], sometimes demanding the search for optimization methodologies [3]. For high-speed compressors, which usually present difficulties related to the cooling system [4], an increase in diffusion may also result in shock-induced boundary layer separation, drastically lowering efficiency. Still, a highly loaded stage is a possible solution to reduce the number of stages and consequently to decrease compressor weight, size and cost. Historically, the choice of aspect ratio (AR) has always involved the simultaneous consideration of a number of key design parameters such as work output per stage, diffusion, efficiency, surge margin and mechanical integrity. This discussion is related to changing the compressor load by means of geometric changes, although recent research also indicates the possibility to change the machine load based on air extraction [5].
Early work studying the influence of AR focused on high-AR blading, attempting to make compressors more compact and to reduce secondary flow, as reported in [6]. Ultimately, a low surge margin and greater risk of aeroelastic issues including flutter, forced response and rotating instabilities drove the designers away from high-AR compressors [7,8]. Important work highlighting the limitations of high-AR blades was reported by Koch [9], showing that with a lowering of the AR, the surge margin could be increased. Early experimental work relating efficiency and AR noted that efficiency may both increase and decrease with lower AR depending on the stage loading [10]. Wang et al. report on how flow instabilities evolve into rotating stall, which is related to relative blade clearance [11], and it is reported that the losses generated by these tip clearances can be reduced through pulsed suction methods [12]. Although the historical reasons for applying low-AR designs are valid, new design features such as intentional mistuning [13] and blade design methods to reduce clearance sensitivity [14] could potentially re-open the field for high-AR compressor design. The efficiency of gas turbines engines, depending on the turbomachine’s performance (compressors and turbines), can be improved by innovations including engines with rotating detonation [15] and pulse detonation combustion [16].
Alfredsson [17] studied the use of the Skoch parameter (SP),
SP = s . ϕ A R . c . ψ 1 + 1 ϕ t a n ( α i n ) 2 1 / 2
where s/c is the pitch-to-chord ratio, ϕ is the flow coefficient, ψ is the work coefficient and α i n is the inlet swirl angle.
The SP was used to evaluate the losses as well as predict the optimum AR range during the compressor design stage. However, as a conclusion, the Skoch parameter proved to be ineffective on both accounts. Peters et al. [18] studied a uniform increase in the AR of all stages in a multistage compressor, noting a disproportional decrease in secondary flow loss as compared to a change in a single stage. To and Miller [19] addressed the problem of optimum AR for maximum efficiency in a low-speed compressor with repeating stages. For such flows, the optimum efficiency is found at relatively low ARs, typically between 1.0 and 1.5. The optimum occurs at the point where the rate of increase in profile loss is equal to the rate of decrease in endwall loss [19]. Since the optimum AR is set by the balance between profile and endwall loss, it is understood that the prediction of optimum AR poses a challenging aerodynamic problem.
The geometry of the high-speed 3.5 stage compressor studied herein [20] is publicly available for download [21]. This design has been subject to extensive multi-objective optimization, balancing stage load, efficiency and stability. It is believed that the studied geometry represents a state-of-the-art high-speed aero-engine compressor and that conclusions drawn from the current study on optimal AR may have relevance for a wider range of modern high-speed compressor design work rather than just being applicable to this particular machine. A contribution of this work is the successful isolation of the basic trends of performance with varying ARs, as applicable to a multi-objective, high-speed aero-engine compressor.

2. Compressor Specification Description

The test case under consideration is the VINK compressor (Virtual Integrated Compressor, as Supplementary Materials), designed as part of a collaboration project with partners from Swedish universities and the industry (Chalmers University of Technology, KTH Royal Institute of Technology, Lund University, GKN Aerospace Sweden AB and Swerea). The VINK compressor is a 3.5-stage, high-speed, low-AR, low-shock-loss design [20].
For this study, only the inlet guide vane (IGV) and the first rotor blade row are considered. Table 1 summarizes the performance of the first stage of the VINK compressor as reported in [20] and Table 2 gives additional geometrical parameters. Figure 1 presents the radial variations of absolute static pressure, absolute total pressure and absolute velocity at the rotor inlet and outlet, for which values are averaged over the pitch. This illustrates the quality of the compressor, working by showing the pressure rise capability through the outlet total pressure uniformity. Together with the boundary conditions defined below, the two tables define the nominal condition, which we use for comparison to establish AR trends. Note that as the AR is parametrically varied from AR = 0.57 to AR = 2.08, each case has a reference condition defined below, from which the surge margin is quantified.
The design process for the VINK compressor is outlined in [20], starting from aircraft and engine thrust requirements and ending with 3D models of the blade rows that were made publicly available. The detailed design of the first stage, which is the geometric starting point in the present paper, was the result of multi-objective optimization with respect to stall margin and efficiency.
This work aims to systematically vary the AR of the first rotor of the VINK compressor around its nominal condition to study the variation in key performance variables such as efficiency and surge margin.

Blade and Endwall Parametrization

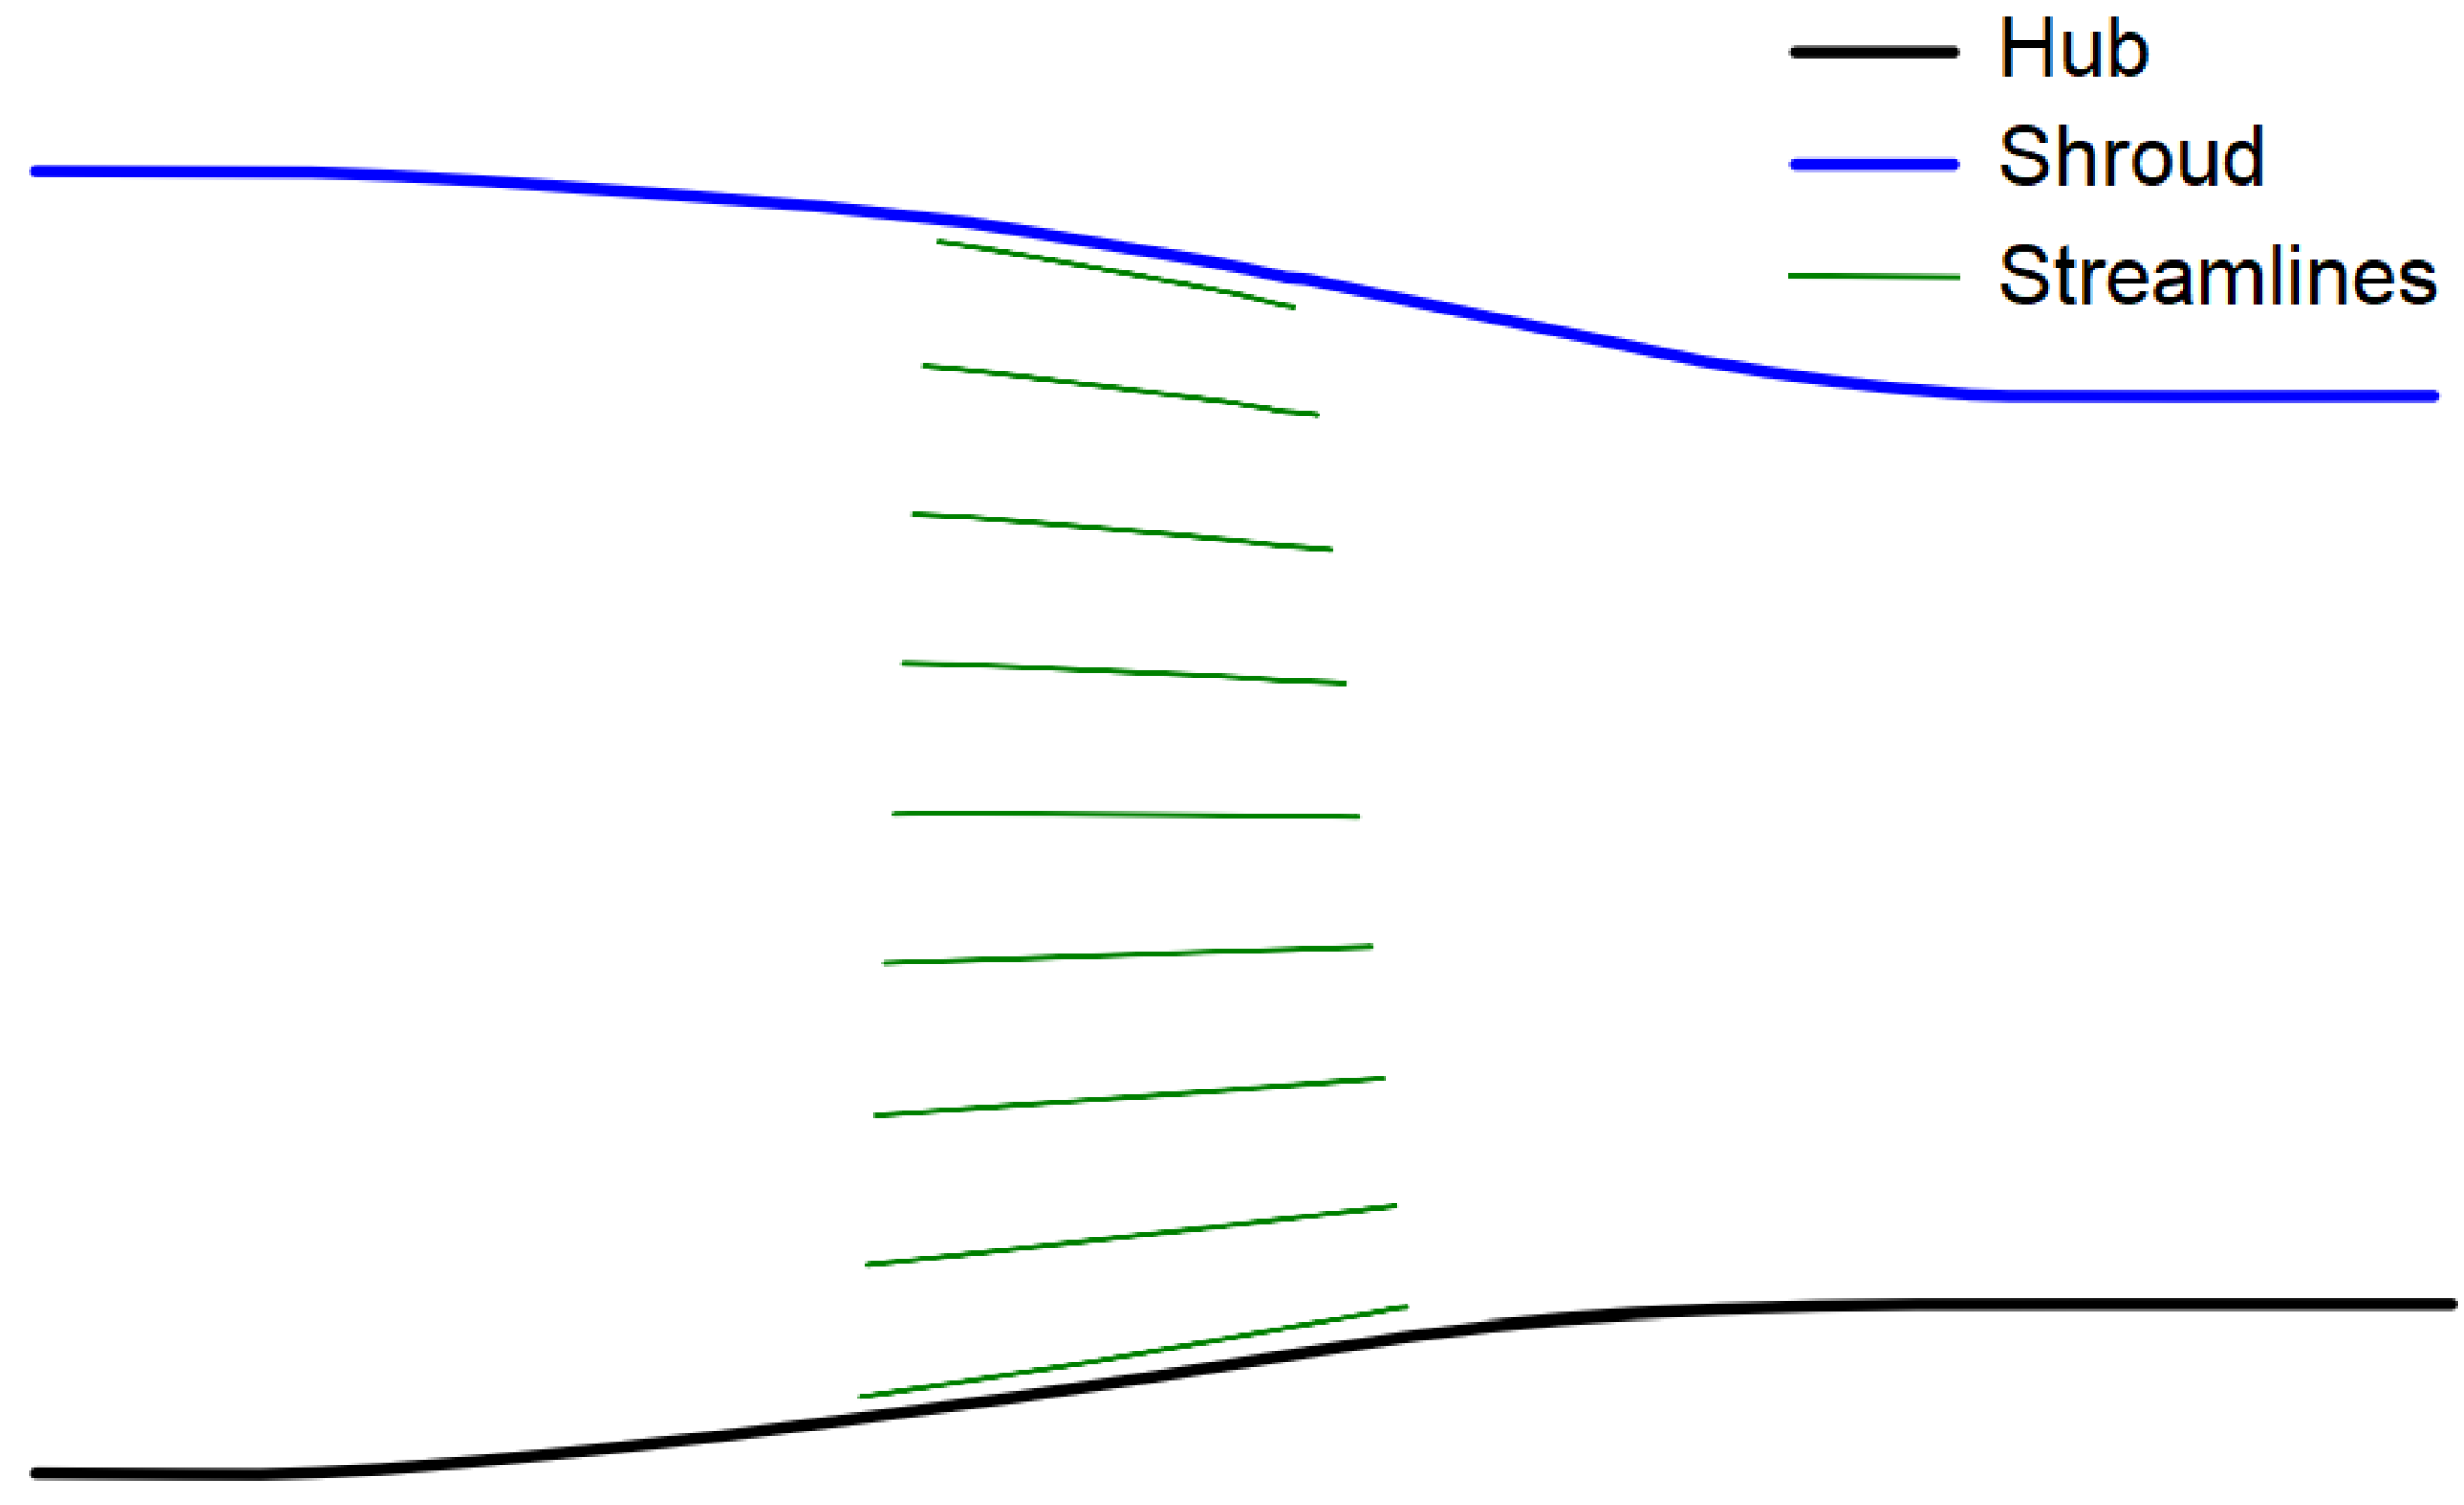
The commercial throughflow tool SC90C [22] was used to perform the preliminary design of the VINK compressor, generating both aerodynamic and geometric data. The resulting streamlines are indicated in Figure 2. Thereafter, the rotor row geometry was introduced into the Chalmers University in-house Python code for 3D blade parametrization [23]. The leading-edge design is particularly important in compressor blade rows since the initial development of the boundary layer at the leading edge influences the boundary layer over the remaining blade surface [24] and, as a consequence, it also has a direct impact on profile loss. Having developed the rotor blade parametrization, the AR could be varied by changing the blade chord length, still keeping a constant thickness-to-chord ratio.
The blade parametrization and also the geometry scaling technique are important to achieve an aerodynamic performance similarity. Zhang et al. [25] state that by keeping the similarity of blade solidity, blade angles and thickness-to-chord distribution, the similarity of key aerodynamic parameters such as loss coefficient and aerodynamic blockage and thus of the overall aerodynamic performance can generally be guaranteed. Although this has generally been achieved herein, as discussed in association with Figure 7, it should be added that the AR scaling process is quite sensitive to the rotor exit endwall contouring.
When varying the AR, upstream effects of the endwall may easily corrupt the similarity. To minimize the influence of the exit endwall contouring on the upstream flow through the rotor, constant curvature transition curves were constructed, maintaining an inflection point located at the axial middle point between the rotor exit and the domain exit (see Figure 3). As the AR of the rotor is varied from 0.57 to 2.08, the radial derivatives with axial positions at the rotor exit and domain exit are kept fixed, together with the rotor exit and domain exit radial coordinates.

3. Numerical Methodology

3.1. Approach

The efficiency (η) of a compressor is defined as the ratio between the hydraulic power ( P h ) supplied to the fluid and the machine driving shaft power ( P s ),
η = P h P s
which is not only a function of the AR but also dependent on a number of nondimensional design parameters: such as the hub-to-tip ratio ( r h u b / r t i p ), the thickness-to-chord ratio (t/c), the Mach number (M), the pitch-to-chord ratio, the tip clearance-to-chord ratio (ε/c), the Reynolds number (Rec) based on the chord, the casing configuration (config.), the flow coefficient,
ϕ = C a U
the work coefficient,
ψ = P h m ˙ U 2
the degree of reaction (Λ),
Λ = h , r o t o r h 0 , s t a g e
and the diffusion factor (DF),
DF = 1 W 2 W 1 + C u 2 W 1 ( s / c )
where C a is the axial component of the absolut velocity, U is the blade velocity, m ˙ is the mass flow rate, h , r o t o r is the rotor static enthalpy variation, h 0 , s t a g e is the stage total enthalpy variation, W 1 is the inlet relative velocity, W 2 is the outlet relative velocity and C u is the variation in the absolute velocity tangential components. Thus,
η = f   ( r h u b / r t i p ,   ϕ ,   ψ ,   Λ ,   M ,   DF ,   AR ,   s / c ,   t / c ,   ε / c ,   Re c ,   config . )
To isolate the influence of the AR, the design Mach number triangle and DF were fixed; thus, ϕ, ψ and Λ were also constant. Thus,
η = f   ( r h u b / r t i p ,   AR ,   s / c ,   t / c ,   ε / c ,   Re c ,   config )
the blade profile and pitch-to-chord ratio were fixed throughout this work. Thus, the thickness and the number of the blades had to be varied accordingly, keeping the thickness-to-chord ratio and solidity constant, respectively. The rotor also had constant values of hub and tip radius, meaning that the hub-to-tip ratio did not vary.
To isolate the effect of the AR on the high-speed compressor stage studied herein, it was decided to exclude the effect of tip clearance from the study. Tip clearance is known to have a substantial impact on compressor flows and losses [26,27]. More specifically, the choice of tip clearance may both alter the radial distribution of blade loading and contribute to influencing the breakdown of the flow in the tip region [28,29,30]. Hence, for the present study, the use of tip clearance would have introduced substantial additional difficulties for interpreting the flow, since tip clearance leakage vortices play a decisive role in the origin of rotating instabilities and stall inception [31]. Furthermore, the optimization of the VINK compressor [32] was performed for zero tip clearance, and hence including tip clearance would effectively have meant studying a non-optimal compressor. In turn, this would likely have meant that the results observed would have provided little general value. In addition, relating our results with the key work by To and Miller [19] would have become more difficult since that study assumed zero tip clearance.

3.2. Mesh Study

The mesh study was based on the nominal case (AR = 1.37 and 51 rotor blades) and the structured meshes were generated using the commercial software ANSYS®TurboGrid v. 19.1 [33]. Several structured meshes with different sizes, but always with an average y plus of less than 1.0, were generated to show mesh independence. This was carried out keeping the distance of the first elements (those closest to the walls, including blades, hub and casing) approximately constant (keeping y plus values almost constant and lower than 1.0) and increasing the total number of elements (also using a controlled stretch factor) in the three directions: blade-to-blade, radial and streamwise. The comparison was made based on the relative difference (in %) of each mesh in comparison to the finest one, as shown in Figure 4.
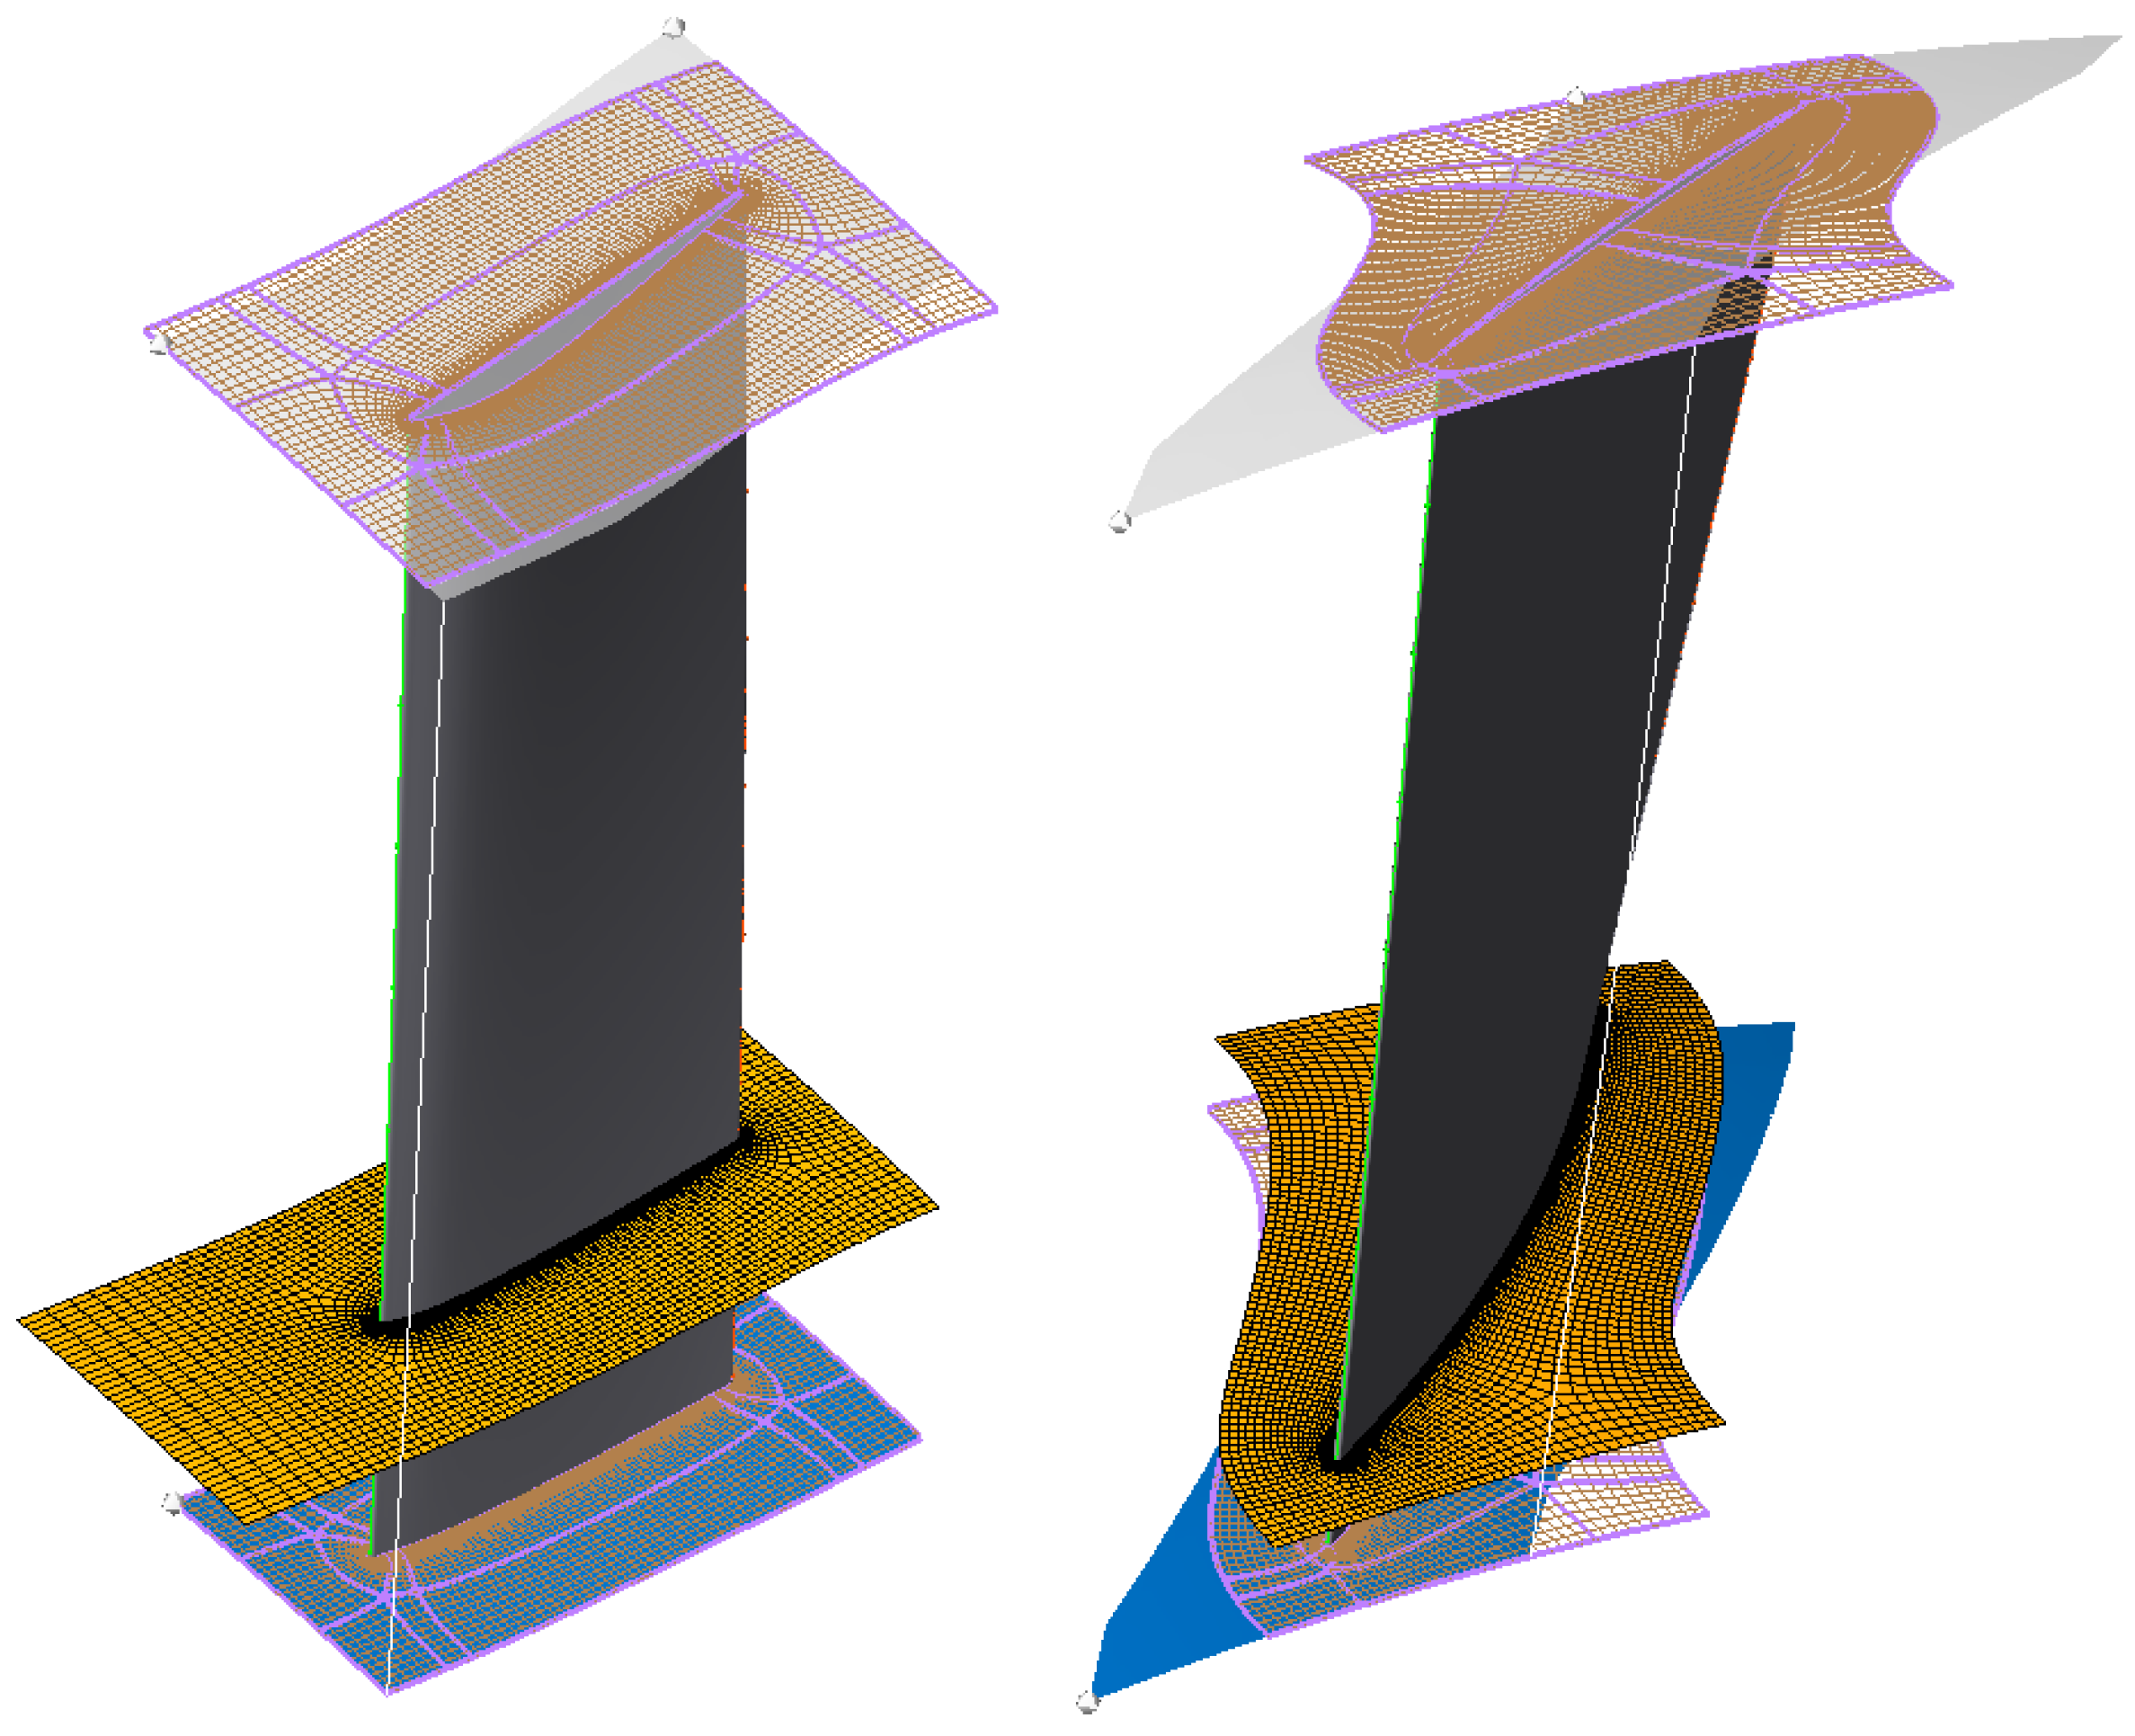
The results showed that the relative difference (in %) of the parameters (mass flow rate, total pressure ratio and polytropic efficiency) varied by less than 1.0% between the coarsest and finest meshes. Therefore, the results were considered independent of mesh in relation to the spatial discretization and to have an asymptotic tendency in relation to the number of elements. The mesh with the lowest number of elements presenting a relative difference smaller than 0.1% was chosen for the studies performed in this paper. It has 9.14 million elements (approximately 5.77 million elements for the IGV and 3.37 million elements for the rotor) and is shown in Figure 5.

3.3. Numerical Settings

The computational fluid dynamics (CFD) calculations were performed using the commercial software ANSYS®CFX v. 19.1 [34]. This is a high-performance software for CFD calculations that delivers reliable and accurate solutions quickly and robustly. It uses a density-based and finite volume discretization technique to solve the partial differential equations, the Reynolds averaged Navier–Stokes (RANS).
Based on the understanding that the surge phenomenon is inherently a transient 3D phenomenon involving the entire blade row circumference, we adopt the simplistic view that the surge can be predicted by the last stable operating point for which convergence is possible. Note that in this study, the transition from laminar to turbulent flow is not modeled since the inlet boundary condition of turbulent intensity is high (5%) and the flow is totally turbulent in the entire simulated domain, with an Re number larger than 106 in the nominal condition. This is typical for a high-speed booster, as studied in this work.
For flows with adverse pressure gradients, the two-equation eddy viscosity turbulence model named the Shear Stress Transport (SST) Model, as developed by Menter [35], is a standard choice for turbomachine applications. Wall boundaries are treated as adiabatic, and an integration to the wall is used to resolve the boundary layers. All simulation results presented herein were run assuming a steady-state flow.
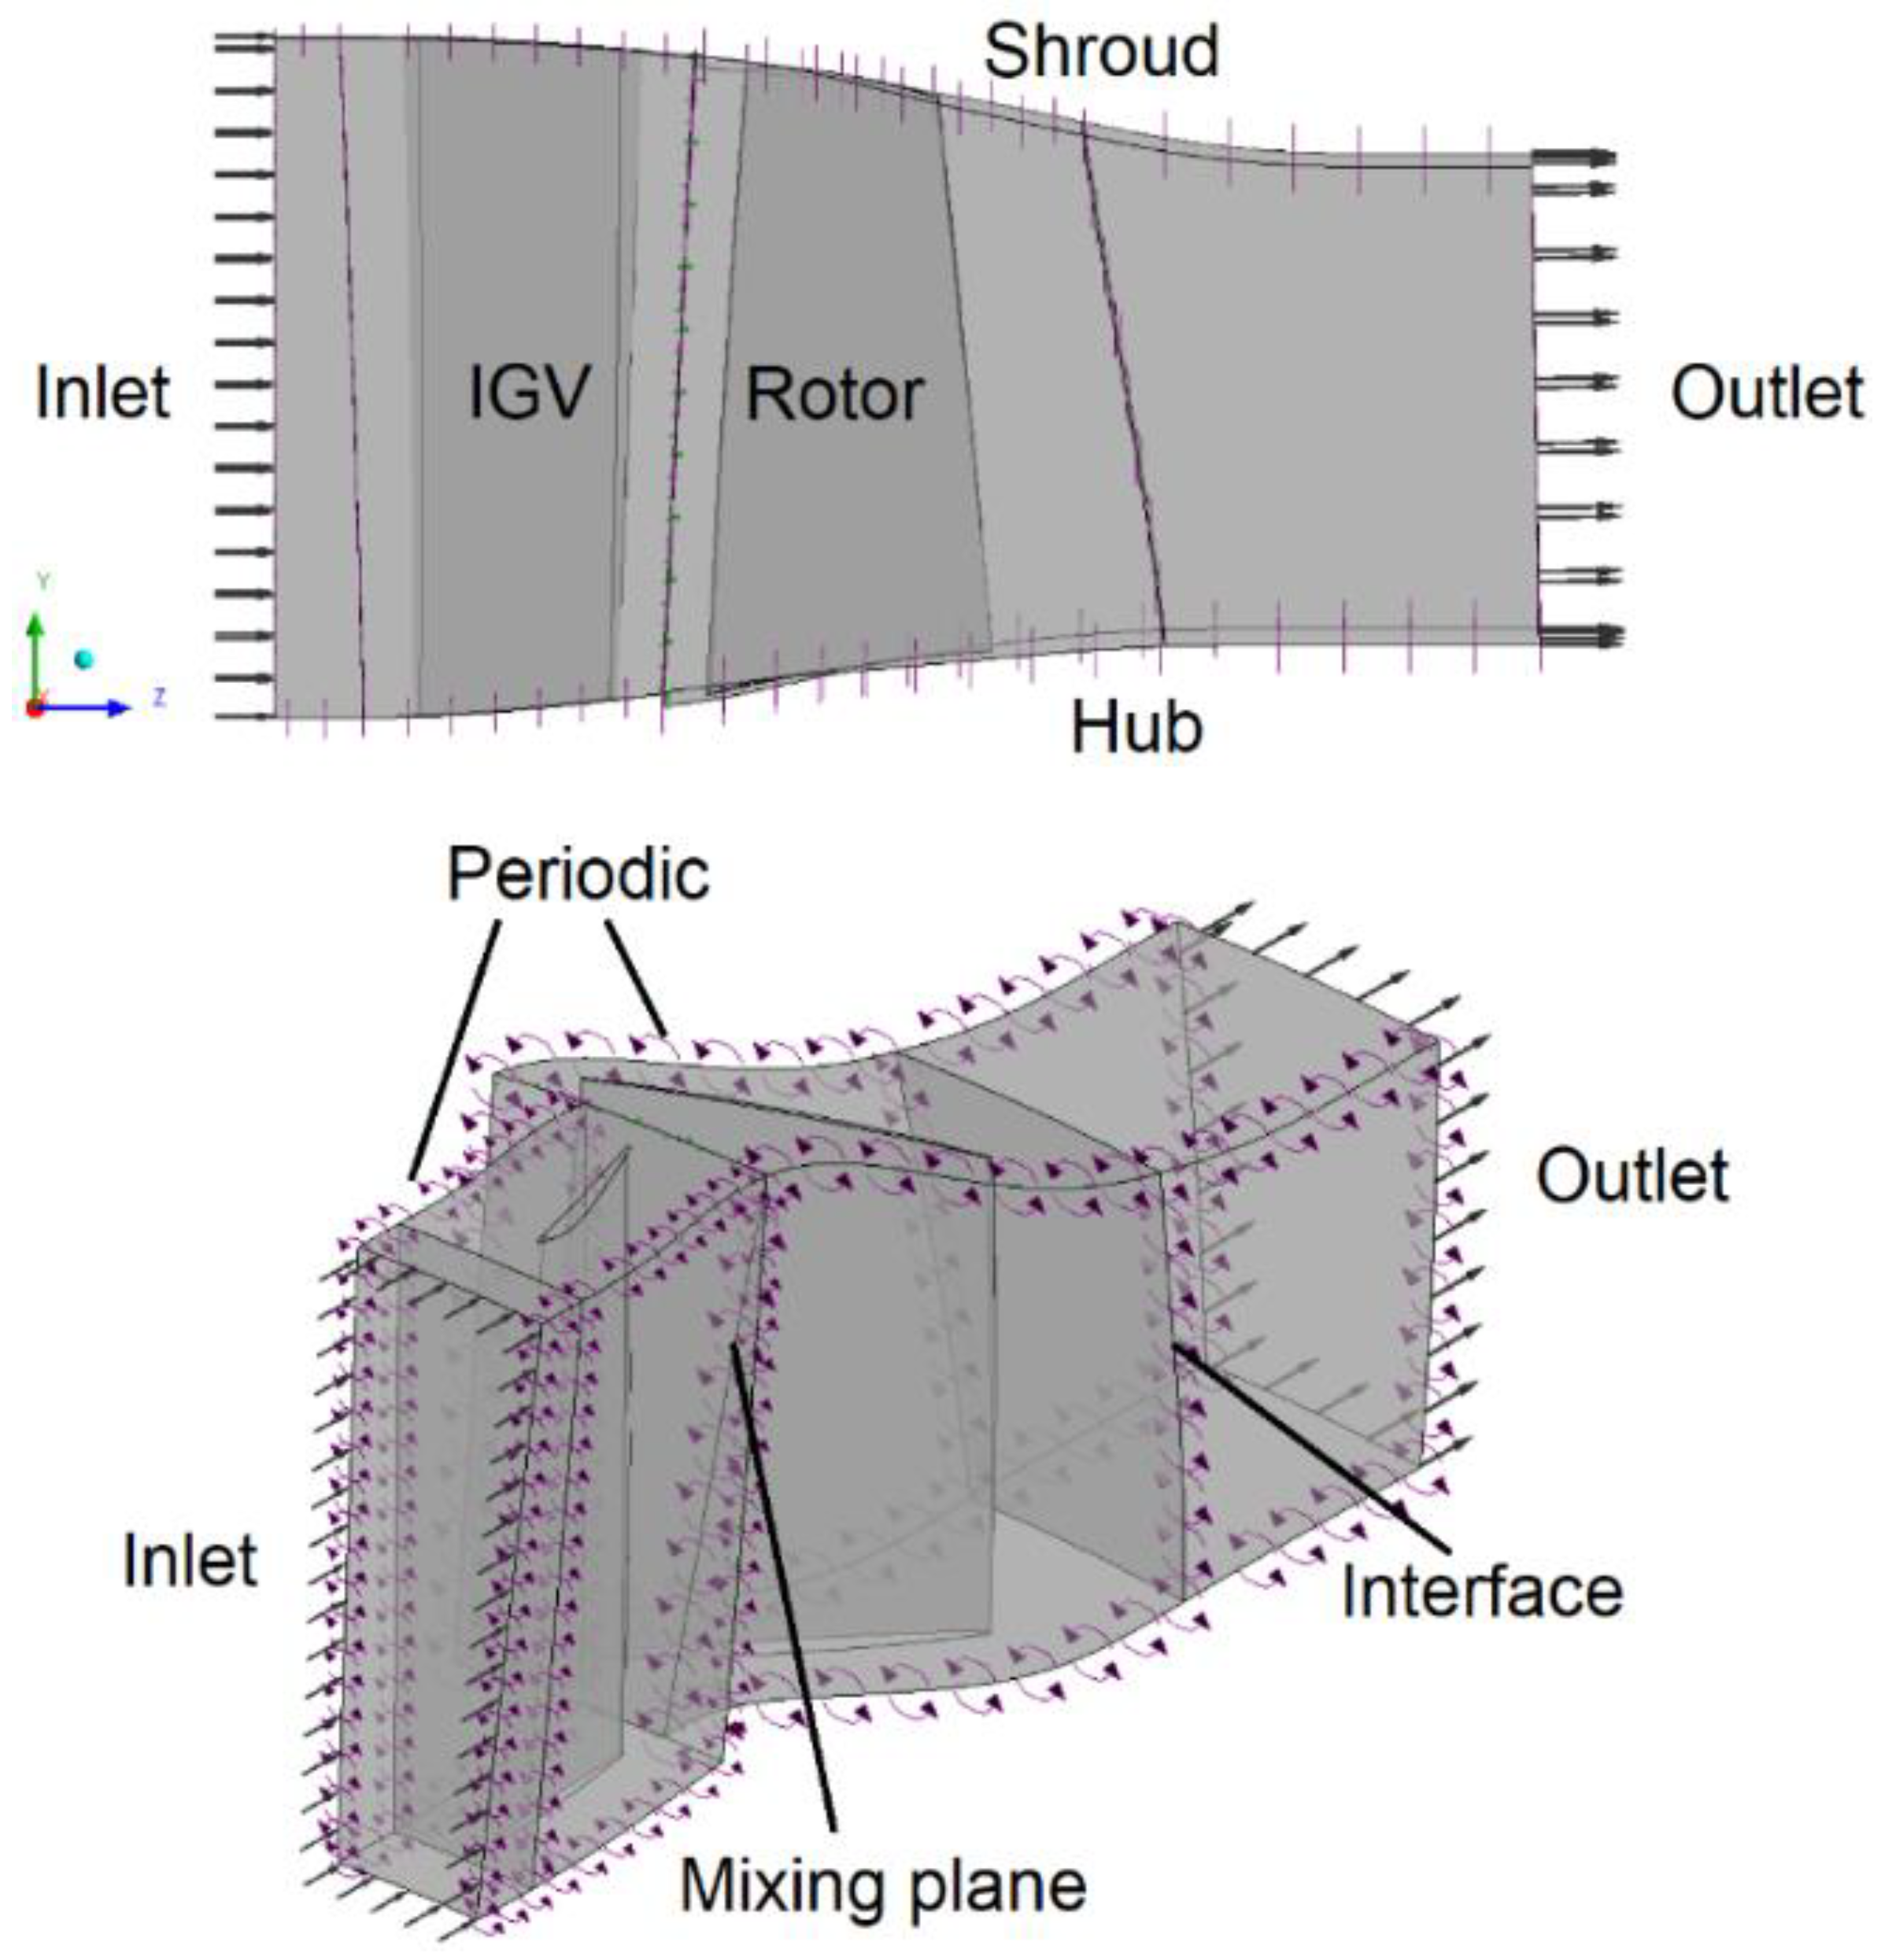
The computational domain investigated in this study consists of one blade-to-blade passage of the axial compressor, assuming the flow between two adjacent blades to be periodic in the rotating direction. No boundary layer profile on the hub or shroud is specified for the inlet boundary condition. The outlet boundary is specified using averaged properties. The boundary conditions applied to the blade-to-blade passage are stated below and illustrated in Figure 6.
  • Inlet: total pressure P0 = 47.9 kPa (in relation to the static reference frame—stator), total temperature T0 = 282.4 K (also in relation to the static reference frame—stator), turbulence intensity = 5% and the turbulent length scale = 1 mm;
  • Outlet: average static pressure outlet (static reference frame);
  • Mixing plane: interface between rotating and stationary planes. In this interface type, circumferential averages of the flow properties are calculated at various sections along the blade span. These averages are then communicated to the inlet of the downstream domain;
  • Periodic: we applied periodic boundary conditions;
  • Adiabatic wall: a non-slip wall condition, the wall velocity is zero for all walls (relative to the walls themselves) and counter-rotating for the rotor shroud and there is no shroud tip clearance for the rotor;
  • Interface: the General Grid Interface (GGI) method is used for the connection between the interfaces.
The flow was assumed to be axial at the inlet, and the z-axis was taken as the rotation axis. The working fluid was considered as an ideal gas, but the dynamic viscosity was varied to keep the Reynolds number constant, in a different approach compared to standard CFD simulations in which dynamic viscosity is commonly calculated via the Sutherland law. The Reynolds number based on the true chord (Rec) was fixed at 1.022 × 10⁶, and the true blade chord varied between 67% and 243% relative to the chord length of the nominal case blade.
The simulations were performed using resources of the Swedish National Infrastructure for Computing (SNIC), using the Tetralith cluster. Each server has two Intel Xeon Gold 6130 processors, providing 32 cores per server.

3.4. Aerodynamic Parameters

The rotor blade loading distribution affects the compressor stability, mainly in near-stall points [36]. Thus, to analyze the blade loading [37], the pressure coefficient ( C p ) can be determined along the blade chord by
C p = p p i n l e t p 0 , r e l , i n l e t p i n l e t
where the variable p denotes the local static pressure around the blade surface. The variables pinlet and p0,rel,inlet, respectively, denote the static and relative total pressure at the same upstream spanwise position. Based on C p , it is possible to evaluate the load distribution on the rotor blade, comparing suction pressure and side pressure distributions for varying ARs along the blade span.
In a compressor performance map, the distance between the operating line and the surge line is measured using the surge margin (SM), here defined by [38]
S M = P R T T , l i m i t × m ˙ r e f P R T T , r e f × m ˙ l i m i t 1 × 100
For a given rotational speed, the last stable operating point is taken as the operating point with the highest total-to-total pressure ratio for which the numerical solution would converge. As the simulations approached the limit of numerical stability for convergence, it was observed that the convergence of residues and monitored variables presented increasing oscillation amplitudes, although confined to a repetitive cyclic pattern. In the case of efficiency, for example, the maximum amplitudes were limited to 5% of the converged average value.
This criterion was used to define the performance parameters for the last stable operating point (or operating point at the surge line), the total-to-total pressure ratio at the limit or at the surge (PRTT,limit) and the mass flow rate at the surge (limit). The index ref, the reference condition, refers to the particular point under study, as evaluated at a fixed rotational speed maintaining the same outlet static pressure. We emphasize that there is then one reference condition per AR value, but only a single nominal condition, which is the reference condition for which AR = 1.37.
According to Wang et al. [11], along a compressor speed line, the flow instability evolution experiences three stages: stable state, rotating instability and rotating stall. As stall develops, its hysteresis is then influenced by the relation of the shut-off head to the shape of the compressor characteristic [39]. At any rate, the surge margin should be selected to be sufficient for the compressor to operate safely with respect to variations in the incoming flow field for different rotational speeds and during transient operation [32].
Based on the understanding that the surge phenomenon is inherently a transient 3D phenomenon involving the entire blade row circumference, we adopt the simplistic view that the surge can be predicted by the last stable operating point for which convergence is possible. Note that the use of the surge margin herein is not to predict the onset of the surge but to establish a measure for the distance to the surge, supporting the analysis of the AR around an optimal compressor design. We believe that this measure is sufficient to rank the compressors with respect to stability, and we emphasize that our key results are obtained safely away from the surge. In addition, the established scaling method is inherently unable to handle unsteady effects such as rotor–stator interaction [40,41], since the reduced frequency will change as the number of blades as well as the rotor blade passage length are changed to maintain the pitch chord. The effect of rotor–stator interaction is limited herein by the fact that the rotor flow is not entering into a downstream blade row, but clearly the wakes from the upstream IGV will be influenced by the rotor variation in rotor blade number and passage length. The change in reduced frequency is limited by the fact that as the number of blades increases, the chord lengths decrease proportionally.

4. Results and Discussion

4.1. Design Parameter Independence of Aspect Ratio

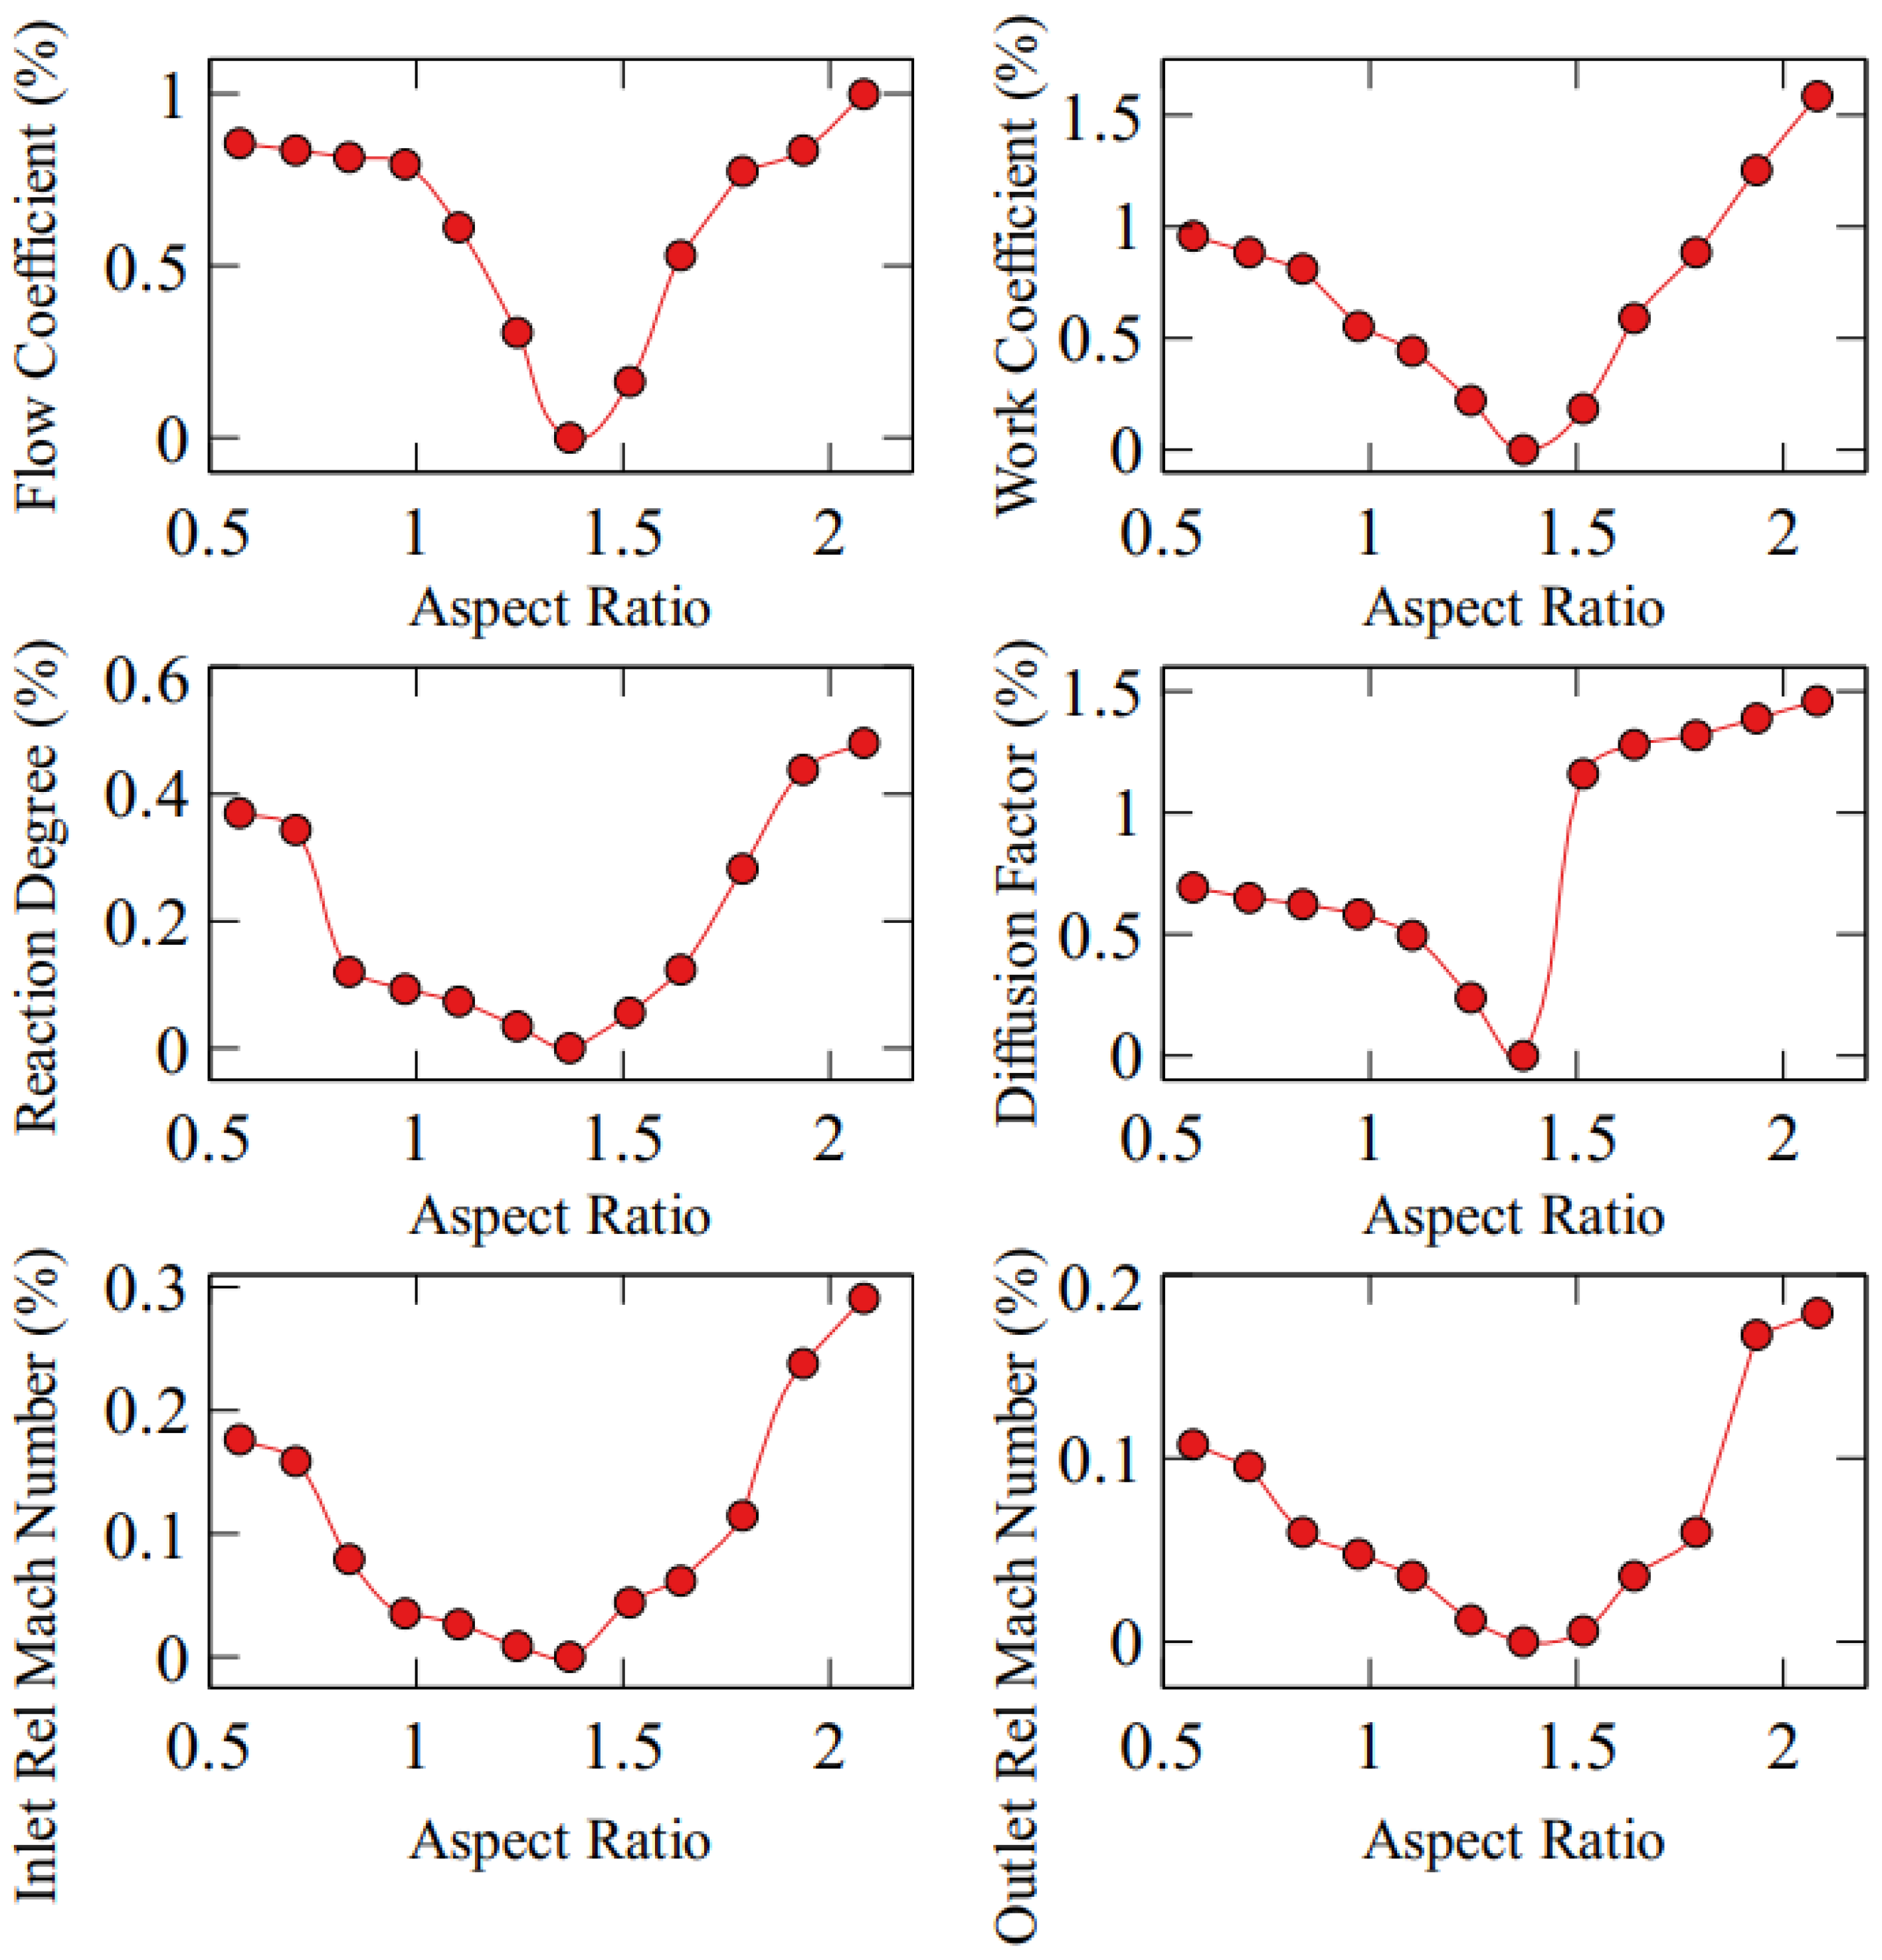
To demonstrate that the key parameters of Equation (7) remain fixed during the AR variation, we plot ϕ, ψ, Λ, DF and the relative Mach number at the inlet and outlet of the domain in Figure 7.
As can be seen, the variation is quite modest, with no larger than 1.6% variation, for an AR variation ranging from 0.57 to 2.08. Note that all of the points in the curves of Figure 7 are generated in the reference condition and it is only the dependence of different parameters on the AR that is assessed.

4.2. Influence of Aspect Ratio

The results collected in Figure 8 show the influence of the AR on the total-to-total pressure ratio and polytropic efficiency for a high-speed compressor, all simulated in the reference condition defined above. Here, we do not see an optimum in efficiency within the AR range from 1.0 to 1.5, as suggested for low-speed compressors [19]. Instead, the two figures show that there is a close to optimal range where the performance changes more slowly, as indicated by the gray region (AR = 1.10, 1.24, 1.37, 1.52, 1.64), and when deviating from this range, larger variations are observed.
Multi-objective optimality is established when both compressor stability and efficiency are considered, as will be outlined more closely below. To analyze the finer details of the flow, a range of ±20% around the nominal case for the AR was selected for further study. This set of data is comprised of the five points (AR = 1.10, 1.24, 1.37, 1.52, 1.64) indicated by the gray area shown in Figure 12.
The increase in AR is accompanied by an increase in the number of blades in order to maintain constant solidity. Thus, while the endwall losses are lower at the hub and shroud for higher AR values, the profile losses become even higher, resulting in lower efficiencies. Conversely, when the AR is decreased, the number of blades also decreases. Thus, higher endwall losses at the hub and shroud are offset by even lower profile losses, resulting in increased efficiency.

4.3. Aspect Ratio Variation and Blade-to-Blade Flow

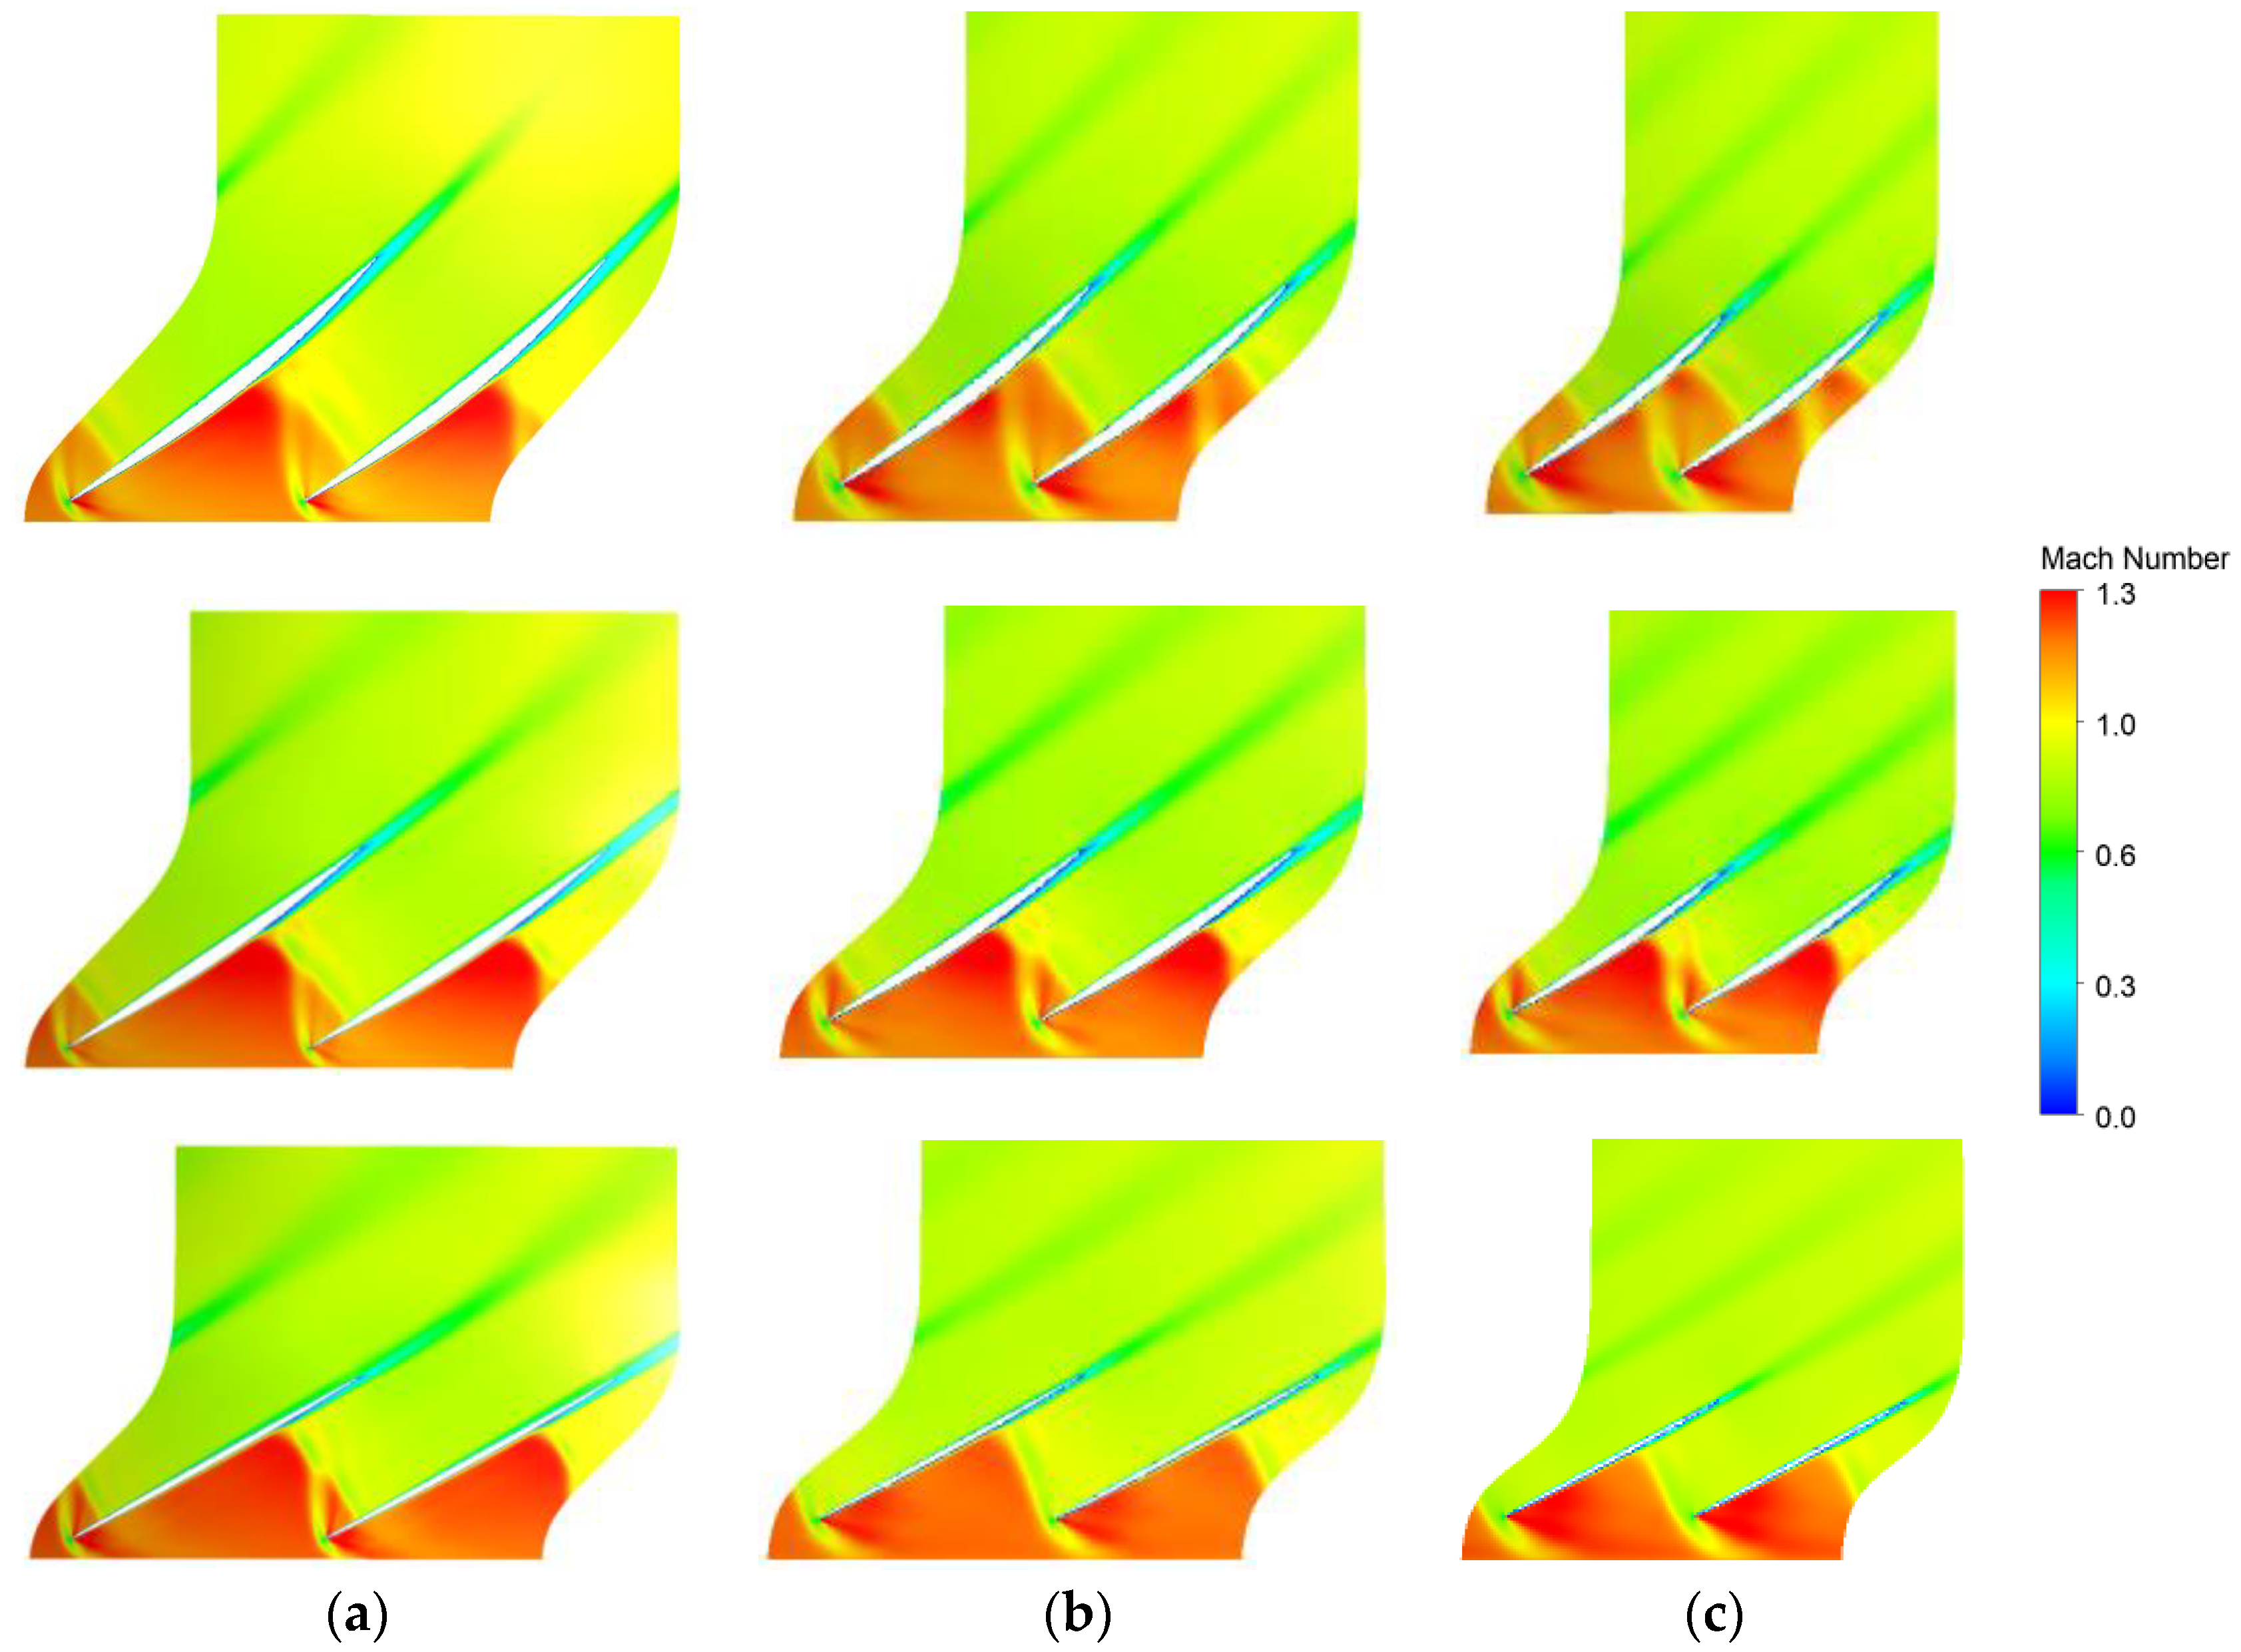
In high-speed compressor flows, shocks frequently occur. They are characterized by the static pressure and static temperature of the flowing medium changing abruptly, accompanied by an associated step change in flow velocity and properties of the fluid. The shocks significantly affect the efficiency of the turbomachine and may also change the direction of the flow. Figure 9 shows the relative total pressure distribution at the rotor blade suction and pressure sides for different ARs: 0.71, 1.52 and 2.08. Figure 10 shows the relative Mach number distribution for blade-to-blade passage at 10%, 50% and 90% spans for the same three ARs: 0.71, 1.52 and 2.08.
When analyzing both figures, certain conclusions regarding the compressor’s internal flow field can be drawn. For a constant AR, we can observe the typical axial compressor behavior related to span variation: the relative inlet Mach number increases from hub to the shroud, resulting in stronger shocks near the casing. This is associated with higher losses near the casing, as can be seen in the Figure 9 distributions, where the majority of total pressure increase (due to work delivery from compressor to fluid) occurs near the hub and after the passage shock.
Regarding the influence of AR variation, which is the objective of this work, an interesting phenomenon can be observed: the interaction of the inlet oblique shock with the passage normal shock, resulting in a very complex flow field. For a 10% span near the hub, this interaction is only seen for lower AR values, while for medium and high values, it is not. For a 50% span, the phenomenon occurs for all aspect ratio values, and the same is true for a 90% span. Near the casing, for medium and high AR values, this interaction results in a single quasi-normal shock from the blade’s leading edge towards the passage, which is stronger although less complex.
In a general way, it was observed that as AR increases, the intensity and strength of both shocks (leading edge and passage) also increase. Another observation is the low total pressure region near the inlet tip: as AR increases, this low-pressure region also increases as a result of the stronger shock associated with the boundary layer detachment vortex. This explains the efficiency and pressure ratio reduction as a function of AR increase (Figure 8 and Figure 12).
As already discussed, it is well-known that the compressor stability limits are driven by the tip clearance influence. In the configuration analyzed in this work, without tip clearance, the authors believe that the operating stability limits, given by the CFD numerical stability limits, are determined by the complexity of the flow field. For lower AR values, this complexity is high due to both shocks’ interaction over the full blade span, resulting in a low SM margin. As the aspect ratio increases, the complexity decreases due to lower levels of shocks’ interaction, and the intensity of the inlet tip vortex is still low, resulting in the maximum SM values observed in Figure 12. As the AR keeps increasing, the complexity of the flow increases due to the intensity of this inlet tip vortex, generating lower SM values.
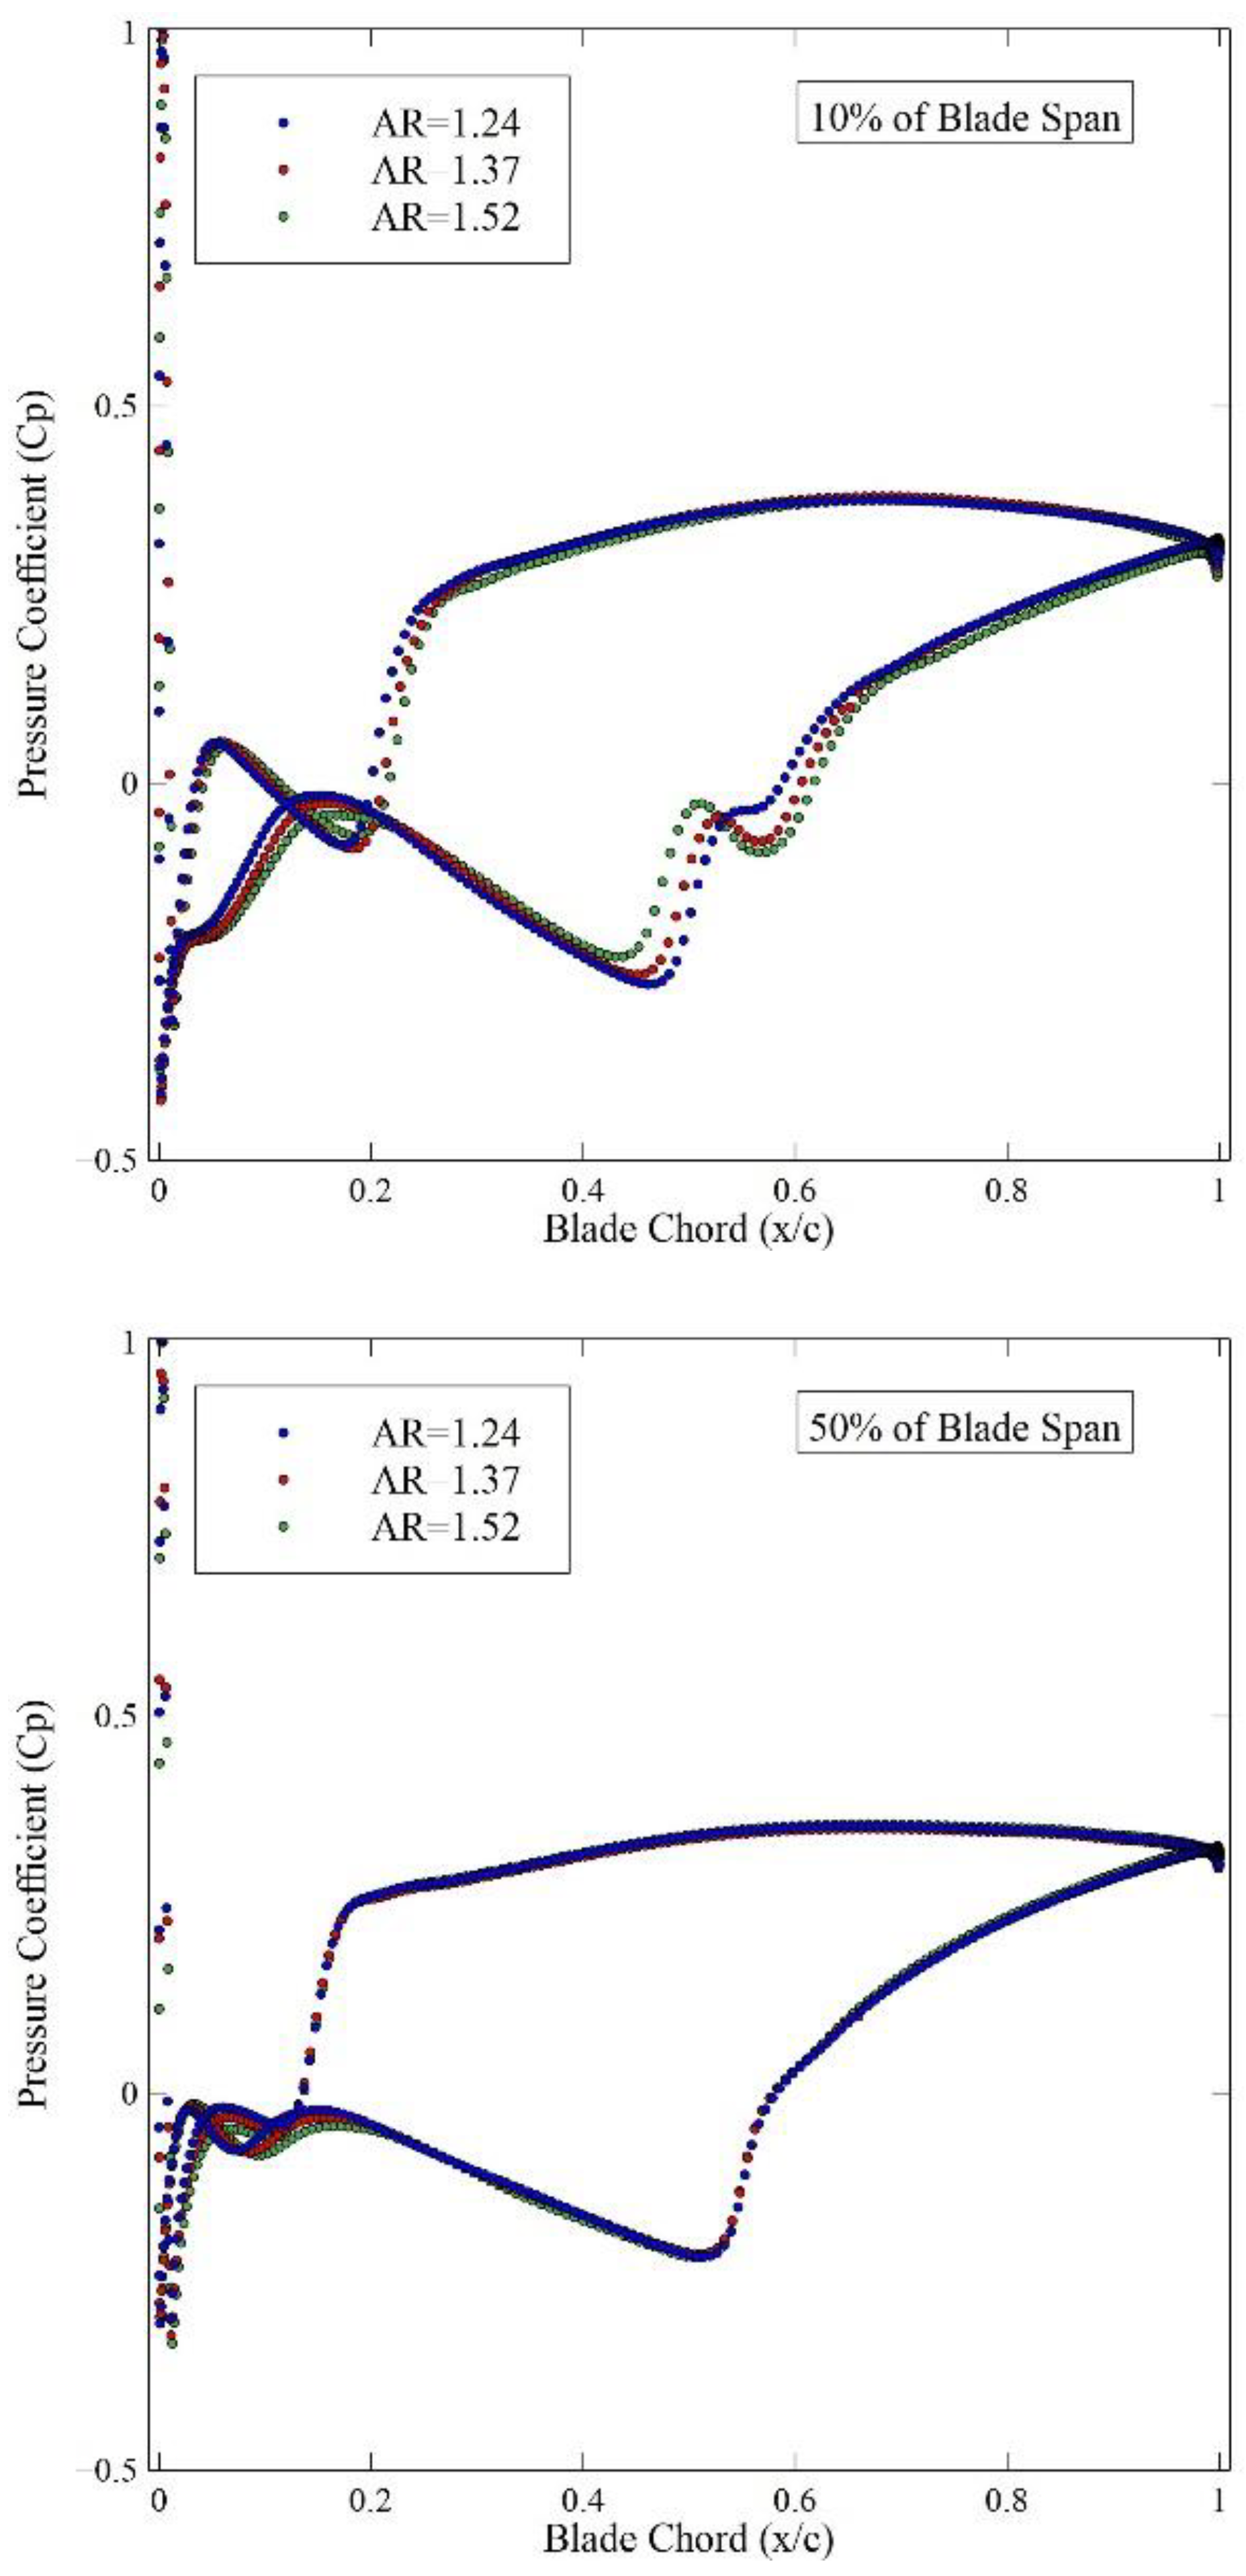
To quantify the blade-to-blade flow further, the C p variation is computed around the blade profile. The results are plotted in Figure 11, showing the variation for the nominal case (AR = 1.37) and for the two AR values closest to 1.37, that is, AR = 1.24 and AR = 1.52. Here, we can see that that differences from the nominal case are more pronounced close to the shroud (90% blade height) and hub (10% blade height). Thus, close to the nominal condition, it seems that it is primarily the endwall variation that establishes the change in efficiency. Farther away from the nominal condition, stronger variation is seen at the mid span, but the hub and shroud variation increase even further still, dominating the loss variation.

4.4. Aspect Ratio and Multi-Objective Optimality for High-Speed Compressors
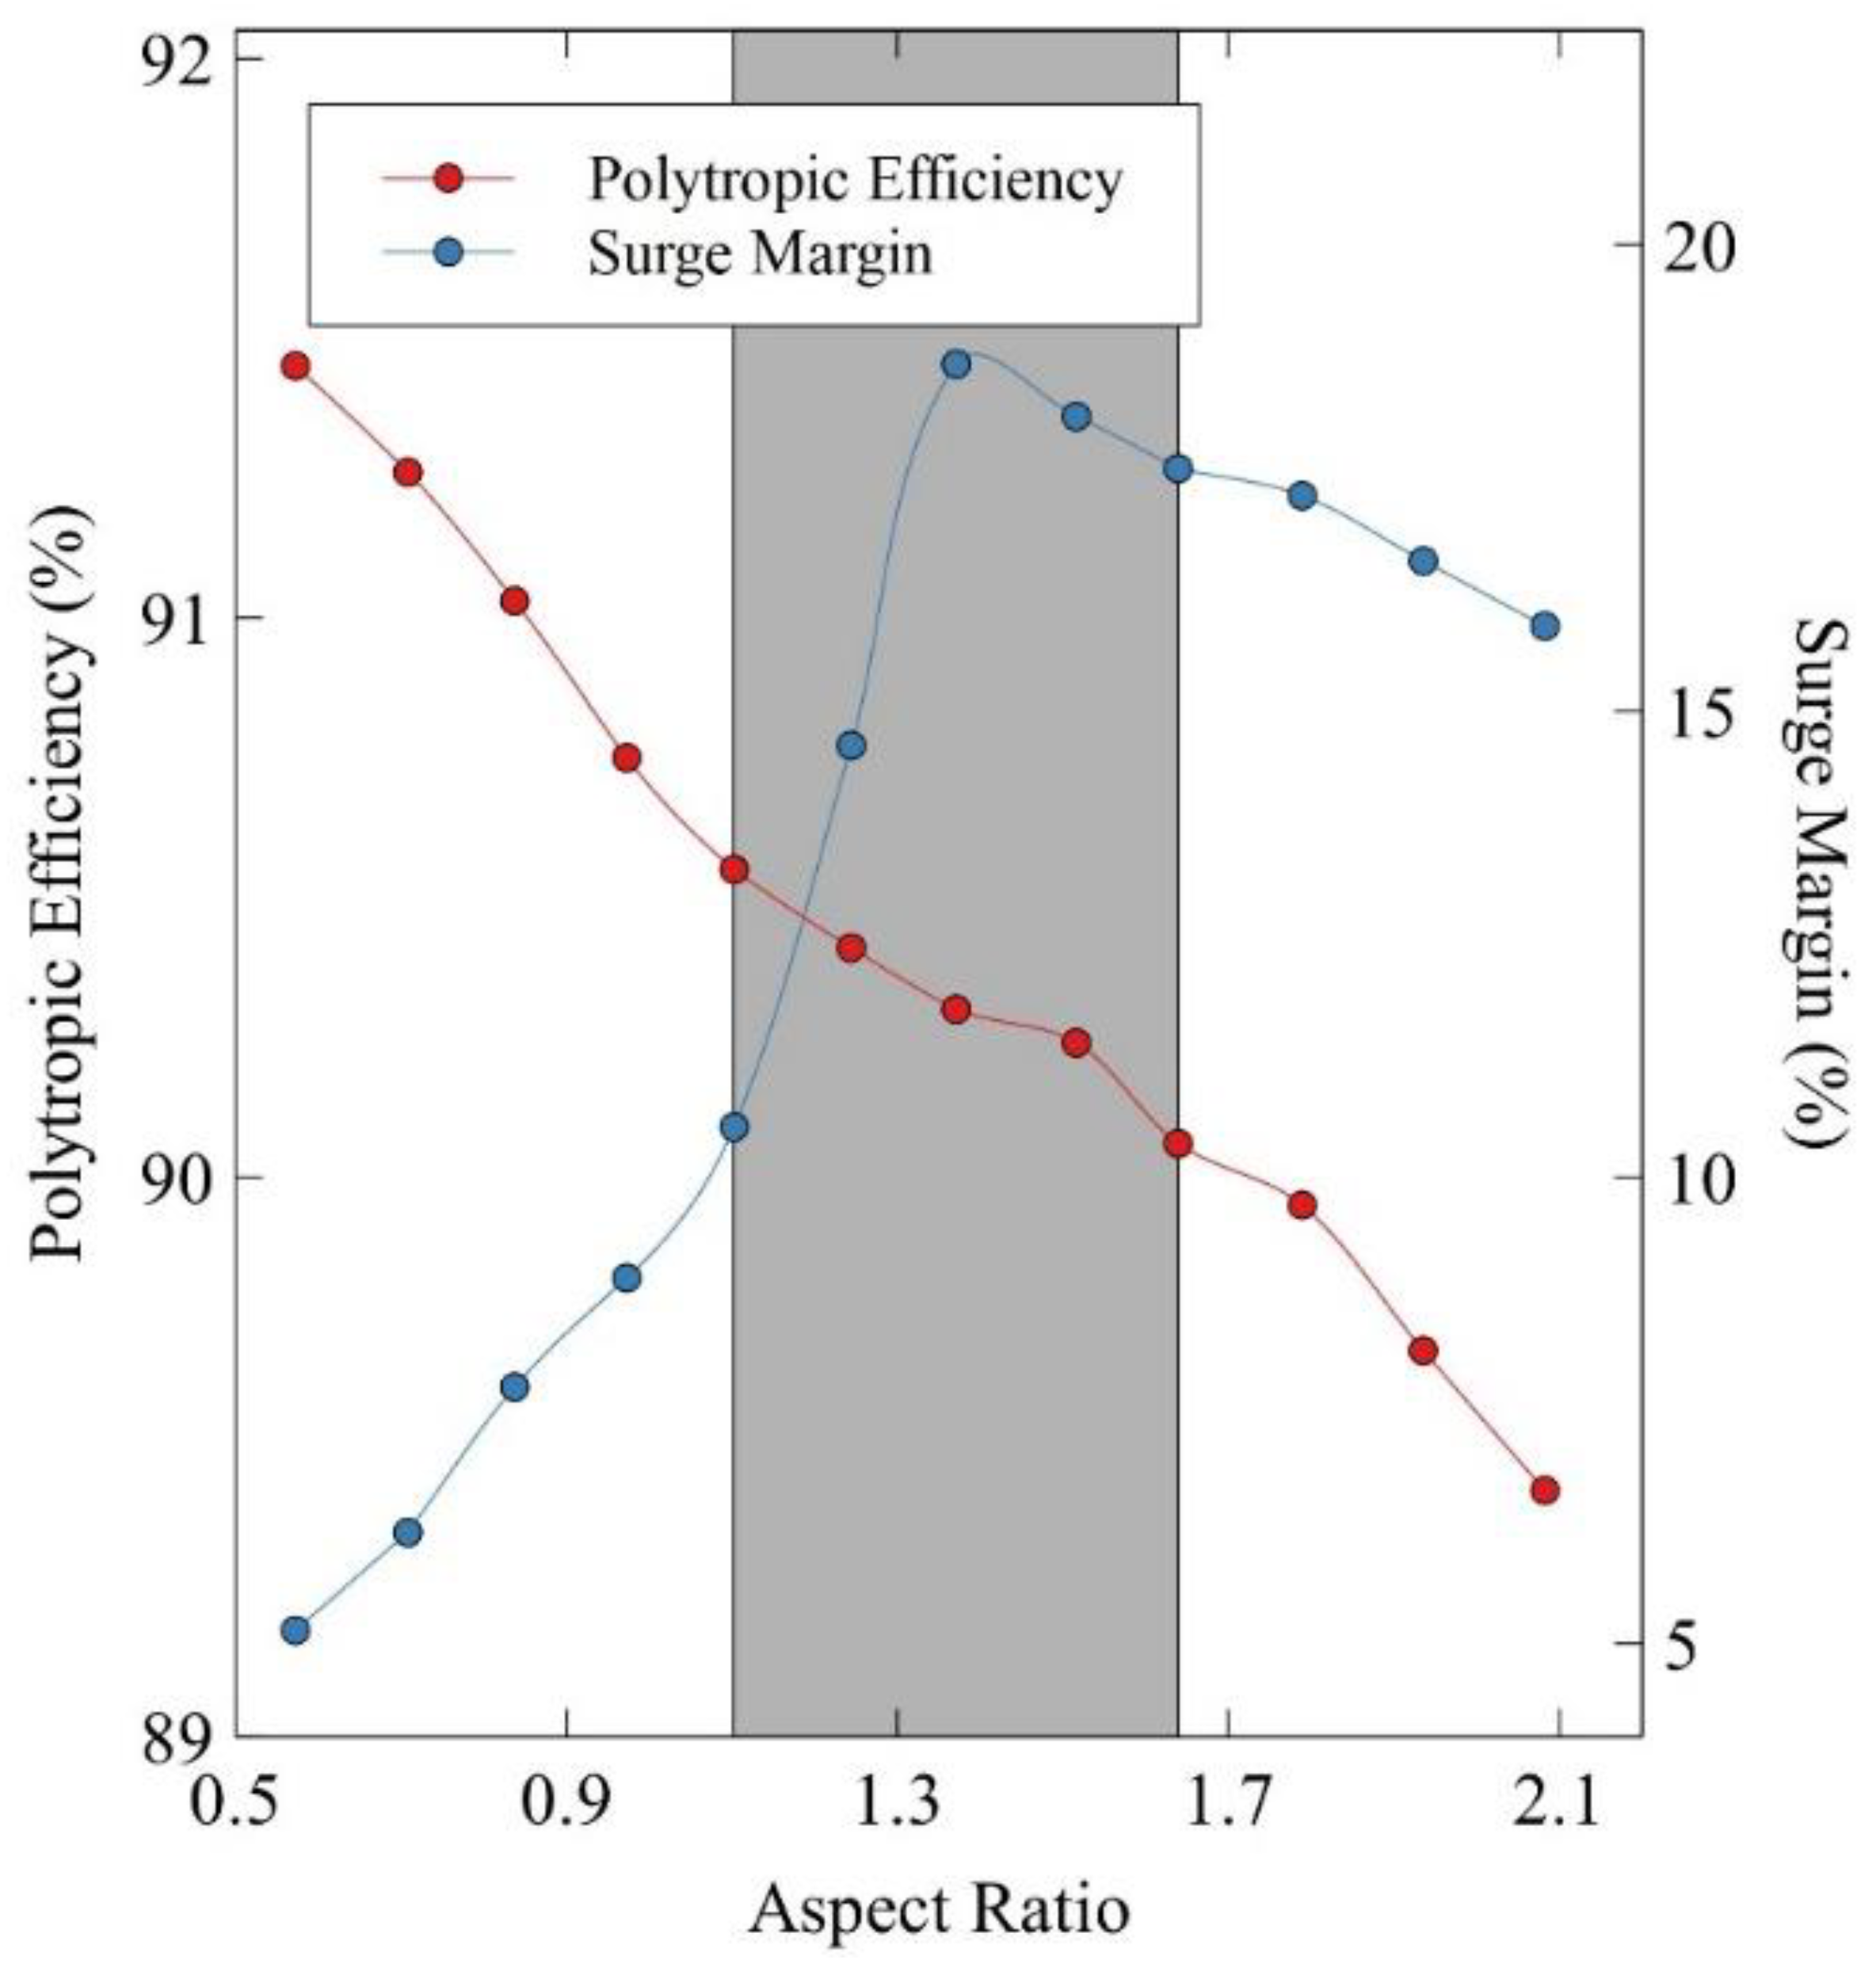
Analyzing the effect of the AR around the multi-objective optimum of the VINK compressor, that is, around AR = 1.37, requires the simultaneous analysis of the surge margin and efficiency. As can be seen from Figure 12, a decreasing trend in the SM is observed for an AR lower than AR = 1.37, with AR = 0.57 being very close to the surge. This is noteworthy, being in contrast to the well-known trend of an increasing surge margin with a decreasing AR [7,10]. The existence of an optimum in the SM for the nominal AR is attributed to multi-objective optimality, that is, that both SM and efficiency are considered when choosing the optimal configuration. As explained earlier, we do not include the effect of tip clearance in fear of compromising the ability to maintain constant values on the other key design variables and hence failing to isolate the effect of AR. Admittedly, the inclusion of tip leakage may have further key effects on the observed flow.
Figure 12. Comparison of polytropic efficiency and surge margin variations versus several rotor aspect ratios.
Aerospace 11 00276 g012
Interestingly enough, for an AR of higher than 1.37, the SM also decreases, however, not at the same rapid pace, reaching SM = 15.9% at AR = 2.08. The nominal design, AR = 1.37, reaches the peak surge margin with SM = 18.7%, illustrating the trade-off between efficiency and the surge margin. Here, the optimal thus corresponds to a peak in the surge margin, but the efficiency shows a monotonous increase with a reduction in AR. Hence, the designer can trade the surge margin for an increase in efficiency to a point where stability is no longer possible for the compressor’s operating range.
Compared with the fundamental low-speed analysis carried out by To and Miller [19], we see a slightly higher range for the multi-objective optimality. To and Miller [19] propose a range of between 1.0 and 1.5, with an optimum of 1.16 when the thickness-to-chord ratio is fixed at 5.4%. The current work suggests a close to optimal range within AR = 1.10 and 1.64, with the lower range from 1.10 to 1.37 being more favorable. For values lower than 1.10 (left from gray highlighted region in Figure 12), the relatively small efficiency increase is overridden by a relatively large SM decrease. The upper range, from 1.37 to 1.64, results in both an efficiency drop and a surge margin drop. Although the efficiency varies only slowly around the AR = 1.37 case, no distinct optimum in efficiency is noted. It is believed that, in general, the designer has to choose the maximize surge margin or efficiency and that, in general, both parameters cannot be simultaneously maximized. Works in the literature show passive techniques for improving stability, such as the use of a foam metal casing treatment [42].
Although it was decided to keep the Re number constant across the AR parameter range, by varying the fluid viscosity, it was decided to also test the general-stage behavior for a varying Re number, letting the dynamic viscosity be calculated via the Sutherland law, as is commonly performed in standard CFD simulations. For this reason, the simulations for AR = 0.57, 0.84, 1.10, 1.37, 1.64 and 2.08 were repeated. The efficiency variation remained almost identical to that shown in Figure 12, with the slope of the curve somewhat increased. This is because the low AR points now corresponded to a higher Reynolds number and thus resulted in a higher efficiency, whereas the opposite held for the high AR points. For AR = 0.57, the efficiency increased by about 0.35% whereas for AR = 2.08, a reduction of about 0.25% was observed.
Finally, it should also be emphasized that the prediction of the absolute level of the surge margin is notoriously difficult, not least when using a simple two-equation turbulence model such as the SST model used herein. Validation of the predictive capability of our simulations has recently been reported in [36,43], but the impacts of tip clearance and endwall blockage in compressor performance are still not completely understood [44].
Our ambition is to predict consistent trends and rank the proximities to the surge, not to establish absolute surge prediction. Also, the key observations made in this work are predominantly well away from the surge. Note that the comparison of different ARs are carried out in the reference condition for each AR; hence, we are changing the length of the rotor blades but keeping the aerodynamic load and other key aerodynamic parameters constant.

5. Conclusions

In this work, the first rotor of a high-speed multistage axial compressor [20] was used to analyze the AR influence on compressor performance. Great care was taken to allow the isolated study of the impact of the AR on the compressor performance, around its nominal design value of AR = 1.37. The isolation of the effect of the AR was achieved using a constant pitch-chord scaling procedure, allowing other key design parameters to remain relatively unaffected over a large AR range. The efficiency trend presented around the optimum was quite robust to Re number variation, with only a slightly amplified efficiency increase for the lower AR and a further decrease for the higher AR.
The nominal design of AR = 1.37 represents a typical high-speed, state-of-the-art aero-engine compressor design, for which a multi-objective criterion was used. The optimum was achieved by balancing the surge margin against peak efficiency. Herein, optimality in the surge margin with respect to the AR is observed, whereas a close to optimal efficiency is observed in the range from AR = 1.10 to AR = 1.64. This is only slightly higher than the AR = 1.0–1.5 range suggested for low-speed compressors [19]. Clearly, our predicted range is only indicative, considering that the definition of multi-objective optimality requires balancing efficiency and the surge margin and that the choice of balancing these two criteria requires making a design choice along a pareto optimal front.
It should be noted that this is an academic work that points out interesting results regarding the trends of efficiency and the surge margin, without the effect of tip clearance. It should be understood that the absence of this tip gap makes the work less representative in industrial terms. Hence, future work is recommended to include typical gap values and repeat the CFD simulations, in order to verify the effect of the tip clearance on the results shown here.

Supplementary Materials

The following supporting information can be downloaded at: https://github.com/nikander/VINK (accessed on 20 February 2024).

Author Contributions

Conceptualization, L.S., T.G., C.X. and L.W.; data curation, L.S. and L.W.; formal analysis, L.S., T.G., C.X., L.W., C.B. and M.L.; funding acquisition, T.G. and C.B.; investigation, L.S., T.G., C.X. and L.W.; methodology, L.S., T.G., C.X. and L.W.; project administration, T.G. and C.B.; resources, T.G. and C.B.; software, L.S., T.G., C.X. and L.W.; supervision, T.G., C.X. and C.B.; validation, L.S., T.G., C.X., L.W. and M.L.; visualization, L.S. and L.W.; writing—original draft, L.S. and L.W.; writing—review and editing, L.S., T.G. and L.W. All authors have read and agreed to the published version of the manuscript.

Funding

This work is financially supported by SAAB AB under the project Jet Engine Design and Testing—Gripen Brazil Offset.

Data Availability Statement

The raw data supporting the conclusions of this article will be made available by the authors on request.

Acknowledgments

The authors are grateful to Chalmers University of Technology, the Aeronautics Institute of Technology (ITA), the Swedish National Infrastructure for Computing (SNIC) and the Conselho Nacional de Desenvolvimento Científico e Tecnológico (CNPq) for supporting this project. The authors are also grateful to PCA Engineers (England) for the academic license for the SC90C software.

Conflicts of Interest

The authors declare no conflicts of interest.

References

  1. Dickens, T.; Day, I. The Design of Highly Loaded Axial Compressors. J. Turbomach. 2011, 133, 031007. [Google Scholar] [CrossRef]
  2. Lieblein, S. Aerodynamic Design of Axial-Flow Compressors. VI-Experimental Flow in Two-Dimensional Cascades. In Re-printed NASA SP-36: Aerodynamic Design of Axial Compressors; NASA: Washington, DC, USA, 1965; pp. 183–226. [Google Scholar]
  3. Zhou, S.; Zhao, S.; Zhou, C.; Wu, Y.; Yuan, H.; Lu, X. Optimal Design and Analysis of a High-Load Supersonic Compressor Based on a Surrogate Model. Aerospace 2023, 10, 364. [Google Scholar] [CrossRef]
  4. Olmedo, L.; Liu, W.; Gjika, K.; Schiffmann, J. Thermal management for gas lubricated, high-speed turbomachinery. Appl. Therm. Eng. 2023, 218, 119229. [Google Scholar] [CrossRef]
  5. Szymanski, A.; Igie, U.; Hamilton, K.A.E.R. Aerodynamic limits of gas turbine compressor during high air offtakes for minimum load extension. Appl. Therm. Eng. 2021, 189, 116697. [Google Scholar] [CrossRef]
  6. Wennerstrom, A.J. Highly Loaded Axial Flow Compressors: History and Current Development. J. Turbomach. 1990, 112, 567–578. [Google Scholar] [CrossRef]
  7. Wennerstrom, A.J. Low Aspect Ratio Axial Flow Compressors: Why and What It Means. J. Turbomach. 1989, 111, 357–365. [Google Scholar] [CrossRef]
  8. Smith, L.H. Axial compressor Aerodesign Evolution at General Electric. J. Turbomach. 2002, 124, 321–330. [Google Scholar] [CrossRef]
  9. Koch, C.C. Stalling Pressure Rise Capability of Axial Flow Compressors. J. Eng. Power 1981, 103, 645–656. [Google Scholar] [CrossRef]
  10. Britsch, W.; Osborn, W.; Laessig, M. Effects of Diffusion Factor, Aspect Ratio, and Solidity on Overall Performance of 14 Compressor Middle Stages; Technical Paper 1523; NASA: Washington, DC, USA, 1979. [Google Scholar]
  11. Wang, H.; Wu, Y.; Wang, Y.; Deng, S. Evolution of the flow instabilities in an axial compressor rotor with large tip clearance: An experimental and URANS study. Aerosp. Sci. Technol. 2020, 96, 13. [Google Scholar] [CrossRef]
  12. Chen, S.; Zeng, Y.G.E.C. Pulsed suction towards unsteady active flow control in an axial compressor cascade including clearance leakage effects. Appl. Therm. Eng. 2023, 219, 119654. [Google Scholar] [CrossRef]
  13. Schönenborn, H.; Junge, M.; Retze, U. Contribution to Free and Forced Vibation Analysis of an Intentionally Mistuned Blisk. In Proceedings of the ASME Turbo Expo 2012, Copenhagen, Denmark, 11–15 June 2012. [Google Scholar] [CrossRef]
  14. Schmidt, T.; Peters, M.; Jeschke, P.; Matzgeller, R.; Hiller, S.J. High aspect ratio blading in an axial compressor stage. In Proceedings of the ASME Turbo Expo 2017: Turbomachinery Technical Conference & Exposition, Charlotte, NC, USA, 26–30 June 2017. [Google Scholar] [CrossRef]
  15. Wang, Z.; Qi, L.; Liu, S.; Wang, W.H.E.S. The influence of component parameters on cycle characteristic in rotating detonation gas turbine. Appl. Therm. Eng. 2023, 119716, 220. [Google Scholar] [CrossRef]
  16. Neumann, N.; Asli, M.; Garan, N.; Stathopoulos, D.P.E. A fast approach for unsteady compressor performance simulation under boundary condition caused by pressure gain combustion. Appl. Therm. Eng. 2021, 196, 117223. [Google Scholar] [CrossRef]
  17. Alfredsson, N.D. The Impact of the Blade Aspect Ratio on Axial Compressor Efficiency and Stability and Its Correlation to the Skoch Parameter. Master’s Thesis, Lund University, Lund, Sweden, 2018. [Google Scholar]
  18. Peters, M.; Schmidt, T.; Jeschke, P. Influence of Blade Aspect Ratio on Axial Compressor Efficiency. J. Glob. Power Propuls. Soc. 2019, 3, 639–652. [Google Scholar] [CrossRef]
  19. To, H.O.; Miller, R.J. The Effect Aspect Ratio on Compressor Performance. J. Turbomach. 2019, 141, 081011. [Google Scholar] [CrossRef]
  20. Lejon, M.; Grönstedt, T.; Glodic, N.; Petrie-Repar, P.; Genrup, M.; Mann, A. Multidisciplinary Design of a Three Stage High Speed Booster. In Proceedings of the ASME Turbo Expo 2017: Turbomachinery Technical Conference, Charlotte, NC, USA, 26–30 June 2017. [Google Scholar] [CrossRef]
  21. Andersson, N. GitHub Repository for VINK. 19 September 2017. Available online: https://github.com/nikander/VINK (accessed on 12 October 2019).
  22. PCA Engineers. SC90C a Stream Line Curvature. 2014. Available online: https://www.pcaeng.co.uk/vista-software (accessed on 12 October 2019).
  23. Skärnell, H. Parameterization and Design of Transonic Compressor Blades. Master’s Thesis, Department of Applied Mechanics, Chalmers University of Technology, Gothenburg, Sweden, 2013. [Google Scholar]
  24. Goodhand, M.N.; Miller, R.J. Compressor Leading Edge Spikes: A New Performance Criterion. J. Turbomach. 2011, 133, 021006. [Google Scholar] [CrossRef]
  25. Zhang, X.; Ju, Y.; Zhang, C. Geometry scaling technique and application to aerodynamic redesign of multi-stage transonic axial-flow compressors. Aerosp. Sci. Technol. 2022, 121, 17. [Google Scholar] [CrossRef]
  26. Silva, L.M.; Tomita, J.T.; Barbosa, J.R. A study of the influence of the tip-clearance on the tip-leakage flow using CFD techniques. In Proceedings of the Brazilian Congress of Mechanical Engineering—COBEM, Natal, RN, Brazil, 24−28 October 2011. [Google Scholar]
  27. Lejon, M. Simulation and Optimization of an Axial Compressor Considering Tip Clearance Flow. Ph.D. Thesis, Chalmers University of Technology, Gothenburg, Sweden, 2016. [Google Scholar]
  28. Lejon, M.; Grönstedt, T.; Andersson, N.; Ellbrant, E.; Mårtensson, H. On Improving the Surge Margin of a Tip-Critical Axial Compressor Rotor. In Proceedings of the ASME Turbo Expo 2017: Turbomachinery Technical Conference and Exposition, Charlotte, NC, USA, 26–30 June 2017. [Google Scholar] [CrossRef]
  29. Pan, T.; Wu, W.; Li, Q. Effect of casing treatment to switch the type of instability inception in a high-speed axial compressor. Aerosp. Sci. Technol. 2021, 115, 11. [Google Scholar] [CrossRef]
  30. Jung, Y.J.; Jeon, H.; Jung, Y.; Lee, K.J.; Choi, M. Effects of recessed blade tips on stall margin in a transonic axial compressor. Aerosp. Sci. Technol. 2016, 54, 41–48. [Google Scholar] [CrossRef]
  31. Li, H.; Zheng, Q.; Chen, Z.; Duan, Y.; Jiang, B.; Benini, E. The role of radial secondary flow in the process of rotating stall for a 1.5-stage axial compressor. Aerosp. Sci. Technol. 2021, 115, 24. [Google Scholar] [CrossRef]
  32. Lejon, M. Aerodynamic Design Framework for low-Pressure Compression Systems. Ph.D. Thesis, Chalmers University of Technology, Gothenburg, Sweden, 2018. [Google Scholar]
  33. ANSY. ANSYS TurboGrid Tutorial. Release 15.0; ANSYS, Inc.: Canonsburg, PA, USA, 2018. [Google Scholar]
  34. ANSYS. CFX-Pre User’s Guide. Release 19.1; ANSYS, Inc.: Canonsburg, PA, USA, 2018. [Google Scholar]
  35. Menter, F.R. Two-Equation Eddy-Viscosity Turbulence Models for Engineering Applications. AIAA J. 1994, 32, 1595–1605. [Google Scholar] [CrossRef]
  36. Díaz, R.B. Circumferential Grooves Passive Wall Treatment in a Transonic Axial Compressor. Master’s Thesis, Aeronautics Institute of Technology, São José dos Campos, Brazil, 2018. [Google Scholar]
  37. Xu, D.; Dong, X.; Zhou, C.; Sun, D.; Gui, X.; Sun, X. Effect of rotor axial blade loading distribution on compressor stability. Aerosp. Sci. Technol. 2021, 119, 18. [Google Scholar] [CrossRef]
  38. Reid, L.; Moore, R.D. Performance of a Single-Stage Axial-Flow Transonic Compressor with Rotor and Stator Aspect Ratios of 1.19 and 1.26, Respectively, and with Design Pressure Ratio of 1.82; NASA Technical Paper 1338; NASA: Washington, DC, USA, 1978. [Google Scholar]
  39. Li, Z.; Zhang, P.; Yang, D.; Zhang, J. Numerical investigations on the key contributing factor and flow features of compressor stall hysteresis. Aerosp. Sci. Technol. 2022, 121, 9. [Google Scholar] [CrossRef]
  40. Wang, D.; Huang, X. A complete rotor–stator coupling method for frequency domain analysis of turbomachinery unsteady flow. Aerosp. Sci. Technol. 2017, 70, 367–377. [Google Scholar] [CrossRef]
  41. Liu, A.; Ju, Y.; Zhang, C. Parallel rotor/stator interaction methods and steady/unsteady flow simulations of multi-row axial compressors. Aerosp. Sci. Technol. 2021, 116, 106859. [Google Scholar] [CrossRef]
  42. Li, J.; Dong, X.; Sun, D.; Wang, Y.; Geng, C.; Sun, X. Stability Enhancement and Noise Reduction of an Axial Compressor with Foam Metal Casing Treatment. Aerospace 2022, 9, 628. [Google Scholar] [CrossRef]
  43. da Silva, L.M.; Grönstedt, T.; Whitaker, L.H.L.; Tomita, J.T.A.M.; Martins, V.A.C. Comparison of Different CFD Unsteady Methods for the Performance Analysis of a Transonic Axial Compressor. In Proceedings of the 25th ISABE Conference, Ottawa, ON, Canada, 25−30 September 2022. [Google Scholar]
  44. Smith, L.H. Casing Boundary Layers in Multistage Axial Flow Compressors. Flow Res. Bl. 1970, 106, 635–647. [Google Scholar]
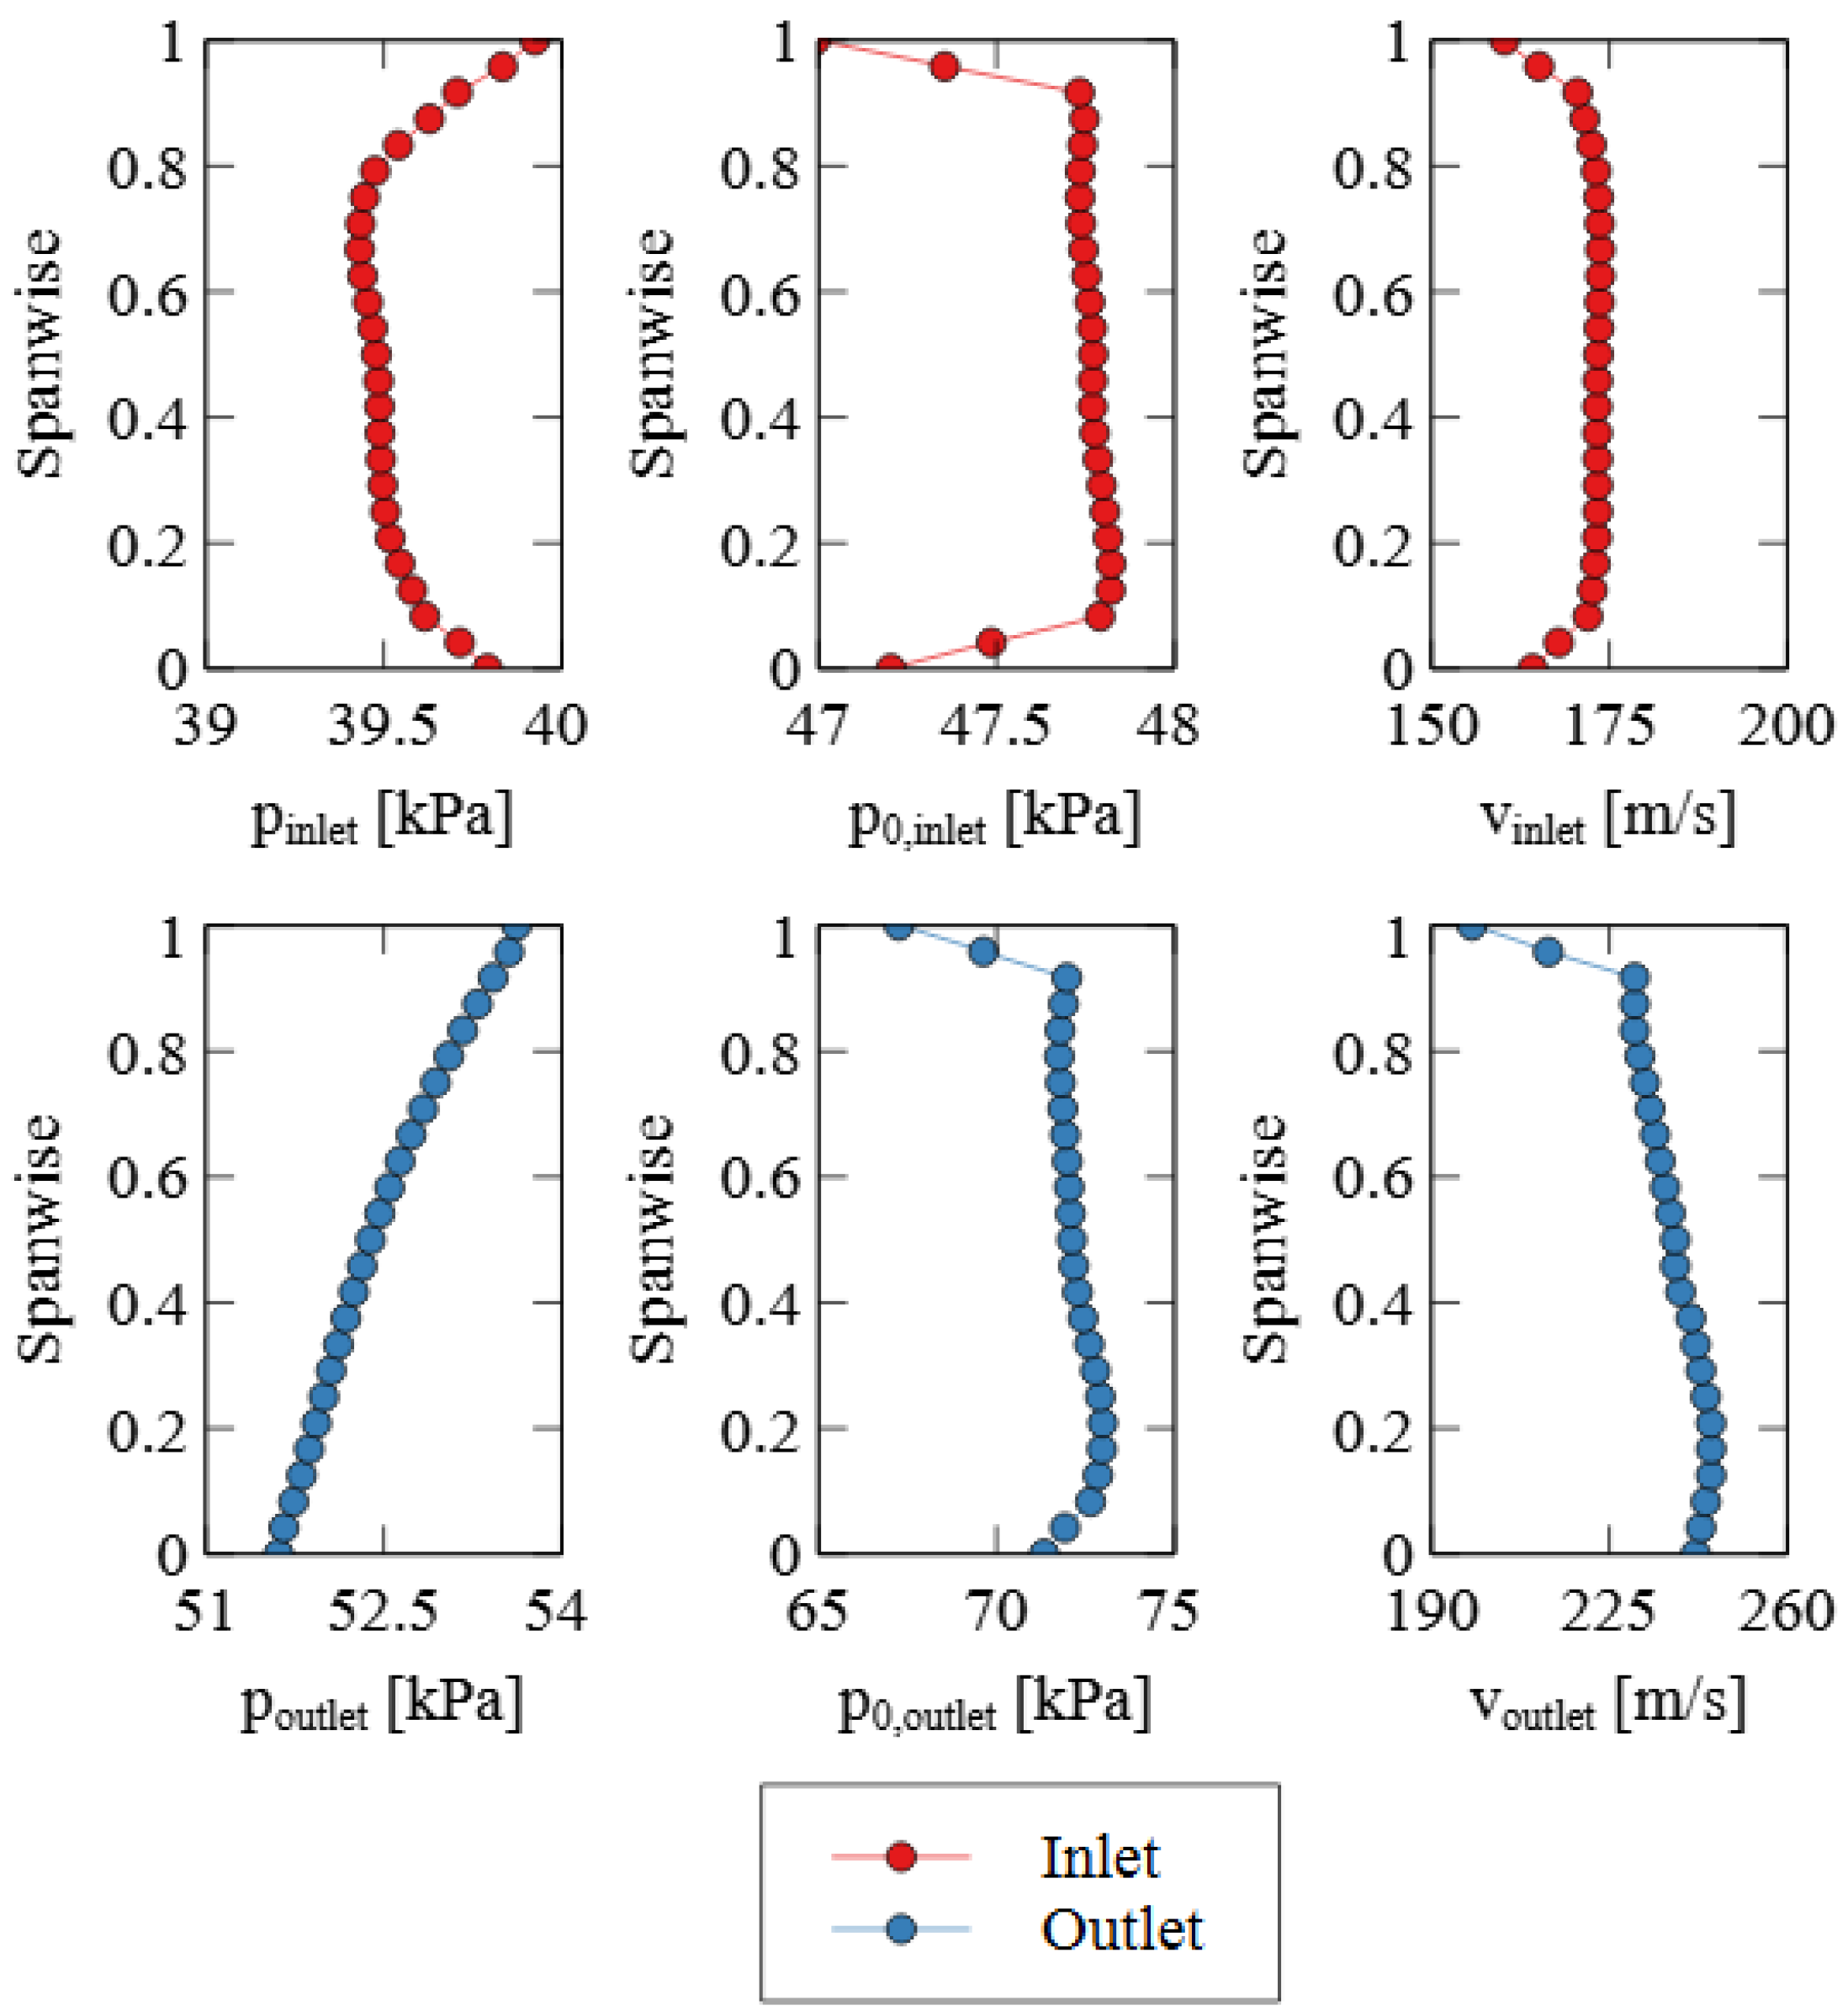
Figure 1. Rotor inlet (red—top) and outlet (blue—bottom) radial variations: absolute static pressure (left), absolute total pressure (center) and absolute velocity (right).
Aerospace 11 00276 g001
Figure 2. Hub, shroud and blade passage streamlines location.
Aerospace 11 00276 g002
Figure 3. Constant curvature transition curves applied for obtaining smooth endwall contouring while varying rotor AR.
Aerospace 11 00276 g003
Figure 4. Comparison of the relative difference (in %) in mass flow rate, total pressure ratio and polytropic efficiency for different mesh sizes.
Aerospace 11 00276 g004
Figure 5. IGV (left) and rotor (right) using the mesh chosen from the mesh independence study.
Aerospace 11 00276 g005
Figure 6. Boundary conditions applied in the computational fluid dynamics (CFD) domain.
Aerospace 11 00276 g006
Figure 7. Key parameter variation (in %) for the parameters ϕ, ψ, Λ, DF and relative Mach number at the inlet and outlet domains for different ARs.
Aerospace 11 00276 g007
Figure 8. Polytropic efficiency and total-to-total pressure ratio versus rotor AR.
Aerospace 11 00276 g008
Figure 9. Relative total pressure distribution at rotor blade—top, suction side; and bottom, pressure side—for different ARs: (a) 0.71, (b) 1.52 and (c) 2.08.
Aerospace 11 00276 g009
Figure 10. Relative Mach number distribution for blade-to-blade passage—top, 10% span; center, 50% span; and bottom, 90% span—for different ARs: (a) 0.71, (b) 1.52 and (c) 2.08.
Aerospace 11 00276 g010
Figure 11. Pressure coefficient distribution of rotor blade for AR = 1.24, AR = 1.37 and AR = 1.52 and for 10%, 50% and 90% of the blade span, respectively, from top to bottom.
Aerospace 11 00276 g011aAerospace 11 00276 g011b
Table 1. Virtual Integrated Compressor (VINK) first-stage specification in nominal condition.
ParameterValue
Design rotational speed6242 rpm
Design rotor blade velocity402.00 m/s
Design point pressure ratio1.51
Design point corrected mass flow89.5 kg/s
Design point polytropic efficiency91.0%
Surge margin at design point 119.1%
De Haller Number 20.74 and 0.92 (stator)
1 Calculated according to the stall margin definition in Equation (4) in the present paper. 2 Calculated using area-averaged values at both blade rows inlet and outlet.
Table 2. Additional geometrical VINK compressor data.
ParameterInlet Guide Vane (IGV)Rotor
Blade count7651
Chord at mean radius50.4 mm98.3 mm
Axial chord at mean radius49.8 mm54.7 mm
Rotor AR-1.37
Rotor hub-to-tip ratio-0.80
Disclaimer/Publisher’s Note: The statements, opinions and data contained in all publications are solely those of the individual author(s) and contributor(s) and not of MDPI and/or the editor(s). MDPI and/or the editor(s) disclaim responsibility for any injury to people or property resulting from any ideas, methods, instructions or products referred to in the content.