Article

Effect of Particle Size on the Biomethanation Kinetics of Mechanically Pretreated Sargassum spp. Biomass

by
Rosy Paletta
1,*,
Rossella Girimonte
1,
Yessica A. Castro
2,
Jose Atilio De Frias
2 and
Vincenza Calabrò
1
1
Department of Computer Engineering, Modelling, Electronics and Systems (DIMES), University of Calabria, 87036 Rende, Italy
2
Department of Chemistry and Chemical Technologies, Universidad Federico Henriquez y Carvajal, Santo Domingo 10106, Dominican Republic
*
Author to whom correspondence should be addressed.
Methane 2024, 3(1), 160-171; https://doi.org/10.3390/methane3010010
Submission received: 14 November 2023 / Revised: 11 December 2023 / Accepted: 2 February 2024 / Published: 4 March 2024
(This article belongs to the Special Issue Anaerobic Digestion Process: Converting Waste to Energy)

Abstract

:
The collection and use of Sargassum spp. as feedstock for the production of valuable products such as biomethane by anaerobic digestion (AD) would mitigate the negative impact of the blooms and the costs related to waste management in the Dominican Republic. In this work, the effect of the particle size of pelagic Sargassum spp. biomass, as a result of mechanical pretreatments, on the biomethanation was determined. The granulometric analysis of the mechanically pre-treated biomass was carried out using a Mastersize2000. The Biochemical Methane Potential (BMP) of the samples was determined using an Automatic Potential System Test II (AMPTS® II). The kinetic parameters of the reaction were scientifically evaluated by using First order kinetic Model and modified Gompertz Model. The granulometric analysis showed a monomodal distribution on crushed biomass (505 µm) and a bimodal distribution on the milling sample (107 µm). The bimodal biomass means the biomass is characterized by the presence of fine and large particles. We observed that BMP increased by 78.85% when particles were reduced from 50,000 µm to 505 µm and by 73.61% when particles were reduced from 50,000 µm to 107 µm. A low methane yield from the milling biomass (107 µm) compared to the crushed biomass (505 µm) could be related to the excessive reduction of particle size. The fine particles are subject to the formation of aggregates and consequently, the contact area between the algae cells and the microorganisms that operate the anaerobic digestion process decreases.

1. Introduction

Sargassum spp. was first sighted in the 15th century by Christopher Columbus at the area known as the Sargasso Sea. Sargassum spp. is not only found in the Sargasso Sea but its extension is much wider, as reported by the great Atlantic Sargassum belt (GASB) [1], it extends from South Africa to the Gulf of Mexico and blooms occur in the central Atlantic Ocean and the Caribbean Sea since 2011 [2]. Although there are 2000 species of brown macroalgae, the Caribbean sea is characterized by the presence of the holopelagic species Sargassum natans (morphotypes I and VIII) and S. fluitans (morphotype III) [3]. These Sargassum spp. have invaded the beaches of the southern and eastern coasts of the Dominican Republic, affecting the tourism, fishing, biodiversity, and health of the nearby communities [4]. In January 2023, a new accumulation record of 8.7 million tonnes was recorded in the Atlantic Ocean, according to data reported by the Sargassum Watch System. In the following months the following quantities were recorded: February equal to 6.1 million metric tons, March 13 million metric tons, April approximately 13 million metric tons (3 million metric tons in the Caribbean Sea), May 11 million metric tons, June 9 million metric tons, July 6 million metric tons (1.5 million metric tons in the Caribbean Sea), August 5 million metric tons (2 million metric tons in the Caribbean Sea), September 3 million metric tons (<1 million metric tons in the Caribbean Sea), October 1 million metric tons (0.15 million metric tons in the Caribbean Sea), according to data reported by the Sargassum Watch System [5].
The recovery and valorization of Sargassum spp. would mitigate the negative impact of the blooms and the costs related to waste management [6]. Sargassum spp. is rich in nutrients and bioactive substances and can also be used for the production of green energy [7]. In the areas covering green and circular economies, algal biomass arouses considerable interest as feedstock for value-added products, from food to fuels. For instance, algal biomass can be used for the production of biogas via anaerobic digestion resulting in a methane yield of around 100 mL CH4/g biomass from Punta Cana [8] (AD). However, AD is influenced by various factors such as the composition of the inoculum, composition of the substrate, temperature, pH, and experimental configuration [9]. Plant biomass, including Sargassum spp., are generally rich in cellulose, and lignocellulose, which is known to be a rigid and complex structure that inhibits the AD process [10]. Thus, the pre-treatment of the Sargassum spp. biomass is required to improve the AD process, and consequently increase the biogas yield. There are several types of pre-treatment: mechanical, thermal, chemical, enzymatic [4]. Mechanical pre-treatment is a known technique which consists in reducing biomass into small particles with the aid of knives, blades, blenders. Biomass cutting or grinding increases the surface-to-free volume ratio of the lignocellulose matrix, which improves the hydrolysis of complex carbohydrates into sugars by fermentation or anaerobic digestion [11] due to the higher surface area available to microorganisms that results in an increase of biodegradability [12].
All the pre-treatments mentioned involve an energy consumption that varies according to the pre-treatment and the operating conditions. Evaluation of energy consumption is important for both the economics and energy balance of biomass conversion [13].
The rate and stability of the anaerobic digestion process is significantly affected by the particle size and the choice of equipment used for the mechanical pretreatment of the biomass [14]. A study conducted on Sargassum muticum showed that the yields of methane increased by 54.5% when the biomass was chopped [15]. A study conducted on the macroalga Sargassum fulvellum shows that the production of methane increases by 52.34% on biomass with particle size of 75–850 μm compared to that with higher particle size (106 μm, 4.75 mm) [16]. Other studies conducted mainly on municipal solid waste samples showed that the yield of organic material with a particle size of 10 mm in diameter leads to an increase in yield of 20% compared to that with a particle size of 100 mm [17]. In another study conducted on organic residues from typical Japanese cuisine, the reduction of particle size from 0.888 to 0.718 mm increased the methane production in 28% [12]. Similarly, for sisal fiber waste, a 22% increase in biogas production was observed when the fiber length changed from 100 mm to 2 mm [18]. There is literature available on the effect of substrate particle size on the anaerobic digestion of some Sargassum spp. or other organic material, however, studies regarding the effect of particle size on the biomethanation kinetics of the pelagic S. natans (morphotypes I and VIII) and S. fluitans (morphotype III) have not been conducted.
Studies of other authors have been limited to the correlation of the biomass particle size with the biomethanation. However, this work’s contribution leads to understanding how the granulometry composition and biomass particle size affects the biomethanation kinetics of these Sargassum spp. arriving to the Caribbean. The granulometry analysis was used to describe how and why the size of the biomass influences the anaerobic digestion process. For the scaling up of a system for the. In addition, the energy consumed during mechanical pretreatment of the biomass for the obtention of different particle sizes, and the energy produced on the anaerobic digestion of the Sargassum spp. biomass were estimated. This aspect has not been broadly explored in literature and is important to evaluate the potential cost of the pre-treatment, for this reason the energy necessary to reduce the size of the sample and the approximated costs are estimated.

2. Materials and Methods

2.1. Substrate and Inoculum

Fresh Sargassum spp., accumulated on barriers located 300 m from the eastern coast of the Dominican Republic, was collected in Punta Cana (18°32′ N 68°22′ W) during Spring season. On the same day of collection, the biomass was stored at 4 °C. Samples were washed with deionized water, and epiphytes and non-structural elements were removed from the biomass. Excess water was removed from the biomass with absorbent paper towel, and samples were air dried indoors for several days until constant weight was achieved.
Fresh cattle manure required for inoculum preparation was collected from a local farm (Farm “Domenico Frontera” in Savelli-Italy). On the same day, the manure was diluted and mixed, with a wooden stick, with tap water in a 1:1 ratio.

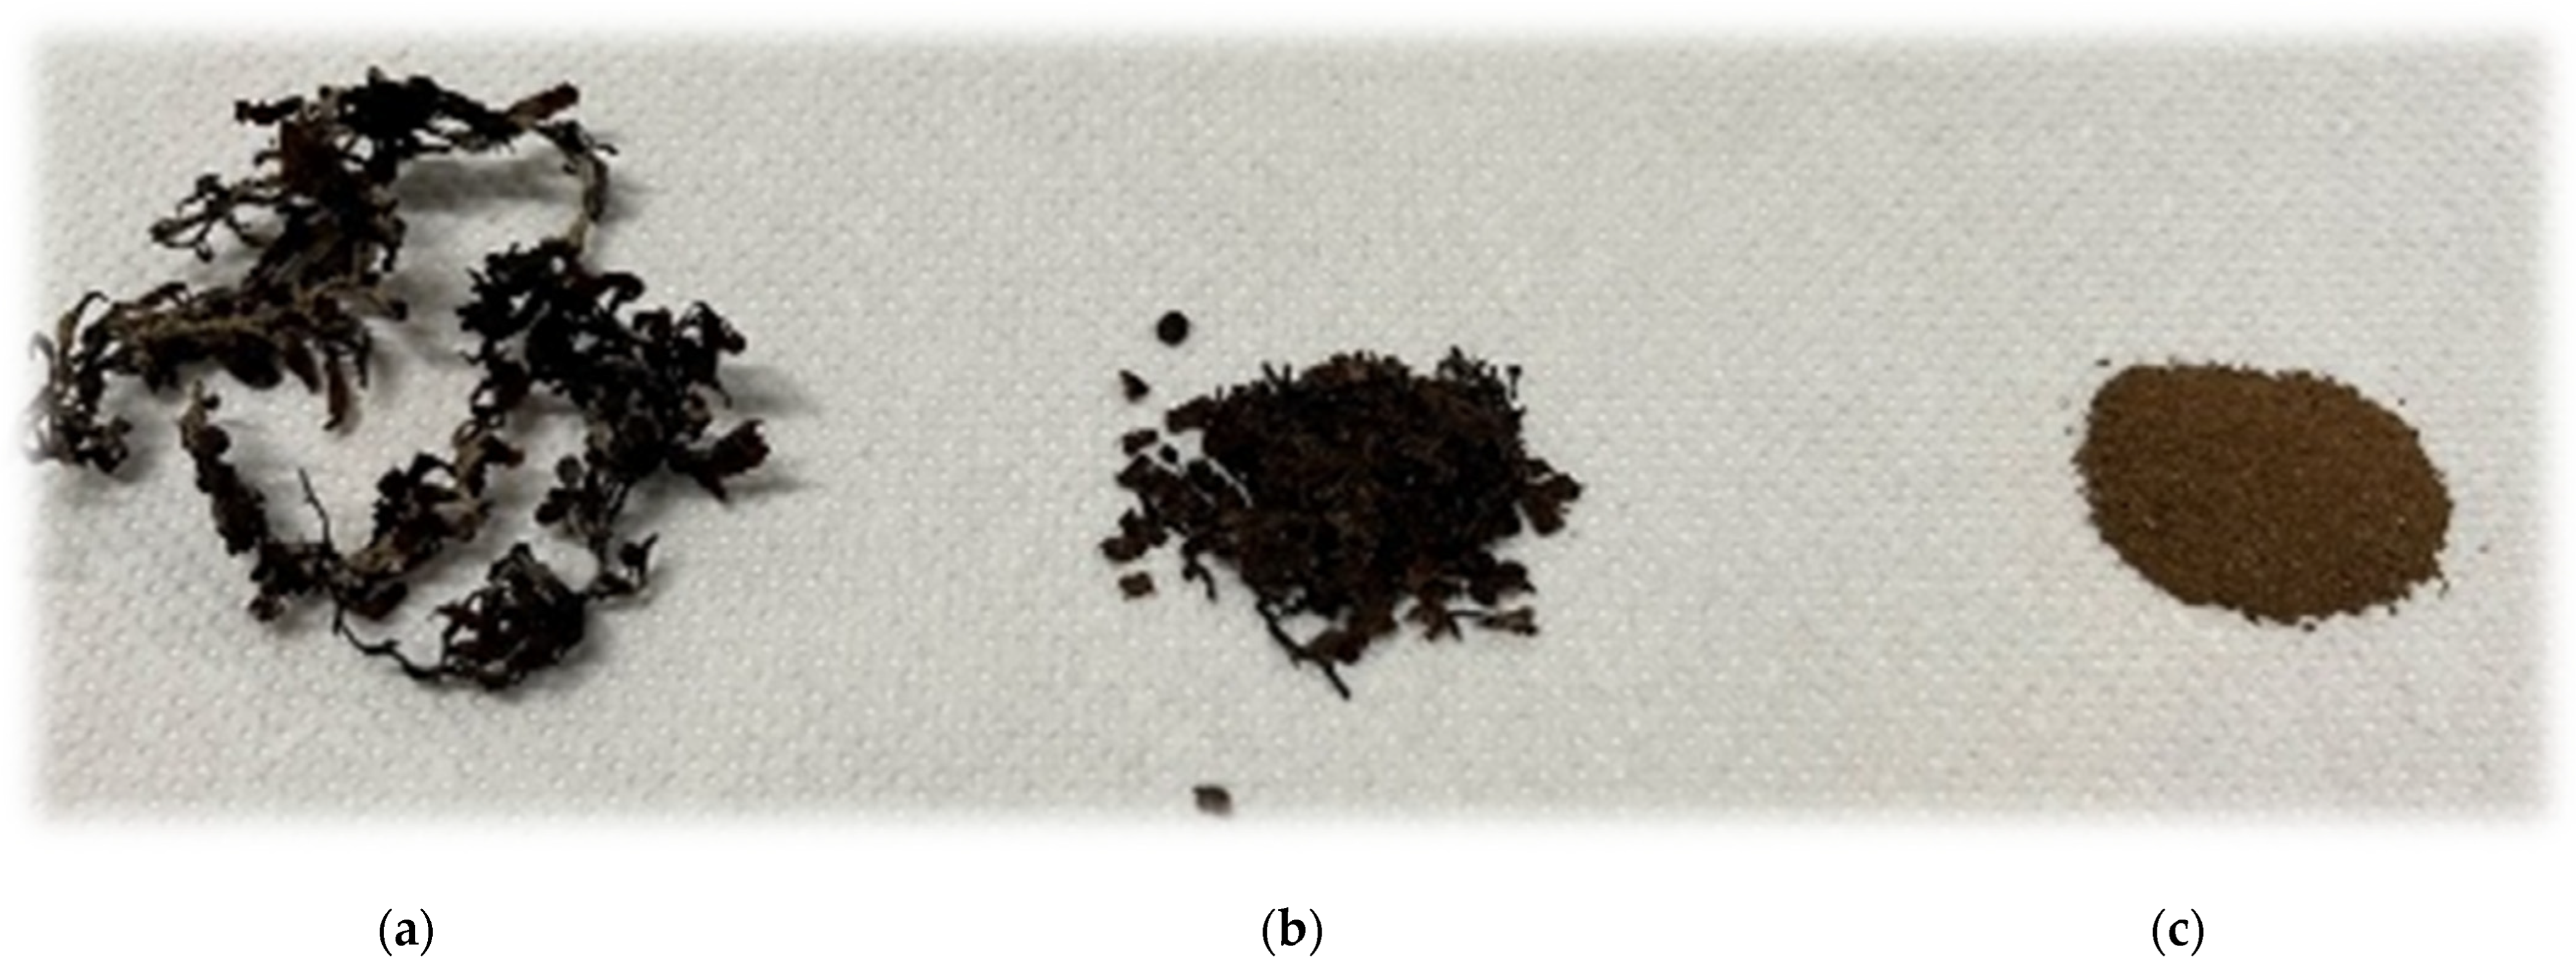
2.2. Biomass Pre-Treatment

Sargassum spp. was subjected to mechanical pre-treatment under different conditions: S.1 (Figure 1a), sample chopped with scissors; S.2 (Figure 1b), sample milled (505 µm) using Philips (Milan, Italy) mixer (2200 W) for 1 min at maximum speed; S.3 (Figure 1c), sample grounded to powder (107 µm) using Moulinex mixer (Écully, France) for 2 min. The determination of total solids (TS) and volatile solids (VS) was performed taking into account the Laboratory Analytical Procedure (LAP) [19].
The determination of TS and moisture were determined drying the sample in an oven at 105 °C ± 2 °C. The content of moisture was calculated by Equation (1):
M % = W 0 W f W 0 100
where W0 was the initial mass of the dried sample before oven drying, Wf was the mass of the sample after drying in oven at 105 °C ± 2 °C.
The ash content was determined by calcination in a muffle at 550 °C ± 10 °C for 6 h. The ash content was calculated by Equation (2):
A s h   % = W c W 0 100
where W0 was the initial mass of the dried sample before oven drying and Wc was the residual mass of the sample after calcination in muffle at 550 °C ± 10 °C for 6 h.
The VS were calculated by Equation (3):
V S   % = W d   W c   W 0 100  
where Wd is the mass of the sample (g) after drying in oven at 105 °C ± 2 °C, Wc is the mass of the sample (g) after calcination in muffle at 550 °C ± 10 °C for 6 h and mw is the initial wet mass of the sample (g).

2.3. Granulometric Analysis of Biomass

The granulometric analysis of the mechanically pre-treated biomass samples (S.2, S.3) was carried out using a Mastersize2000 (Malvern, UK) laser diffractometer to determine the average surface to volume diameter. The analyzer has two accessories for sample dispersion in the cell. For S.2 (505 µm), the test was conducted by dry dispersion with the accessory Scirocco 2000, at a pressure of 1.9 bar and feed rate of 50%. However, S.3 (107 µm) was analysed by wet dispersion with the Hydro2000MU using water as dispersant fluid due to the agglomeration tendency of materials with small particle size.

2.4. Anaerobic Digestion through Automatic Potential System Test II (AMPTS-II)

The Biochemical Methane Potential (BMP) was developed using the Automatic Methane Potential Test System II (AMPTS-II®) manufactured by BPC instruments (Lund, Sweden). The AMPTS-II consists of 15 channels that measure the gas flow from 15 batch 500 mL reactors. Each reactor contained 450 mL of inoculum that had 6.67 ± 0.40% TS containing 22.45 ± 0.60% of ashes, and 77.55 ± 0.40% of VS. Conad cornstarch (Bologna, Italy) was used as a positive control to validate the efficiency of the inoculum. The samples were run in duplicates 2, with an inoculum to substrate ratio equal to 3 [20] under mesophilic conditions (37 °C). The BMP test lasted 30 days.

2.5. Mathematical Kinetic Model

Two kinetic models, the first-order kinetic model (Equation (4)) and the modified Gompertz model (Equation (5)) were used to determine the kinetic constants A, u and m applying a nonlinear regression model.
The production of biomethane by anaerobic digestion process can be described by first order kinetics
  y t = A 1 e k t  
where y(t) is the cumulative biogas production (NmL·g−1VS), A is the biogas production potential (NmL·g−1VS) and k was estimated by taking the reciprocal of the time from the start of the BMP assay until when y(t) equaled 0.632 A [21,22].
The modified Gompertz model (Equation (5)) was used to validate the experimental data. It is assumed that the biogas production corresponds to the specific growth rate of methanogenic bacteria in the digester [23].
y   t = A exp { exp [   u e A   m t + 1 ] }
where y(t) is the cumulative biogas production (NmL·g−1VS), A is the biogas production potential (NmL/gVS), u is maximum biogas production rate (NmL/gVS ·day−1), e is a mathematical constant (2.718282), m is the lag phase period (days), and t is the cumulative time for biogas production (days).

2.6. Energy Analysis

The energy consumed ( E C ) to reduce the particle size of the samples can be calculated using Equation (6); where P is the power measured in kW and t is the time expressed in hours.
E C = P   k W t   ( h )
To evaluate the effect that the energy consumed has on the energy balance, it is necessary to calculate the energy produced (Ep) expressed in kWh (Equation (7)), following the anaerobic digestion process. The higher calorific value of biomethan is on average equal to 39.84 MJ/ m3 therefore from 1 m3 of biomethane, considering that 1 kWh is equal to 3.6 MJ, 11.07 KWh are obtained.
E P = 11.07   kWh BMP 30
In this work the effect of energy consumption on the energy produced is evaluated. The available energy (Ed), expressed in kWh, indicates the difference between the energy produced and the energy consumed to reduce the particle size (Equation (8)). The energy consumed in the production of biomethane is not considered.
E d = E P E C

2.7. Statistical Analysis

For the comparison of BMP (Nm3/t)) of the experimental units, one-way analysis of variance (ANOVA) and Tukey’s test were carried out using Origin Pro 2019 from Origin Lab (Northampton, MA, USA). For the comparison of the biomass composition, unpaired t-test was used (GraphPad). The data was assumed to be normal, independent and equal variance.

3. Results and Discussion

3.1. Biomass Characteristics Post-Pretreatment

The volatile solids of the milled Sargassum spp. biomass with particle sizes of 505 µm (46.47 ± 0.44)%wt and 107 µm (50.52 ± 0.40)% wt were not significanlty different (p = 0.130). However, the volatile solids of the chopped biomass (56.01 ± 0.40)%wt was higher (p < 0.005) than those from the milled and crushed biomass. Similarly, the ash content of the chopped biomass (28.85 ± 0.23%) was lower (p < 0.001) than those of the milled biomass. The difference in ash content between the biomass with particle sizes of 505 µm (29.69 ± 0.30)%wt and 107 µm (30.87 ± 0.20)%wt is considered to be not quite statistically significant (p = 0.052). Our values for volatile solids were slightly higher than those obtained by other authors (see Table 1) [24]. Also, that study resulted in higher volatile content and lower ash content at smaller particle size, which differs from our results.

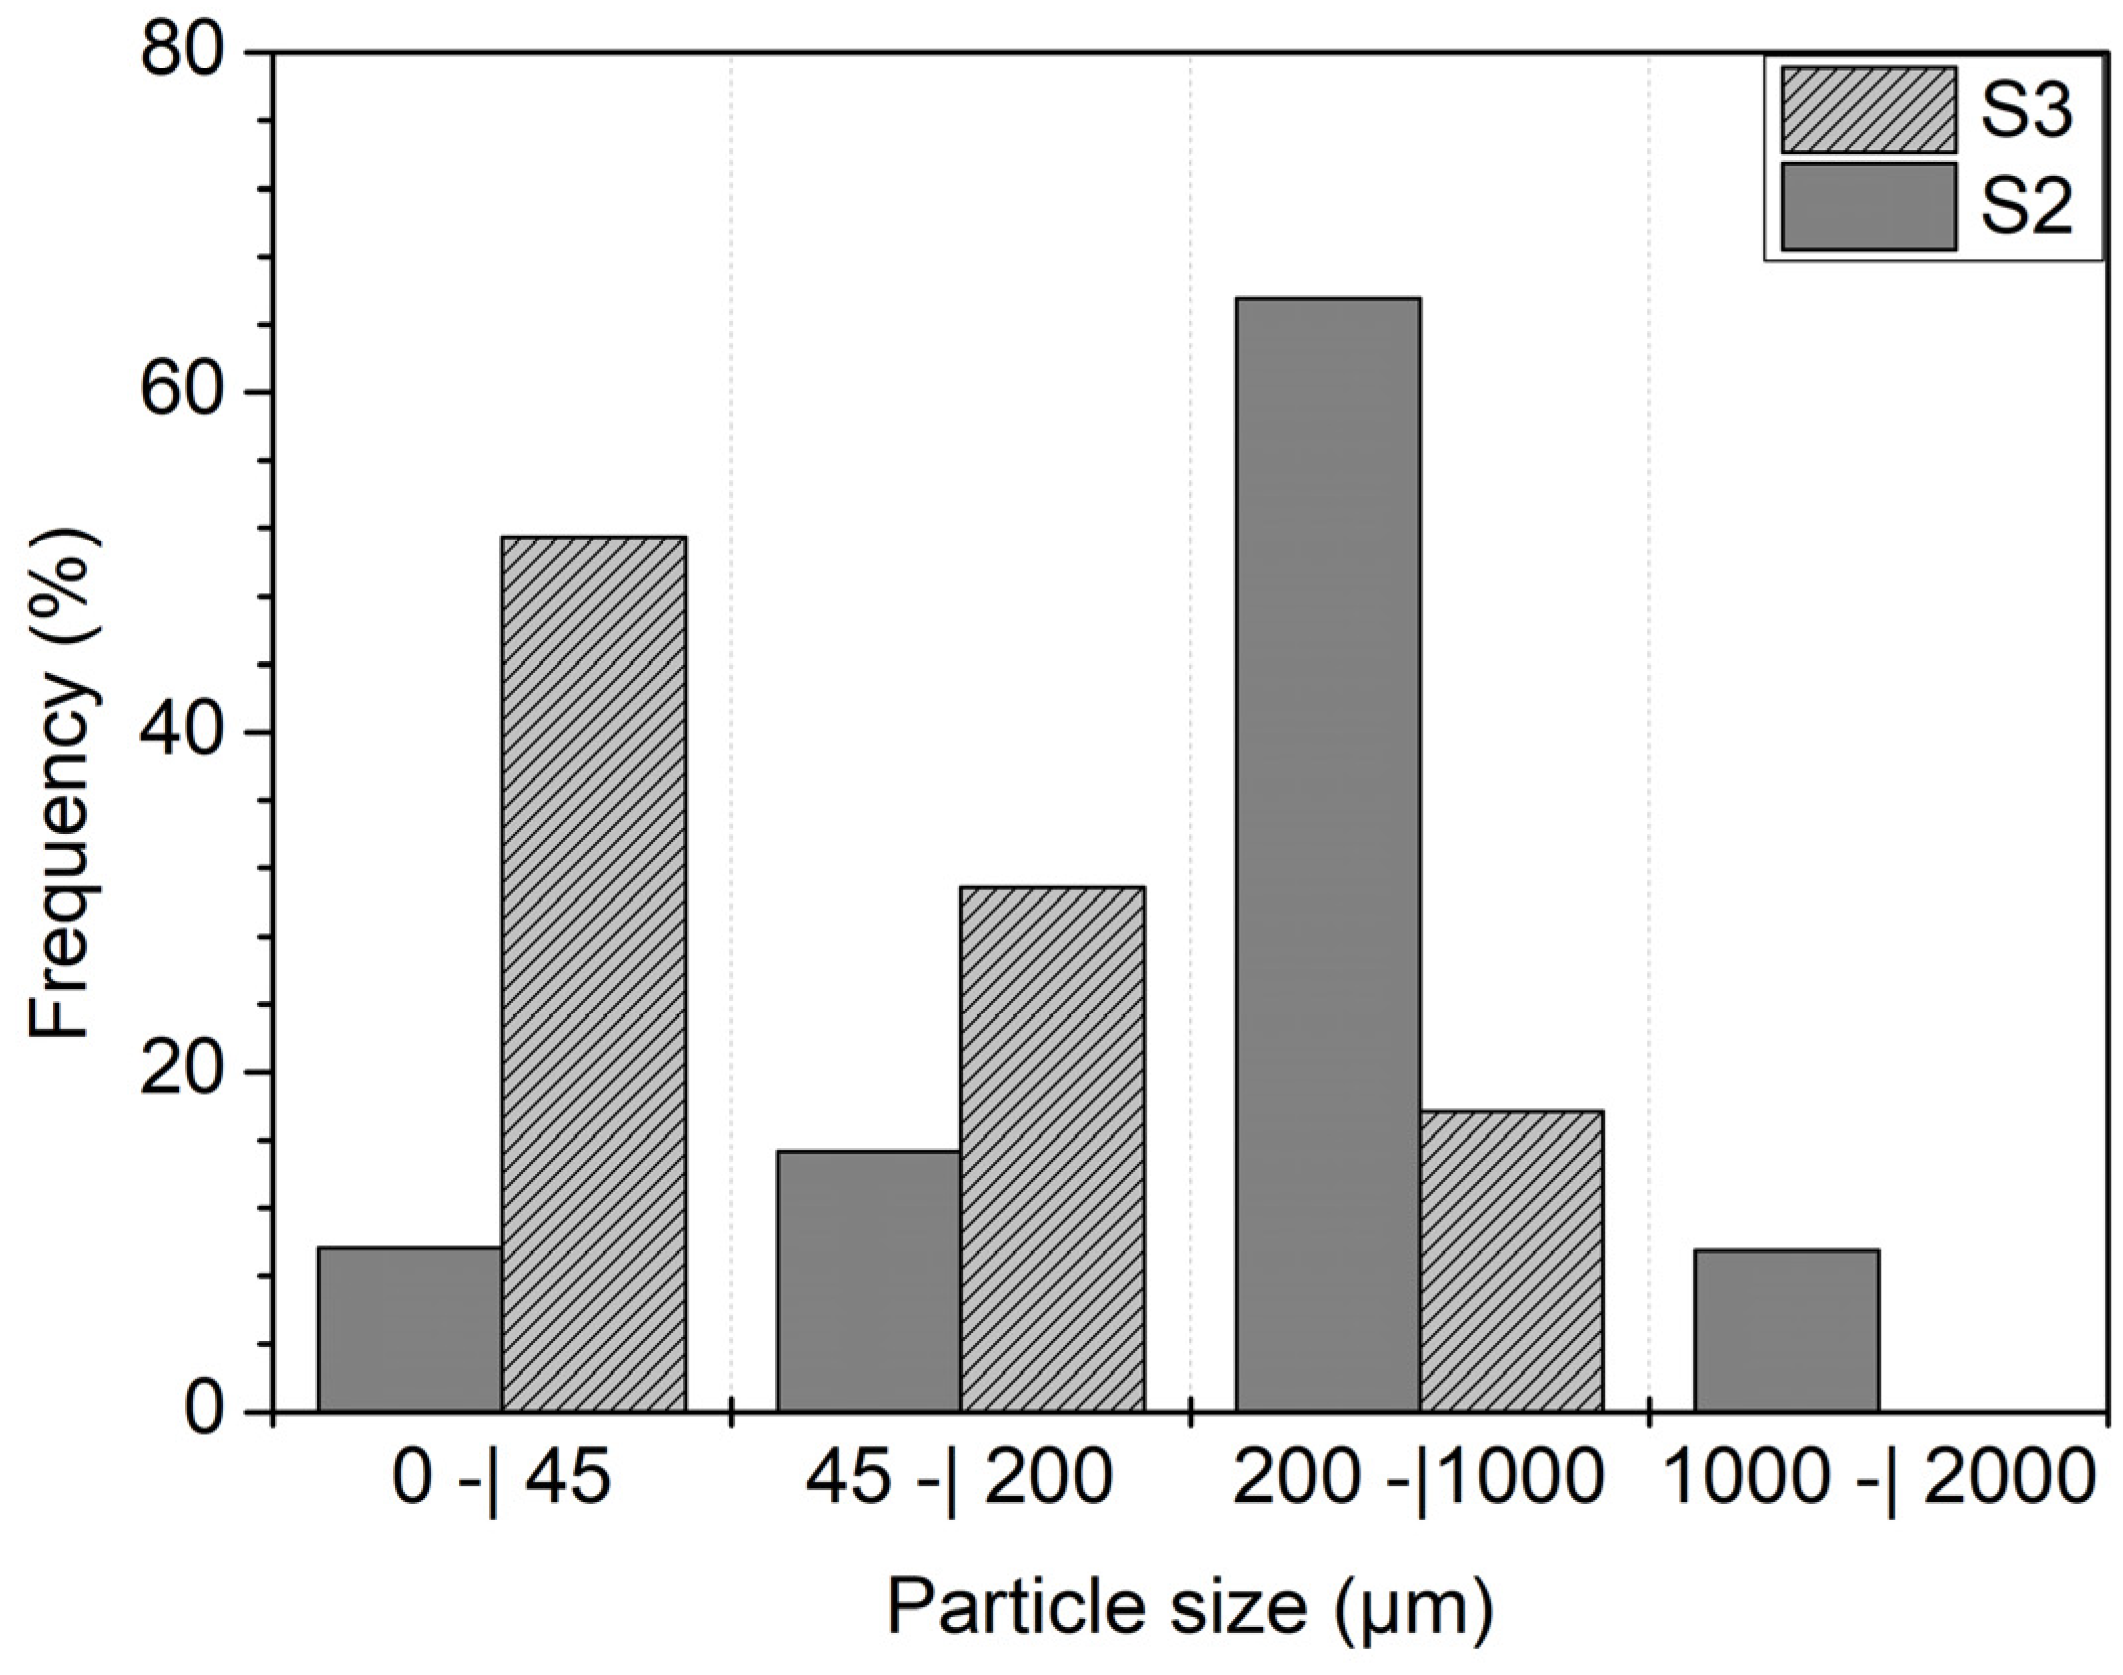
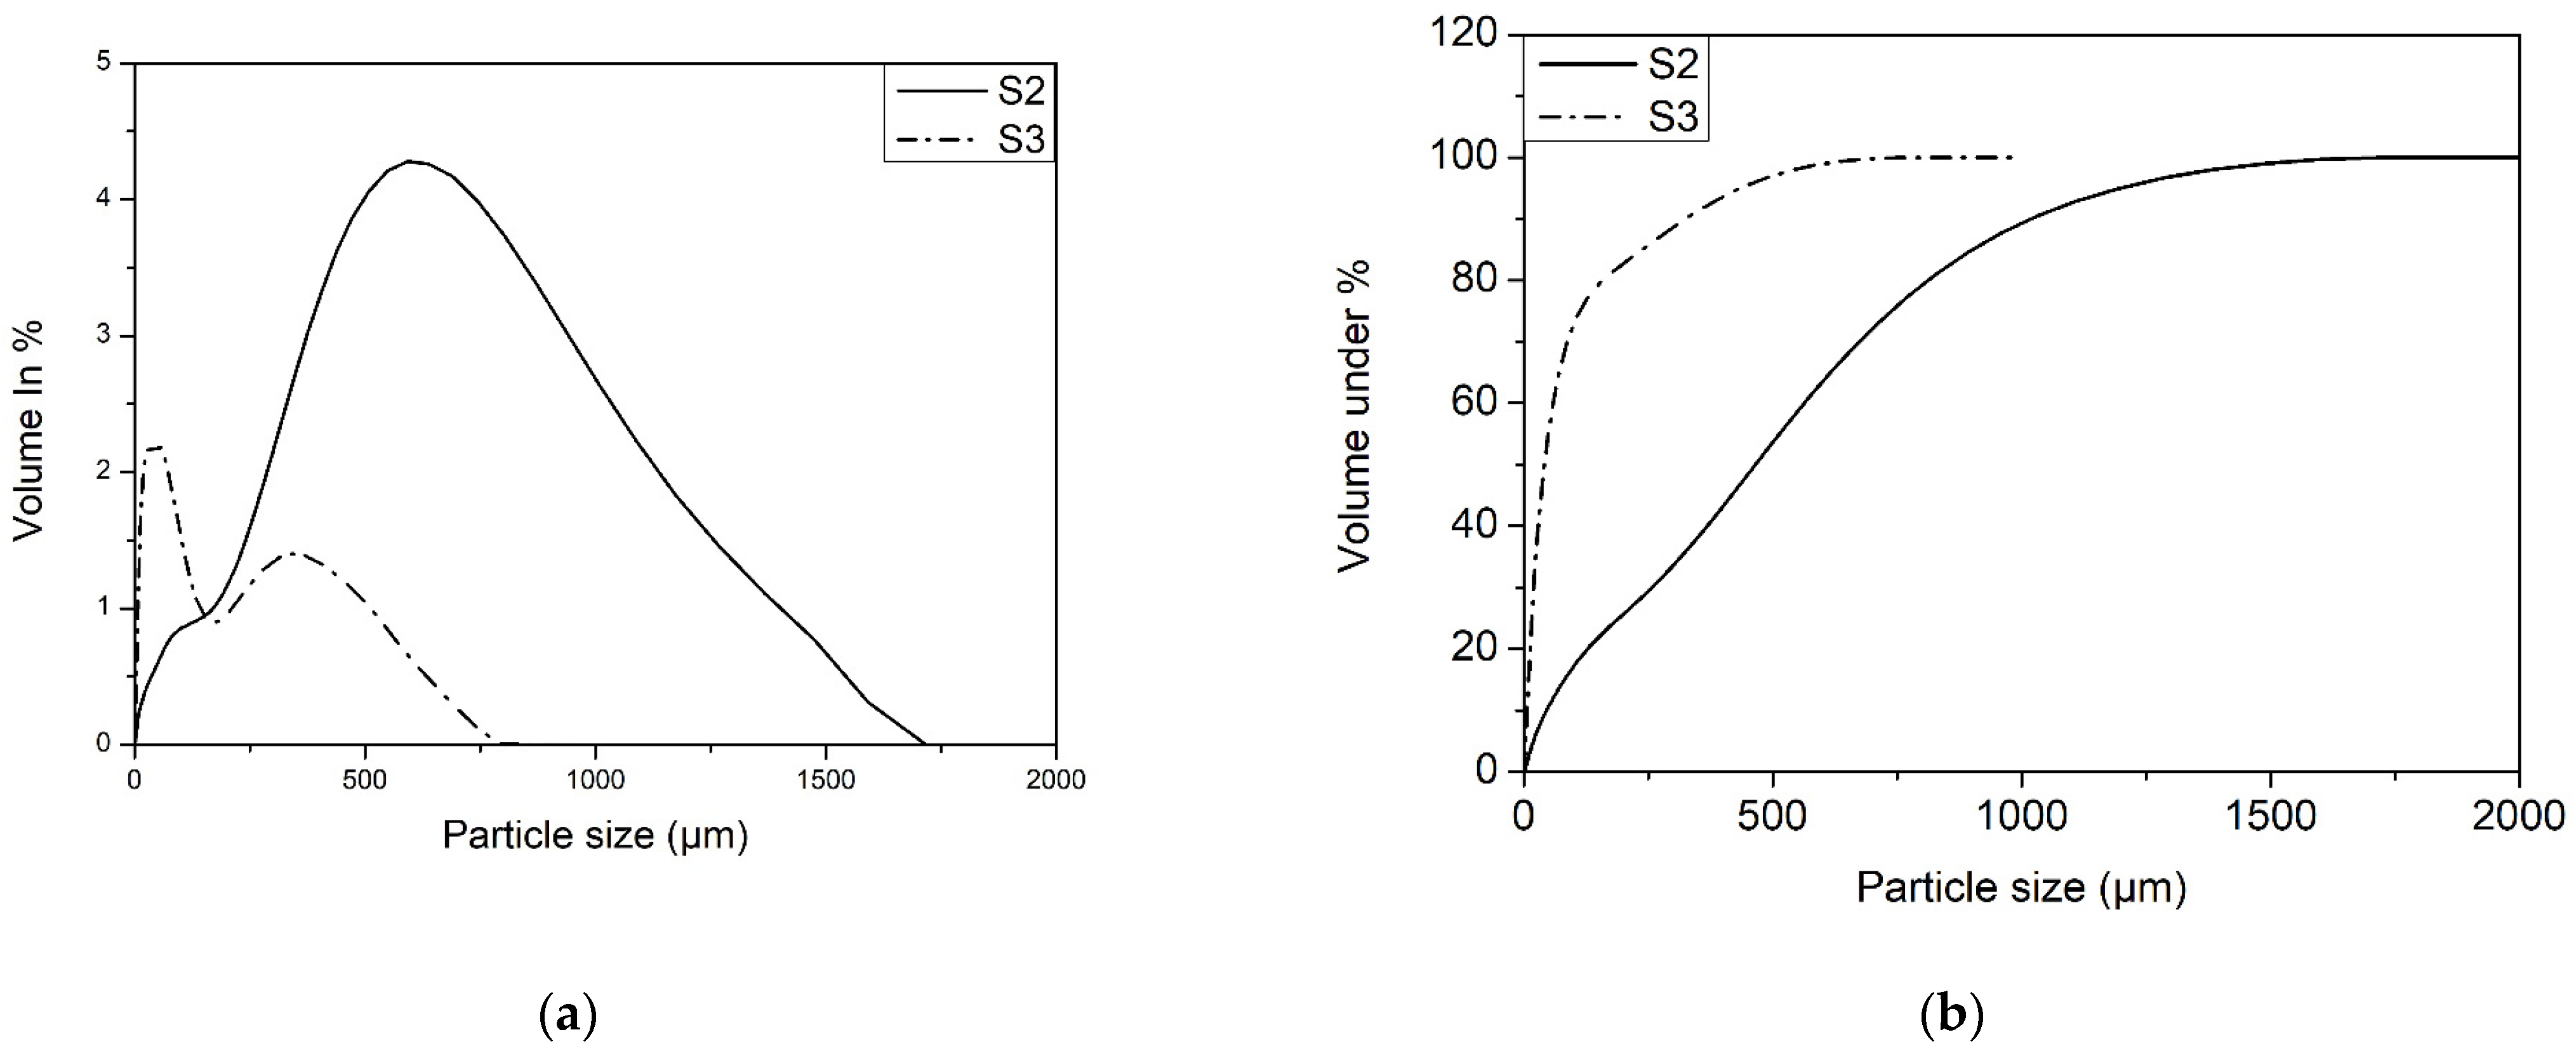
3.2. Granulometric Analysis of Sargassum spp.

The crushed biomass (S.2) reduced its monomodal size distribution all within the range detectable by the analysis tool (Figure 2a), although it appears very wide. The comminution by the milling (S.3) was more efficient, as the particle size distribution shifted towards lower sizes (see Figure 2a). For both, S.2 and S.3, characterized by laser diffraction, the surface to volume mean, dSV, drops drastically from 86 to 15 µm, as more fine particles are produced by the last type of the comminution pre-treatment (milling, S.3). In fact, the particle size distribution widens in amplitude, as signaled by the increase of the parameter span indicated in Table 2, and also it becomes a bimodal curve (see Figure 2a). The sample now appears characterized as a mixture of two parts, one is of finer particles that represent more than 40% and the rest of ≥ones. This aspect is relevant because, increasing the fines presence in a solid sample increases the superficial area, but also introduces agglomeration problems [25], so the ≥particles of the sample help to prevent this.
It is evident that the milling sample (Figure 3) has the highest distribution frequency within the range of finer particles (from 0 to 45 µm), while the crushed sample predominantly consists of particles in the range of 200 m to 1000 µm. In the milling sample (S.3), the size classes ≥ 1 mm disappeared resulting in the presence of fine particles due to the milling process. This aspect is crucial, because there is an useful mix between fine content and coarse particle that reflects into a macroscopic behavior of the milling sample (S.3): high superficial area with agglomeration [25].

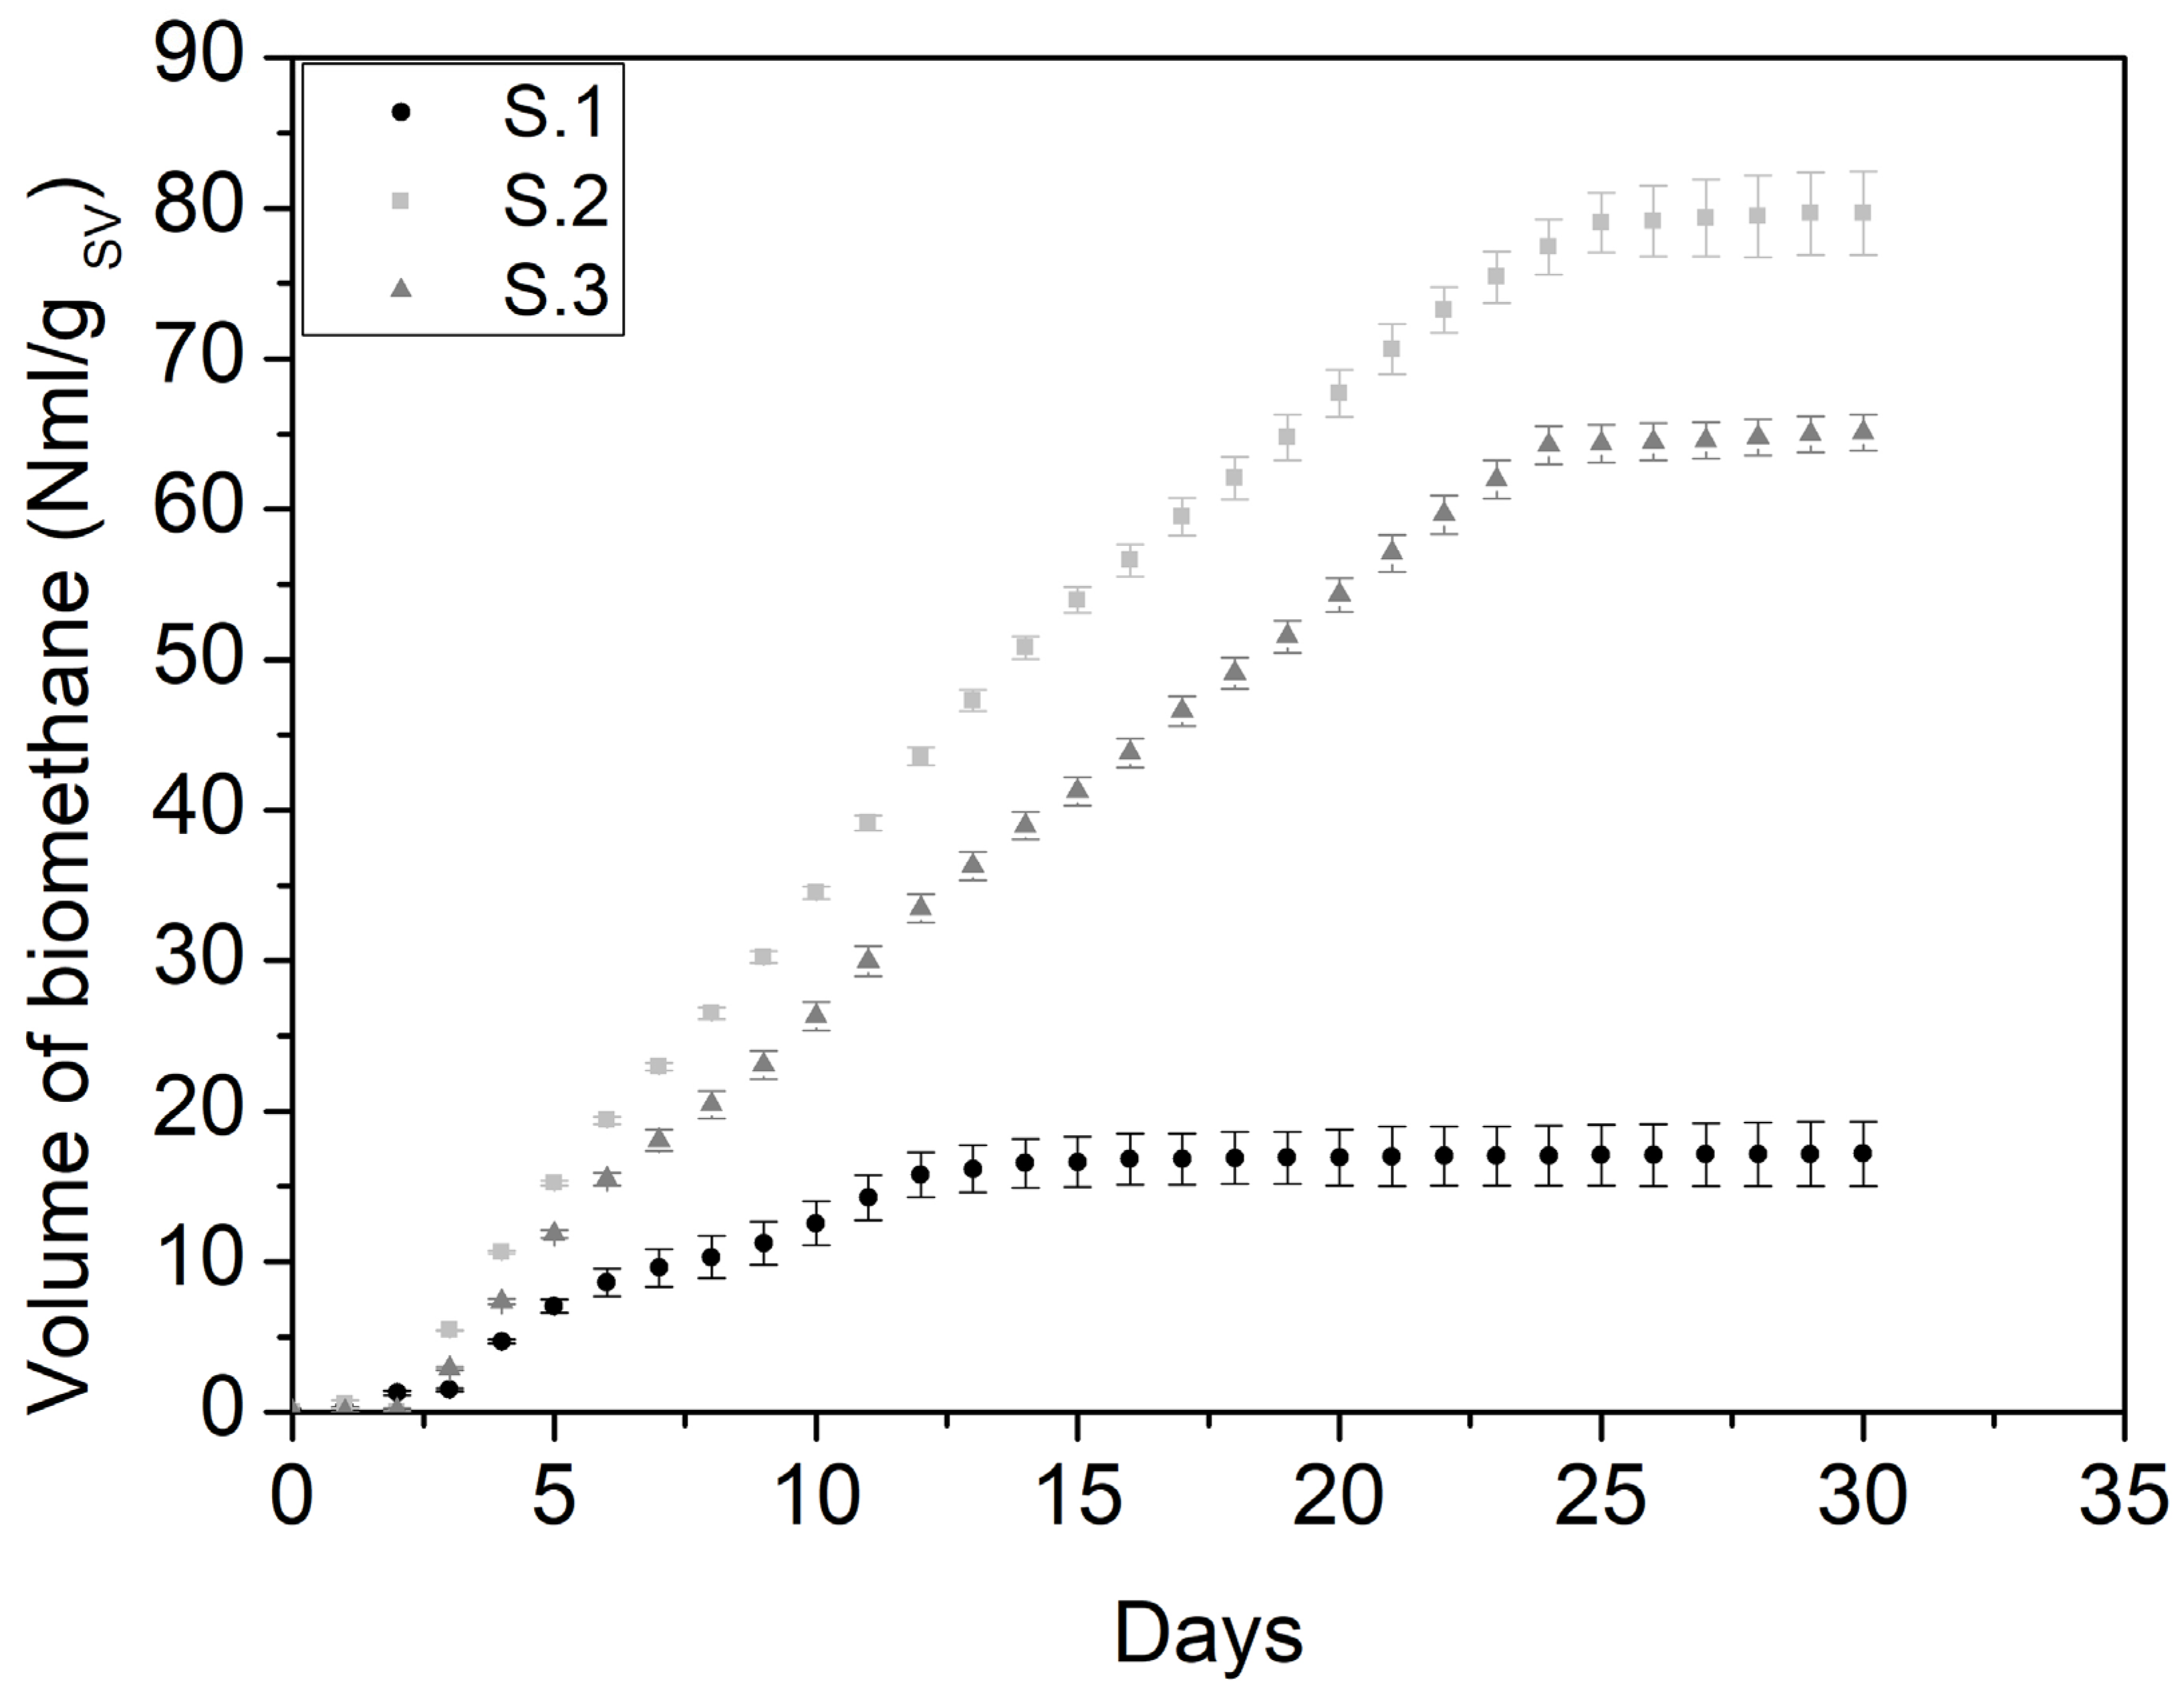
3.3. Effect of Particle Size on the Biomethane Production

After the 30 day-period, the methane yield increases with the decrease of the particle size (Figure 4). The methane yield goes from 17.17 NmL/gVS to 79.68 NmL/gVS when the average size of the sample goes from 50,000 µm to 505 µm, and from 17.17 NmL/gVS to 65.08 NmL/gVS when the average size of the sample go from 50,000 µm to 107 µm. The methane yield (NmL/gVS) for the chopped biomass (S.1) were significantly lower (p < 0.0005, Table 1) than those for the mechanically pretreated biomass (S.2 and S.3). Similarly, the methane yield of the biomass with particle sizes equal to 107 µm (S.3) is higher than (p = 0.0279) that with particle size equal to 505 µm (S.2). However, there is no difference (p = 0.06156) between the methane yield of S.2 and S.3.
A lower methane yield of the milled biomass (S.3) compared to the crushed biomass (S.2) could be related to the excessive reduction of particle size. The granulometric analysis of S.3 (107.0 ± 0.1 μm) highlighted the predominant presence of fine particles in the range between 0–45 μm. These fine particles are subject to the formation of aggregates and consequently, the contact area between the algae cells and the microorganisms that operate the anaerobic digestion process decreases [26]. Furthermore, the excessive decrease in particle size increases the presence of volatile fatty acids which inhibit the methanogenesis process [26]. For instance, the methane yield druing the anaerobic digestion of food waste with small particle size (0.7 mm) was lower than with larger particle size due to the accumulation of volatile fatty acids [12]. These results differ from that of most authors’ that have only reported the increase in biomethanation when there is a particle size reduction of the algal biomass or municipal/industrial wastes. Table 3 shows the Effects of mechanical pretreatment on different types of biomass.

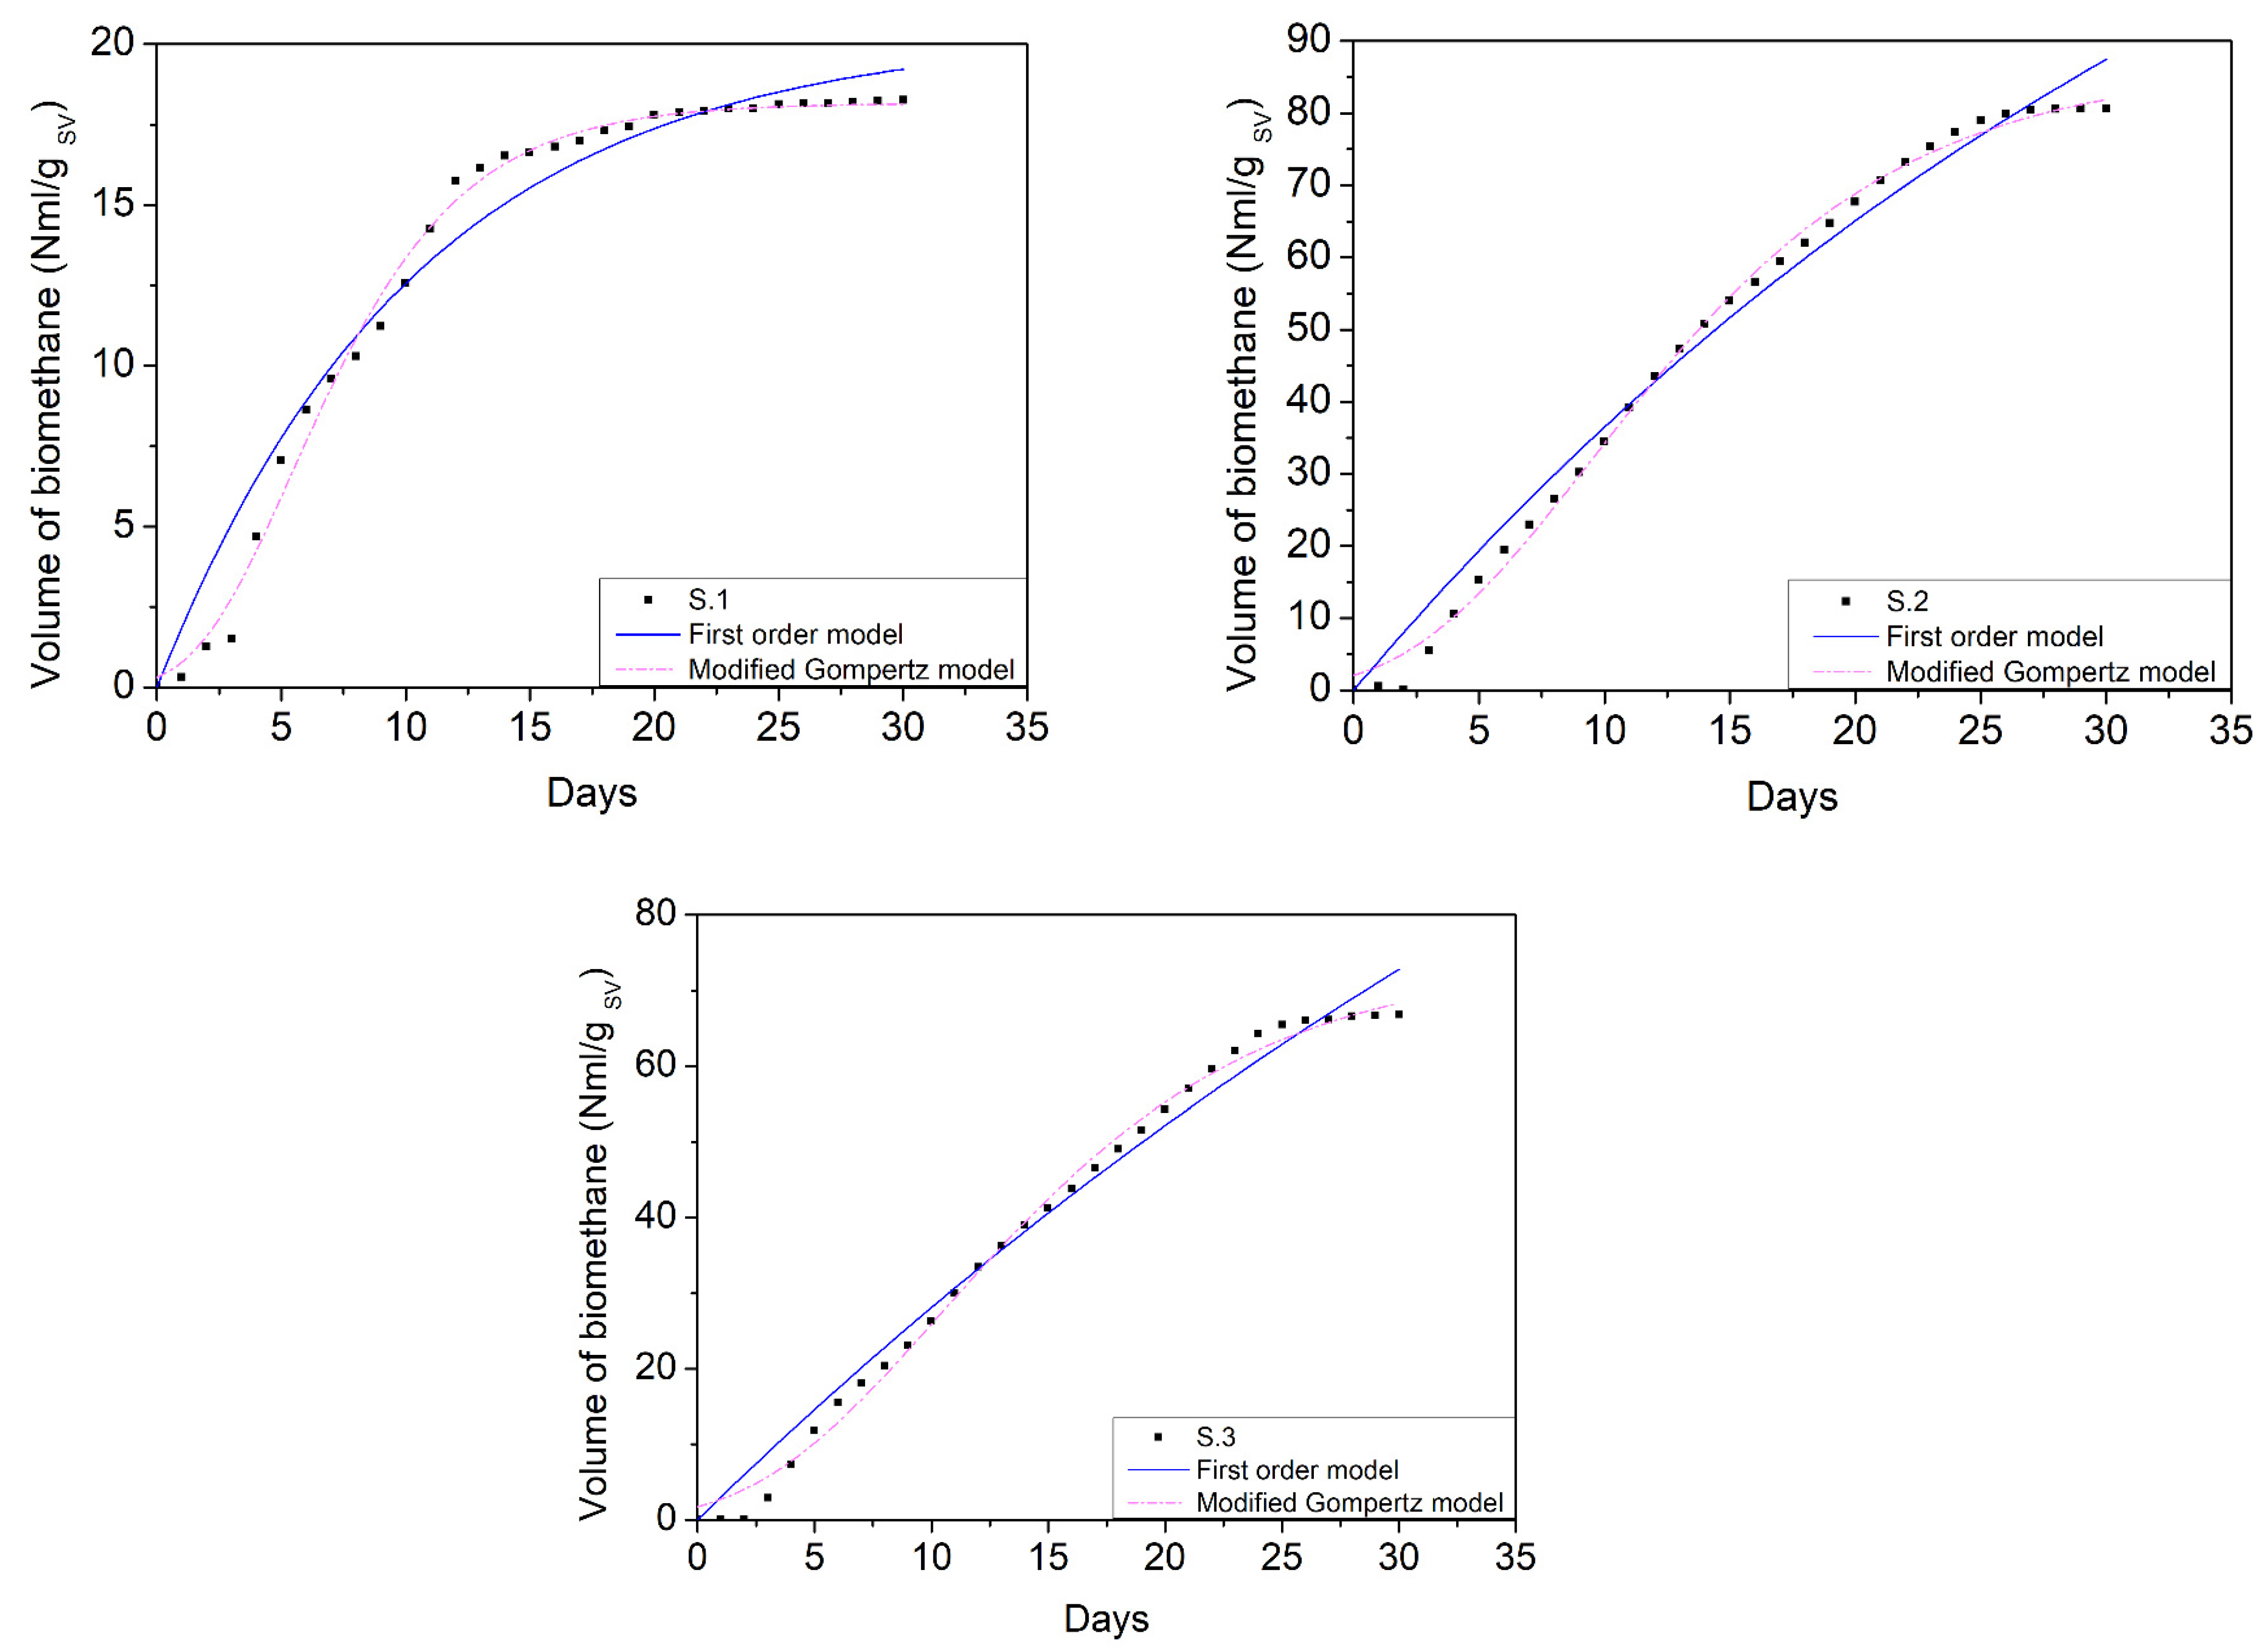
3.4. Biomethanation Kinetics

The parameters from the First kinetic model are shown in Table 4. The parameters from the modified Gompertz model were calculated. The maximum methane yields (Table 5), A (NmL/gVS), are in agreement with the experimental methane yields (Table 2). The methane yield for the crushed biomass (S.2) was higher (p = 0.0114) than that for the milled biomass (S.3). Similarly, the methane production rate, u (NmL/gVS.day), is higher (p < 0.004) after mechanical pretreatment, and the biomass wih smallest particle size (S.3) experienced a reduction in the rate (p = 0.0145) compared to S.2.
The lag phase m, of the chooped biomass (S.1) indicates that less than 3 days are required before the methane production starts. There was not significant difference (p > 0.074) between chopped (S.1) and milled (S.2, S.3) biomass in terms of lag phase. The correlation coefficient (R2) for each experimental unit was above 0.980, indicating that the model fits the experimental data well.
The two kinetic models fit the experimental data well. The modified Gompertz model shows more accurate results, while the first order kinetic model is less accurate in estimation. The difference between the experimental A value and the A value obtained using the modified Gompertz model for system S.1, S.2, S.3 are 0.35%, 6.86%, and 9.24%, respectively. While the differences between the experimental A value and the A value obtained using the first order kinetic model for system S.1, S.2, S.3 are 9.20%, 50.36%, and 61.08%, respectively.
The parameter u (NmL/gVS ·day−1) indicates the maximum biogas production rate that can be obtained in each system. Sample S.2 shows the highest value of parameter u.
The parameter m indicates the period required to start the production of biomethane. Sample S.1 shows a delay period equal to 1.749 days, sample S.2 a delay period equal to 2.322 days while sample S.3 a delay period equal to 2.568 days. For samples characterized by finer particle size the delay time is longer than for sample S.1.
The hydrolysis rate constants (k) of the different sample S.1, S.2, S.3 have been determined from the first-order model and they are equal to 0.107, 0.025 and 0.018 (day−1). The first order kinetic model, as already highlighted in other works, does not fit the data precisely. In fact, according to this model, the greater the k, the faster the degradation. On the other hand, from the results obtained, samples S.2 and S.3 show a higher biomethane yield than sample S.1 which instead shows a higher k value.
The experimental data were fitted with the two models are shown in Figure 5.

3.5. Energy Analysis

Table 6 shows the data obtained from the energy analysis. For crushed sample S.2 it is estimated that it is possible to produce 79.68 NmL/gVS of biomethane and therefore the energy produced is equal to 882.06 kWh. To obtain the particle size desired of sample S.2 (505 µm), the sample was crushed with a mixer. A container with a capacity of 1 L can contain 91.1 g of Sargassum spp. biomass as it is, therefore its density is equal to 91.1 g/L. Considering a mixer with a power of 2200 W and a capacity of 20 L, to blend 1 ton you need to use the blender 555 times for 1 min for a total of 555 min (about 9 h). Therefore, the energy needed to mix 1 ton of Sargassum spp. is equal to 19.8 kWh. The average cost per kWh is $0.18, so the cost of pretreatment amounts to $3.56. For the milling sample S.3 it is estimated that it is possible to produce 65.08 NmL/gVS of biomethane and therefore the energy produced is equal to 720.43 kWh. To obtain the granulometry of sample S.3 (107 µm), the sample was milled with a grinder, in this case it takes twice as long and therefore a consumption of about 39.6 kWh is estimated, therefore the cost of pretreatment amounts to 7.13$. In contrast, sample S.1 was cut with knives, therefore, no mechanical energy was used, it is estimated that it is possible to produce 17.17 NmL/gVS of biomethane and therefore the energy produced is equal to 190.07 kWh.
It can be concluded that if on one hand the pre-treatment involves an energy expenditure, on the other hand it allows to obtain a higher yield and therefore does not negatively affect the energy balance. In particular, for sample S.2 the best results are obtained in terms of yield of biomethane produced and useful energy. Furthermore, as already observed, sample S.3 shows a higher reaction rate than sample S.2. This means that the reaction produces a greater quantity of methane in a shorter time, and therefore also the production cost, in terms of energy, is lower.

4. Conclusions

The effect of the particle size of pelagic Sargassum spp. biomass on the methane production was determined by granulometric analysis. The biomass was mechanically pretreated using three different methods that resulted in chopped, crushed and milled material with particle size of 50,000 µm (S.1), 505 µm (S.2), and 107 µm (S.3). For the crushed and milled samples, a granulometry study was conducted. This study showed how the surface to volume mean, dSV, drops drastically from 86 to 15 µm from sample of size 505 µm to the sample of size 107 µm. The increase of fine particle in solid materials increases the superficial area, but also introduces agglomeration problems. This explains the reduction in biomethane yield of milling sample (65.08 ± 2.18 NmL/gVS) compared to crushed sample (79.68 ± 2.77 NmL/gVS) that has higher particle size. Furthermore, an energy analysis was performed to estimate the optimal particle size reduction considering the methane production and energy demand during mechanical pretreatment. From the energy analysis it emerged that the energy required to reduce 1 ton of Sargassum spp. biomass particle size varies according to the type of mechanical pre-treatment. 19.8 kWh was required to reach a particle size of 505 µm, while 39.6 kWh is needed for a particle size of 107 µm. The energy required to pre-treat the biomass to reach a particle size of 107 µm is 5.5% of the energy produced, however, only 2.2% is needed to reach 505 µm. In conclusion, mechanical pretreatment that generates a Sargassum spp. biomass with particle size below 505 µm does not improve the performance of biomethanation of the material in terms of kinetics and energy expenditure.

Author Contributions

Conceptualization, R.P., Y.A.C. and R.G.; methodology, R.P.; software, R.P.; validation, R.P.; formal analysis, R.P., Y.A.C. and R.G.; investigation, R.P.; data curation, R.P.; writing—original draft preparation, R.P.; review and editing., Y.A.C., J.A.D.F. and V.C. All authors have read and agreed to the published version of the manuscript.

Funding

This research received no external funding.

Institutional Review Board Statement

Not applicable.

Informed Consent Statement

Not applicable.

Data Availability Statement

Data are contained within the article.

Conflicts of Interest

The authors declare no conflict of interest.

References

  1. Wang, M.; Hu, C.; Barnes, B.B.; Mitchum, G.; Lapointe, B.; Montoya, J.P. The great Atlantic Sargassum belt. Science 2019, 364, 83–87. [Google Scholar] [CrossRef]
  2. Trinanes, J.; Putman, N.F.; Goni, G.; Hu, C.; Wang, M. Monitoring pelagic Sargassum inundation potential for coastal communities. J. Oper. Oceanogr. 2021, 16, 48–59. [Google Scholar] [CrossRef]
  3. Robledo, D.; Vázquez-Delfín, E.; Freile-Pelegrín, Y.; Vásquez-Elizondo, R.M.; Qui-Minet, Z.N.; Salazar-Garibay, A. Challenges and Opportunities in Relation to Sargassum Events Along the Caribbean Sea. Front. Mar. Sci. 2021, 8, 699664. [Google Scholar] [CrossRef]
  4. Lopresto, C.G.; Paletta, R.; Filippelli, P.; Galluccio, L.; de la Rosa, C.; Amaro, E.; Jáuregui-Haza, U.; de Frias, J.A. Sargassum Invasion in the Caribbean: An Opportunity for Coastal Communities to Produce Bioenergy Based on Biorefinery—An Overview. Waste Biomass Valorization 2022, 13, 2769–2793. [Google Scholar] [CrossRef]
  5. Optical Oceanography Laboratory—College of Marine Science—University of South Florida. Available online: https://optics.marine.usf.edu/projects/saws.html (accessed on 29 November 2023).
  6. Balboa, E.M.; Moure, A.; Domínguez, H. Valorization of Sargassum muticum biomass according to the biorefinery concept. Mar. Drugs 2015, 13, 3745–3760. [Google Scholar] [CrossRef]
  7. Amador-Castro, F.; García-Cayuela, T.; Alper, H.S.; Rodriguez-Martinez, V.; Carrillo-Nieves, D. Valorization of pelagic sargassum biomass into sustainable applications: Current trends and challenges. J. Environ. Manag. 2021, 283, 112013. [Google Scholar] [CrossRef]
  8. Castro, Y.A.; Rodríguez, A.; Rivera, E. Biomethane production kinetics during the anaerobic co-digestion of Sargassum spp. and food waste using batch and fed-batch systems in Punta Cana, Dominican Republic. Mater. Renew. Sustain. Energy 2022, 11, 287–297. [Google Scholar] [CrossRef]
  9. Casallas-Ojeda, M.R.; Marmolejo-Rebellón, L.F.; Torres-Lozada, P. Identification of Factors and Variables that Influence the Anaerobic Digestion of Municipal Biowaste and Food Waste. Waste Biomass Valorization 2021, 12, 2889–2904. [Google Scholar] [CrossRef]
  10. Paudel, S.R.; Banjara, S.P.; Choi, O.K.; Park, K.Y.; Kim, Y.M.; Lee, J.W. Pretreatment of agricultural biomass for anaerobic digestion: Current state and challenges. Bioresour. Technol. 2017, 245, 1194–1205. [Google Scholar] [CrossRef]
  11. Maneein, S.; Milledge, J.J.; Nielsen, B.V.; Harvey, P.J. A review of seaweed pre-treatment methods for enhanced biofuel production by anaerobic digestion or fermentation. Fermentation 2018, 4, 100. [Google Scholar] [CrossRef]
  12. Izumi, K.; Okishio, Y.K.; Nagao, N.; Niwa, C.; Yamamoto, S.; Toda, T. Effects of particle size on anaerobic digestion of food waste. Int. Biodeterior. Biodegrad. 2010, 64, 601–608. [Google Scholar] [CrossRef]
  13. Zhu, W.; Zhu, J.Y.; Gleisner, R.; Pan, X.J. On energy consumption for size-reduction and yields from subsequent enzymatic saccharification of pretreated lodgepole pine. Bioresour. Technol. 2010, 101, 2782–2792. [Google Scholar] [CrossRef]
  14. Zhang, Y.; Banks, C.J. Impact of different particle size distributions on anaerobic digestion of the organic fraction of municipal solid waste. Waste Manag. 2013, 33, 297–307. [Google Scholar] [CrossRef]
  15. Milledge, J.J.; Harvey, P.J. Ensilage and anaerobic digestion of Sargassum muticum. J. Appl. Phycol. 2016, 28, 3021–3030. [Google Scholar] [CrossRef]
  16. Farghali, M.; AP, Y.; Mohamed, I.M.A.; Iwasaki, M.; Tangtaweewipat, S.; Ihara, I.; Sakai, R.; Umetsu, K. Thermophilic anaerobic digestion of Sargassum fulvellum macroalgae: Biomass valorization and biogas optimization under different pre-treatment conditions. J. Environ. Chem. Eng. 2021, 9, 106405. [Google Scholar] [CrossRef]
  17. Hajji, A.; Rhachi, M. The influence of particle size on the performance of anaerobic digestion of municipal solid waste. Energy Procedia 2013, 36, 515–520. [Google Scholar] [CrossRef]
  18. Mshandete, A.; Björnsson, L.; Kivaisi, A.K.; Rubindamayugi, M.S.T.; Mattiasson, B. Effect of particle size on biogas yield from sisal fibre waste. Renew. Energy 2006, 31, 2385–2392. [Google Scholar] [CrossRef]
  19. Sluiter, A.; Hames, B.; Hyman, D.; Payne, C.; Ruiz, R.; Scarlata, C.; Sluiter, J.; Templeton, D.; Nrel, J.W. Determination of Total Solids in Biomass and Total Dissolved Solids in Liquid Process Samples; National Renewable Energy Laboratory: Golden, CO, USA, 2008; pp. 3–5. [Google Scholar]
  20. Sargassum, M.; Paletta, R.; Candamano, S.; Filippelli, P.; Lopresto, C.G. Influence of Fe2O3 Nanoparticles on the Anaerobic Digestion of Macroalgae Sargassum spp. Processes 2023, 11, 1016. [Google Scholar]
  21. Li, C.; Champagne, P.; Anderson, B.C. Evaluating and modeling biogas production from municipal fat, oil, and grease and synthetic kitchen waste in anaerobic co-digestions. Bioresour. Technol. 2011, 102, 9471–9480. [Google Scholar] [CrossRef]
  22. Gunaseelan, V.N. Biochemical methane potential of fruits and vegetable solid waste feedstocks. Biomass Bioenergy 2004, 26, 389–399. [Google Scholar] [CrossRef]
  23. Zaidi, A.A.; Feng, R.; Malik, A.; Khan, S.Z.; Shi, Y.; Bhutta, A.J.; Shah, A.H. Combining microwave pretreatment with iron oxide nanoparticles enhanced biogas and hydrogen yield from green algae. Processes 2019, 7, 24. [Google Scholar] [CrossRef]
  24. Ap, Y.; Farghali, M.; Mohamed, I.M.A.; Iwasaki, M.; Tangtaweewipat, S.; Ihara, I.; Sakai, R.; Umetsu, K. Potential of biogas production from the anaerobic digestion of Sargassum fulvellum macroalgae: Influences of mechanical, chemical, and biological pretreatments. Biochem. Eng. J. 2021, 175, 108140. [Google Scholar] [CrossRef]
  25. Schmidt, C.G.; Furlong, E.B. Effect of particle size and ammonium sulfate concentration on rice bran fermentation with the fungus Rhizopus oryzae. Bioresour. Technol. 2012, 123, 36–41. [Google Scholar] [CrossRef]
  26. Zheng, H.; Yin, J.; Gao, Z.; Huang, H.; Ji, X.; Dou, C. Disruption of chlorella vulgaris cells for the release of biodiesel-producing lipids: A comparison of grinding, ultrasonication, bead milling, enzymatic lysis, and microwaves. Appl. Biochem. Biotechnol. 2011, 164, 1215–1224. [Google Scholar] [CrossRef]
  27. Montingelli, M.E.; Benyounis, K.Y.; Quilty, B.; Stokes, J.; Olabi, A.G. Influence of mechanical pretreatment and organic concentration of Irish brown seaweed for methane production. Energy 2017, 118, 1079–1089. [Google Scholar] [CrossRef]
  28. Pastare, L.; Aleksandrovs, I.; Lauka, D.; Romagnoli, F. Mechanical Pre-treatment Effect on Biological Methane Potential from Marine Macro Algae: Results from Batch Tests of Fucus Vesiculosus. Energy Procedia 2016, 95, 351–357. [Google Scholar] [CrossRef]
  29. Vanegas, C.; Bartlett, J. Anaerobic digestion of laminaria digitata: The effect of temperature on biogas production and composition. Waste Biomass Valorization 2013, 4, 509–515. [Google Scholar] [CrossRef]
  30. Zhang, Y.; Alam, M.A.; Kong, X.; Wang, Z.; Li, L.; Sun, Y.; Yuan, Z. Effect of salinity on the microbial community and performance on anaerobic digestion of marine macroalgae. J. Chem. Technol. Biotechnol. 2017, 92, 2392–2399. [Google Scholar] [CrossRef]
  31. Nielsen, H.B.; Heiske, S. Anaerobic digestion of macroalgae: Methane potentials, pre-treatment, inhibition and co-digestion. Water Sci. Technol. 2011, 64, 1723–1729. [Google Scholar] [CrossRef]
  32. Bruhn, A.; Dahl, J.; Nielsen, H.B.; Nikolaisen, L.; Rasmussen, M.B.; Markager, S.; Olesen, B.; Arias, C.; Jensen, P.D. Bioenergy potential of Ulva lactuca: Biomass yield, methane production and combustion. Bioresour. Technol. 2011, 102, 2595–2604. [Google Scholar] [CrossRef]
Figure 1. Sargassum spp. biomass at different particle sizes due to mechanical pretreatment, (a) Chopped (S.1 > 50,000 µm), (b) crushed (S.2 = 505 µm), and (c) milled (S.3 = 107 µm).
Methane 03 00010 g001
Figure 2. Comparison of the granulometric distributions of the mechanically pretreated Sargassum spp. biomass with particle sizes of 505 µm (S.2) and 107 µm (S.3) analyzed by laser diffraction: (a) differential curve, (b) cumulative curve.
Methane 03 00010 g002
Figure 3. Comparison of the granulometric distributions of the mechanically pretreated Sargassum spp. biomass with particle sizes of 505 µm (S.2) and 107 µm (S.3) analyzed by laser diffraction: histogram of the discrete frequency distribution.
Methane 03 00010 g003
Figure 4. Average production of cumulative net volume of biomethane (NmL/gVS) during AD for chopped (S.1), crushed (S.2) and, milled (S.3) samples.
Methane 03 00010 g004
Figure 5. Experimental data fitted by the First order kinetic model and the modified Gompertz kinetic model for the chopped (S.1), crushed (S.2), and milled (S.3) samples.
Methane 03 00010 g005
Table 1. Comparision of the characteristics of Sargassum spp. at different particle sizes. Values shown on dried wight basis.
Site and Year of CollectionParticle SizeVolatile Solids (%)Ash Content (%)References
Punta Cana (2019)107 µm46.4729.69This work
Punta Cana (2019)505 µm50.5230.87This work
Indonesia (2021)106 µm–4.75 mm46.1435.05[24]
Indonesia (2021)75–850 µm55.8331.72[24]
Table 2. Granulometric analysis and biomethanation of Sargassum spp. at different particle sizes due to mechanical pretreatment.
Granulometric Analysis
PretreatmentSpan [-]dSV [µm]dV [µm]Methane Yield
(NmL/gVS)
Chopped (S.1)--50,000.0 ± 0.5 17.17 ± 2.14
Crushed (S.2)2.08886.0 ± 0.1505.0 ± 0.1 79.68 ± 2.77
Milled (S.3)7.73015.0 ± 0.1 107.0 ± 0.165.08 ± 2.18
Table 3. Effect of mechanical pretreatment on different types of biomass.
SampleTemperature (°C)Time (days)PretreatmentMethane Yield (LCH4kgVS−1)References
Macroalgae
Ascophyllum nodosum3814Cutting169[27]
Fucus vesiculosus 25Unwashed, chopping120[28]
Fucus vesiculosus 25Washed, chopping134[28]
Laminaria digitata2054Drying (75 °C), milling111[29]
Laminaria Japonica3575Washing, drying (60 °C), milling267.5[30]
Ulva lactuca5334Washing, chopping152[31]
Ulva lactuca5542Chopping174[32]
Other biomass
Municipal solid waste4021Particles size reduction (10 mm in diameter)818 (biogas)[17]
Municipal solid waste4021Particles size reduction (100 mm in diameter)654 (biogas)[17]
Sisal fibre waste 3365Grinding (particle size 2 mm)216[12]
Sisal fibre waste3365Grinding (particle size 5 mm)205[12]
Sisal fibre waste3365Grinding (particle size 10 mm)203[12]
Sisal fibre waste3365Grinding
(particle size 50 mm)
192[12]
Sisal fibre waste3365Grinding
(particle size 100 mm)
178[12]
Table 4. Kinetic parameters of the First kinetic model.
PretreatmentA (NmL/gVS)k (Day−1)R2
Chopped (S.1)18.9190.1070.951
Crushed (S.2)160.5290.0250.982
Milled (S.3)167.2480.0180.981
Table 5. Kinetic parameters of the Modified Gompertz model.
PretreatmentA (NmL/gVS)u (NmL/gVS.Day)m (Day)R2
Chopped (S.1)17.677 a1.75 a1.570.988
Crushed (S.2)86.085 b4.495 b2.3150.996
Milled (S.3)72.823 c3.526 c2.5730.993
The different letters within the column means there is a significant difference between the values at the 0.05 level using unpaired t-test.
Table 6. Energy analysis parameters. BMP (Nm3/t) is the biochemical methane potential, Ep (kWh) is the energy produced, Ec (kWh) is the energy consumed, and Ed (kWh), is the difference between Ep and Ec.
Pre-TreatmentBMP (Nm3/t)Ep (kWh)Ec (kWh)Ed = Ep − Ec
Chopped (S.1)17.17190.07-190.07
Crushed (S.2)79.68882.0619.8862.26
Milled (S.3)65.08720.4339.6680.83
Disclaimer/Publisher’s Note: The statements, opinions and data contained in all publications are solely those of the individual author(s) and contributor(s) and not of MDPI and/or the editor(s). MDPI and/or the editor(s) disclaim responsibility for any injury to people or property resulting from any ideas, methods, instructions or products referred to in the content.

