Abstract
Soil salinity is an essential constraint on sustainable crop production, particularly in arid and semi-arid regions, due to its effects on soil fertility. This study presents a data-driven approach for mapping soil salinity by integrating field-based electrical conductivity (EC) measurements with remote sensing and geospatial analysis in the district of Mandi Baha Uddin, Pakistan. Eleven georeferenced soil samples were collected and analyzed for EC (range: 0.59–1.06 dS/m), serving as training data for model calibration. Using Landsat 8 Surface Reflectance imagery within Google Earth Engine, spectral indices Normalized Difference Salinity Index (NDSI), Salinity Index (SI), and Brightness Index (BI) were extracted. Among various modeling approaches, a linear regression model was applied to these indices, revealing NDSI as the most significant predictor (coefficient = 12.938), while SI and BI show negligible contribution. The model achieved moderate accuracy (R2 = 0.566, RMSE = 0.085 dS/m). A Random Forest approach yielded higher training accuracy (R2 = 0.841) but suffered from overfitting during cross-validation, indicating limited sample size constraints. The regression equation (EC = 12.938 × NDSI + 5.864) was applied in GEE to generate the EC prediction map. The resulting 30 m resolution EC map was classified into salinity categories and validated through independent field observations. This framework highlights the effectiveness of using freely available satellite data and cloud-based platforms like GEE for cost-effective soil salinity monitoring. The study provides a transferable methodology for precision agriculture, enabling informed land management and crop planning in salinity-affected regions.
1. Introduction
Soil salinity is a common issue in arid and semi-arid regions worldwide, which affects soil fertility and agricultural productivity [1]. Salinity arises from both natural processes, such as high evaporation rates, and anthropogenic activities, including improper irrigation practices and poor drainage systems [2]. The Food and Agriculture Organization (FAO) estimates that approximately 20% of the world’s irrigated land is affected by salinity, with regions in South Asia and the Middle East experiencing significant challenges [3]. In Pakistan, soil salinity is a significant concern, particularly in regions such as Mandi Baha Uddin, where crop yields are limited by varying salinity levels.
Traditional methods, such as field surveys and laboratory analysis, for monitoring soil salinity are time-consuming and have limited spatial coverage [4]. On the other hand, remote sensing provides an efficient, cost-effective, and spatially continuous approach for mapping soil salinity [5]. Satellite-based sensors, such as Landsat 8 and Sentinel-2, have been widely used in soil salinity studies due to their ability to provide high-resolution, multi-spectral data at regular intervals [6].
Recent literature has extensively explored the integration of multispectral remote sensing data with machine learning (ML) algorithms to enhance the accuracy of soil salinity mapping [7,8]. Studies confirm that using spectral bands in the visible-to-shortwave infrared regions (VIS-SWIRs) is vital for detecting whitish salt crusts on bare soil surfaces [7]. Various spectral indices (SIs) have been developed, with some studies finding moderate success using simple linear regression (R2 ~ 0.5–0.7), while others using robust ML models like Random Forest (RF) or Support Vector Machines (SVM) have reported much higher R2 values, sometimes exceeding 0.90, particularly when vegetation indices or multi-source data are included [9,10].
However, the optimal approach remains context-dependent, as model performance is highly sensitive to the specific conditions of the study area (e.g., soil type, vegetation cover) and the size of the ground-truth dataset [11]. For instance, complex models like RF or Deep Learning often demonstrate high training accuracy but can suffer from overfitting and struggle to generalize with limited field samples (N < 100), a common constraint in developing regions [12]. Despite these advancements, the integration of specific spectral indices (like NDSI, SI, and BI) within standard ML frameworks has not been sufficiently explored or standardized in regions such as Mandi Baha Uddin, Pakistan, where salinity is a significant agricultural challenge.
This research addresses the gap by evaluating the effectiveness of machine learning algorithms for predicting soil salinity and improving mapping accuracy. The objectives of this study are as follows: (a) to generate high-resolution soil salinity maps for the Mandi Baha Uddin region, and (b) to compare the effectiveness of different spectral indices (NDSI, SI, and BI) in predicting soil electrical conductivity (EC). The findings of this study offer insights for land management and precision agriculture by providing a validated, context-specific methodology for salinity monitoring.
2. Methodology
2.1. Study Area
The study was conducted in District Mandi Bahauddin, located in the central Punjab Province of Pakistan, between 32°10′–32°40′ N latitude and 73°00′–73°50′ E longitude, covering an area of approximately 2673 km2 (Figure 1). The Jhelum River bounds the district to the northwest and the Chenab River to the southeast, both of which strongly influence the region’s hydrology and soil characteristics. The area represents a flat alluvial plain formed by fluvial deposits of the Jhelum and Chenab Rivers. The soils are primarily composed of clay, loam, and clayey loam, with local variations including sandy loam and silt [13]. Due to its semi-arid climate and extensive irrigation practices, the district faces issues of waterlogging and soil salinity, particularly in low-lying or poorly drained areas. Agriculture is the primary land use, with major crops including wheat, rice, sugarcane, and vegetables [14].
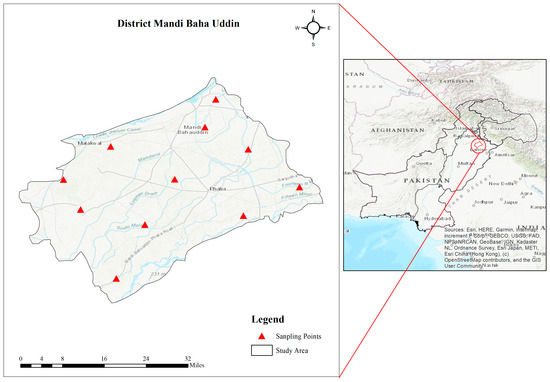
Figure 1.
Study Area Map of Mandi Bahauddin.
2.2. Data Collection
2.2.1. Field Data
Eleven georeferenced soil samples were collected from various locations within Mandi Baha Uddin. The coordinates of each sample were recorded using a high-precision GPS device (Garmin eTrex 10, Garmin Ltd., Olathe, KS, USA). Electrical conductivity (EC) was measured in the laboratory using a 1:2.5 soil-to-water ratio soil solution, and after 24 h, the EC was measured by the EC meter (EC510T, REX, Shanghai, China), yielding EC values ranging from 0.59 to 1.06 dS/m. These field EC measurements served as the target variable for training the machine learning models.
2.2.2. Remote Sensing Data
Satellite imagery from Landsat 8 was obtained to derive spectral indices for soil salinity mapping. The Landsat 8 imagery, which offers 30 m spatial resolution and multi-spectral data, was selected for the period from 1 November 2023 to 30 March 2024. The spectral bands Blue, Red, and Near-Infrared (NIR) were used to calculate the soil salinity spectral indices, including the Normalized Difference Salinity Index (NDSI), Salinity Index (SI), and Brightness Index (BI).
2.3. Image Processing
Satellite images were processed using Google Earth Engine (GEE), a cloud-based geospatial analysis platform. During this phase, the cloud-masking algorithm was first applied to remove pixels affected by cloud contamination. Then, multiple satellite images from the defined period were mosaiced to generate a seamless composite, filling any gap caused by cloud cover or other issues [15]. Ultimately, the processed imagery was clipped to the study area to apply the analysis to the area of interest.
2.4. Spectral Index Calculations
2.4.1. Brightness Index (BI)
BI is a general measure used to assess the overall brightness or the average level of reflectance of a surface. It is highly correlated with soil properties such as moisture content, organic matter, texture, and salinity (Figure 2a). Brighter surfaces (like dry, salt-affected bare soil) have higher BI values. It is calculated by Equation (1) [16].
where R is reflectance in Red and G is reflectance in Green.
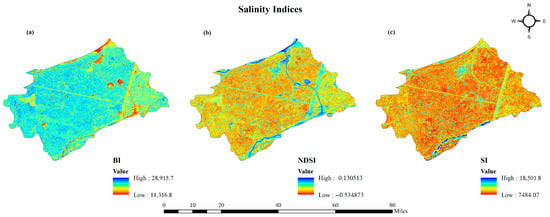
Figure 2.
Satellite-based salinity indices (a) Brightness Index (BI), (b) Normalized Difference Salinity Index (NDSI), and (c) Salinity Index (SI).
2.4.2. Normalized Difference Salinity Index (NDSI)
NDSI is a remote sensing index used to detect and map salt-affected soils. It uses the difference and sums of specific spectral bands to normalize for variations in illumination and atmospheric effects, producing a value typically ranging from −1 to +1 (Figure 2b). Values approaching +1 are generally associated with high soil salinity, and it is calculated by Equation (2) [17].
where R is reflectance in Red and NIR is reflectance in Near-Infrared.
2.4.3. Salinity Index (SI)
SI is a measure used to assess soil salinity levels based on the direct relationship between specific spectral bands and the properties of surface soil salts (Figure 2c). It is calculated by Equation (3) [18].
where R is reflectance in Red and G is reflectance in Green.
2.5. Machine Learning Model Development
2.5.1. Linear Regression
A linear regression model was developed to predict soil EC based on the derived spectral indices [19]. Equation (4) represented the regression model:
is the intercept; , , and are the model coefficients determined through training.
2.5.2. Random Forest
Random Forest algorithm was employed to model the relationship between satellite-derived indices (NDSI, SI, BI) and soil Electrical Conductivity (EC). Random Forest is an ensemble learning technique that constructs multiple decision trees and combines their predictions to improve accuracy and reduce overfitting. Each tree is built using a random subset of the data, and the final prediction is obtained by averaging the outputs of all individual trees (for regression tasks) [20]. This method is particularly well-suited for capturing complex, non-linear relationships in the data. The model’s performance was evaluated using the R2 metric, which indicated the proportion of variance in EC explained by the model.
2.6. EC Mapping
The machine learning models were applied to the entire study area to generate predicted EC maps. The EC values were classified into FAO salinity categories (Table 1) (non-saline, mildly saline, moderately saline, and highly saline) [21]. The methodological flowchart (Figure 3) shows the key steps of the study.

Table 1.
FAO (USDA) Classification for soil salinity assessment.
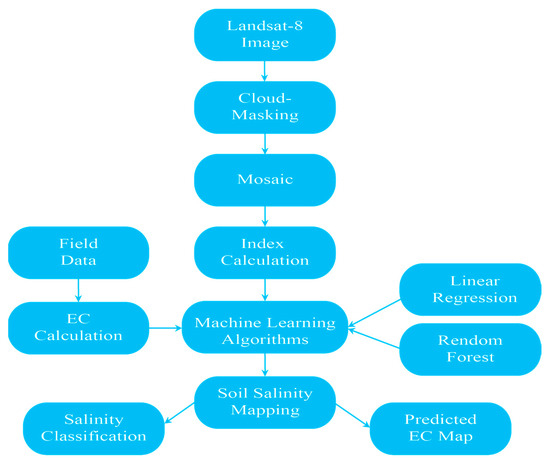
Figure 3.
Flow chart of the methodology for soil salinity mapping.
3. Results and Discussion
The linear regression model achieved moderate performance, with an R2 of 0.566 and RMSE of 0.085 dS/m. The model gives the intercept value of 5.864, and NDSI had a strong positive coefficient (), suggesting that the EC has a direct relationship with the NDSI. Coefficients of SI () and BI () showing that these indices contribute less. Among the spectral indices tested, NDSI was found to be the most effective predictor of soil EC. The correlation matrix (Figure 4) showed a strong positive relationship of 0.68 between NDSI and EC, while SI and BI had weaker correlations. This confirms that NDSI is the most reliable index for soil salinity mapping in the study area.
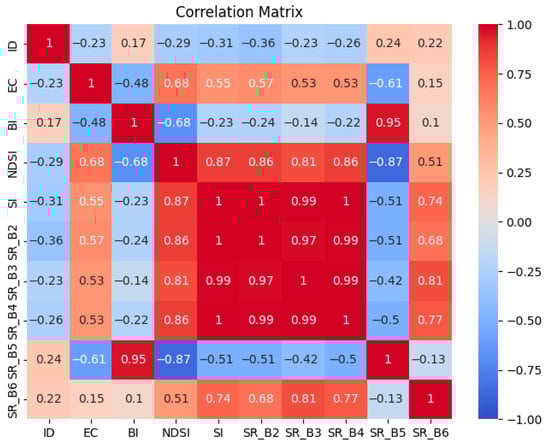
Figure 4.
Correlation Matrix showing the relation of salinity indices and spectral bands with EC.
Model accuracy was primarily assessed using the R2 and RMSE metrics derived from a hold-out validation dataset. Quality control involved standard data cleaning protocols, ensuring all input data points were georeferenced correctly and matched with the corresponding satellite imagery pixels.
The moderate R2 value of 0.566 is consistent with findings from similar remote sensing-based soil salinity studies, where R2 values typically range from 0.4 to 0.7 due to natural soil variability and the complex interaction of environmental factors [8,9]. This suggests that approximately 56.6% of the EC variability is explained by NDSI within our model.
Although the Random Forest approach yielded high training accuracy (R2 = 0.811), overfitting was observed during cross-validation (Figure 5), indicating that the model performed well on the training data but struggled to generalize to new, unseen data. This highlights a common challenge with complex machine learning models when sample sizes (N = 11) are limited [22]. Increasing the sample size and refining cross-validation techniques could mitigate this issue, as explained in the study [11]. The performance of Random Forest and linear regression models underscores the importance of selecting the most suitable algorithm for soil salinity mapping.
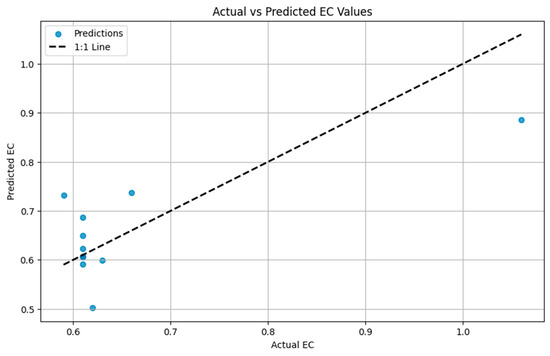
Figure 5.
Cross-validation of model-predicted EC values with actual EC values.
The spectral indices NDSI, SI, and BI were selected based on established literature indicating their sensitivity to soil properties affected by salinity. Salinity changes soil moisture, mineral composition, and surface reflectance, particularly in the shortwave infrared and near-infrared regions, which these indices utilize [7,12].
The modeling approach utilizes openly available Landsat data and the Google Earth Engine (GEE) platform, ensuring high reproducibility and offering advantages over intensive fieldwork for large areas [23]. The samples (N = 11) were collected during the dry season to minimize seasonal moisture variability. The frequency of data collection (one-time field sampling) and imagery (single composite image) provides a reliable snapshot of the study period. Future studies could use time-series data to evaluate seasonal variations in salinity.
The LR model is simple and highly applicable for local management decisions, generating a high-resolution soil salinity map. Its primary limitation is the R2 value of below 0.60, suggesting that other factors also influence soil EC. The RF model’s limitation was overfitting, which can be mitigated by using a larger sample size.
The regression equation (EC = 12.938 × NDSI + 5.864) was applied in GEE to generate the EC prediction map, which showed significant spatial variability in soil salinity (Figure 6a). These maps were classified into FAO salinity categories (Table 1) [21]. The classified map provides insight into the areas most affected by salinity (Figure 6b). The high-resolution salinity maps generated in this study can help farmers and land managers identify salinity-prone areas, enabling them to make informed decisions about irrigation practices, crop selection, and soil management.
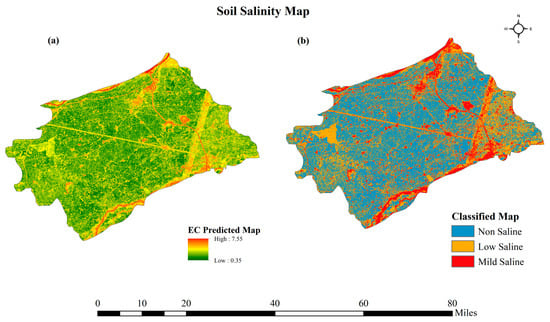
Figure 6.
Soil salinity map: (a) EC predicted map and (b) classified map.
4. Conclusions
This study demonstrates the potential of integrating Landsat-8 imagery and machine learning algorithms for soil salinity mapping in Mandi Baha Uddin, Pakistan. NDSI emerged as the most effective spectral index for predicting soil EC, and the Random Forest model provided the most accurate predictions. However, overfitting in the Random Forest model suggests the need for further refinement through larger datasets and improved validation techniques. The methodology presented here is scalable and offers a cost-effective solution for monitoring soil salinity, with potential applications in precision agriculture and sustainable land management in regions facing similar salinity challenges. Future research could explore the use of higher-resolution satellite data, such as Sentinel-2 imagery, and incorporate additional environmental variables to enhance the accuracy of soil salinity predictions.
Author Contributions
Conceptualization, S.U.R., Z.M., T.C. and M.A.S.; methodology, S.U.R., T.C. and M.A.S.; formal analysis, Z.M.; data curation, S.U.R., Z.M., T.C. and M.A.S.; writing—original draft preparation, S.U.R.; writing—review and editing, Z.M., T.C. and M.A.S.; supervision, Z.M. All authors have read and agreed to the published version of the manuscript.
Funding
This research received no external funding.
Institutional Review Board Statement
Not applicable.
Informed Consent Statement
Not applicable.
Data Availability Statement
The data that support the findings of this study are available from the corresponding author upon reasonable request.
Conflicts of Interest
Author Zahid Maqbol is employed by the company Fauji Fertilizer Company Limited (FFCL). The remaining authors declare that the research was conducted in the absence of any commercial or financial relationships that could be construed as a potential conflict of interest.
References
- Daba, A.W.; Qureshi, A.S. Review of Soil Salinity and Sodicity Challenges to Crop Production in the Lowland Irrigated Areas of Ethiopia and Its Management Strategies. Land 2021, 10, 1377. [Google Scholar] [CrossRef]
- Choukr-Allah, R. Use and management of saline water for irrigation in the Near East and North Africa (NENA) region. In Future of Sustainable Agriculture in Saline Environments; CRC Press: Boca Raton, FL, USA, 2021; pp. 51–70. [Google Scholar]
- Aryal, J.P.; Lopez-Lavalle, L.A.B.; El-Naggar, A.H. Crop Loss Due to Soil Salinity and Agricultural Adaptations to It in the Middle East and North Africa Region. Resources 2025, 14, 139. [Google Scholar] [CrossRef]
- Sahbeni, G.; Ngabire, M.; Musyimi, P.K.; Székely, B. Challenges and Opportunities in Remote Sensing for Soil Salinization Mapping and Monitoring: A Review. Remote Sens. 2023, 15, 2540. [Google Scholar] [CrossRef]
- Gojiya, K.M.; Rank, H.D.; Chauhan, P.M.; Patel, D.V.; Satasiya, R.M.; Prajapati, G.V. Remote Sensing and GIS Applications in Soil Salinity Analysis: A Comprehensive Review. Int. J. Environ. Clim. Change 2023, 13, 2149–2161. [Google Scholar] [CrossRef]
- Wang, F.; Han, L.; Liu, L.; Bai, C.; Ao, J.; Hu, H.; Li, R.; Li, X.; Guo, X.; Wei, Y. Advancements and Perspective in the Quantitative Assessment of Soil Salinity Utilizing Remote Sensing and Machine Learning Algorithms: A Review. Remote Sens. 2024, 16, 4812. [Google Scholar] [CrossRef]
- Allbed, A.; Kumar, L. Soil Salinity Mapping and Monitoring in Arid and Semi-Arid Regions Using Remote Sensing Technology: A Review. Adv. Remote Sens. 2013, 2, 373–385. [Google Scholar] [CrossRef]
- Peng, J.; Biswas, A.; Jiang, Q.; Zhao, R.; Hu, J.; Hu, B.; Shi, Z. Estimating soil salinity from remote sensing and terrain data in southern Xinjiang Province, China. Geoderma 2019, 337, 1309–1319. [Google Scholar] [CrossRef]
- Hihi, S.; Ben Rabah, Z.; Bouaziz, M.; Chtourou, M.Y.; Bouaziz, S. Prediction of Soil Salinity Using Remote Sensing Tools and Linear Regression Model. Adv. Remote Sens. 2019, 8, 77–88. [Google Scholar] [CrossRef]
- Sahbeni, G. Soil salinity mapping using Landsat 8 OLI data and regression modeling in the Great Hungarian Plain. SN Appl. Sci. 2021, 3, 587. [Google Scholar] [CrossRef]
- Dash, P.K.; Ferhatoglu, C.; Miller, B.A.; Panigrahi, N.; Mishra, A. Influence of sample size and machine learning algorithms on digital soil nutrient mapping accuracy. Environ. Monit. Assess. 2025, 197, 996. [Google Scholar] [CrossRef]
- Metternicht, G.I.; Zinck, J.A. Remote sensing of soil salinity: Potentials and constraints. Remote Sens. Environ. 2003, 85, 1–20. [Google Scholar] [CrossRef]
- Jamil, M.D.; Waheed, M.; Akhtar, S.; Bangash, N.; Chaudhari, S.K.; Majeed, M.; Hussain, M.; Ali, K.; Jones, D.A. Invasive Plants Diversity, Ecological Status, and Distribution Pattern in Relation to Edaphic Factors in Different Habitat Types of District Mandi Bahauddin, Punjab, Pakistan. Sustainability 2022, 14, 13312. [Google Scholar] [CrossRef]
- Ullah, F.; Su, L.-J.; Ullah, H.; Asghar, A. Estimation of hydraulic parameters of an unconfined aquifer by using geoelectrical and pumping test data: A case study of the Mandi Bahauddin District, Pakistan. Arab. J. Geosci. 2020, 13, 484. [Google Scholar] [CrossRef]
- Haq, Y.U.; Shahbaz, M.; Asif, H.M.S.; Al-Laith, A.; Alsabban, W.H. Spatial Mapping of Soil Salinity Using Machine Learning and Remote Sensing in Kot Addu, Pakistan. Sustainability 2023, 15, 12943. [Google Scholar] [CrossRef]
- Aksoy, S.; Yildirim, A.; Gorji, T.; Hamzehpour, N.; Tanik, A.; Sertel, E. Assessing the performance of machine learning algorithms for soil salinity mapping in Google Earth Engine platform using Sentinel-2A and Landsat-8 OLI data. Adv. Space Res. 2022, 69, 1072–1086. [Google Scholar] [CrossRef]
- Gerardo, R.; de Lima, I.P. Sentinel-2 Satellite Imagery-Based Assessment of Soil Salinity in Irrigated Rice Fields in Portugal. Agriculture 2022, 12, 1490. [Google Scholar] [CrossRef]
- Mondal, I.; Hossain, S.A.; Das, A.; Jose, F.; Altuwaijri, H.A.; Juliev, M. Exploring ML-Driven Insights on the Impact of Rising Soil Salinity on Sundarbans Mangrove Ecosystems and Ecological Sustainability Through Nature-Based Solutions. Land Degrad. Dev. 2025. [Google Scholar] [CrossRef]
- Jia, P.; Zhang, J.; He, W.; Hu, Y.; Zeng, R.; Zamanian, K.; Jia, K.; Zhao, X. Combination of Hyperspectral and Machine Learning to Invert Soil Electrical Conductivity. Remote Sens. 2022, 14, 2602. [Google Scholar] [CrossRef]
- Han, Y.; Ge, H.; Xu, Y.; Zhuang, L.; Wang, F.; Gu, Q.; Li, X. Estimating soil salinity using multiple spectral indexes and machine learning algorithm in Songnen Plain, China. IEEE J. Sel. Top. Appl. Earth Obs. Remote Sens. 2023, 16, 7041–7050. [Google Scholar] [CrossRef]
- Elshewy, M.A.; Mohamed, M.H.A.; Refaat, M. Developing a Soil Salinity Model from Landsat 8 Satellite Bands Based on Advanced Machine Learning Algorithms. J. Indian Soc. Remote Sens. 2024, 52, 617–632. [Google Scholar] [CrossRef]
- Sirpa-Poma, J.W.; Satgé, F.; Resongles, E.; Pillco-Zolá, R.; Molina-Carpio, J.; Colque, M.G.F.; Ormachea, M.; Mollinedo, P.P.; Bonnet, M.-P. Towards the Improvement of Soil Salinity Mapping in a Data-Scarce Context Using Sentinel-2 Images in Machine-Learning Models. Sensors 2023, 23, 9328. [Google Scholar] [CrossRef] [PubMed]
- Gorelick, N.; Hancher, M.; Dixon, M.; Ilyushchenko, S.; Thau, D.; Moore, R. Google Earth Engine: Planetary-scale geospatial analysis for everyone. Remote Sens. Environ. 2017, 202, 18–27. [Google Scholar] [CrossRef]


Disclaimer/Publisher’s Note: The statements, opinions and data contained in all publications are solely those of the individual author(s) and contributor(s) and not of MDPI and/or the editor(s). MDPI and/or the editor(s) disclaim responsibility for any injury to people or property resulting from any ideas, methods, instructions or products referred to in the content. |
© 2025 by the authors. Licensee MDPI, Basel, Switzerland. This article is an open access article distributed under the terms and conditions of the Creative Commons Attribution (CC BY) license (https://creativecommons.org/licenses/by/4.0/).